
MA Official
6 Posts

MA Official
Report
Block User
Open Trade
Occasional Trader
4.6 Years
8 Following
1 Followers
2 Liked
Posts
Portfolio
·
--
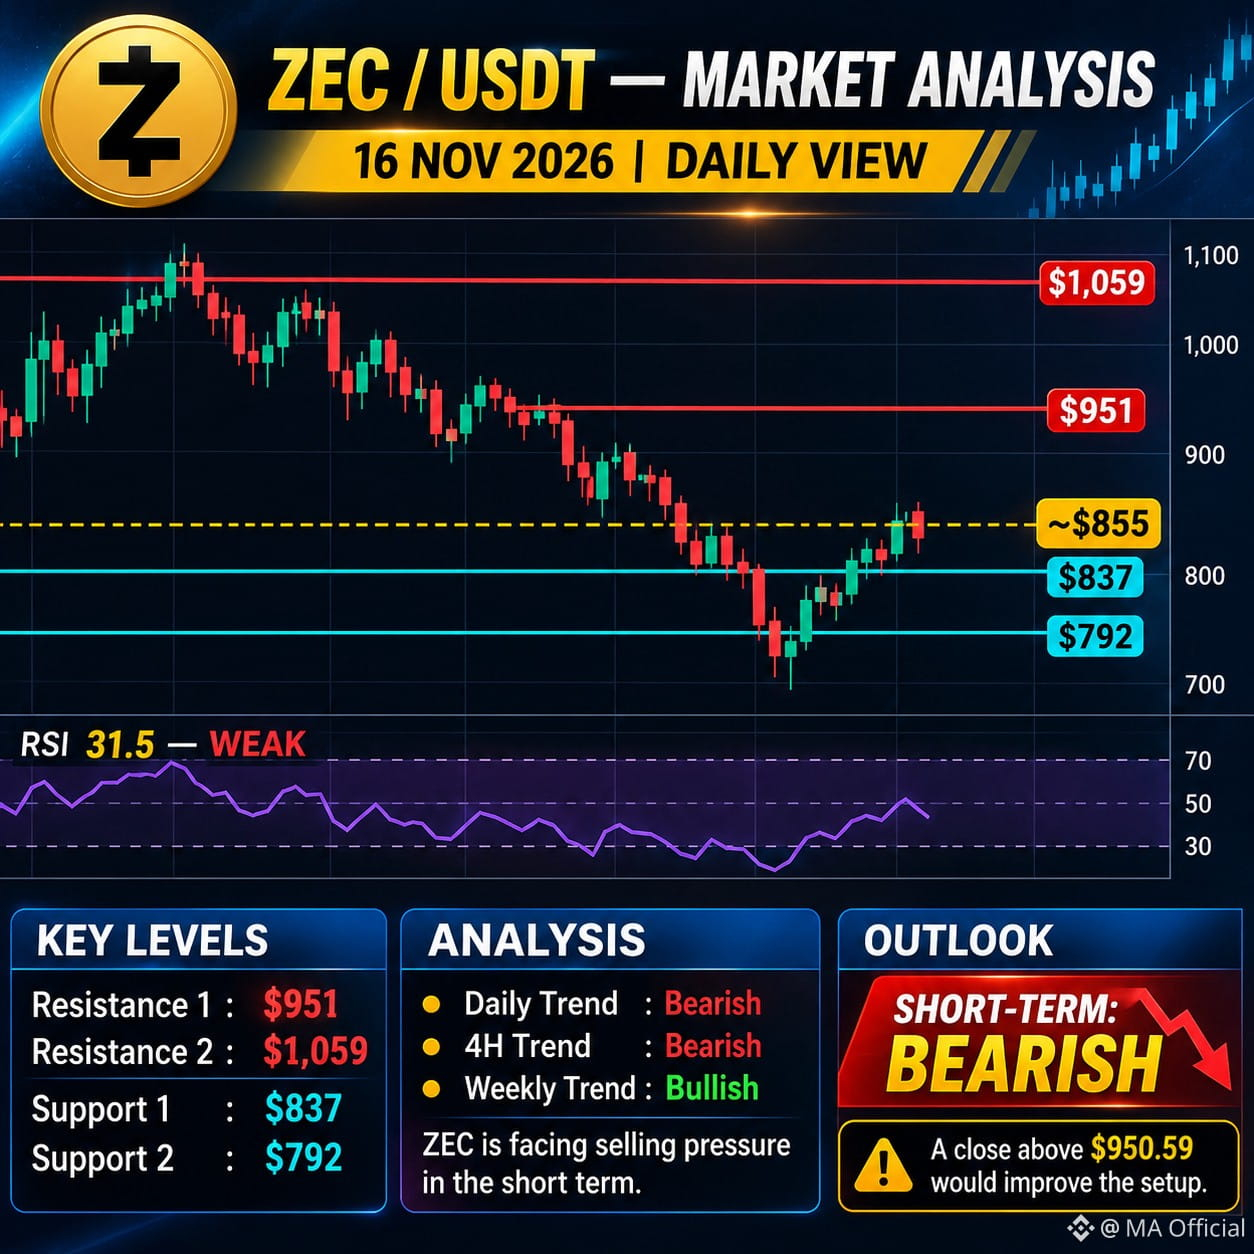
$ZEC (Zcash) is a privacy-focused cryptocurrency. Its price action can offer strong trading opportunities, but traders should watch key support, resistance, volume, and Bitcoin's market direction.
The analysis below is for educational purposes, not a guaranteed trading signal.
ZEC/USDT Technical Levels
~$855
Indicator Reading
RSI (14)
31.5 – Weak
Daily trend Bearish
4H trend Bearish
Weekly trend Bullish
Key support
S1: $837
S2: $792
Key resistance
R1: $951
R2: $1,059
Trading outlook
Bearish scenario: A break below $837 may expose $792.
Bullish scenario: A strong close above $951 could signal recovery toward $1,059.
RSI: Near oversold territory, so a relief bounce is possible, but reversal is not confirmed.
My view: Avoid chasing entries. Wait for confirmation around $837 support or a breakout above $951.
#AnthropicIPOTestsInvestorAppetiteForAI #BitcoinExtendsLosingStreakToSixWeeks #HuangReportedlyConsidersReturnToNvidia #SP500AndNasdaqFuturesHitQuarterlyLows #MUFGSMFGMizuhoPlanYenBackedStablecoin
{spot}(ZECUSDT)
$ZEC (Zcash) is a privacy-focused cryptocurrency. Its price action can offer strong trading opportunities, but traders should watch key support, resistance, volume, and Bitcoin's market direction.
The analysis below is for educational purposes, not a guaranteed trading signal.
ZEC/USDT Technical Levels
~$855
Indicator Reading
RSI (14)
31.5 – Weak
Daily trend Bearish
4H trend Bearish
Weekly trend Bullish
Key support
S1: $837
S2: $792
Key resistance
R1: $951
R2: $1,059
Trading outlook
Bearish scenario: A break below $837 may expose $792.
Bullish scenario: A strong close above $951 could signal recovery toward $1,059.
RSI: Near oversold territory, so a relief bounce is possible, but reversal is not confirmed.
My view: Avoid chasing entries. Wait for confirmation around $837 support or a breakout above $951.
#AnthropicIPOTestsInvestorAppetiteForAI #BitcoinExtendsLosingStreakToSixWeeks #HuangReportedlyConsidersReturnToNvidia #SP500AndNasdaqFuturesHitQuarterlyLows #MUFGSMFGMizuhoPlanYenBackedStablecoin
The analysis below is for educational purposes, not a guaranteed trading signal.
ZEC/USDT Technical Levels
~$855
Indicator Reading
RSI (14)
31.5 – Weak
Daily trend Bearish
4H trend Bearish
Weekly trend Bullish
Key support
S1: $837
S2: $792
Key resistance
R1: $951
R2: $1,059
Trading outlook
Bearish scenario: A break below $837 may expose $792.
Bullish scenario: A strong close above $951 could signal recovery toward $1,059.
RSI: Near oversold territory, so a relief bounce is possible, but reversal is not confirmed.
My view: Avoid chasing entries. Wait for confirmation around $837 support or a breakout above $951.
#AnthropicIPOTestsInvestorAppetiteForAI #BitcoinExtendsLosingStreakToSixWeeks #HuangReportedlyConsidersReturnToNvidia #SP500AndNasdaqFuturesHitQuarterlyLows #MUFGSMFGMizuhoPlanYenBackedStablecoin
315
·
--
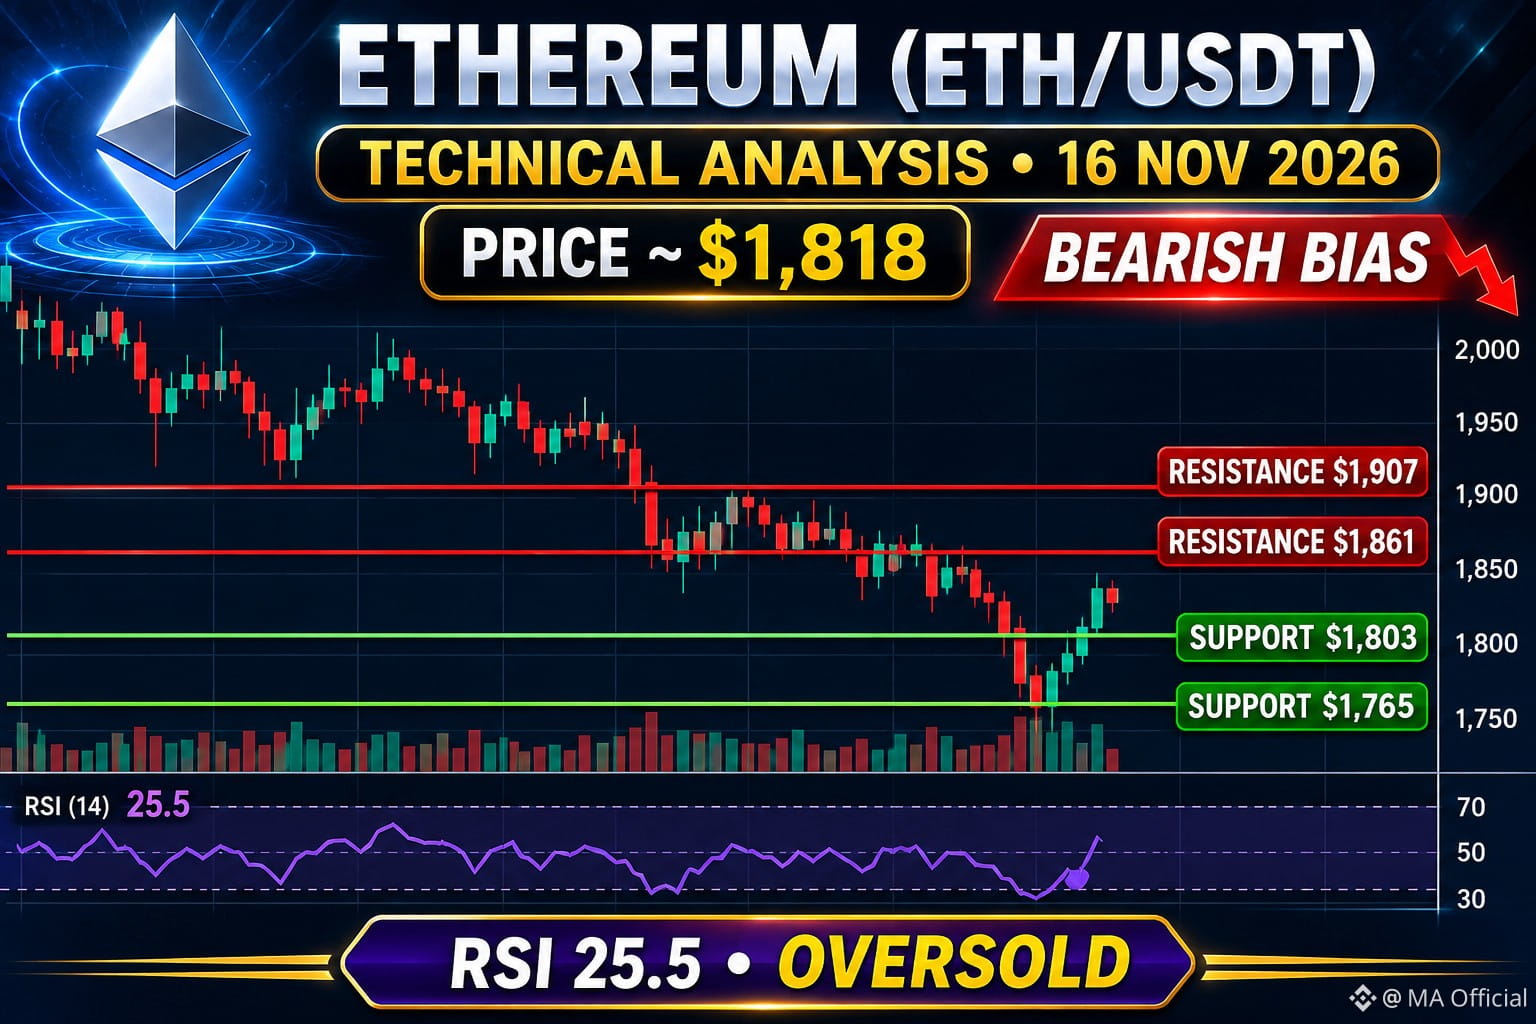
$ETH Ethereum is showing a bearish market structure across the 4-hour and daily timeframes. Selling pressure remains dominant, although the RSI indicates oversold conditions that could lead to a temporary recovery.
Market trend: Bearish
RSI (14): 25.5 – Oversold
Momentum: Weak
Short-term outlook: Cautious
Support & Resistance
Level Price
Resistance 2 $1,907
Resistance 1 $1,861
Current price $1,818
Support 1 $1,803
Support 2 $1,765
Source:
Trading Scenarios
Bullish Scenario
If ETH holds above $1,803 and breaks $1,861, a recovery towards $1,907 could develop.
Bearish Scenario
If ETH breaks below $1,803, the next downside level to watch is $1,765.
Trading Strategy
Avoid chasing trades during high volatility.
Watch for a confirmed breakout above $1,861.
Watch for a confirmed breakdown below $1,803.
Use stop-loss protection and manage position size carefully.
Final Prediction
Bearish / Cautious
ETH remains under bearish pressure. However, the oversold RSI means a short-term bounce is possible. Confirmation from price action is important before entering a trade.
Trade carefully. Protect your capital.
#AnthropicIPOTestsInvestorAppetiteForAI #HuangReportedlyConsidersReturnToNvidia #CryptoSelloffTriggersMultipleWhaleLiquidations #About64000BitcoinMiningMachinesReportedlyHijacked #USSpotXRPETFsSeeLargestWeeklyOutflowIn8Months
{spot}(ETHUSDT)
$ETH Ethereum is showing a bearish market structure across the 4-hour and daily timeframes. Selling pressure remains dominant, although the RSI indicates oversold conditions that could lead to a temporary recovery.
Market trend: Bearish
RSI (14): 25.5 – Oversold
Momentum: Weak
Short-term outlook: Cautious
Support & Resistance
Level Price
Resistance 2 $1,907
Resistance 1 $1,861
Current price $1,818
Support 1 $1,803
Support 2 $1,765
Source:
Trading Scenarios
Bullish Scenario
If ETH holds above $1,803 and breaks $1,861, a recovery towards $1,907 could develop.
Bearish Scenario
If ETH breaks below $1,803, the next downside level to watch is $1,765.
Trading Strategy
Avoid chasing trades during high volatility.
Watch for a confirmed breakout above $1,861.
Watch for a confirmed breakdown below $1,803.
Use stop-loss protection and manage position size carefully.
Final Prediction
Bearish / Cautious
ETH remains under bearish pressure. However, the oversold RSI means a short-term bounce is possible. Confirmation from price action is important before entering a trade.
Trade carefully. Protect your capital.
#AnthropicIPOTestsInvestorAppetiteForAI #HuangReportedlyConsidersReturnToNvidia #CryptoSelloffTriggersMultipleWhaleLiquidations #About64000BitcoinMiningMachinesReportedlyHijacked #USSpotXRPETFsSeeLargestWeeklyOutflowIn8Months
Market trend: Bearish
RSI (14): 25.5 – Oversold
Momentum: Weak
Short-term outlook: Cautious
Support & Resistance
Level Price
Resistance 2 $1,907
Resistance 1 $1,861
Current price $1,818
Support 1 $1,803
Support 2 $1,765
Source:
Trading Scenarios
Bullish Scenario
If ETH holds above $1,803 and breaks $1,861, a recovery towards $1,907 could develop.
Bearish Scenario
If ETH breaks below $1,803, the next downside level to watch is $1,765.
Trading Strategy
Avoid chasing trades during high volatility.
Watch for a confirmed breakout above $1,861.
Watch for a confirmed breakdown below $1,803.
Use stop-loss protection and manage position size carefully.
Final Prediction
Bearish / Cautious
ETH remains under bearish pressure. However, the oversold RSI means a short-term bounce is possible. Confirmation from price action is important before entering a trade.
Trade carefully. Protect your capital.
#AnthropicIPOTestsInvestorAppetiteForAI #HuangReportedlyConsidersReturnToNvidia #CryptoSelloffTriggersMultipleWhaleLiquidations #About64000BitcoinMiningMachinesReportedlyHijacked #USSpotXRPETFsSeeLargestWeeklyOutflowIn8Months
63
·
--
$XAU
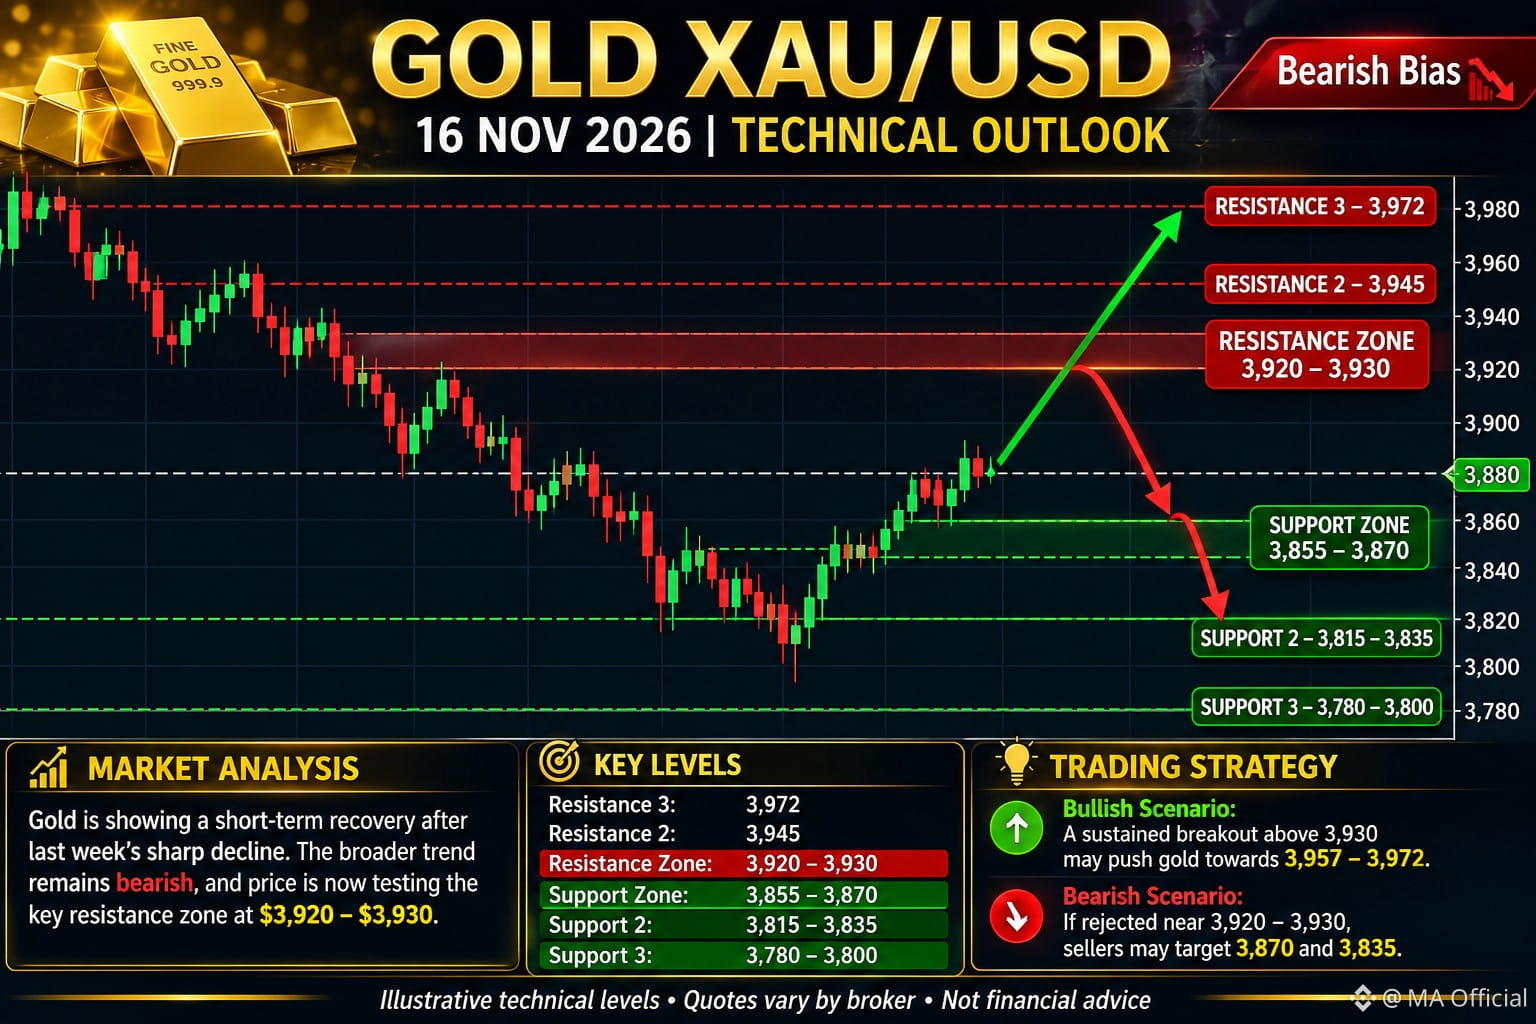
$3,880
Approximate spot gold price; live quotes vary between brokers.
1. Market Overview
Gold is showing weakness after a sharp decline last week. The price is attempting a short-term recovery, but the broader technical trend remains bearish.
Strong US dollar and rising Treasury yields are putting pressure on gold.
Buyers are attempting to defend the $3,855–$3,870 support zone.
A breakout above $3,930 could encourage further recovery.
2. Important Trading Levels
Level XAU/USD
Resistance 3 $3,972
Resistance 2 $3,945
Resistance 1 $3,920–3,930
Current reference $3,880
Support 1 $3,870–3,855
Support 2 $3,835–3,815
Support 3 $3,780
BUY scenario: If $XAU holds $3,855–$3,870 and forms a bullish reversal, a recovery toward $3,920 and $3,957 is possible.
SELL scenario: If gold faces rejection around $3,920–$3,930, bearish momentum could return toward $3,870 and $3,835.
Breakout confirmation: A sustained move above $3,930 would improve the bullish outlook. A decisive break below $3,855 would strengthen the bearish outlook.
Gold remains under selling pressure unless it reclaims the $3,930 resistance zone. Avoid entering trades without candle confirmation.
Risk management: Use a stop-loss, avoid over-leveraging, and wait for confirmation on the 15-minute or 1-hour chart.
Analysis is educational, not a guaranteed trading signal.
#HuangReportedlyConsidersReturnToNvidia #CryptoSelloffTriggersMultipleWhaleLiquidations #About64000BitcoinMiningMachinesReportedlyHijacked #USSpotXRPETFsSeeLargestWeeklyOutflowIn8Months #BitcoinActiveSupplyInProfitDropsBelow45%
{future}(XAUUSDT)
$XAU
$3,880
Approximate spot gold price; live quotes vary between brokers.
1. Market Overview
Gold is showing weakness after a sharp decline last week. The price is attempting a short-term recovery, but the broader technical trend remains bearish.
Strong US dollar and rising Treasury yields are putting pressure on gold.
Buyers are attempting to defend the $3,855–$3,870 support zone.
A breakout above $3,930 could encourage further recovery.
2. Important Trading Levels
Level XAU/USD
Resistance 3 $3,972
Resistance 2 $3,945
Resistance 1 $3,920–3,930
Current reference $3,880
Support 1 $3,870–3,855
Support 2 $3,835–3,815
Support 3 $3,780
BUY scenario: If $XAU holds $3,855–$3,870 and forms a bullish reversal, a recovery toward $3,920 and $3,957 is possible.
SELL scenario: If gold faces rejection around $3,920–$3,930, bearish momentum could return toward $3,870 and $3,835.
Breakout confirmation: A sustained move above $3,930 would improve the bullish outlook. A decisive break below $3,855 would strengthen the bearish outlook.
Gold remains under selling pressure unless it reclaims the $3,930 resistance zone. Avoid entering trades without candle confirmation.
Risk management: Use a stop-loss, avoid over-leveraging, and wait for confirmation on the 15-minute or 1-hour chart.
Analysis is educational, not a guaranteed trading signal.
#HuangReportedlyConsidersReturnToNvidia #CryptoSelloffTriggersMultipleWhaleLiquidations #About64000BitcoinMiningMachinesReportedlyHijacked #USSpotXRPETFsSeeLargestWeeklyOutflowIn8Months #BitcoinActiveSupplyInProfitDropsBelow45%
$3,880
Approximate spot gold price; live quotes vary between brokers.
1. Market Overview
Gold is showing weakness after a sharp decline last week. The price is attempting a short-term recovery, but the broader technical trend remains bearish.
Strong US dollar and rising Treasury yields are putting pressure on gold.
Buyers are attempting to defend the $3,855–$3,870 support zone.
A breakout above $3,930 could encourage further recovery.
2. Important Trading Levels
Level XAU/USD
Resistance 3 $3,972
Resistance 2 $3,945
Resistance 1 $3,920–3,930
Current reference $3,880
Support 1 $3,870–3,855
Support 2 $3,835–3,815
Support 3 $3,780
BUY scenario: If $XAU holds $3,855–$3,870 and forms a bullish reversal, a recovery toward $3,920 and $3,957 is possible.
SELL scenario: If gold faces rejection around $3,920–$3,930, bearish momentum could return toward $3,870 and $3,835.
Breakout confirmation: A sustained move above $3,930 would improve the bullish outlook. A decisive break below $3,855 would strengthen the bearish outlook.
Gold remains under selling pressure unless it reclaims the $3,930 resistance zone. Avoid entering trades without candle confirmation.
Risk management: Use a stop-loss, avoid over-leveraging, and wait for confirmation on the 15-minute or 1-hour chart.
Analysis is educational, not a guaranteed trading signal.
#HuangReportedlyConsidersReturnToNvidia #CryptoSelloffTriggersMultipleWhaleLiquidations #About64000BitcoinMiningMachinesReportedlyHijacked #USSpotXRPETFsSeeLargestWeeklyOutflowIn8Months #BitcoinActiveSupplyInProfitDropsBelow45%
1
123
·
--
$SOL
Technical outlook
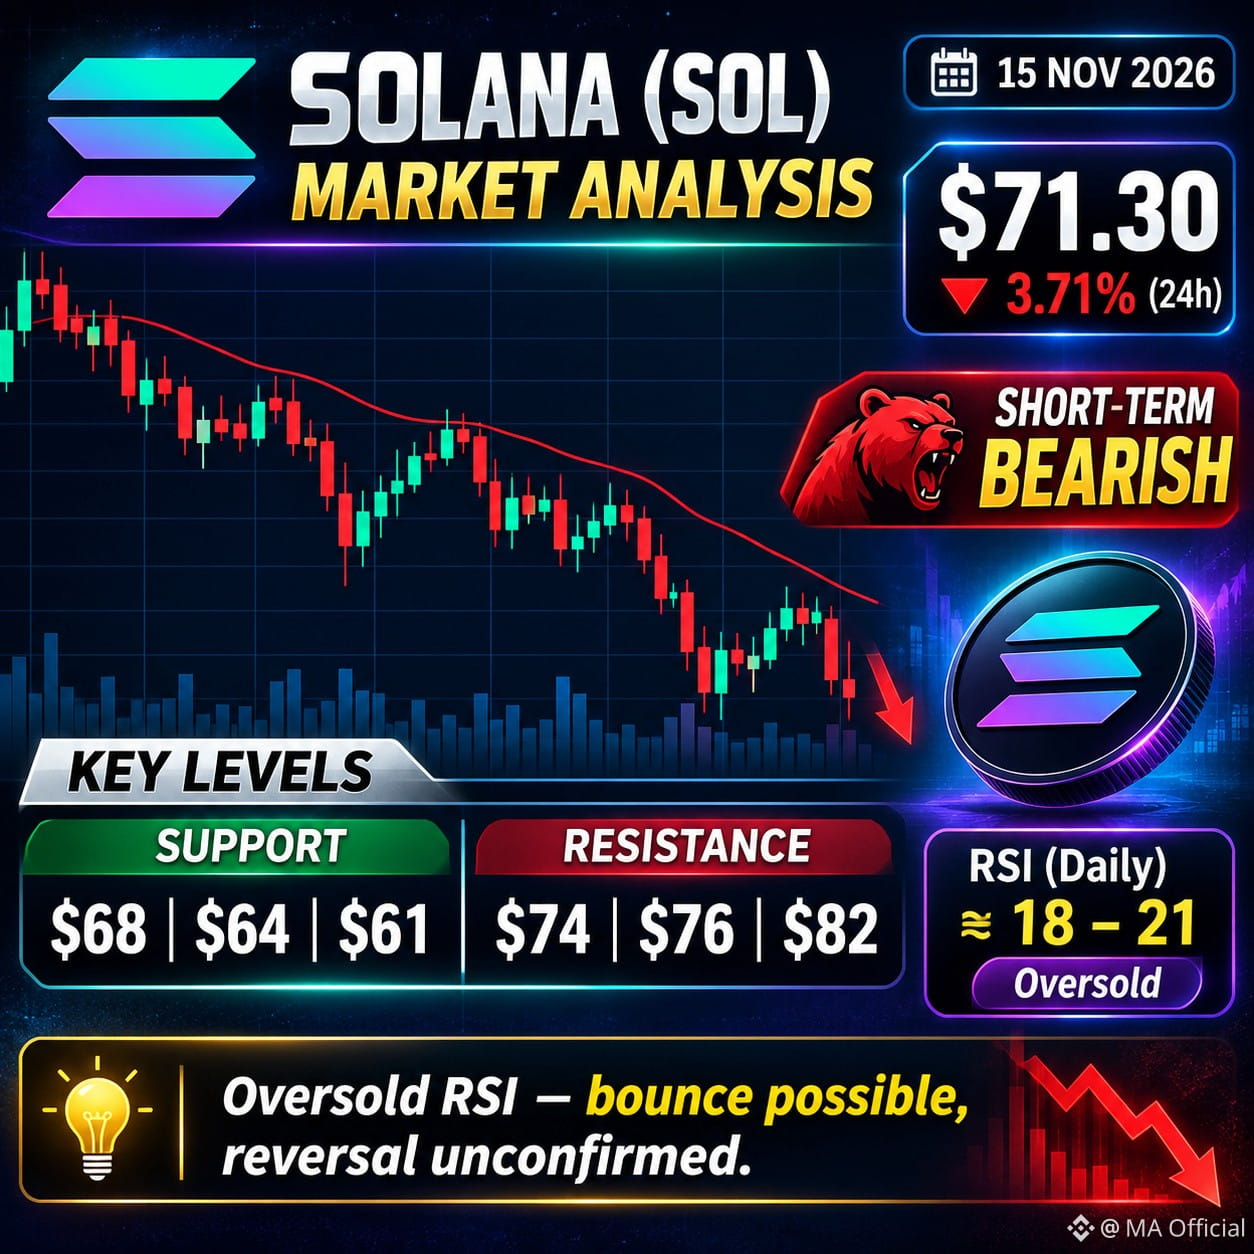
Bullish scenario: A strong recovery above $74 could open the way toward $76 and then $82.
Bearish scenario: A breakdown below $68 could expose $64 and $61.
Watch carefully: Oversold RSI can trigger a short-term bounce, but it does not confirm a trend reversal.
Trading conclusion
Solana is currently showing a bearish structure. The oversold RSI makes a relief bounce possible, but buyers need to reclaim $74–$76 before the recovery becomes more convincing.
My outlook: Bearish until resistance is reclaimed. Avoid chasing trades and use strict stop-loss management.
Major resistance $82.36
Support 1 $68.19
Support 2 $64.42
Major support $61.39
#CryptoSelloffTriggersMultipleWhaleLiquidations #USSpotXRPETFsSeeLargestWeeklyOutflowIn8Months #WhatWillDriveCryptoandStocks’NextRebound? #WhoWillSucceedJensenHuangatNvidia? #TradFiForBeginners
{spot}(SOLUSDT)
$SOL
Technical outlook
Bullish scenario: A strong recovery above $74 could open the way toward $76 and then $82.
Bearish scenario: A breakdown below $68 could expose $64 and $61.
Watch carefully: Oversold RSI can trigger a short-term bounce, but it does not confirm a trend reversal.
Trading conclusion
Solana is currently showing a bearish structure. The oversold RSI makes a relief bounce possible, but buyers need to reclaim $74–$76 before the recovery becomes more convincing.
My outlook: Bearish until resistance is reclaimed. Avoid chasing trades and use strict stop-loss management.
Major resistance $82.36
Support 1 $68.19
Support 2 $64.42
Major support $61.39
#CryptoSelloffTriggersMultipleWhaleLiquidations #USSpotXRPETFsSeeLargestWeeklyOutflowIn8Months #WhatWillDriveCryptoandStocks’NextRebound? #WhoWillSucceedJensenHuangatNvidia? #TradFiForBeginners
Technical outlook
Bullish scenario: A strong recovery above $74 could open the way toward $76 and then $82.
Bearish scenario: A breakdown below $68 could expose $64 and $61.
Watch carefully: Oversold RSI can trigger a short-term bounce, but it does not confirm a trend reversal.
Trading conclusion
Solana is currently showing a bearish structure. The oversold RSI makes a relief bounce possible, but buyers need to reclaim $74–$76 before the recovery becomes more convincing.
My outlook: Bearish until resistance is reclaimed. Avoid chasing trades and use strict stop-loss management.
Major resistance $82.36
Support 1 $68.19
Support 2 $64.42
Major support $61.39
#CryptoSelloffTriggersMultipleWhaleLiquidations #USSpotXRPETFsSeeLargestWeeklyOutflowIn8Months #WhatWillDriveCryptoandStocks’NextRebound? #WhoWillSucceedJensenHuangatNvidia? #TradFiForBeginners
1
1
279
·
--
Coin: OpenGradient (OPG)
$OPG Current price: Approximately $0.137 USD.
Key market levels
Indicator Price
Resistance 1 $0.141
Support 1 $0.128
24h high $0.1414
24h low $0.1283
📈 Market outlook
Bullish: A strong breakout above $0.141 with volume could indicate further upside.
Bearish: A breakdown below $0.128 could increase selling pressure.
Strategy: Watch volume and wait for confirmation before entering a trade.
My view: OPG is currently in a volatile consolidation zone. Avoid chasing sudden price movements. Wait for a confirmed breakout or support retest.
#KavaSaysAbnormalActivityLimitedToKavaLend #BitcoinActiveSupplyInProfitDropsBelow45% #TradFiForBeginners #WhoWillSucceedJensenHuangatNvidia?
{future}(OPGUSDT)
Coin: OpenGradient (OPG)
$OPG Current price: Approximately $0.137 USD.
Key market levels
Indicator Price
Resistance 1 $0.141
Support 1 $0.128
24h high $0.1414
24h low $0.1283
📈 Market outlook
Bullish: A strong breakout above $0.141 with volume could indicate further upside.
Bearish: A breakdown below $0.128 could increase selling pressure.
Strategy: Watch volume and wait for confirmation before entering a trade.
My view: OPG is currently in a volatile consolidation zone. Avoid chasing sudden price movements. Wait for a confirmed breakout or support retest.
#KavaSaysAbnormalActivityLimitedToKavaLend #BitcoinActiveSupplyInProfitDropsBelow45% #TradFiForBeginners #WhoWillSucceedJensenHuangatNvidia?
$OPG Current price: Approximately $0.137 USD.
Key market levels
Indicator Price
Resistance 1 $0.141
Support 1 $0.128
24h high $0.1414
24h low $0.1283
📈 Market outlook
Bullish: A strong breakout above $0.141 with volume could indicate further upside.
Bearish: A breakdown below $0.128 could increase selling pressure.
Strategy: Watch volume and wait for confirmation before entering a trade.
My view: OPG is currently in a volatile consolidation zone. Avoid chasing sudden price movements. Wait for a confirmed breakout or support retest.
#KavaSaysAbnormalActivityLimitedToKavaLend #BitcoinActiveSupplyInProfitDropsBelow45% #TradFiForBeginners #WhoWillSucceedJensenHuangatNvidia?

253
·
--
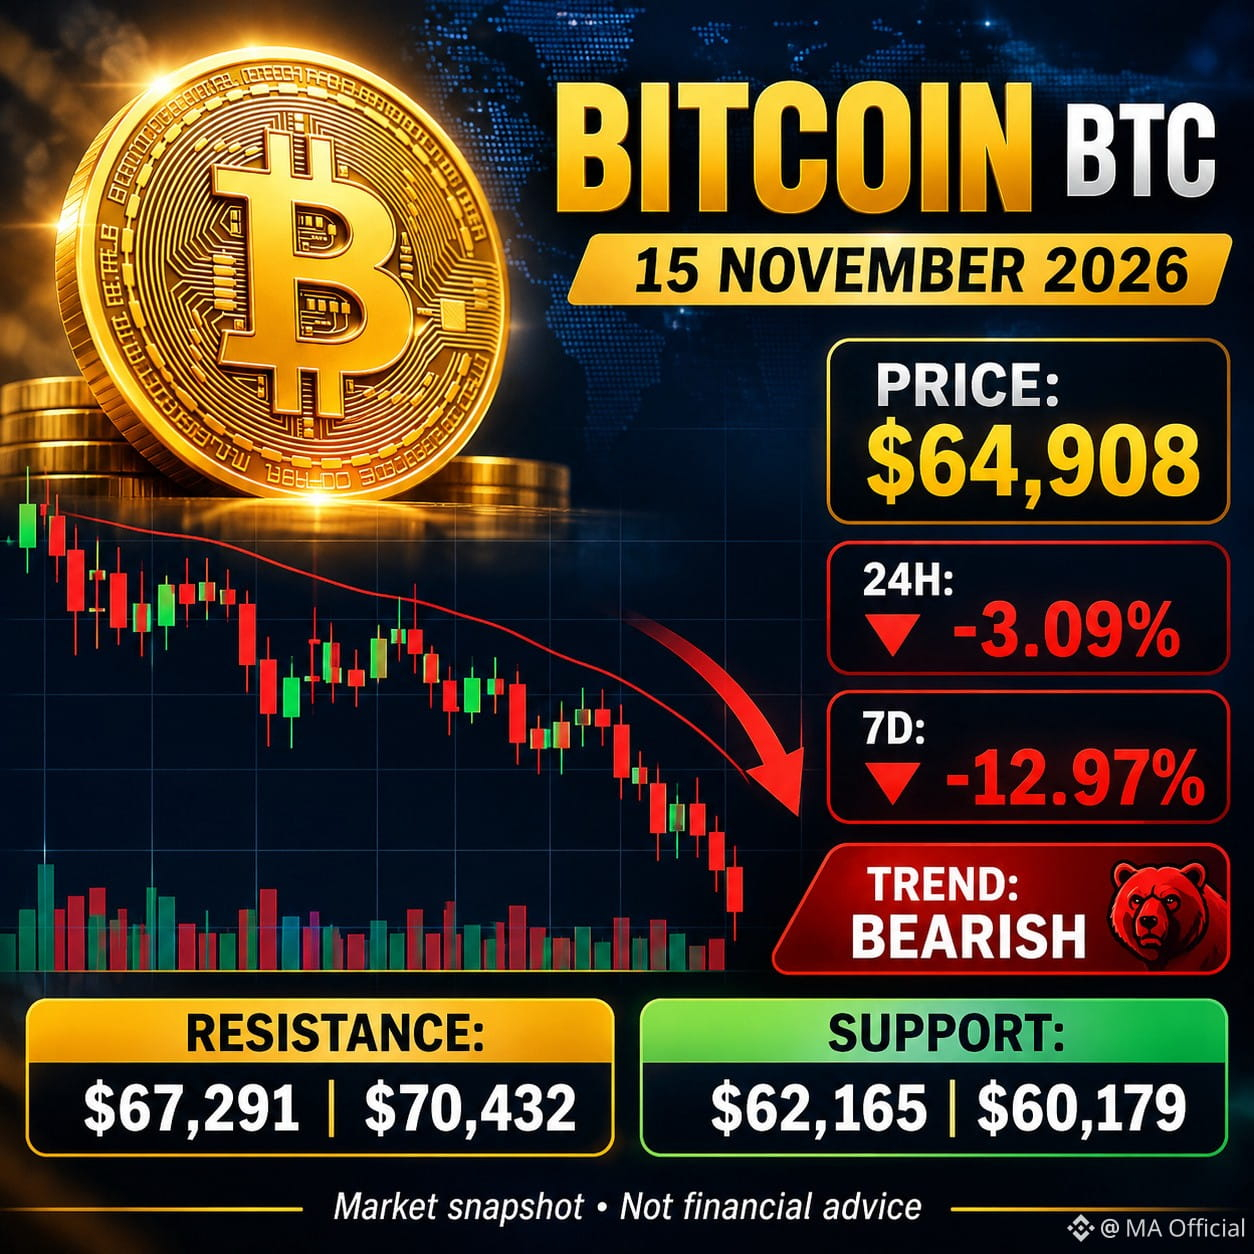
$BTC is facing strong selling pressure, dropping around 3.09% in the last 24 hours and nearly 13% over the past 7 days. Market sentiment remains weak due to heavy liquidations and institutional ETF outflows.
Key technical levels
Level Price
Resistance 2 $70,432
Resistance 1 $67,291
Current price $64,908
Support 1 $62,165
Support 2 $60,179
Market outlook:
Bullish: A daily close above $67,291 could signal a recovery toward $70,432.
Bearish: A breakdown below $62,165 could expose $60,179.
Strategy: Avoid chasing trades during high volatility. Wait for confirmation.
Overall view: Short-term bearish, with a possible oversold bounce. This is market analysis, not financial advice.
#BitcoinActiveSupplyInProfitDropsBelow45% #KavaSaysAbnormalActivityLimitedToKavaLend #TradFiForBeginners #WhatWillDriveCryptoandStocks’NextRebound?
{spot}(BTCUSDT)
$BTC is facing strong selling pressure, dropping around 3.09% in the last 24 hours and nearly 13% over the past 7 days. Market sentiment remains weak due to heavy liquidations and institutional ETF outflows.
Key technical levels
Level Price
Resistance 2 $70,432
Resistance 1 $67,291
Current price $64,908
Support 1 $62,165
Support 2 $60,179
Market outlook:
Bullish: A daily close above $67,291 could signal a recovery toward $70,432.
Bearish: A breakdown below $62,165 could expose $60,179.
Strategy: Avoid chasing trades during high volatility. Wait for confirmation.
Overall view: Short-term bearish, with a possible oversold bounce. This is market analysis, not financial advice.
#BitcoinActiveSupplyInProfitDropsBelow45% #KavaSaysAbnormalActivityLimitedToKavaLend #TradFiForBeginners #WhatWillDriveCryptoandStocks’NextRebound?
Key technical levels
Level Price
Resistance 2 $70,432
Resistance 1 $67,291
Current price $64,908
Support 1 $62,165
Support 2 $60,179
Market outlook:
Bullish: A daily close above $67,291 could signal a recovery toward $70,432.
Bearish: A breakdown below $62,165 could expose $60,179.
Strategy: Avoid chasing trades during high volatility. Wait for confirmation.
Overall view: Short-term bearish, with a possible oversold bounce. This is market analysis, not financial advice.
#BitcoinActiveSupplyInProfitDropsBelow45% #KavaSaysAbnormalActivityLimitedToKavaLend #TradFiForBeginners #WhatWillDriveCryptoandStocks’NextRebound?
101
Log in to explore more content
Join global crypto users on Binance Square
⚡️ Get latest and useful information about crypto.
💬 Trusted by the world’s largest crypto exchange.
👍 Discover real insights from verified creators.
Email / Phone number
Trending Topics
A Packed Week of Earnings and Data Tests Markets
53,260 views
362 Discussing
🚨🇺🇸 BIG WEEK AHEAD FOR THE MARKETS!
Markets are pricing in a Fed rate hike in December and $BTC could see some big moves next week.
Here's what's coming:
• Monday: Fed Chair Warsh speaks
• Tuesday: US Retail Sales + $NVDA earnings
• Wednesday: FOMC Minutes
• Thursday: Jobless Claims + Philly Fed Index
• Friday: Consumer Sentiment + Fed speeches
All eyes on $BTC as another important week begins.
#bitcoin
Mookie
·15 Likes
·6.1k views
AnthropicIPOTestsInvestorAppetiteForAI
92,243 views
1,241 Discussing
BitcoinExtendsLosingStreakToSixWeeks
57,329 views
598 Discussing