

Debra Umbenhauer YuFK
21 Posts
Debra Umbenhauer YuFK
Report
Block User
Open Trade
High-Frequency Trader
2.2 Months
1 Following
1 Followers
2 Liked
Posts
Portfolio
PINNED
🟢 LONG $ZEC/USDT — Bulls Target Higher Prices! 📈
Bias: LONG · Bullish
🎯 Entry Zone: $1,314–$1,319
🥇 TP1: $1,351 (+2.6%)
🥈 TP2: $1,378 (+4.3%)
🥉 TP3: $1,411 (+6.9%)
🛑 Stop-Loss: $1,268 (−3.4%)
Trading Plan: • Enter only within the planned zone.
• Take partial profits at each target.
• After TP1, consider moving the stop-loss to entry.
Why LONG? 🚀
✅ Daily trend remains bullish.
✅ 1H trend supports buyers.
✅ Momentum signals favor upward movement.
⚠️ Risk Alert: ZEC may be overextended, and a pullback is possible. Wait for confirmation before entering.
📊 Trade your plan, manage your risk, and never assume profits are guaranteed.
#ZEC #ZECUSDT #CryptoTrading. #Binance
#Btc
$ZEC
{spot}(ZECUSDT)
$BTC
{spot}(BTCUSDT)
$SOL
{spot}(SOLUSDT)
🟢 LONG $ZEC /USDT — Bulls Target Higher Prices! 📈
Bias: LONG · Bullish
🎯 Entry Zone: $1,314–$1,319
🥇 TP1: $1,351 (+2.6%)
🥈 TP2: $1,378 (+4.3%)
🥉 TP3: $1,411 (+6.9%)
🛑 Stop-Loss: $1,268 (−3.4%)
Trading Plan: • Enter only within the planned zone.
• Take partial profits at each target.
• After TP1, consider moving the stop-loss to entry.
Why LONG? 🚀
✅ Daily trend remains bullish.
✅ 1H trend supports buyers.
✅ Momentum signals favor upward movement.
⚠️ Risk Alert: ZEC may be overextended, and a pullback is possible. Wait for confirmation before entering.
📊 Trade your plan, manage your risk, and never assume profits are guaranteed.
#ZEC #ZECUSDT #CryptoTrading. #Binance
#Btc
$ZEC
$BTC
$SOL
90
·
--
Bullish
📈🚀 The Crypto Market Is Rising!
Green candles are bringing new hope to the market! 💚 Is this the beginning of a bigger rally, or just a temporary bounce? 👀
Stay alert, trade wisely, and never let emotions control your decisions. 💎
#Binance #CryptoMarket #Bitcoin #Solana #Bullish
$ZEC
$BTC
{spot}(BTCUSDT)
$SOL
{spot}(SOLUSDT)
{spot}(ZECUSDT)
📈🚀 The Crypto Market Is Rising!
Green candles are bringing new hope to the market! 💚 Is this the beginning of a bigger rally, or just a temporary bounce? 👀
Stay alert, trade wisely, and never let emotions control your decisions. 💎
#Binance #CryptoMarket #Bitcoin #Solana #Bullish
$ZEC
$BTC
$SOL
Green candles are bringing new hope to the market! 💚 Is this the beginning of a bigger rally, or just a temporary bounce? 👀
Stay alert, trade wisely, and never let emotions control your decisions. 💎
#Binance #CryptoMarket #Bitcoin #Solana #Bullish
$ZEC
$BTC
$SOL
151
😂📉 Crypto Market Be Like:
When the market goes UP 📈 — I'm a genius! 😎🚀
When the market goes DOWN 📉 — I'm a long-term investor! 💎😂
Buy high, sell low… the Binance strategy nobody recommends! 🤣💸
Who else is suffering? 🙋♂️😂
#Binance #Crypto #BTC #SOL #CryptoMemes #HODL
$BTC #Eth #SolanaStrong
$ZEC
{spot}(ZECUSDT)
$BTC
{spot}(BTCUSDT)
😂📉 Crypto Market Be Like:
When the market goes UP 📈 — I'm a genius! 😎🚀
When the market goes DOWN 📉 — I'm a long-term investor! 💎😂
Buy high, sell low… the Binance strategy nobody recommends! 🤣💸
Who else is suffering? 🙋♂️😂
#Binance #Crypto #BTC #SOL #CryptoMemes #HODL
$BTC #Eth #SolanaStrong
$ZEC
$BTC
When the market goes UP 📈 — I'm a genius! 😎🚀
When the market goes DOWN 📉 — I'm a long-term investor! 💎😂
Buy high, sell low… the Binance strategy nobody recommends! 🤣💸
Who else is suffering? 🙋♂️😂
#Binance #Crypto #BTC #SOL #CryptoMemes #HODL
$BTC #Eth #SolanaStrong
$ZEC
$BTC
207
Article
Solana (SOL) Price Analysis: Is SOL Ready for a Recovery?Solana (SOL) Price Analysis: Is SOL Ready for a Recovery?
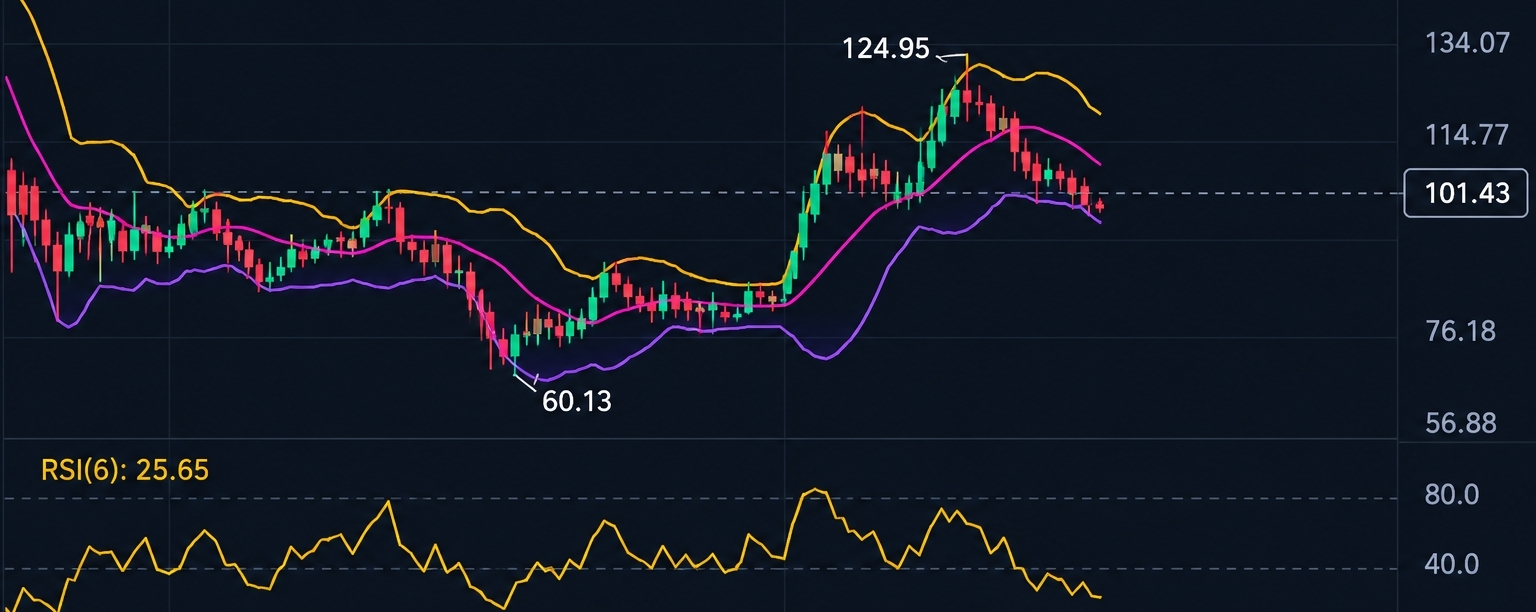
Solana (SOL) is one of the popular cryptocurrencies in the market. According to the Binance chart provided on October 24, 2026, SOL is trading at approximately $101.43 USDT, down 2.73%.
1. Current SOL Market Situation
According to the chart:
Current Price: $101.43
24-Hour High: $105.24
24-Hour Low: $101.14
Bollinger Bands Upper Level: $118.79
Bollinger Bands Middle Level: $107.94
Bollinger Bands Lower Level: $97.09
RSI (6): 25.65
These indicators suggest that SOL is experiencing selling pressure.
2. Technical Analysis
Bollinger Bands: SOL is trading close to the lower Bollinger Band at $97.09. This may indicate that the price is approaching a potential support area. However, the price can continue falling even when it is near the lower band.
Relative Strength Index (RSI): The RSI reading of 25.65 is below 30, which traditionally indicates an oversold condition. This could create an opportunity for a short-term recovery, but it does not guarantee that the price will rise.
Price Trend: The chart shows that SOL recently declined from a high of approximately $124.95 to around $101.43. This indicates a significant pullback from its recent peak.
3. Important Price Levels
Based on the indicators visible in the chart:
Potential Support: $101–$97
Potential Resistance: $105–$108
Higher Resistance: $114–$119
These are estimated technical levels, not guaranteed price targets. A break below $97 could signal further weakness, while a move above $108 could suggest improving momentum.
4. Should You Buy SOL Now?
SOL may offer a potential buying opportunity if its price stabilizes and begins recovering. However, buying only because the price has fallen can be risky.
For spot trading, consider the following approach:
Avoid investing all your money in a single purchase.
Watch whether SOL holds the $97–$101 area.
Look for signs of recovery before entering a trade.
Decide in advance how much you can afford to lose.
Remember that cryptocurrency prices can fall further, even when technical indicators suggest oversold conditions.
5. Conclusion
Solana is currently showing bearish momentum, with its price near the lower Bollinger Band and its RSI below 30. These conditions may allow for a short-term rebound, but further downside remains possible.
My view: SOL is worth watching, but the chart alone does not confirm a safe buying opportunity. Waiting for signs of price stabilization may be more prudent than buying immediately.
Disclaimer: This analysis is based on the screenshot provided and is for educational purposes only. It is not a guarantee of future performance or personalized financial advice.
$SOL
{spot}(SOLUSDT)
#BTC #ZECUSDT
Solana (SOL) Price Analysis: Is SOL Ready for a Recovery?
Solana (SOL) Price Analysis: Is SOL Ready for a Recovery?
Solana (SOL) is one of the popular cryptocurrencies in the market. According to the Binance chart provided on October 24, 2026, SOL is trading at approximately $101.43 USDT, down 2.73%.
1. Current SOL Market Situation
According to the chart:
Current Price: $101.43
24-Hour High: $105.24
24-Hour Low: $101.14
Bollinger Bands Upper Level: $118.79
Bollinger Bands Middle Level: $107.94
Bollinger Bands Lower Level: $97.09
RSI (6): 25.65
These indicators suggest that SOL is experiencing selling pressure.
2. Technical Analysis
Bollinger Bands: SOL is trading close to the lower Bollinger Band at $97.09. This may indicate that the price is approaching a potential support area. However, the price can continue falling even when it is near the lower band.
Relative Strength Index (RSI): The RSI reading of 25.65 is below 30, which traditionally indicates an oversold condition. This could create an opportunity for a short-term recovery, but it does not guarantee that the price will rise.
Price Trend: The chart shows that SOL recently declined from a high of approximately $124.95 to around $101.43. This indicates a significant pullback from its recent peak.
3. Important Price Levels
Based on the indicators visible in the chart:
Potential Support: $101–$97
Potential Resistance: $105–$108
Higher Resistance: $114–$119
These are estimated technical levels, not guaranteed price targets. A break below $97 could signal further weakness, while a move above $108 could suggest improving momentum.
4. Should You Buy SOL Now?
SOL may offer a potential buying opportunity if its price stabilizes and begins recovering. However, buying only because the price has fallen can be risky.
For spot trading, consider the following approach:
Avoid investing all your money in a single purchase.
Watch whether SOL holds the $97–$101 area.
Look for signs of recovery before entering a trade.
Decide in advance how much you can afford to lose.
Remember that cryptocurrency prices can fall further, even when technical indicators suggest oversold conditions.
5. Conclusion
Solana is currently showing bearish momentum, with its price near the lower Bollinger Band and its RSI below 30. These conditions may allow for a short-term rebound, but further downside remains possible.
My view: SOL is worth watching, but the chart alone does not confirm a safe buying opportunity. Waiting for signs of price stabilization may be more prudent than buying immediately.
Disclaimer: This analysis is based on the screenshot provided and is for educational purposes only. It is not a guarantee of future performance or personalized financial advice.
$SOL
#BTC #ZECUSDT
230
The target of this coin to achieve by the end of this month are ..
$ZEC 1500
{spot}(ZECUSDT)
to $1500 🔥
The target of this coin to achieve by the end of this month are ..
$ZEC 1500
to $1500 🔥
$ZEC 1500
to $1500 🔥
226
🚀 $ZEC: The Next Big Move Is ComingZEC has faced selling pressure, but buyers are trying to fight back. The big question is whether bulls can regain control and push the price toward $1,300 and beyond.
🐂 Bullish comeback or another drop — which side will win this battle?
🔥 Traders are watching key support and resistance levels closely. The next move could change the market mood.
💬 Your prediction: Will ZEC hit $1,300 first, or will sellers push it below $1,123?
👇 Comment BULLISH 🟢 or BEARISH 🔴 and share your target.
#ZEC #ZECUSDT #Binance #CryptoMarket #altcoins $ZEC $BTC
$ZEC
{spot}(ZECUSDT)
🚀 $ZEC: The Next Big Move Is Coming
ZEC has faced selling pressure, but buyers are trying to fight back. The big question is whether bulls can regain control and push the price toward $1,300 and beyond.
🐂 Bullish comeback or another drop — which side will win this battle?
🔥 Traders are watching key support and resistance levels closely. The next move could change the market mood.
💬 Your prediction: Will ZEC hit $1,300 first, or will sellers push it below $1,123?
👇 Comment BULLISH 🟢 or BEARISH 🔴 and share your target.
#ZEC #ZECUSDT #Binance #CryptoMarket #altcoins $ZEC $BTC
$ZEC
174
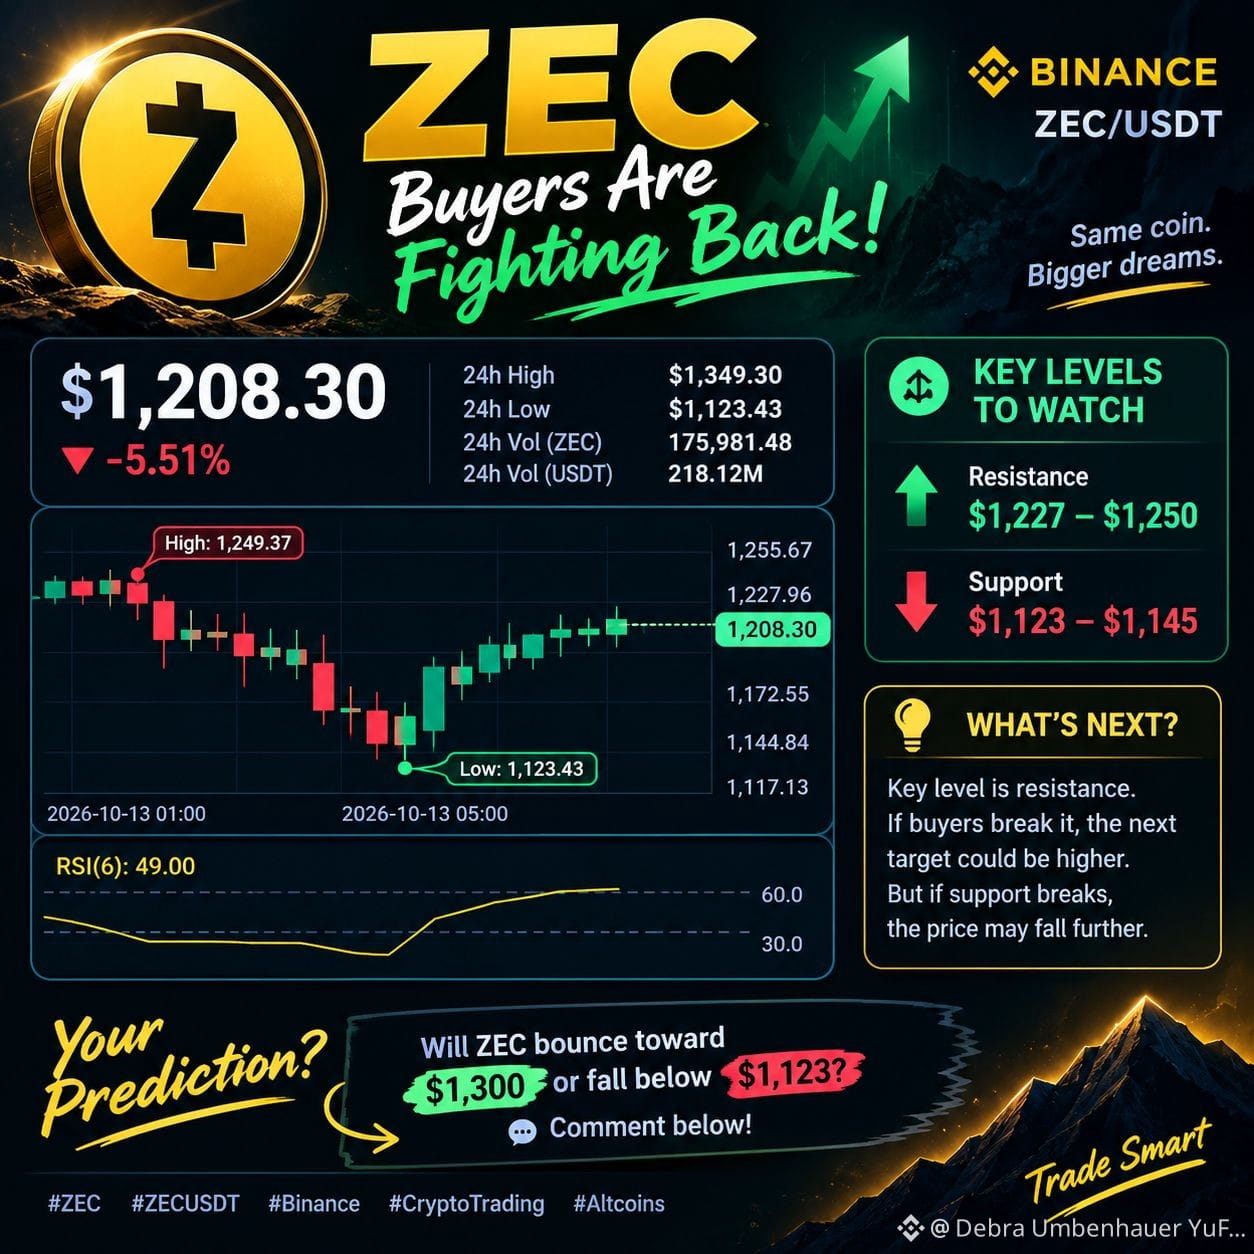
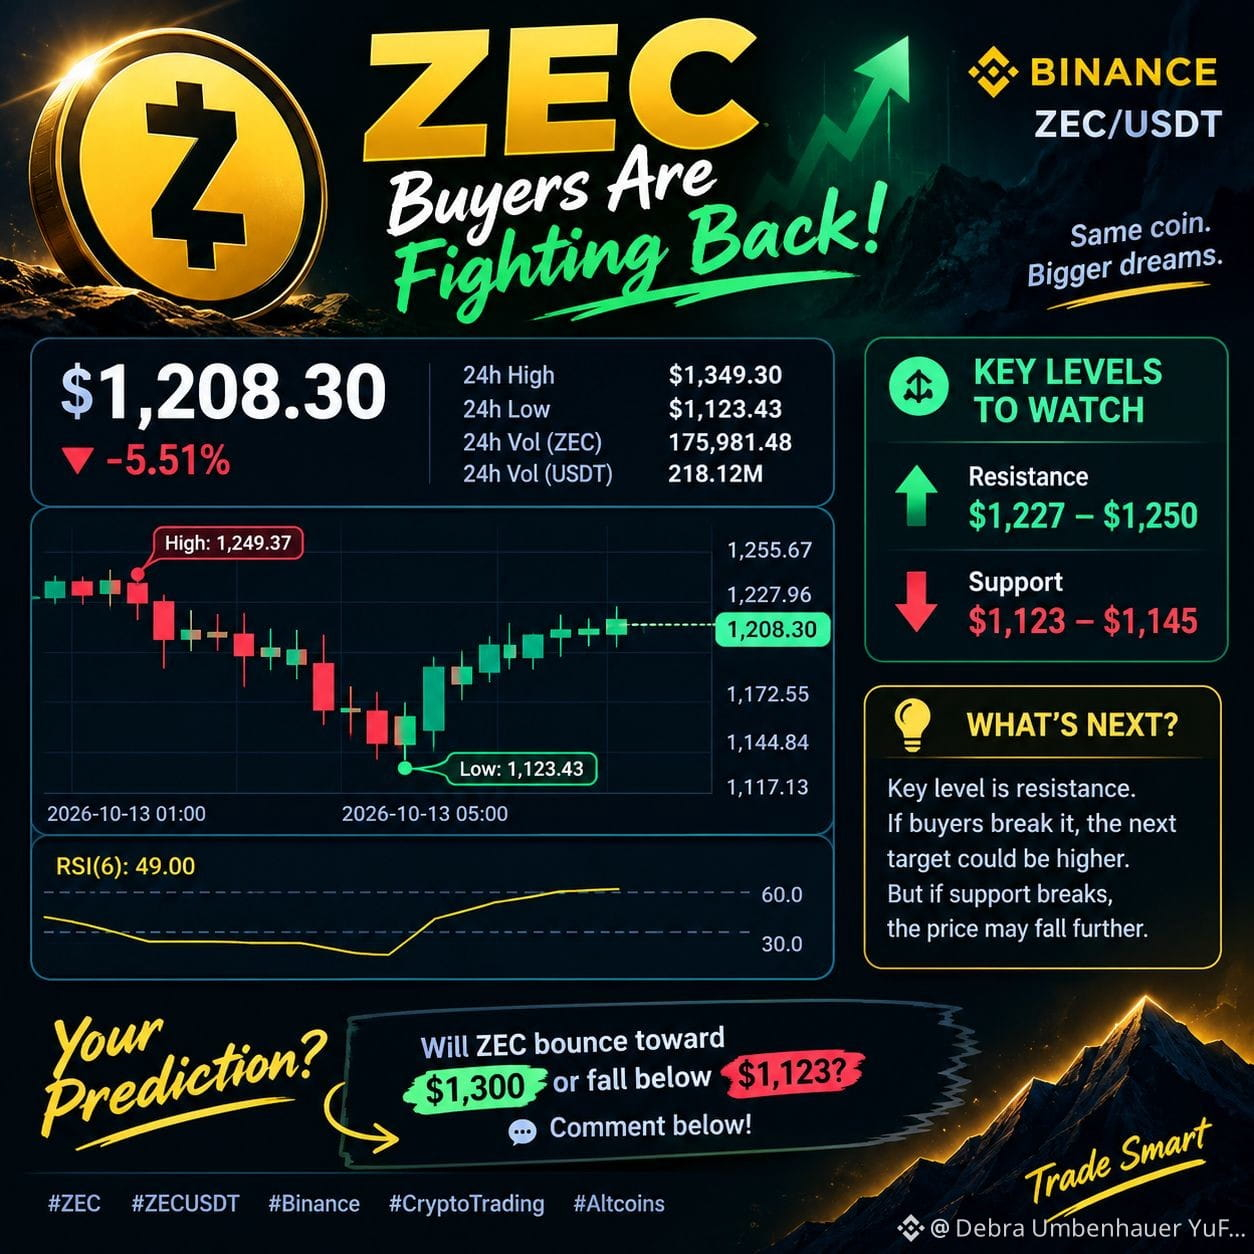
🚨 $ZEC: Buyers Are Fighting Back!ZEC is trading at $1,208.30, down 5.51%, after touching a low of $1,123.43. Buyers have stepped in, pushing the price back up, while RSI is recovering toward 49.
🔥 Key levels to watch: 🟢 Resistance: $1,227–$1,250
🔴 Support: $1,123–$1,145
🎯 Next move depends on whether buyers can break resistance.
💬 Your prediction: Will ZEC bounce toward $1,300 or fall below $1,123? Comment below! 👇
#zec #ZECUSDT #Binance #CryptoTrading. #altcoins
$ZEC
🚨 $ZEC : Buyers Are Fighting Back!ZEC is trading at $1,208.30, down 5.51%, after touching a low of $1,123.43. Buyers have stepped in, pushing the price back up, while RSI is recovering toward 49.
🔥 Key levels to watch: 🟢 Resistance: $1,227–$1,250
🔴 Support: $1,123–$1,145
🎯 Next move depends on whether buyers can break resistance.
💬 Your prediction: Will ZEC bounce toward $1,300 or fall below $1,123? Comment below! 👇
#zec #ZECUSDT #Binance #CryptoTrading. #altcoins
$ZEC
🔥 Key levels to watch: 🟢 Resistance: $1,227–$1,250
🔴 Support: $1,123–$1,145
🎯 Next move depends on whether buyers can break resistance.
💬 Your prediction: Will ZEC bounce toward $1,300 or fall below $1,123? Comment below! 👇
#zec #ZECUSDT #Binance #CryptoTrading. #altcoins
$ZEC
180
🚀 $ZEC Next Target: $1,500+ — Is Another Rally Coming?
🐋🐋 ZEC bulls, are you ready for the next move?
If buying pressure continues and key resistance levels break, $ZEC could target $1,500+. The big question is whether buyers have enough strength to push the price higher or sellers will take control.
🔥 The next move could be interesting. Are we preparing for another rally or a price correction?
💬 Your prediction: Will ZEC reach $1,500 first, or drop before the next rally? Comment below. 👇
⚠️ This is a market outlook, not a guaranteed prediction. Trade carefully.
#ZEC #ZECUSDT #Binance #CryptoTrading #Altcoins
$ZEC
🚀 $ZEC Next Target: $1,500+ — Is Another Rally Coming? 🐋
🐋 ZEC bulls, are you ready for the next move?
If buying pressure continues and key resistance levels break, $ZEC could target $1,500+. The big question is whether buyers have enough strength to push the price higher or sellers will take control.
🔥 The next move could be interesting. Are we preparing for another rally or a price correction?
💬 Your prediction: Will ZEC reach $1,500 first, or drop before the next rally? Comment below. 👇
⚠️ This is a market outlook, not a guaranteed prediction. Trade carefully.
#ZEC #ZECUSDT #Binance #CryptoTrading #Altcoins
$ZEC
277
🚀 ZEC Price Outlook: Can ZEC Reach $2,000?🚀 ZEC Price Outlook: Can ZEC Reach $2,000?
📊 ZEC/USDT Market Analysis
💰 Current Price: $1,213.33
📈 Previous Peak: $1,697.45
🎯 Potential Long-Term Target: $2,000
📉 A Possible Correction Before the Next Rally
ZEC is holding around $1,213.33 after retreating from its previous peak of $1,697.45. Looking at its past price movements, the coin has experienced significant swings, including a rally from $368.20.
In the short term, ZEC could test the lower Bollinger Band near $1,137. If buyers step in around that level, a rebound could follow. However, a break below this support area could lead to further downside.
🐂 Can ZEC Reach $2,000?
If bullish momentum returns and buying pressure continues, ZEC could potentially challenge $1,697.45 before making a move toward $2,000.
A strong breakout above previous resistance could support further upside, although market conditions and selling pressure will play an important role.
🔥 Final Market Outlook
ZEC remains a coin to watch. A possible pullback toward $1,137 could create an important test for buyers, while a recovery above previous resistance could open the door to higher prices.
Key Levels to Watch
Support area: $1,137
Previous peak and resistance: $1,697.45
Potential long-term target: $2,000
⚠️ Important: These levels are based on the figures provided, not independently verified live market data. Bollinger Band levels change with the chart timeframe and settings, and historical price movements do not guarantee future gains.
#ZEC #ZECUSDt #EthereumSurpasses2500USDT #CryptoMarket #PricePrediction $ZEC $BTC $ETH
🚀 ZEC Price Outlook: Can ZEC Reach $2,000?
🚀 ZEC Price Outlook: Can ZEC Reach $2,000?
📊 ZEC/USDT Market Analysis
💰 Current Price: $1,213.33
📈 Previous Peak: $1,697.45
🎯 Potential Long-Term Target: $2,000
📉 A Possible Correction Before the Next Rally
ZEC is holding around $1,213.33 after retreating from its previous peak of $1,697.45. Looking at its past price movements, the coin has experienced significant swings, including a rally from $368.20.
In the short term, ZEC could test the lower Bollinger Band near $1,137. If buyers step in around that level, a rebound could follow. However, a break below this support area could lead to further downside.
🐂 Can ZEC Reach $2,000?
If bullish momentum returns and buying pressure continues, ZEC could potentially challenge $1,697.45 before making a move toward $2,000.
A strong breakout above previous resistance could support further upside, although market conditions and selling pressure will play an important role.
🔥 Final Market Outlook
ZEC remains a coin to watch. A possible pullback toward $1,137 could create an important test for buyers, while a recovery above previous resistance could open the door to higher prices.
Key Levels to Watch
Support area: $1,137
Previous peak and resistance: $1,697.45
Potential long-term target: $2,000
⚠️ Important: These levels are based on the figures provided, not independently verified live market data. Bollinger Band levels change with the chart timeframe and settings, and historical price movements do not guarantee future gains.
#ZEC #ZECUSDt #EthereumSurpasses2500USDT #CryptoMarket #PricePrediction $ZEC $BTC $ETH
1
702
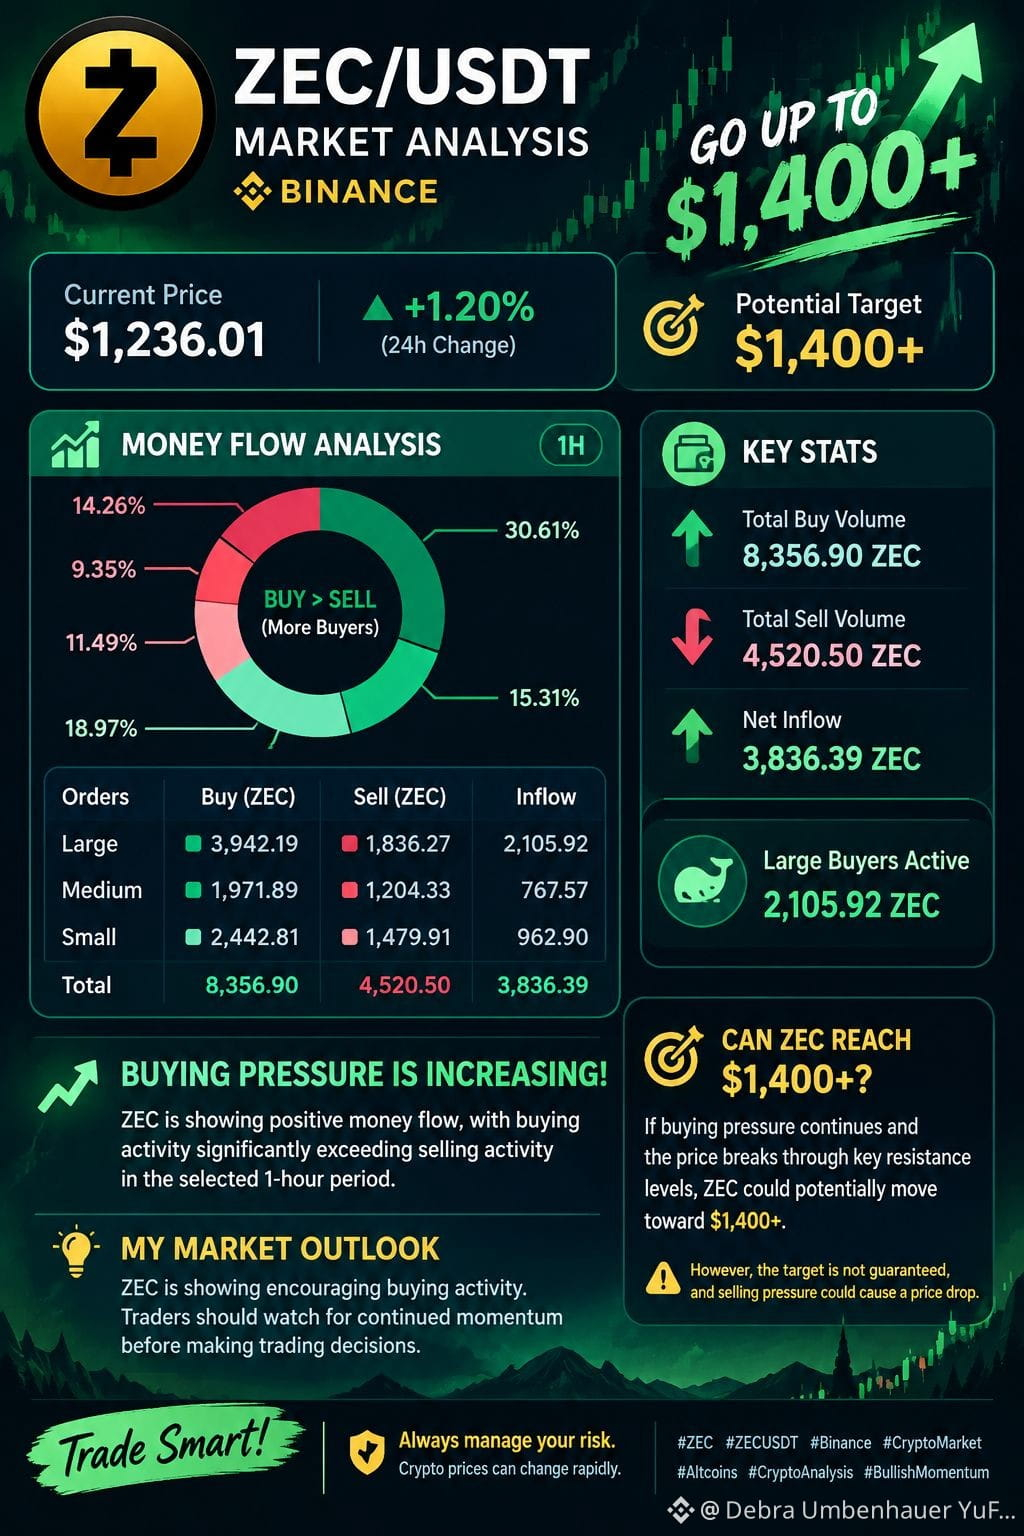
🚀 ZEC Could Target $1,400+ — Buyers Show Strong Market Interest.
📊 ZEC/USDT Market Analysis
💰 Current Price: $1,236.01
📈 Price Change: +1.20%
🎯 Potential Target: $1,400+
🟢 Buying Pressure Is Increasing.
ZEC is showing positive money flow, with buying activity significantly exceeding selling activity in the selected 1-hour period.
💚 Total Buy Volume: 8,356.90 ZEC
🔴 Total Sell Volume: 4,520.50 ZEC
📈 Net Inflow: 3,836.39 ZEC
🐋 Large Buyers Are Active!
Large orders recorded a positive inflow of 2,105.92 ZEC, indicating stronger buying than selling among large orders during this period.
🔥 Can ZEC Reach $1,400+?
If buying pressure continues and the price breaks through key resistance levels, ZEC could potentially move toward $1,400+. However, the target is not guaranteed, and selling pressure could cause a price drop.
🚀 My Market Outlook: ZEC is showing encouraging buying activity. Traders should watch for continued momentum before making trading decisions.
⚠️ Trade carefully. Always manage your risk because crypto prices can change rapidly.
#ZEC #ZECUSDT #Binance #CryptoMarket #Altcoins #CryptoAnalysis #BullishMomentum $ZEC $BTC $ZEC
{spot}(ZECUSDT)
🚀 ZEC Could Target $1,400+ — Buyers Show Strong Market Interest.
📊 ZEC/USDT Market Analysis
💰 Current Price: $1,236.01
📈 Price Change: +1.20%
🎯 Potential Target: $1,400+
🟢 Buying Pressure Is Increasing.
ZEC is showing positive money flow, with buying activity significantly exceeding selling activity in the selected 1-hour period.
💚 Total Buy Volume: 8,356.90 ZEC
🔴 Total Sell Volume: 4,520.50 ZEC
📈 Net Inflow: 3,836.39 ZEC
🐋 Large Buyers Are Active!
Large orders recorded a positive inflow of 2,105.92 ZEC, indicating stronger buying than selling among large orders during this period.
🔥 Can ZEC Reach $1,400+?
If buying pressure continues and the price breaks through key resistance levels, ZEC could potentially move toward $1,400+. However, the target is not guaranteed, and selling pressure could cause a price drop.
🚀 My Market Outlook: ZEC is showing encouraging buying activity. Traders should watch for continued momentum before making trading decisions.
⚠️ Trade carefully. Always manage your risk because crypto prices can change rapidly.
#ZEC #ZECUSDT #Binance #CryptoMarket #Altcoins #CryptoAnalysis #BullishMomentum $ZEC $BTC $ZEC
201
ZEC Is Moving Up Is Another Rally Coming?ZEC Is Moving Up Is Another Rally Coming?
Zcash #ZEC is attracting attention as traders watch for the next market move. When a coin starts rising, everyone asks the same question: Can the momentum continue?
Why #Zec
Zcash is known for its privacy-focused technology and supports shielded transactions. This gives it a unique place in the cryptocurrency market.
What Should Traders Watch.
Price momentum: Is ZEC continuing to make higher highs.
Trading volume: Are more traders participating in the move.
Resistance levels: Can the price break through selling pressure.
Risk management: What happens if the market turns downward.
My Strategy
I believe successful trading is about more than following green candles. It requires patience, research, and discipline.
If you trade ZEC on Spot, study the chart before entering and decide how much risk you can accept. Remember, a rising market can reverse at any time.
My focus is simple: Follow the market, not the crowd. Think before you trade.
Your opinion: Can ZEC maintain its upward momentum, or will we see a correction first? Share your thoughts.
This article is for educational purposes only, not financial advice. Always do your own research before investing.
$ZEC
{spot}(ZECUSDT)
ZEC Is Moving Up Is Another Rally Coming?
ZEC Is Moving Up Is Another Rally Coming?
Zcash #ZEC is attracting attention as traders watch for the next market move. When a coin starts rising, everyone asks the same question: Can the momentum continue?
Why #Zec
Zcash is known for its privacy-focused technology and supports shielded transactions. This gives it a unique place in the cryptocurrency market.
What Should Traders Watch.
Price momentum: Is ZEC continuing to make higher highs.
Trading volume: Are more traders participating in the move.
Resistance levels: Can the price break through selling pressure.
Risk management: What happens if the market turns downward.
My Strategy
I believe successful trading is about more than following green candles. It requires patience, research, and discipline.
If you trade ZEC on Spot, study the chart before entering and decide how much risk you can accept. Remember, a rising market can reverse at any time.
My focus is simple: Follow the market, not the crowd. Think before you trade.
Your opinion: Can ZEC maintain its upward momentum, or will we see a correction first? Share your thoughts.
This article is for educational purposes only, not financial advice. Always do your own research before investing.
$ZEC
180
Article
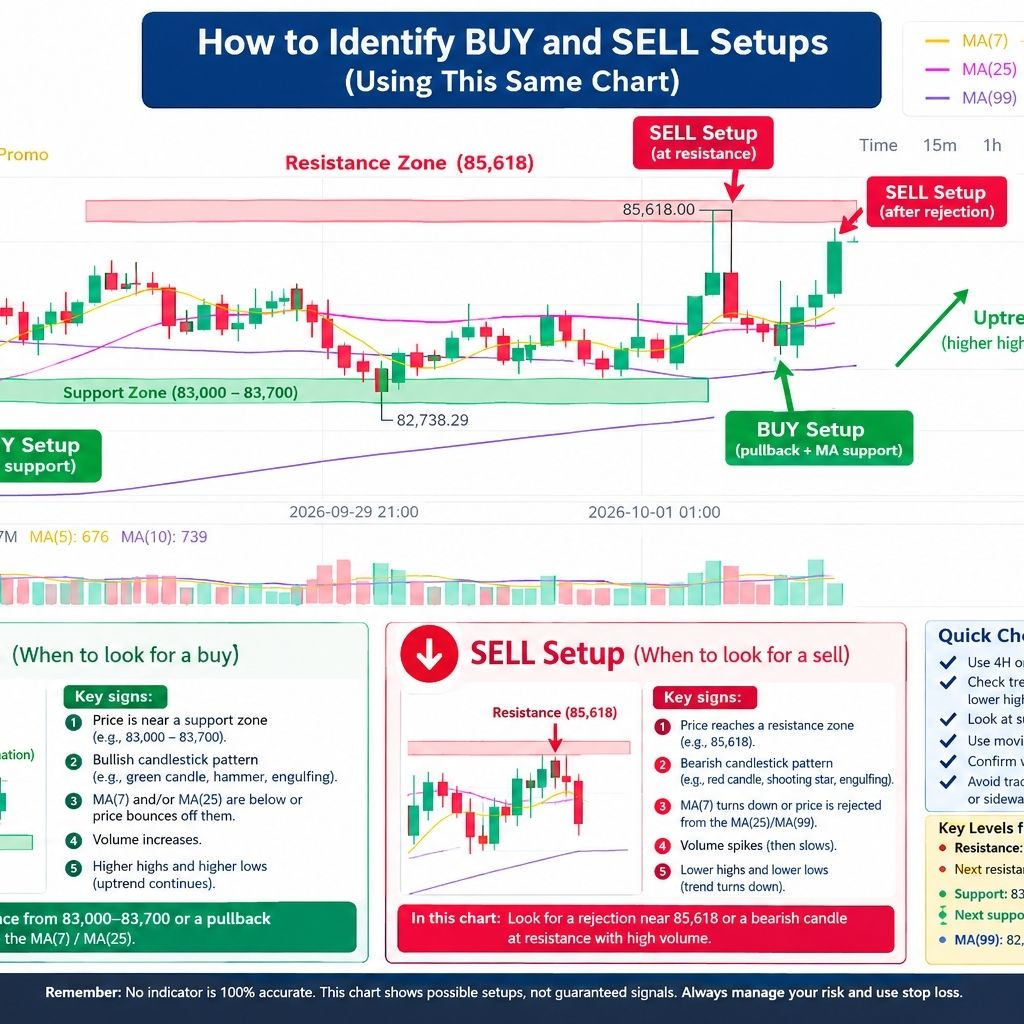
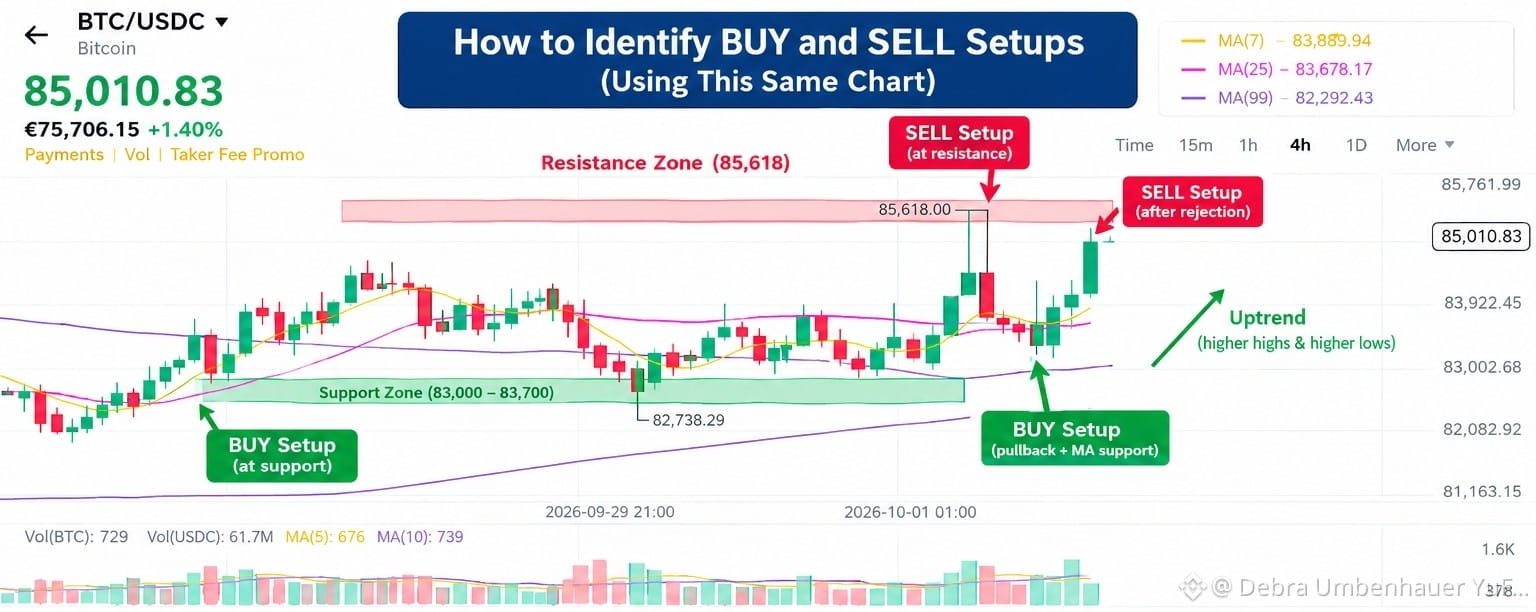
📊 How to Identify BUY and SELL Setups on the BTC/USDC 4H Chart$BTC The picture shows a BTC/USDC 4-hour chart with moving averages, support, resistance, candlesticks, and volume. The goal is not to predict the market with certainty, but to wait for several signals to line up before considering a trade.
🟢 1. How to identify a BUY setup
A potential BUY setup generally becomes more interesting when price comes down toward a support zone and then shows signs of bouncing.
In the picture, the main support area is approximately 83,000–83,700.
Look for these signals:
Price reaches support
BTC falls toward the support zone instead of buying after a large upward candle.
Price rejects the support
You may see a candle with a lower wick followed by a bullish candle. This suggests buyers are stepping in.
Moving averages provide support
In the screenshot:
MA(7) ≈ 83,890
MA(25) ≈ 83,678
MA(99) ≈ 82,292
Price staying above the shorter moving averages can support the idea that the short-term trend remains upward.
Volume confirms the move
A bounce accompanied by stronger volume is generally more meaningful than a bounce occurring on very low volume.
Higher highs and higher lows
This is one of the simplest ways to recognize an uptrend.
Example from the picture
Support → bounce → bullish candle → volume confirmation → possible BUY setup.
Don't automatically buy simply because price touches support. Wait for confirmation.
🔴 2. How to identify a SELL setup
A potential SELL setup can occur when price reaches a resistance zone and starts getting rejected.
In this picture, an important resistance is around 85,618, with the recent 24-hour high around 85,238.
Look for:
Price reaches resistance
Price fails to break through
A bearish candle or rejection wick appears.
Volume increases during the rejection.
The chart begins making lower highs and lower lows.
For example:
Resistance → rejection → bearish candle → confirmation → possible SELL setup.
Again, touching resistance alone isn't enough. Price can break through resistance instead.
📈 3. What the moving averages are telling you
The picture has three moving averages:
Indicator
Approx. value
MA(7)
83,890
MA(25)
83,678
MA(99)
82,292
Think of them as trend guides, not automatic BUY/SELL signals.
When price is above the moving averages and they are generally rising, the market structure is stronger.
When price falls below them and they begin turning downward, the trend is becoming weaker.
🟡 4. Support vs. resistance
Support
A price area where buyers have previously appeared.
In your chart:
83,000–83,700 is an important support area.
Resistance
A price area where sellers have previously appeared.
In your chart:
85,238–85,618 is an important area to watch.
The key idea is:
Buy setups are usually searched for near support after confirmation. Sell setups are usually searched for near resistance after confirmation.
📊 5. Why volume matters
The bars underneath the candles show volume.
Imagine BTC moves from 84,000 to 85,000.
If the move happens with strong volume, it provides more evidence that there was significant participation.
If the price moves upward but volume is very weak, you should be more cautious.
Volume is therefore best used as confirmation, rather than as a standalone signal.
🧠 6. The simple strategy to remember
🟢 BUY checklist
Support → rejection/bounce → bullish candle → volume → trend confirmation
🔴 SELL checklist
Resistance → rejection → bearish candle → volume → trend weakening
Don't trade simply because one candle is green or red.
⚠️ One very important lesson
The chart in your picture is 4H, meaning each candle represents four hours.
A candle can look bullish while it is still forming and then close differently. For that reason, beginners often wait for the candle to close before treating it as confirmation.
Also, no chart pattern guarantees a profit. A sensible trade plan should include a stop-loss so that one incorrect trade doesn't cause a large loss.
For your specific screenshot, the basic map is:
82,292 → 83,000–83,700 support → 85,238 recent high → 85,618 resistance
Those are the areas I would learn to watch first—not because they guarantee what BTC will do next, but because they give you a structured way to read the chart.
$BTC
📊 How to Identify BUY and SELL Setups on the BTC/USDC 4H Chart
$BTC The picture shows a BTC/USDC 4-hour chart with moving averages, support, resistance, candlesticks, and volume. The goal is not to predict the market with certainty, but to wait for several signals to line up before considering a trade.
🟢 1. How to identify a BUY setup
A potential BUY setup generally becomes more interesting when price comes down toward a support zone and then shows signs of bouncing.
In the picture, the main support area is approximately 83,000–83,700.
Look for these signals:
Price reaches support
BTC falls toward the support zone instead of buying after a large upward candle.
Price rejects the support
You may see a candle with a lower wick followed by a bullish candle. This suggests buyers are stepping in.
Moving averages provide support
In the screenshot:
MA(7) ≈ 83,890
MA(25) ≈ 83,678
MA(99) ≈ 82,292
Price staying above the shorter moving averages can support the idea that the short-term trend remains upward.
Volume confirms the move
A bounce accompanied by stronger volume is generally more meaningful than a bounce occurring on very low volume.
Higher highs and higher lows
This is one of the simplest ways to recognize an uptrend.
Example from the picture
Support → bounce → bullish candle → volume confirmation → possible BUY setup.
Don't automatically buy simply because price touches support. Wait for confirmation.
🔴 2. How to identify a SELL setup
A potential SELL setup can occur when price reaches a resistance zone and starts getting rejected.
In this picture, an important resistance is around 85,618, with the recent 24-hour high around 85,238.
Look for:
Price reaches resistance
Price fails to break through
A bearish candle or rejection wick appears.
Volume increases during the rejection.
The chart begins making lower highs and lower lows.
For example:
Resistance → rejection → bearish candle → confirmation → possible SELL setup.
Again, touching resistance alone isn't enough. Price can break through resistance instead.
📈 3. What the moving averages are telling you
The picture has three moving averages:
Indicator
Approx. value
MA(7)
83,890
MA(25)
83,678
MA(99)
82,292
Think of them as trend guides, not automatic BUY/SELL signals.
When price is above the moving averages and they are generally rising, the market structure is stronger.
When price falls below them and they begin turning downward, the trend is becoming weaker.
🟡 4. Support vs. resistance
Support
A price area where buyers have previously appeared.
In your chart:
83,000–83,700 is an important support area.
Resistance
A price area where sellers have previously appeared.
In your chart:
85,238–85,618 is an important area to watch.
The key idea is:
Buy setups are usually searched for near support after confirmation. Sell setups are usually searched for near resistance after confirmation.
📊 5. Why volume matters
The bars underneath the candles show volume.
Imagine BTC moves from 84,000 to 85,000.
If the move happens with strong volume, it provides more evidence that there was significant participation.
If the price moves upward but volume is very weak, you should be more cautious.
Volume is therefore best used as confirmation, rather than as a standalone signal.
🧠 6. The simple strategy to remember
🟢 BUY checklist
Support → rejection/bounce → bullish candle → volume → trend confirmation
🔴 SELL checklist
Resistance → rejection → bearish candle → volume → trend weakening
Don't trade simply because one candle is green or red.
⚠️ One very important lesson
The chart in your picture is 4H, meaning each candle represents four hours.
A candle can look bullish while it is still forming and then close differently. For that reason, beginners often wait for the candle to close before treating it as confirmation.
Also, no chart pattern guarantees a profit. A sensible trade plan should include a stop-loss so that one incorrect trade doesn't cause a large loss.
For your specific screenshot, the basic map is:
82,292 → 83,000–83,700 support → 85,238 recent high → 85,618 resistance
Those are the areas I would learn to watch first—not because they guarantee what BTC will do next, but because they give you a structured way to read the chart.
$BTC
87
🧠 The Biggest Battle in Crypto Is Not the MarketPeople often think trading is about finding the perfect entry.
I think there is another battle that is even more important:
Controlling yourself.
When Bitcoin #BTC rises, fear of missing out can make us buy too quickly. When #BTC alls, fear can make us sell without a plan.
The market does not know our emotions.
It does not care about our predictions.
It simply moves.
That is why I want to focus on three things:
Research. Patience. Discipline.
I may be right. I may be wrong. But every prediction gives me a chance to learn something new.
I don't want to follow the crowd blindly. I want to understand the market, make my own plan, and accept the result.
In crypto, protecting your capital and learning from every mistake can be more valuable than trying to be right every time.
⚠️ This is my personal market view, not financial advice. Always do your own research before investing.
🧠 The Biggest Battle in Crypto Is Not the Market
People often think trading is about finding the perfect entry.
I think there is another battle that is even more important:
Controlling yourself.
When Bitcoin #BTC rises, fear of missing out can make us buy too quickly. When #BTC alls, fear can make us sell without a plan.
The market does not know our emotions.
It does not care about our predictions.
It simply moves.
That is why I want to focus on three things:
Research. Patience. Discipline.
I may be right. I may be wrong. But every prediction gives me a chance to learn something new.
I don't want to follow the crowd blindly. I want to understand the market, make my own plan, and accept the result.
In crypto, protecting your capital and learning from every mistake can be more valuable than trying to be right every time.
⚠️ This is my personal market view, not financial advice. Always do your own research before investing.
84
🚨 The Market Is Testing Our Patience.The crypto market can change very quickly.
One day, Bitcoin (BTC) is rising, and everyone is excited. The next day, the market turns red, and fear starts spreading.
But this is the real lesson of crypto:
Do not let one green candle make you too confident, and do not let one red candle make you panic.
Many traders follow the crowd. When people see others buying, they also want to buy. When they see people selling, they become afraid and sell too.
But smart decisions should not come from fear or excitement. They should come from research, patience, and risk management.
I am watching Bitcoin closely, but I know one thing: no one can control the market.
My goal is not to prove that I am always right. My goal is to learn, share my ideas, and improve with every market cycle.
The market may surprise us—but every surprise can teach us something.
⚠️ This article is for education and personal market discussion, not financial advice. Always do your own research before making any investment decision.
🚨 The Market Is Testing Our Patience.
The crypto market can change very quickly.
One day, Bitcoin (BTC) is rising, and everyone is excited. The next day, the market turns red, and fear starts spreading.
But this is the real lesson of crypto:
Do not let one green candle make you too confident, and do not let one red candle make you panic.
Many traders follow the crowd. When people see others buying, they also want to buy. When they see people selling, they become afraid and sell too.
But smart decisions should not come from fear or excitement. They should come from research, patience, and risk management.
I am watching Bitcoin closely, but I know one thing: no one can control the market.
My goal is not to prove that I am always right. My goal is to learn, share my ideas, and improve with every market cycle.
The market may surprise us—but every surprise can teach us something.
⚠️ This article is for education and personal market discussion, not financial advice. Always do your own research before making any investment decision.
2
280
Bitcoin (BTC): A Market PredictionBitcoin (BTC): A Market Prediction.
The cryptocurrency market is attracting a lot of attention, especially Bitcoin #BTC @Square-Creator-a6b19761fc5e5
Many people believe that Bitcoin has entered a new bull market. However, I have a different view. I believe Bitcoin could experience a major correction and fall below $50,000.
This is only my personal market prediction. The market can move in unexpected ways, so investors should do their own research and understand the risks before making any decision.
If my prediction is wrong, I will accept it. Being wrong is part of learning. What matters is that we study the market, learn from our mistakes, and improve our understanding.
Bitcoin #BTC — Current price at the time of writing: around $85,000.
The future will decide whether this prediction is right or wrong.
Bitcoin (BTC): A Market Prediction
Bitcoin (BTC): A Market Prediction.
The cryptocurrency market is attracting a lot of attention, especially Bitcoin #BTC @BTC
Many people believe that Bitcoin has entered a new bull market. However, I have a different view. I believe Bitcoin could experience a major correction and fall below $50,000.
This is only my personal market prediction. The market can move in unexpected ways, so investors should do their own research and understand the risks before making any decision.
If my prediction is wrong, I will accept it. Being wrong is part of learning. What matters is that we study the market, learn from our mistakes, and improve our understanding.
Bitcoin #BTC — Current price at the time of writing: around $85,000.
The future will decide whether this prediction is right or wrong.
92
Log in to explore more content
Join global crypto users on Binance Square
⚡️ Get latest and useful information about crypto.
💬 Trusted by the world’s largest crypto exchange.
👍 Discover real insights from verified creators.
Email / Phone number