
kiri亏麻了
952 Posts

kiri亏麻了
Report
Block User
合约韭菜,现役土狗亏钱选手
亏过才知道哪些不能碰
加密x美股,链上行为分析
Smart Money 追踪,真实仓位记录
不喊单,只记录逻辑和结果
保佑2026不再亏钱

原创之星

Level 1 Creator
Open Trade
Frequent Trader
5.4 Years
63 Following
8.6K+ Followers
20.2K+ Liked
2 Badges
Posts
Portfolio
All
Quotes
Videos


·
--
Bullish
$BTC Today's price action was quite dramatic. In the Asian morning session, it opened around $78,650, briefly dipped to an intraday low of $77,797, and fell by more than 1%. But it then quickly found support and rebounded. Buying pressure picked up in the European session, followed by another push higher in the New York session, reaching a high of $79,672, just one step away from the $80,000 psychological level. Into the close, it consolidated at a high level around $79,400. The intraday range was about 2.4%, and it ultimately closed near the day's high.
From a structural perspective, today's V-shaped rebound is significant. After last Friday's non-farm payrolls release, BTC plunged 3.2% intraday, hitting a low near $77,700. Today, price climbed back above $79,000, showing that support around $78,000 has been recognized by the market and that short-term panic selling has been digested. Bulls showed solid support at key levels, and bears were unable to expand their gains.
$ETH Following the rebound but with weaker momentum
Ethereum also strengthened today, but its overall elasticity was weaker than BTC's. The intraday low was $2,447 and the high was $2,520, with a fluctuation of about 3%, noticeably smaller than BTC's 2.4% range. The ETH/BTC exchange rate weakened slightly today, slipping from around ~0.0315 in the morning to around ~0.0316.
What is worth noting is that ETH faced some selling pressure at the round-number level of $2,500. Multiple attempts in the evening to break above $2,520 failed to hold, and it pulled back to around $2,505 into the close. If tomorrow's CPI data is favorable, whether ETH can break through $2,520 will be the next test for bulls.
Overall market trading was relatively restrained today, without extending the panic sentiment seen after last Friday's non-farm payrolls report. The Fear and Greed Index has recovered somewhat from last week's lows, but it is still hovering in the "neutral" zone.
CME FedWatch shows the probability of a September rate hike remaining at 58%, and the market has basically priced in that expectation. Tomorrow's September CPI release will be the real catalyst for this week's direction:
If inflation comes in below expectations, the odds of a rate hike will fall and $80,000 will no longer be a hurdle for BTC; conversely, if inflation rebounds above expectations, the $78,000 support may face a second test.
Short-term support: BTC $78,500 / ETH $2,480
Short-term resistance: BTC $80,000 / ETH $2,520#Ripple游说推进CLARITY法案投票
{spot}(BTCUSDT)
$BTC Today's price action was quite dramatic. In the Asian morning session, it opened around $78,650, briefly dipped to an intraday low of $77,797, and fell by more than 1%. But it then quickly found support and rebounded. Buying pressure picked up in the European session, followed by another push higher in the New York session, reaching a high of $79,672, just one step away from the $80,000 psychological level. Into the close, it consolidated at a high level around $79,400. The intraday range was about 2.4%, and it ultimately closed near the day's high.
From a structural perspective, today's V-shaped rebound is significant. After last Friday's non-farm payrolls release, BTC plunged 3.2% intraday, hitting a low near $77,700. Today, price climbed back above $79,000, showing that support around $78,000 has been recognized by the market and that short-term panic selling has been digested. Bulls showed solid support at key levels, and bears were unable to expand their gains.
$ETH Following the rebound but with weaker momentum
Ethereum also strengthened today, but its overall elasticity was weaker than BTC's. The intraday low was $2,447 and the high was $2,520, with a fluctuation of about 3%, noticeably smaller than BTC's 2.4% range. The ETH/BTC exchange rate weakened slightly today, slipping from around ~0.0315 in the morning to around ~0.0316.
What is worth noting is that ETH faced some selling pressure at the round-number level of $2,500. Multiple attempts in the evening to break above $2,520 failed to hold, and it pulled back to around $2,505 into the close. If tomorrow's CPI data is favorable, whether ETH can break through $2,520 will be the next test for bulls.
Overall market trading was relatively restrained today, without extending the panic sentiment seen after last Friday's non-farm payrolls report. The Fear and Greed Index has recovered somewhat from last week's lows, but it is still hovering in the "neutral" zone.
CME FedWatch shows the probability of a September rate hike remaining at 58%, and the market has basically priced in that expectation. Tomorrow's September CPI release will be the real catalyst for this week's direction:
If inflation comes in below expectations, the odds of a rate hike will fall and $80,000 will no longer be a hurdle for BTC; conversely, if inflation rebounds above expectations, the $78,000 support may face a second test.
Short-term support: BTC $78,500 / ETH $2,480
Short-term resistance: BTC $80,000 / ETH $2,520#Ripple游说推进CLARITY法案投票
From a structural perspective, today's V-shaped rebound is significant. After last Friday's non-farm payrolls release, BTC plunged 3.2% intraday, hitting a low near $77,700. Today, price climbed back above $79,000, showing that support around $78,000 has been recognized by the market and that short-term panic selling has been digested. Bulls showed solid support at key levels, and bears were unable to expand their gains.
$ETH Following the rebound but with weaker momentum
Ethereum also strengthened today, but its overall elasticity was weaker than BTC's. The intraday low was $2,447 and the high was $2,520, with a fluctuation of about 3%, noticeably smaller than BTC's 2.4% range. The ETH/BTC exchange rate weakened slightly today, slipping from around ~0.0315 in the morning to around ~0.0316.
What is worth noting is that ETH faced some selling pressure at the round-number level of $2,500. Multiple attempts in the evening to break above $2,520 failed to hold, and it pulled back to around $2,505 into the close. If tomorrow's CPI data is favorable, whether ETH can break through $2,520 will be the next test for bulls.
Overall market trading was relatively restrained today, without extending the panic sentiment seen after last Friday's non-farm payrolls report. The Fear and Greed Index has recovered somewhat from last week's lows, but it is still hovering in the "neutral" zone.
CME FedWatch shows the probability of a September rate hike remaining at 58%, and the market has basically priced in that expectation. Tomorrow's September CPI release will be the real catalyst for this week's direction:
If inflation comes in below expectations, the odds of a rate hike will fall and $80,000 will no longer be a hurdle for BTC; conversely, if inflation rebounds above expectations, the $78,000 support may face a second test.
Short-term support: BTC $78,500 / ETH $2,480
Short-term resistance: BTC $80,000 / ETH $2,520#Ripple游说推进CLARITY法案投票
305
·
--
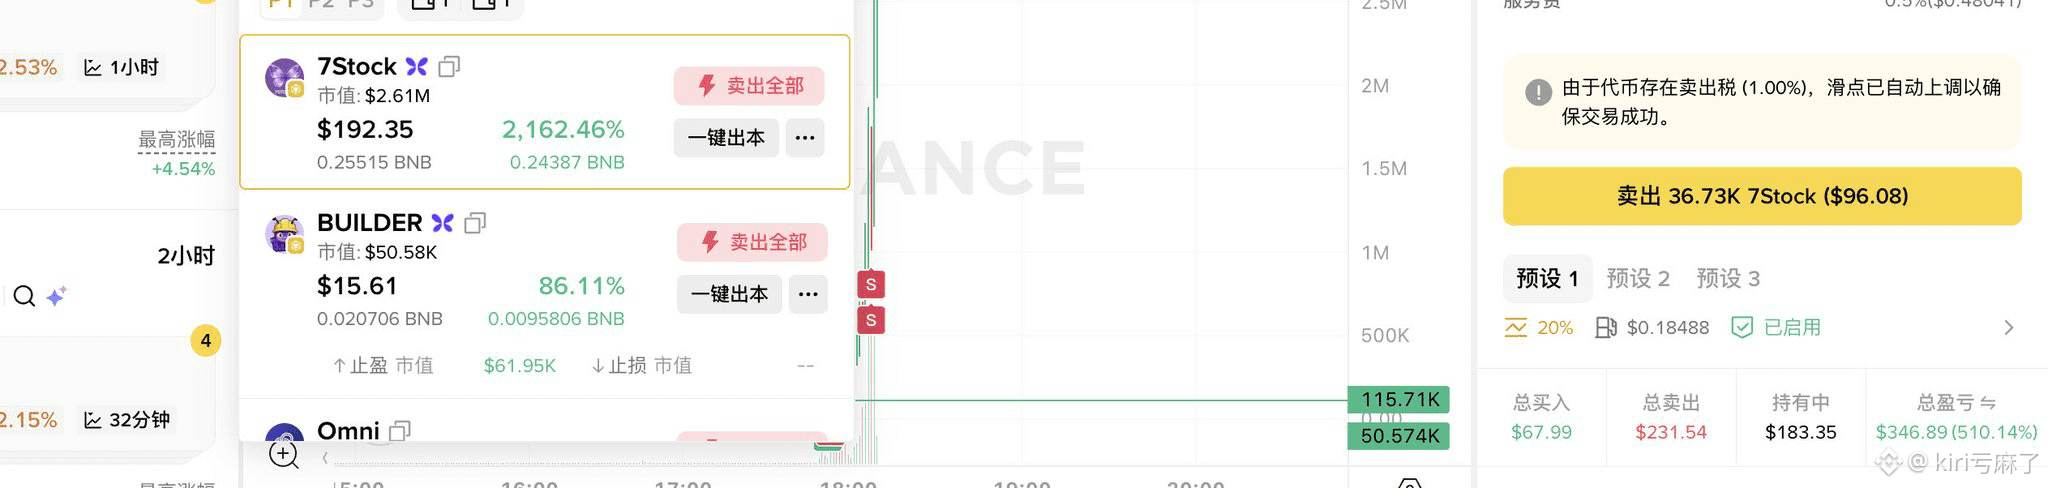
I can’t anymore—I ran, family members. Miracles only happen on bsc
#meme板块关注热点
I can’t anymore—I ran, family members. Miracles only happen on bsc
#meme板块关注热点
#meme板块关注热点

kiri亏麻了
·
--
BullishAfter getting harshly taught a lesson by FOMO, I finally understood the wallet signal system
I got beaten up by FOMO pretty badly. There were way too many signals at the front of the car, and it was dizzying—getting on meant I was afraid of chasing the price, but not getting on meant I was afraid of missing out. I was just a bundle of contradictions.
After I calmed down, I decided to sit down and study the wallet signal system.
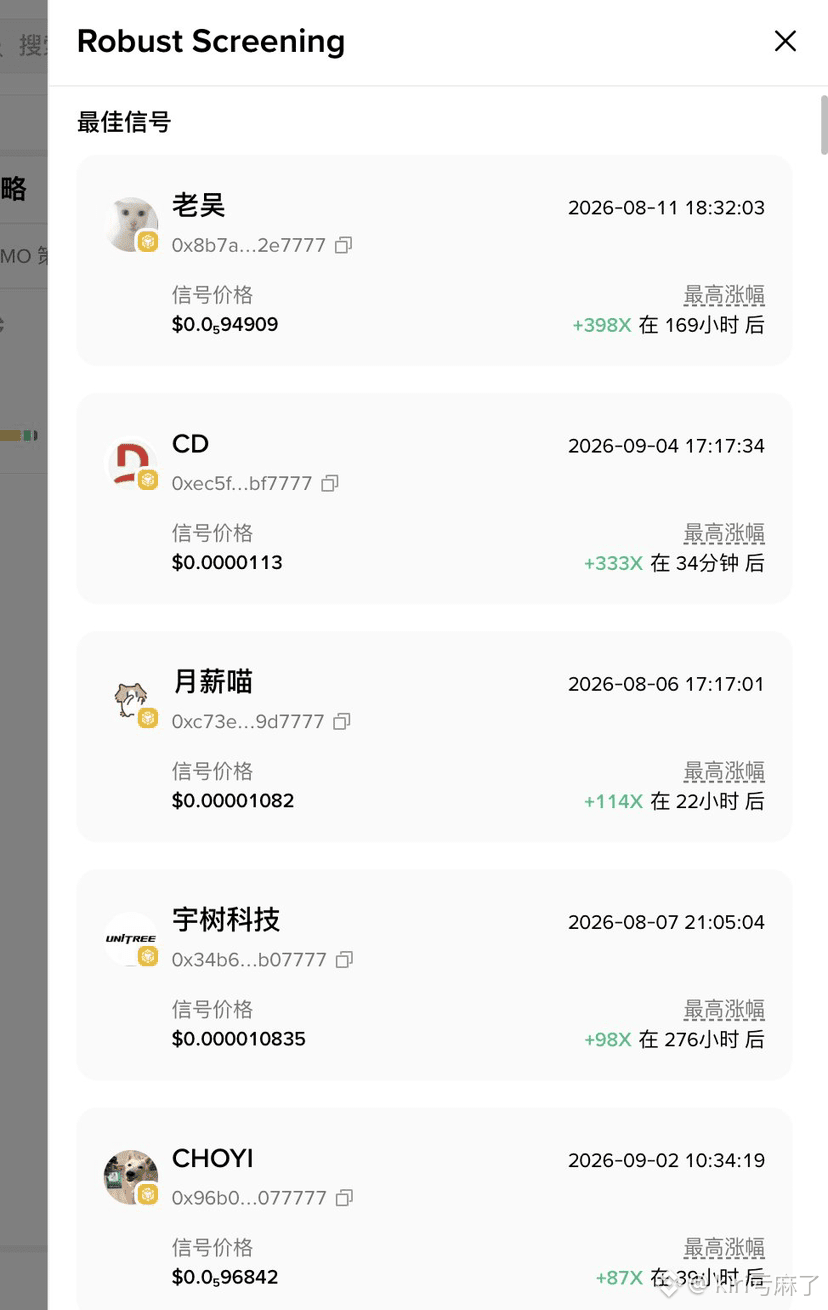
I have to say, the features in the An wallet have been getting better and better. After reducing 90% of the noise in the market, there are still plenty of “golden dogs” that can run out—it's just a question of whether you can catch them.
⚠️ First, let me make it clear: this system only helps you filter noise and improve discovery efficiency. It’s not a guaranteed-profity tool. On-chain signals ≠ buy signals. Your final judgment still has to be made by yourself.
📌 What does the signal system actually look at?
After opening the wallet app, you’ll see three types of signals:
1️⃣ Smart Money signals
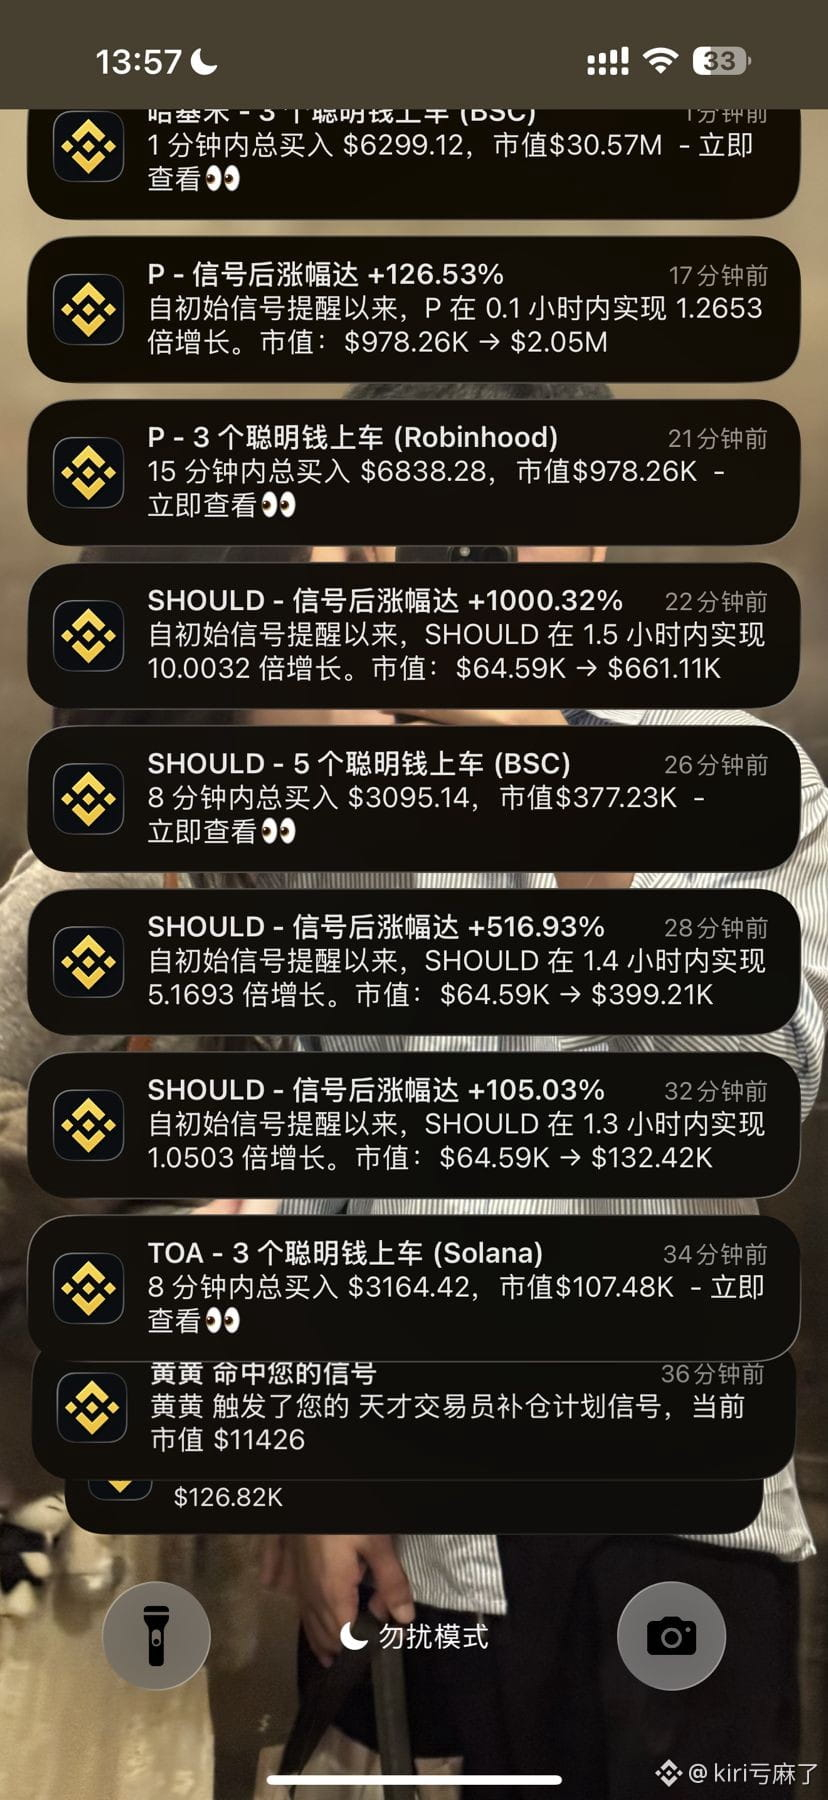
The system automatically tracks wallets with high historical returns on-chain. When these wallets buy a certain token, you’ll receive a push notification.
What to look at: buy time, buy amount, current unrealized profit, changes in holdings
2️⃣ Smart Money KOL signals
It tracks the on-chain wallet activities of the KOLs you follow.
What to look at: what they bought, how much they bought, and when they bought
Key point: a KOL’s public holdings may have delays, and they can even be a “contrarian indicator”—when they post, they may already be selling off.
3️⃣ Community hot signals
Signals aggregated based on overall market trading heat and sentiment analysis.
What to look at: which coin suddenly gets heavily bought, and discussion buzz spikes
Key point: these signals have the strongest lag. They’re best for verifying your own judgment—not for copy-trading directly.
📌 How to filter signals that are truly valuable
This is the core. The signal system pushes a lot every day—if you don’t filter, it’s basically the same as not paying attention.
- Look at the timing of the buy: when the signal pops up and the token has already risen more than 50%, skip it decisively. The advantage of smart money is “early.” The advantage of followers is “fast, but don’t chase the price.”
If you’re interested, feel free to use my Binance wallet invitation link 🔗:
https://web3.binance.com/zh-CN/m/referral?ref=KIRI123 (2️⃣0️⃣% fee reduction)
After binding, DM me 📮 and I’ll send you the configuration parameters
$BNB
#美伊互袭油轮冲突升级
I got beaten up by FOMO pretty badly. There were way too many signals at the front of the car, and it was dizzying—getting on meant I was afraid of chasing the price, but not getting on meant I was afraid of missing out. I was just a bundle of contradictions.
After I calmed down, I decided to sit down and study the wallet signal system.
I have to say, the features in the An wallet have been getting better and better. After reducing 90% of the noise in the market, there are still plenty of “golden dogs” that can run out—it's just a question of whether you can catch them.
⚠️ First, let me make it clear: this system only helps you filter noise and improve discovery efficiency. It’s not a guaranteed-profity tool. On-chain signals ≠ buy signals. Your final judgment still has to be made by yourself.
📌 What does the signal system actually look at?
After opening the wallet app, you’ll see three types of signals:
1️⃣ Smart Money signals
The system automatically tracks wallets with high historical returns on-chain. When these wallets buy a certain token, you’ll receive a push notification.
What to look at: buy time, buy amount, current unrealized profit, changes in holdings
2️⃣ Smart Money KOL signals
It tracks the on-chain wallet activities of the KOLs you follow.
What to look at: what they bought, how much they bought, and when they bought
Key point: a KOL’s public holdings may have delays, and they can even be a “contrarian indicator”—when they post, they may already be selling off.
3️⃣ Community hot signals
Signals aggregated based on overall market trading heat and sentiment analysis.
What to look at: which coin suddenly gets heavily bought, and discussion buzz spikes
Key point: these signals have the strongest lag. They’re best for verifying your own judgment—not for copy-trading directly.
📌 How to filter signals that are truly valuable
This is the core. The signal system pushes a lot every day—if you don’t filter, it’s basically the same as not paying attention.
- Look at the timing of the buy: when the signal pops up and the token has already risen more than 50%, skip it decisively. The advantage of smart money is “early.” The advantage of followers is “fast, but don’t chase the price.”
If you’re interested, feel free to use my Binance wallet invitation link 🔗:
https://web3.binance.com/zh-CN/m/referral?ref=KIRI123 (2️⃣0️⃣% fee reduction)
After binding, DM me 📮 and I’ll send you the configuration parameters
$BNB
#美伊互袭油轮冲突升级
1
241
·
--
Bearish
This Friday’s U.S. non-farm payroll data came in far above expectations, instantly igniting a frenzy on social media: “The Fed is going to raise rates!”—but CME FedWatch still shows the probability of a hike on 9/16 is stuck at 58%, almost unchanged from before the jobs report.
Bitcoin, however, was honest in its drop: within two hours it fell from $81,300 to $78,700, a 3.2% decline. But this is pretty normal—looking at 6 years of 79 non-farm releases, Bitcoin’s average reaction to any single report is only about ~2%.
The real question is: why isn’t “smart money” moving?
Because large institutions know this well—one month of employment data doesn’t equal a trend. Consumer confidence, the manufacturing PMI, and the unemployment rate trend have not strengthened in sync, so this jobs report looks more like noise than direction.
Besides, there’s still the CPI/PCE data on 9/11 coming up: that’s the real trigger that could move the rate-hike probability away from 58%.
Don’t let the social media chorus of rate-hike hype set your pace. Smart money’s pricing is always more reliable than the macro narrative on Twitter 📊#Zcash周涨45%创2016年来新高
{spot}(ZECUSDT)
This Friday’s U.S. non-farm payroll data came in far above expectations, instantly igniting a frenzy on social media: “The Fed is going to raise rates!”—but CME FedWatch still shows the probability of a hike on 9/16 is stuck at 58%, almost unchanged from before the jobs report.
Bitcoin, however, was honest in its drop: within two hours it fell from $81,300 to $78,700, a 3.2% decline. But this is pretty normal—looking at 6 years of 79 non-farm releases, Bitcoin’s average reaction to any single report is only about ~2%.
The real question is: why isn’t “smart money” moving?
Because large institutions know this well—one month of employment data doesn’t equal a trend. Consumer confidence, the manufacturing PMI, and the unemployment rate trend have not strengthened in sync, so this jobs report looks more like noise than direction.
Besides, there’s still the CPI/PCE data on 9/11 coming up: that’s the real trigger that could move the rate-hike probability away from 58%.
Don’t let the social media chorus of rate-hike hype set your pace. Smart money’s pricing is always more reliable than the macro narrative on Twitter 📊#Zcash周涨45%创2016年来新高
Bitcoin, however, was honest in its drop: within two hours it fell from $81,300 to $78,700, a 3.2% decline. But this is pretty normal—looking at 6 years of 79 non-farm releases, Bitcoin’s average reaction to any single report is only about ~2%.
The real question is: why isn’t “smart money” moving?
Because large institutions know this well—one month of employment data doesn’t equal a trend. Consumer confidence, the manufacturing PMI, and the unemployment rate trend have not strengthened in sync, so this jobs report looks more like noise than direction.
Besides, there’s still the CPI/PCE data on 9/11 coming up: that’s the real trigger that could move the rate-hike probability away from 58%.
Don’t let the social media chorus of rate-hike hype set your pace. Smart money’s pricing is always more reliable than the macro narrative on Twitter 📊#Zcash周涨45%创2016年来新高
210
·
--
Bullish
After getting harshly taught a lesson by FOMO, I finally understood the wallet signal system
I got beaten up by FOMO pretty badly. There were way too many signals at the front of the car, and it was dizzying—getting on meant I was afraid of chasing the price, but not getting on meant I was afraid of missing out. I was just a bundle of contradictions.
After I calmed down, I decided to sit down and study the wallet signal system.
I have to say, the features in the An wallet have been getting better and better. After reducing 90% of the noise in the market, there are still plenty of “golden dogs” that can run out—it's just a question of whether you can catch them.
⚠️ First, let me make it clear: this system only helps you filter noise and improve discovery efficiency. It’s not a guaranteed-profity tool. On-chain signals ≠ buy signals. Your final judgment still has to be made by yourself.
📌 What does the signal system actually look at?
After opening the wallet app, you’ll see three types of signals:
1️⃣ Smart Money signals
The system automatically tracks wallets with high historical returns on-chain. When these wallets buy a certain token, you’ll receive a push notification.
What to look at: buy time, buy amount, current unrealized profit, changes in holdings
2️⃣ Smart Money KOL signals
It tracks the on-chain wallet activities of the KOLs you follow.
What to look at: what they bought, how much they bought, and when they bought
Key point: a KOL’s public holdings may have delays, and they can even be a “contrarian indicator”—when they post, they may already be selling off.
3️⃣ Community hot signals
Signals aggregated based on overall market trading heat and sentiment analysis.
What to look at: which coin suddenly gets heavily bought, and discussion buzz spikes
Key point: these signals have the strongest lag. They’re best for verifying your own judgment—not for copy-trading directly.
📌 How to filter signals that are truly valuable
This is the core. The signal system pushes a lot every day—if you don’t filter, it’s basically the same as not paying attention.
- Look at the timing of the buy: when the signal pops up and the token has already risen more than 50%, skip it decisively. The advantage of smart money is “early.” The advantage of followers is “fast, but don’t chase the price.”
If you’re interested, feel free to use my Binance wallet invitation link 🔗:
[https://web3.binance.com/zh-CN/m/referral?ref=KIRI123](https://web3.binance.com/zh-CN/m/referral?ref=KIRI123) (2️⃣0️⃣% fee reduction)
After binding, DM me 📮 and I’ll send you the configuration parameters
$BNB
#美伊互袭油轮冲突升级
{spot}(BNBUSDT)
After getting harshly taught a lesson by FOMO, I finally understood the wallet signal system
I got beaten up by FOMO pretty badly. There were way too many signals at the front of the car, and it was dizzying—getting on meant I was afraid of chasing the price, but not getting on meant I was afraid of missing out. I was just a bundle of contradictions.
After I calmed down, I decided to sit down and study the wallet signal system.
I have to say, the features in the An wallet have been getting better and better. After reducing 90% of the noise in the market, there are still plenty of “golden dogs” that can run out—it's just a question of whether you can catch them.
⚠️ First, let me make it clear: this system only helps you filter noise and improve discovery efficiency. It’s not a guaranteed-profity tool. On-chain signals ≠ buy signals. Your final judgment still has to be made by yourself.
📌 What does the signal system actually look at?
After opening the wallet app, you’ll see three types of signals:
1️⃣ Smart Money signals
The system automatically tracks wallets with high historical returns on-chain. When these wallets buy a certain token, you’ll receive a push notification.
What to look at: buy time, buy amount, current unrealized profit, changes in holdings
2️⃣ Smart Money KOL signals
It tracks the on-chain wallet activities of the KOLs you follow.
What to look at: what they bought, how much they bought, and when they bought
Key point: a KOL’s public holdings may have delays, and they can even be a “contrarian indicator”—when they post, they may already be selling off.
3️⃣ Community hot signals
Signals aggregated based on overall market trading heat and sentiment analysis.
What to look at: which coin suddenly gets heavily bought, and discussion buzz spikes
Key point: these signals have the strongest lag. They’re best for verifying your own judgment—not for copy-trading directly.
📌 How to filter signals that are truly valuable
This is the core. The signal system pushes a lot every day—if you don’t filter, it’s basically the same as not paying attention.
- Look at the timing of the buy: when the signal pops up and the token has already risen more than 50%, skip it decisively. The advantage of smart money is “early.” The advantage of followers is “fast, but don’t chase the price.”
If you’re interested, feel free to use my Binance wallet invitation link 🔗:
https://web3.binance.com/zh-CN/m/referral?ref=KIRI123 (2️⃣0️⃣% fee reduction)
After binding, DM me 📮 and I’ll send you the configuration parameters
$BNB
#美伊互袭油轮冲突升级
I got beaten up by FOMO pretty badly. There were way too many signals at the front of the car, and it was dizzying—getting on meant I was afraid of chasing the price, but not getting on meant I was afraid of missing out. I was just a bundle of contradictions.
After I calmed down, I decided to sit down and study the wallet signal system.
I have to say, the features in the An wallet have been getting better and better. After reducing 90% of the noise in the market, there are still plenty of “golden dogs” that can run out—it's just a question of whether you can catch them.
⚠️ First, let me make it clear: this system only helps you filter noise and improve discovery efficiency. It’s not a guaranteed-profity tool. On-chain signals ≠ buy signals. Your final judgment still has to be made by yourself.
📌 What does the signal system actually look at?
After opening the wallet app, you’ll see three types of signals:
1️⃣ Smart Money signals
The system automatically tracks wallets with high historical returns on-chain. When these wallets buy a certain token, you’ll receive a push notification.
What to look at: buy time, buy amount, current unrealized profit, changes in holdings
2️⃣ Smart Money KOL signals
It tracks the on-chain wallet activities of the KOLs you follow.
What to look at: what they bought, how much they bought, and when they bought
Key point: a KOL’s public holdings may have delays, and they can even be a “contrarian indicator”—when they post, they may already be selling off.
3️⃣ Community hot signals
Signals aggregated based on overall market trading heat and sentiment analysis.
What to look at: which coin suddenly gets heavily bought, and discussion buzz spikes
Key point: these signals have the strongest lag. They’re best for verifying your own judgment—not for copy-trading directly.
📌 How to filter signals that are truly valuable
This is the core. The signal system pushes a lot every day—if you don’t filter, it’s basically the same as not paying attention.
- Look at the timing of the buy: when the signal pops up and the token has already risen more than 50%, skip it decisively. The advantage of smart money is “early.” The advantage of followers is “fast, but don’t chase the price.”
If you’re interested, feel free to use my Binance wallet invitation link 🔗:
https://web3.binance.com/zh-CN/m/referral?ref=KIRI123 (2️⃣0️⃣% fee reduction)
After binding, DM me 📮 and I’ll send you the configuration parameters
$BNB
#美伊互袭油轮冲突升级

1
2
753
·
--
Bullish
Zcash surges to $1,200; whale Garrett Jin’s short position is down $25.7 million 💸
The past three months of Zcash ($ZEC ) — its price action has made every short seller cry.
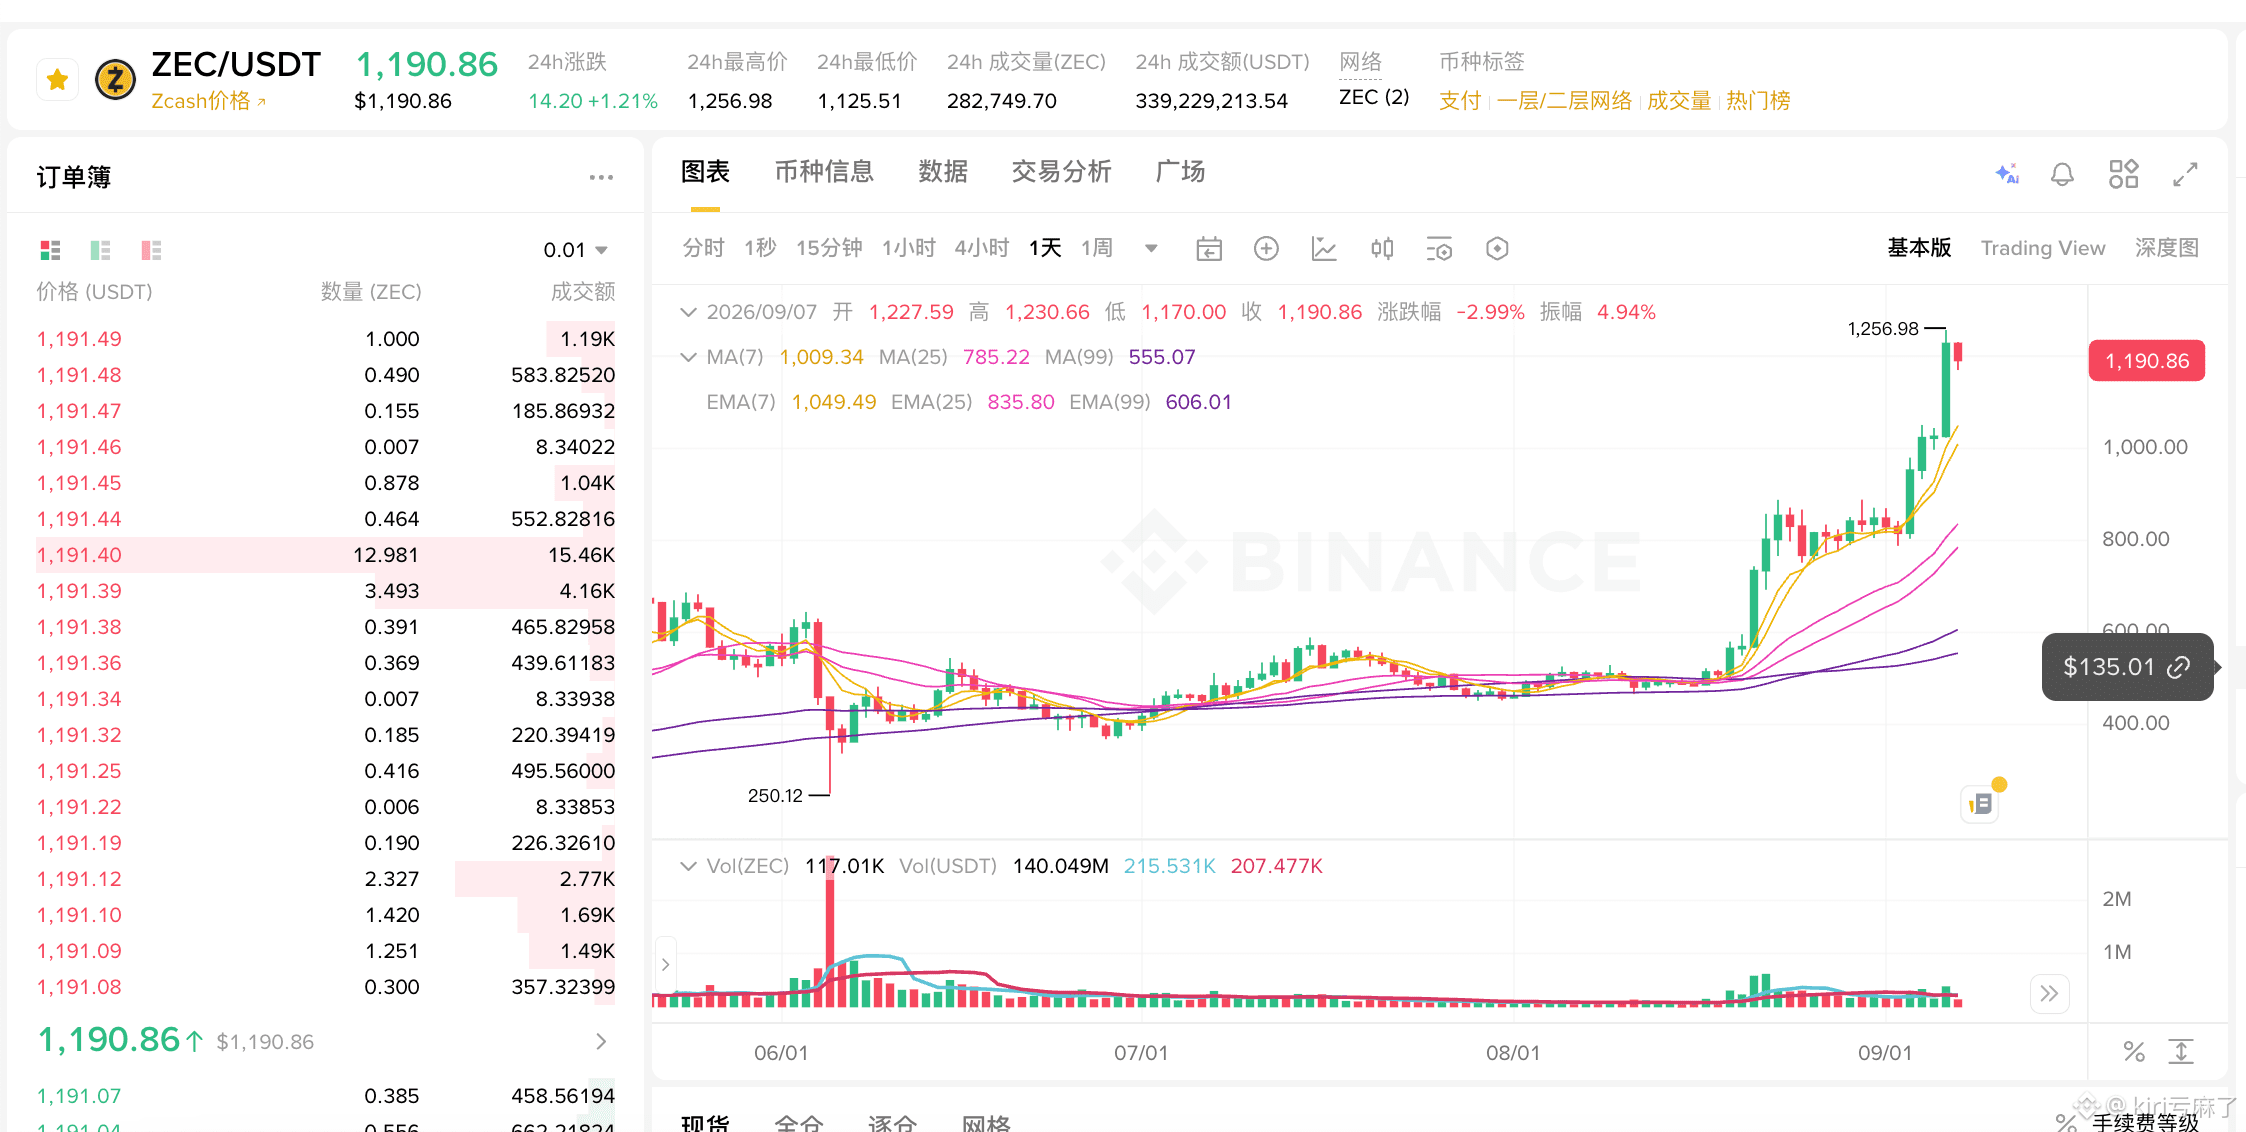
From around $400 in early July to breaking above $1,200 in September — a full 3x increase over three months, hitting a new 8-year high, with its market cap briefly surpassing Dogecoin ($DOGE ). This is the most insane stretch of trading the privacy coin sector has ever seen.
But someone is losing everything in this rally.
The former CEO of BitForex, and a well-known “insider whale” in crypto circles, Garrett Jin, opened a short position of 32,760 ZEC at an average price of $444 in early July this year. Back then, ZEC was still consolidating around the $400 level, with very little market attention on privacy coins, making the odds of a short look quite favorable.
But reality slapped him hard.
In less than three months, ZEC has skyrocketed to above $1,200, leaving Garrett Jin’s short firmly trapped. Based on the current price, the unrealized loss on this short position has already reached $25.7 million — roughly NT$820 million. This isn’t a small number; even for a whale, this is a failure that hurts badly.
Even more ironically, during the same period, Garrett Jin also held a long position worth $107 million in Bitcoin ($BTC ). On-chain data shows this BTC long is currently up by about $4.42 million — sounds pretty good, right? But to keep holding this long position, he has already paid funding fees as high as $2.05 million.
In other words, his original plan was a “hedge” strategy — short ZEC while going long BTC — using BTC’s rise to offset the downside risk ZEC might face. The result: ZEC didn’t drop; it surged 3x instead. Not only did the short position suffer massive losses, but profits from the BTC long were also eroded by high funding fees. The whole strategy collapsed completely — getting hit on both ends.
#zec
{spot}(ZECUSDT)
Zcash surges to $1,200; whale Garrett Jin’s short position is down $25.7 million 💸
The past three months of Zcash ($ZEC ) — its price action has made every short seller cry.
From around $400 in early July to breaking above $1,200 in September — a full 3x increase over three months, hitting a new 8-year high, with its market cap briefly surpassing Dogecoin ($DOGE ). This is the most insane stretch of trading the privacy coin sector has ever seen.
But someone is losing everything in this rally.
The former CEO of BitForex, and a well-known “insider whale” in crypto circles, Garrett Jin, opened a short position of 32,760 ZEC at an average price of $444 in early July this year. Back then, ZEC was still consolidating around the $400 level, with very little market attention on privacy coins, making the odds of a short look quite favorable.
But reality slapped him hard.
In less than three months, ZEC has skyrocketed to above $1,200, leaving Garrett Jin’s short firmly trapped. Based on the current price, the unrealized loss on this short position has already reached $25.7 million — roughly NT$820 million. This isn’t a small number; even for a whale, this is a failure that hurts badly.
Even more ironically, during the same period, Garrett Jin also held a long position worth $107 million in Bitcoin ($BTC ). On-chain data shows this BTC long is currently up by about $4.42 million — sounds pretty good, right? But to keep holding this long position, he has already paid funding fees as high as $2.05 million.
In other words, his original plan was a “hedge” strategy — short ZEC while going long BTC — using BTC’s rise to offset the downside risk ZEC might face. The result: ZEC didn’t drop; it surged 3x instead. Not only did the short position suffer massive losses, but profits from the BTC long were also eroded by high funding fees. The whole strategy collapsed completely — getting hit on both ends.
#zec
The past three months of Zcash ($ZEC ) — its price action has made every short seller cry.
From around $400 in early July to breaking above $1,200 in September — a full 3x increase over three months, hitting a new 8-year high, with its market cap briefly surpassing Dogecoin ($DOGE ). This is the most insane stretch of trading the privacy coin sector has ever seen.
But someone is losing everything in this rally.
The former CEO of BitForex, and a well-known “insider whale” in crypto circles, Garrett Jin, opened a short position of 32,760 ZEC at an average price of $444 in early July this year. Back then, ZEC was still consolidating around the $400 level, with very little market attention on privacy coins, making the odds of a short look quite favorable.
But reality slapped him hard.
In less than three months, ZEC has skyrocketed to above $1,200, leaving Garrett Jin’s short firmly trapped. Based on the current price, the unrealized loss on this short position has already reached $25.7 million — roughly NT$820 million. This isn’t a small number; even for a whale, this is a failure that hurts badly.
Even more ironically, during the same period, Garrett Jin also held a long position worth $107 million in Bitcoin ($BTC ). On-chain data shows this BTC long is currently up by about $4.42 million — sounds pretty good, right? But to keep holding this long position, he has already paid funding fees as high as $2.05 million.
In other words, his original plan was a “hedge” strategy — short ZEC while going long BTC — using BTC’s rise to offset the downside risk ZEC might face. The result: ZEC didn’t drop; it surged 3x instead. Not only did the short position suffer massive losses, but profits from the BTC long were also eroded by high funding fees. The whole strategy collapsed completely — getting hit on both ends.
#zec
933
·
--
Bearish
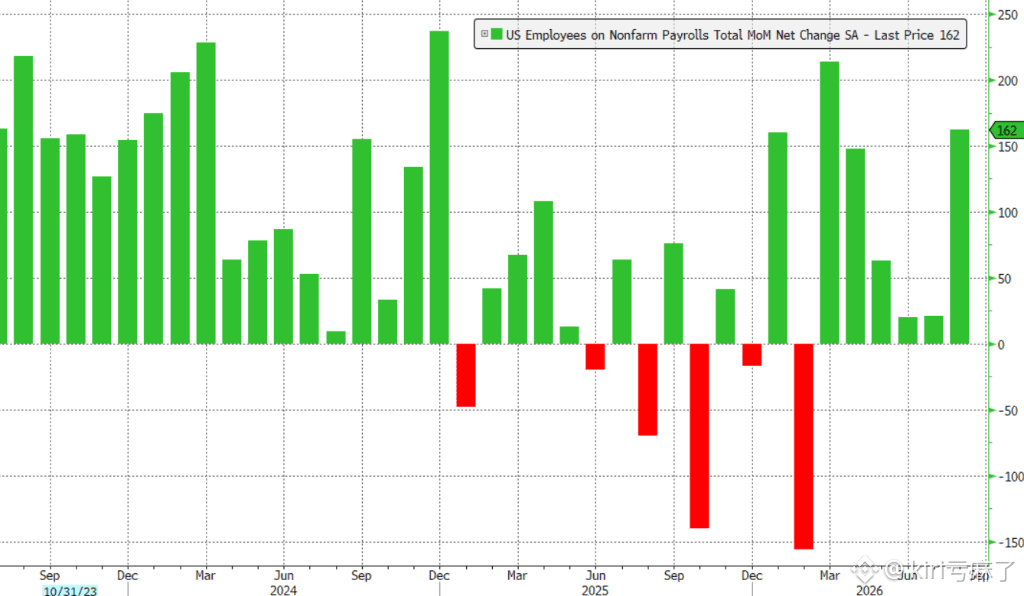
The nonfarm payrolls data absolutely exploded! 162,000 jobs crushed expectations, and recession panic was slapped awake.
Last night, the U.S. August nonfarm payrolls data was released, and the entire market was shocked.
162,000 jobs versus an expected 55,000: this was not just beating expectations, it smashed through the ceiling of all forecasts.
What really made me gasp was the major reversal in the prior two months’ data: July was revised from -23,000 to +21,000, and June was revised up from 20,000 to 31,000. In three months, the economy essentially picked up 55,000 jobs for free. Last month the whole market was panicking that “recession is here,” but last night this set of data left it completely disoriented.
The structure has bright spots, but also hidden risks:
Leisure and hospitality +62,000, food services and drinking places +59,000, manufacturing +16,000 — a broad recovery, and the data looks very good.
But information jobs at -23,000 are a warning sign: cloud, publishing, and web hosting were cut by a combined 15,000 jobs, and the AI substitution effect is starting to show up in employment data. This is not a small matter — if it continues, it will gradually drag on consumption.
Wage growth of 3.1% year over year is moderate and manageable, giving no reason for inflation to spiral out of control. The number of people forced into “part-time for economic reasons” plunged by 414,000 in a single month, showing that job quality is improving, not being propped up by marginal positions.
The market repriced, and expectations for a September rate hike surged:
But there is a contradiction here: higher rate-hike expectations = a stronger dollar = pressure on risk assets, which is the opposite of BTC breaking above $81K last night.
Last night’s rally was emotional relief after recession fears were disproven, not a move driven by rate-hike expectations. The real test is next week’s CPI: if inflation sticks above 3%, that will be the real stress test for risk assets.
I remain constructive on the short-term rebound, but don’t chase it at higher levels; wait for a pullback and then buy in. As I told you yesterday, don’t chase strength — at least then you won’t get trapped and can buy back on dips. Information-sector layoffs are the key risk to watch over the next 6 to 12 months — once AI replacement becomes a trend, consumption will be slowly eroded, and by then strong employment won’t be enough to support the market.
💸 Reminder to those who are losing money: the most dangerous time is when the data looks good, because everyone forgets the risks while cheering.
⚠️ Not investment advice. Make your own judgment and strictly follow stop-loss rules.
#美国8月新增就业16.2万近预期三倍
{spot}(BTCUSDT)
The nonfarm payrolls data absolutely exploded! 162,000 jobs crushed expectations, and recession panic was slapped awake.
Last night, the U.S. August nonfarm payrolls data was released, and the entire market was shocked.
162,000 jobs versus an expected 55,000: this was not just beating expectations, it smashed through the ceiling of all forecasts.
What really made me gasp was the major reversal in the prior two months’ data: July was revised from -23,000 to +21,000, and June was revised up from 20,000 to 31,000. In three months, the economy essentially picked up 55,000 jobs for free. Last month the whole market was panicking that “recession is here,” but last night this set of data left it completely disoriented.
The structure has bright spots, but also hidden risks:
Leisure and hospitality +62,000, food services and drinking places +59,000, manufacturing +16,000 — a broad recovery, and the data looks very good.
But information jobs at -23,000 are a warning sign: cloud, publishing, and web hosting were cut by a combined 15,000 jobs, and the AI substitution effect is starting to show up in employment data. This is not a small matter — if it continues, it will gradually drag on consumption.
Wage growth of 3.1% year over year is moderate and manageable, giving no reason for inflation to spiral out of control. The number of people forced into “part-time for economic reasons” plunged by 414,000 in a single month, showing that job quality is improving, not being propped up by marginal positions.
The market repriced, and expectations for a September rate hike surged:
But there is a contradiction here: higher rate-hike expectations = a stronger dollar = pressure on risk assets, which is the opposite of BTC breaking above $81K last night.
Last night’s rally was emotional relief after recession fears were disproven, not a move driven by rate-hike expectations. The real test is next week’s CPI: if inflation sticks above 3%, that will be the real stress test for risk assets.
I remain constructive on the short-term rebound, but don’t chase it at higher levels; wait for a pullback and then buy in. As I told you yesterday, don’t chase strength — at least then you won’t get trapped and can buy back on dips. Information-sector layoffs are the key risk to watch over the next 6 to 12 months — once AI replacement becomes a trend, consumption will be slowly eroded, and by then strong employment won’t be enough to support the market.
💸 Reminder to those who are losing money: the most dangerous time is when the data looks good, because everyone forgets the risks while cheering.
⚠️ Not investment advice. Make your own judgment and strictly follow stop-loss rules.
#美国8月新增就业16.2万近预期三倍
Last night, the U.S. August nonfarm payrolls data was released, and the entire market was shocked.
162,000 jobs versus an expected 55,000: this was not just beating expectations, it smashed through the ceiling of all forecasts.
What really made me gasp was the major reversal in the prior two months’ data: July was revised from -23,000 to +21,000, and June was revised up from 20,000 to 31,000. In three months, the economy essentially picked up 55,000 jobs for free. Last month the whole market was panicking that “recession is here,” but last night this set of data left it completely disoriented.
The structure has bright spots, but also hidden risks:
Leisure and hospitality +62,000, food services and drinking places +59,000, manufacturing +16,000 — a broad recovery, and the data looks very good.
But information jobs at -23,000 are a warning sign: cloud, publishing, and web hosting were cut by a combined 15,000 jobs, and the AI substitution effect is starting to show up in employment data. This is not a small matter — if it continues, it will gradually drag on consumption.
Wage growth of 3.1% year over year is moderate and manageable, giving no reason for inflation to spiral out of control. The number of people forced into “part-time for economic reasons” plunged by 414,000 in a single month, showing that job quality is improving, not being propped up by marginal positions.
The market repriced, and expectations for a September rate hike surged:
But there is a contradiction here: higher rate-hike expectations = a stronger dollar = pressure on risk assets, which is the opposite of BTC breaking above $81K last night.
Last night’s rally was emotional relief after recession fears were disproven, not a move driven by rate-hike expectations. The real test is next week’s CPI: if inflation sticks above 3%, that will be the real stress test for risk assets.
I remain constructive on the short-term rebound, but don’t chase it at higher levels; wait for a pullback and then buy in. As I told you yesterday, don’t chase strength — at least then you won’t get trapped and can buy back on dips. Information-sector layoffs are the key risk to watch over the next 6 to 12 months — once AI replacement becomes a trend, consumption will be slowly eroded, and by then strong employment won’t be enough to support the market.
💸 Reminder to those who are losing money: the most dangerous time is when the data looks good, because everyone forgets the risks while cheering.
⚠️ Not investment advice. Make your own judgment and strictly follow stop-loss rules.
#美国8月新增就业16.2万近预期三倍
kiri亏麻了
·
--
Bullish🔥 BTC jumps to $81K, ETH stands at $2.5K, short in the air of $550 million wiped out overnight
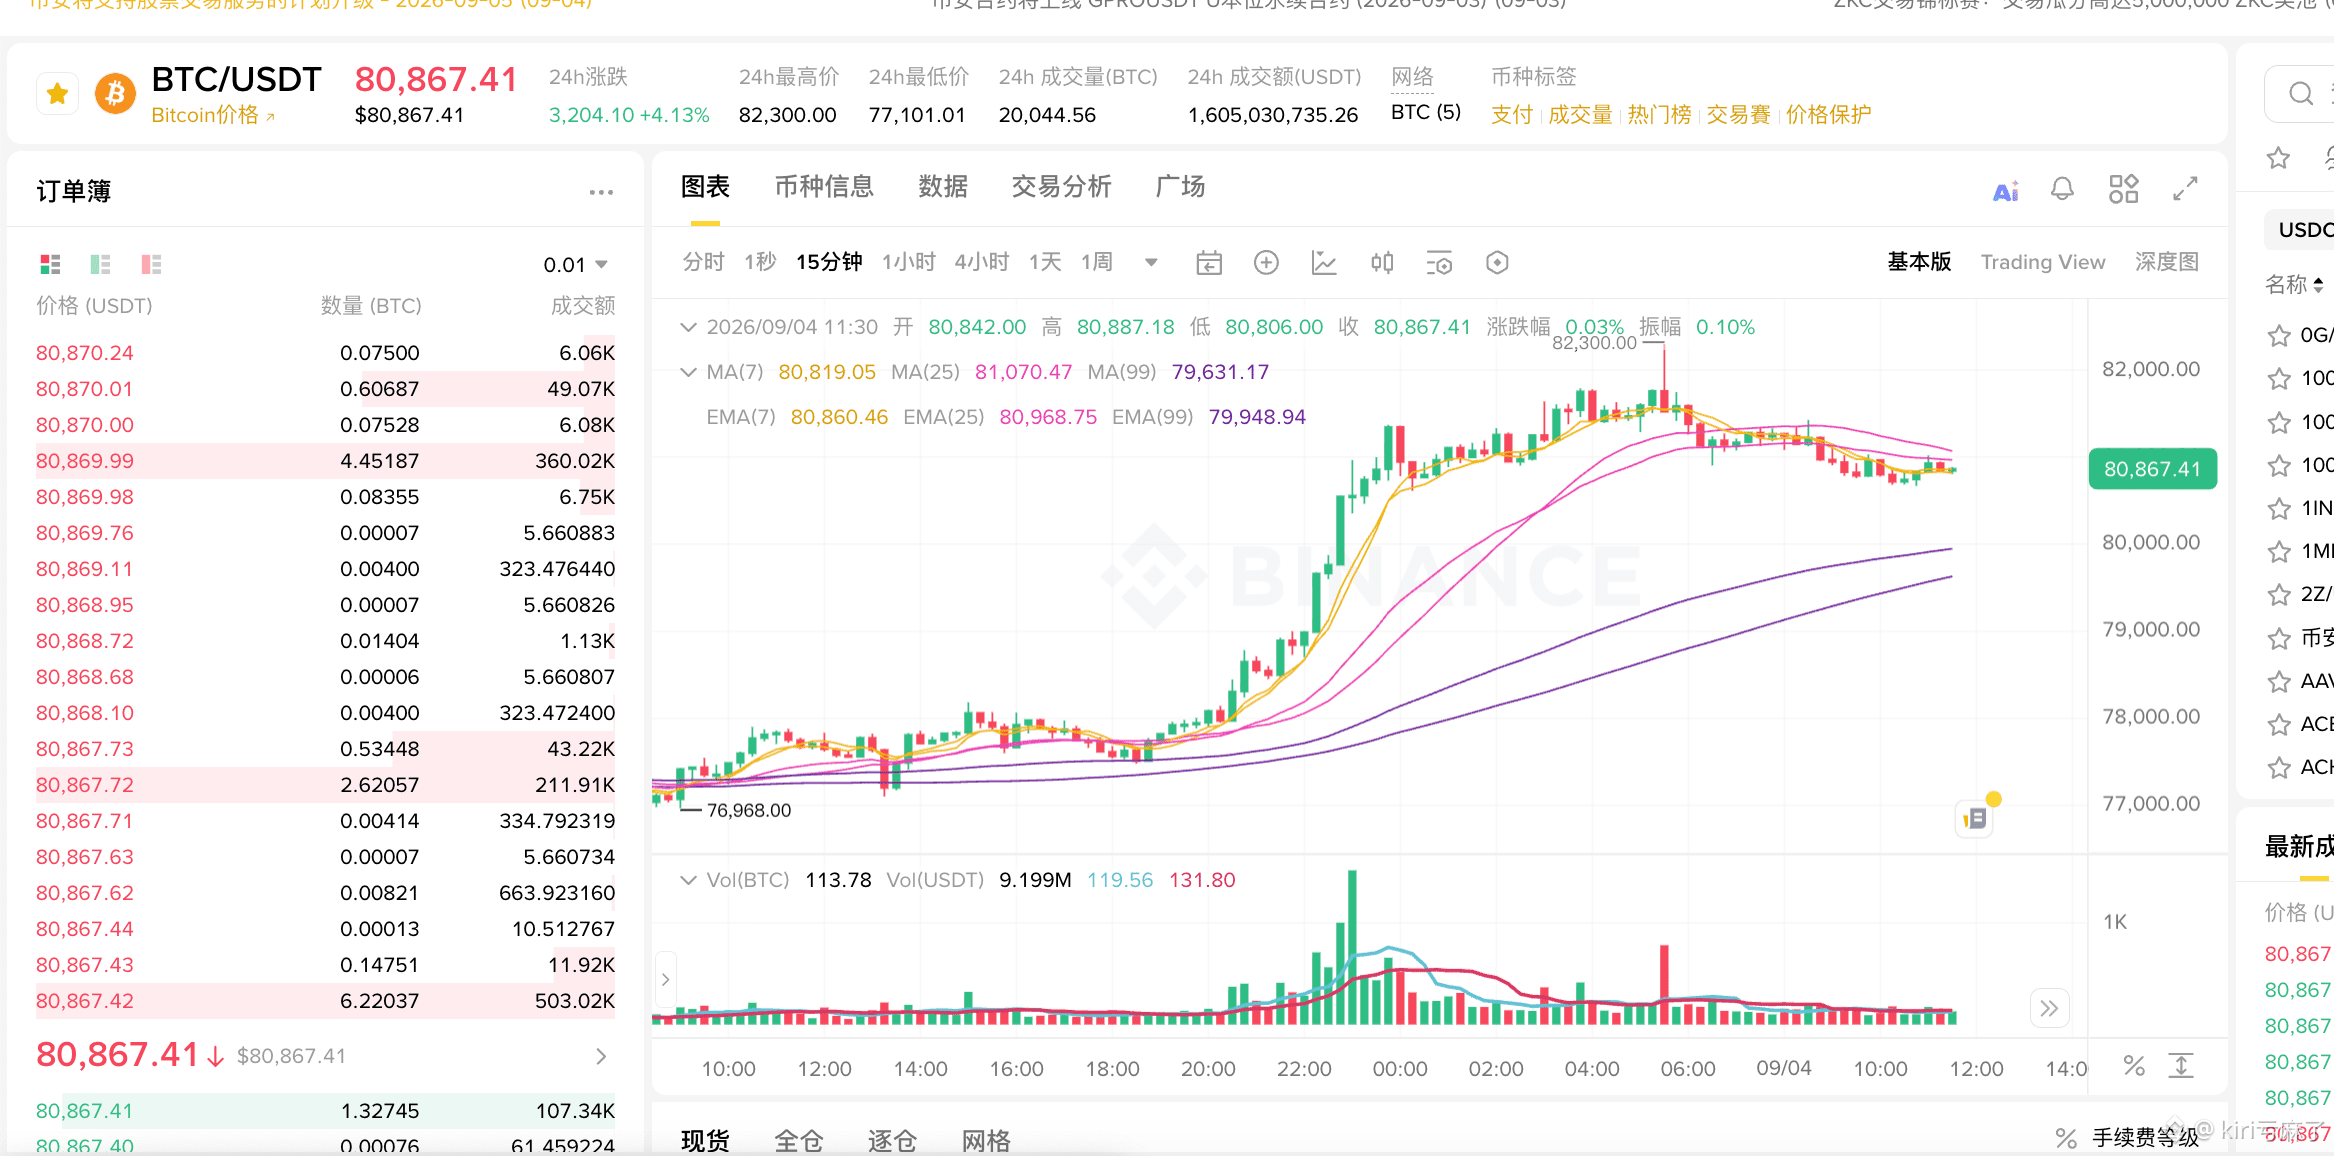
This morning, my朋友圈 exploded directly. Bitcoin breaks $81,000, Ethereum returns to $2,500, and in the past 24 hours the entire market saw liquidations totaling $555 million. Shorts at $471 million, long/short ratio 5.6 : 1—this isn’t a rebound, it’s a short squeeze.
What happened? Three things.
1. The Fed goes quiet (hawk-to-dove shift)
Fed governor Waller hinted that September may pause rate hikes. Immediately, the 10-year Treasury yield fell to 4.74%, and U.S. stocks collectively logged the biggest single-day gain since August. On top of that, Trump sent calming signals to Iran. The double resonance of “dovish Fed + easing geopolitics” kicks off crypto—high beta assets—leading the rally.
2. Institutions quietly add positions
Standard Chartered officially launched BTC/ETH spot trading in the UAE, and SoFi partnered with Kraken to connect banking settlement channels—traditional finance pipelines are being wired up faster.
3. Technicals: trend confirmed, but short-term overbought
BTC closed at $81,270. RSI hit 73, entering the overbought zone. All moving averages—SMA20/50/200—are aligned bullish, and price holds above the mid-band. Overhead pressure: $82,300 → $86,823; support below: $74,797 (SMA20) → $69,604.
ETH closed at $2,508. RSI at 67.5 is strong but not overbought; moving averages are also in a bullish arrangement. ETH is steadier than BTC. Overhead pressure: $2,567 → $2,781; support below: $2,331 → $2,066.
The Fear & Greed Index rebounded to 74, officially entering the Greed zone.
💡 My take
BTC: After breaking $82,300, it will likely accelerate to test $85,000–$86,000. But with RSI 73 and narrowing MACD momentum, the risk/reward of chasing is poor. A more sensible play is to wait for a pullback to $78,000–$79,000, then scale in once it stabilizes. Place your stop-loss below $74,797.
ETH: Current RSI is not overbought, and catch-up upside to $2,700–$2,800 is a highly likely event. Hold spot confidently—don’t mess around.
One-sentence summary: The Fed turns dovish + institutions move in + a technical breakout—all three align, confirming the trend. But RSI 73 is already overbought—don’t catch knives at the top. Waiting for a pullback to get in is what the old-school smart “long-term traders” do.
💸 A reminder to myself: Never chase pumps. Always use a stop-loss.
⚠️ Not investment advice—make your own judgment and strictly stick to your stop-loss.
#美国初请失业金人数升至20.6万
This morning, my朋友圈 exploded directly. Bitcoin breaks $81,000, Ethereum returns to $2,500, and in the past 24 hours the entire market saw liquidations totaling $555 million. Shorts at $471 million, long/short ratio 5.6 : 1—this isn’t a rebound, it’s a short squeeze.
What happened? Three things.
1. The Fed goes quiet (hawk-to-dove shift)
Fed governor Waller hinted that September may pause rate hikes. Immediately, the 10-year Treasury yield fell to 4.74%, and U.S. stocks collectively logged the biggest single-day gain since August. On top of that, Trump sent calming signals to Iran. The double resonance of “dovish Fed + easing geopolitics” kicks off crypto—high beta assets—leading the rally.
2. Institutions quietly add positions
Standard Chartered officially launched BTC/ETH spot trading in the UAE, and SoFi partnered with Kraken to connect banking settlement channels—traditional finance pipelines are being wired up faster.
3. Technicals: trend confirmed, but short-term overbought
BTC closed at $81,270. RSI hit 73, entering the overbought zone. All moving averages—SMA20/50/200—are aligned bullish, and price holds above the mid-band. Overhead pressure: $82,300 → $86,823; support below: $74,797 (SMA20) → $69,604.
ETH closed at $2,508. RSI at 67.5 is strong but not overbought; moving averages are also in a bullish arrangement. ETH is steadier than BTC. Overhead pressure: $2,567 → $2,781; support below: $2,331 → $2,066.
The Fear & Greed Index rebounded to 74, officially entering the Greed zone.
💡 My take
BTC: After breaking $82,300, it will likely accelerate to test $85,000–$86,000. But with RSI 73 and narrowing MACD momentum, the risk/reward of chasing is poor. A more sensible play is to wait for a pullback to $78,000–$79,000, then scale in once it stabilizes. Place your stop-loss below $74,797.
ETH: Current RSI is not overbought, and catch-up upside to $2,700–$2,800 is a highly likely event. Hold spot confidently—don’t mess around.
One-sentence summary: The Fed turns dovish + institutions move in + a technical breakout—all three align, confirming the trend. But RSI 73 is already overbought—don’t catch knives at the top. Waiting for a pullback to get in is what the old-school smart “long-term traders” do.
💸 A reminder to myself: Never chase pumps. Always use a stop-loss.
⚠️ Not investment advice—make your own judgment and strictly stick to your stop-loss.
#美国初请失业金人数升至20.6万
2.4k
·
--
Bullish
🔥 BTC jumps to $81K, ETH stands at $2.5K, short in the air of $550 million wiped out overnight
This morning, my朋友圈 exploded directly. Bitcoin breaks $81,000, Ethereum returns to $2,500, and in the past 24 hours the entire market saw liquidations totaling $555 million. Shorts at $471 million, long/short ratio 5.6 : 1—this isn’t a rebound, it’s a short squeeze.
What happened? Three things.
1. The Fed goes quiet (hawk-to-dove shift)
Fed governor Waller hinted that September may pause rate hikes. Immediately, the 10-year Treasury yield fell to 4.74%, and U.S. stocks collectively logged the biggest single-day gain since August. On top of that, Trump sent calming signals to Iran. The double resonance of “dovish Fed + easing geopolitics” kicks off crypto—high beta assets—leading the rally.
2. Institutions quietly add positions
Standard Chartered officially launched BTC/ETH spot trading in the UAE, and SoFi partnered with Kraken to connect banking settlement channels—traditional finance pipelines are being wired up faster.
3. Technicals: trend confirmed, but short-term overbought
BTC closed at $81,270. RSI hit 73, entering the overbought zone. All moving averages—SMA20/50/200—are aligned bullish, and price holds above the mid-band. Overhead pressure: $82,300 → $86,823; support below: $74,797 (SMA20) → $69,604.
ETH closed at $2,508. RSI at 67.5 is strong but not overbought; moving averages are also in a bullish arrangement. ETH is steadier than BTC. Overhead pressure: $2,567 → $2,781; support below: $2,331 → $2,066.
The Fear & Greed Index rebounded to 74, officially entering the Greed zone.
💡 My take
BTC: After breaking $82,300, it will likely accelerate to test $85,000–$86,000. But with RSI 73 and narrowing MACD momentum, the risk/reward of chasing is poor. A more sensible play is to wait for a pullback to $78,000–$79,000, then scale in once it stabilizes. Place your stop-loss below $74,797.
ETH: Current RSI is not overbought, and catch-up upside to $2,700–$2,800 is a highly likely event. Hold spot confidently—don’t mess around.
One-sentence summary: The Fed turns dovish + institutions move in + a technical breakout—all three align, confirming the trend. But RSI 73 is already overbought—don’t catch knives at the top. Waiting for a pullback to get in is what the old-school smart “long-term traders” do.
💸 A reminder to myself: Never chase pumps. Always use a stop-loss.
⚠️ Not investment advice—make your own judgment and strictly stick to your stop-loss.
#美国初请失业金人数升至20.6万
{spot}(BTCUSDT)
🔥 BTC jumps to $81K, ETH stands at $2.5K, short in the air of $550 million wiped out overnight
This morning, my朋友圈 exploded directly. Bitcoin breaks $81,000, Ethereum returns to $2,500, and in the past 24 hours the entire market saw liquidations totaling $555 million. Shorts at $471 million, long/short ratio 5.6 : 1—this isn’t a rebound, it’s a short squeeze.
What happened? Three things.
1. The Fed goes quiet (hawk-to-dove shift)
Fed governor Waller hinted that September may pause rate hikes. Immediately, the 10-year Treasury yield fell to 4.74%, and U.S. stocks collectively logged the biggest single-day gain since August. On top of that, Trump sent calming signals to Iran. The double resonance of “dovish Fed + easing geopolitics” kicks off crypto—high beta assets—leading the rally.
2. Institutions quietly add positions
Standard Chartered officially launched BTC/ETH spot trading in the UAE, and SoFi partnered with Kraken to connect banking settlement channels—traditional finance pipelines are being wired up faster.
3. Technicals: trend confirmed, but short-term overbought
BTC closed at $81,270. RSI hit 73, entering the overbought zone. All moving averages—SMA20/50/200—are aligned bullish, and price holds above the mid-band. Overhead pressure: $82,300 → $86,823; support below: $74,797 (SMA20) → $69,604.
ETH closed at $2,508. RSI at 67.5 is strong but not overbought; moving averages are also in a bullish arrangement. ETH is steadier than BTC. Overhead pressure: $2,567 → $2,781; support below: $2,331 → $2,066.
The Fear & Greed Index rebounded to 74, officially entering the Greed zone.
💡 My take
BTC: After breaking $82,300, it will likely accelerate to test $85,000–$86,000. But with RSI 73 and narrowing MACD momentum, the risk/reward of chasing is poor. A more sensible play is to wait for a pullback to $78,000–$79,000, then scale in once it stabilizes. Place your stop-loss below $74,797.
ETH: Current RSI is not overbought, and catch-up upside to $2,700–$2,800 is a highly likely event. Hold spot confidently—don’t mess around.
One-sentence summary: The Fed turns dovish + institutions move in + a technical breakout—all three align, confirming the trend. But RSI 73 is already overbought—don’t catch knives at the top. Waiting for a pullback to get in is what the old-school smart “long-term traders” do.
💸 A reminder to myself: Never chase pumps. Always use a stop-loss.
⚠️ Not investment advice—make your own judgment and strictly stick to your stop-loss.
#美国初请失业金人数升至20.6万
This morning, my朋友圈 exploded directly. Bitcoin breaks $81,000, Ethereum returns to $2,500, and in the past 24 hours the entire market saw liquidations totaling $555 million. Shorts at $471 million, long/short ratio 5.6 : 1—this isn’t a rebound, it’s a short squeeze.
What happened? Three things.
1. The Fed goes quiet (hawk-to-dove shift)
Fed governor Waller hinted that September may pause rate hikes. Immediately, the 10-year Treasury yield fell to 4.74%, and U.S. stocks collectively logged the biggest single-day gain since August. On top of that, Trump sent calming signals to Iran. The double resonance of “dovish Fed + easing geopolitics” kicks off crypto—high beta assets—leading the rally.
2. Institutions quietly add positions
Standard Chartered officially launched BTC/ETH spot trading in the UAE, and SoFi partnered with Kraken to connect banking settlement channels—traditional finance pipelines are being wired up faster.
3. Technicals: trend confirmed, but short-term overbought
BTC closed at $81,270. RSI hit 73, entering the overbought zone. All moving averages—SMA20/50/200—are aligned bullish, and price holds above the mid-band. Overhead pressure: $82,300 → $86,823; support below: $74,797 (SMA20) → $69,604.
ETH closed at $2,508. RSI at 67.5 is strong but not overbought; moving averages are also in a bullish arrangement. ETH is steadier than BTC. Overhead pressure: $2,567 → $2,781; support below: $2,331 → $2,066.
The Fear & Greed Index rebounded to 74, officially entering the Greed zone.
💡 My take
BTC: After breaking $82,300, it will likely accelerate to test $85,000–$86,000. But with RSI 73 and narrowing MACD momentum, the risk/reward of chasing is poor. A more sensible play is to wait for a pullback to $78,000–$79,000, then scale in once it stabilizes. Place your stop-loss below $74,797.
ETH: Current RSI is not overbought, and catch-up upside to $2,700–$2,800 is a highly likely event. Hold spot confidently—don’t mess around.
One-sentence summary: The Fed turns dovish + institutions move in + a technical breakout—all three align, confirming the trend. But RSI 73 is already overbought—don’t catch knives at the top. Waiting for a pullback to get in is what the old-school smart “long-term traders” do.
💸 A reminder to myself: Never chase pumps. Always use a stop-loss.
⚠️ Not investment advice—make your own judgment and strictly stick to your stop-loss.
#美国初请失业金人数升至20.6万
1
1
424
·
--
Article
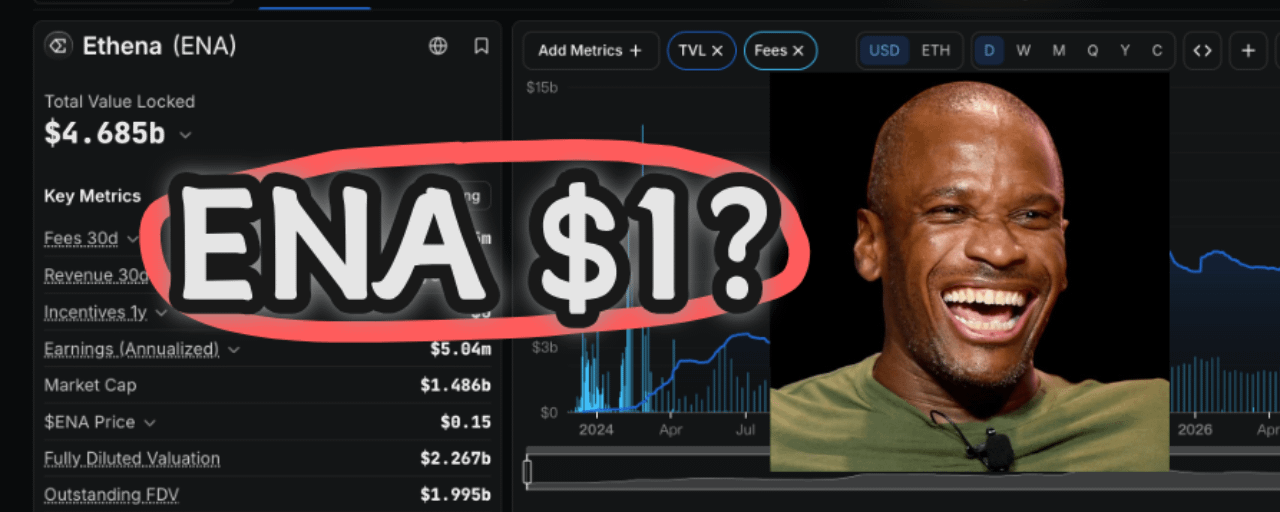
ENA Market In-Depth Analysis: When a Shakeout Meets Key Support, Can the $1 Dream Come True?Recently, many friends have commented asking what I think about ENA, especially after seeing big V accounts calling for buys and saying ENA can reach $1, including terms like "n****". Should you believe it? Over the past week, this coin has put on a very classic “pump—pullback” move: it surged from $0.1359 up to $0.1881, then consolidated in a high-range trading pattern. For this kind of structure, it’s actually worth digging deeper rather than focusing only on a one-direction market. Today, we’ll thoroughly break down ENA’s current situation from three angles—(1) candlestick structure, (2) key levels, and (3) trading rhythm—based on the context behind those buy calls. We’ll also answer the most painful question of all: can ENA really reach $1?
ENA Market In-Depth Analysis: When a Shakeout Meets Key Support, Can the $1 Dream Come True?
Recently, many friends have commented asking what I think about ENA, especially after seeing big V accounts calling for buys and saying ENA can reach $1, including terms like "n****". Should you believe it? Over the past week, this coin has put on a very classic “pump—pullback” move: it surged from $0.1359 up to $0.1881, then consolidated in a high-range trading pattern. For this kind of structure, it’s actually worth digging deeper rather than focusing only on a one-direction market. Today, we’ll thoroughly break down ENA’s current situation from three angles—(1) candlestick structure, (2) key levels, and (3) trading rhythm—based on the context behind those buy calls. We’ll also answer the most painful question of all: can ENA really reach $1?
2
807
·
--
Bearish
GM Young Master 🌞
After waking up from a nap, mainstream coins all got wiped out: $BTC -1.38%, $ETH -2.21%, $SOL -3.29%. SOL is leading the decline; the biggest pullback pressure is on the high-beta assets. Given that 10Y U.S. Treasury yields are still sitting at a high 4.796%, it’s really not surprising.
Last night, U.S. stocks also fell: S&P -0.71%, Nasdaq -1.03%, with tech stocks taking the lead. Rates drag valuations; risk appetite shrinks—it's hard for crypto to stay unaffected.
The fear index is still hovering in the “greed” zone around 63, but at times like this, greed is often the most expensive contrarian indicator. History has repeatedly proven that when the fear index is above 60 and people still rush in, odds are high—about 6 to 7 times out of 10—you end up getting trapped.
But what’s truly interesting is always on-chain.
Over at ETH, there’s a big fish bleeding: on Hyperliquid, someone is long ETH with 25x leverage, with a position size of $98.0 million. They’re only $6.3k away from liquidation; they burn $4.3 million per week.
Another BIT-related entity added to the ETH longs, bringing them to 33,000 ETH (about $79.3 million). Currently they’re down $2.48 million, ranking as the fifth-largest position. Sharks eating sharks—this kind of signal is more real than any technical indicator. I don’t know whether they’ll survive in the end, but I know that every time you see position data like this, the direction retail investors tend to take is usually wrong.
Another one worth looking at twice is $arb. After Robinhood Chain went live for two months, fee revenue is $13.05 million, annualized at $110 million. In traditional internet products, that kind of number is top-tier growth.
$1.3 million flowed into the Arbitrum ecosystem, and over the past two weeks, ARB has risen 46.7%. But don’t get too excited yet: on September 23, 139.2 million ARB will be unlocked, and the sell pressure then will require real money to absorb. On the same day, TD Cowen cut its BTC year-end target from $141,000 down to $97,500. The strategist backed off first—so why would you think you can be more accurate than institutions?
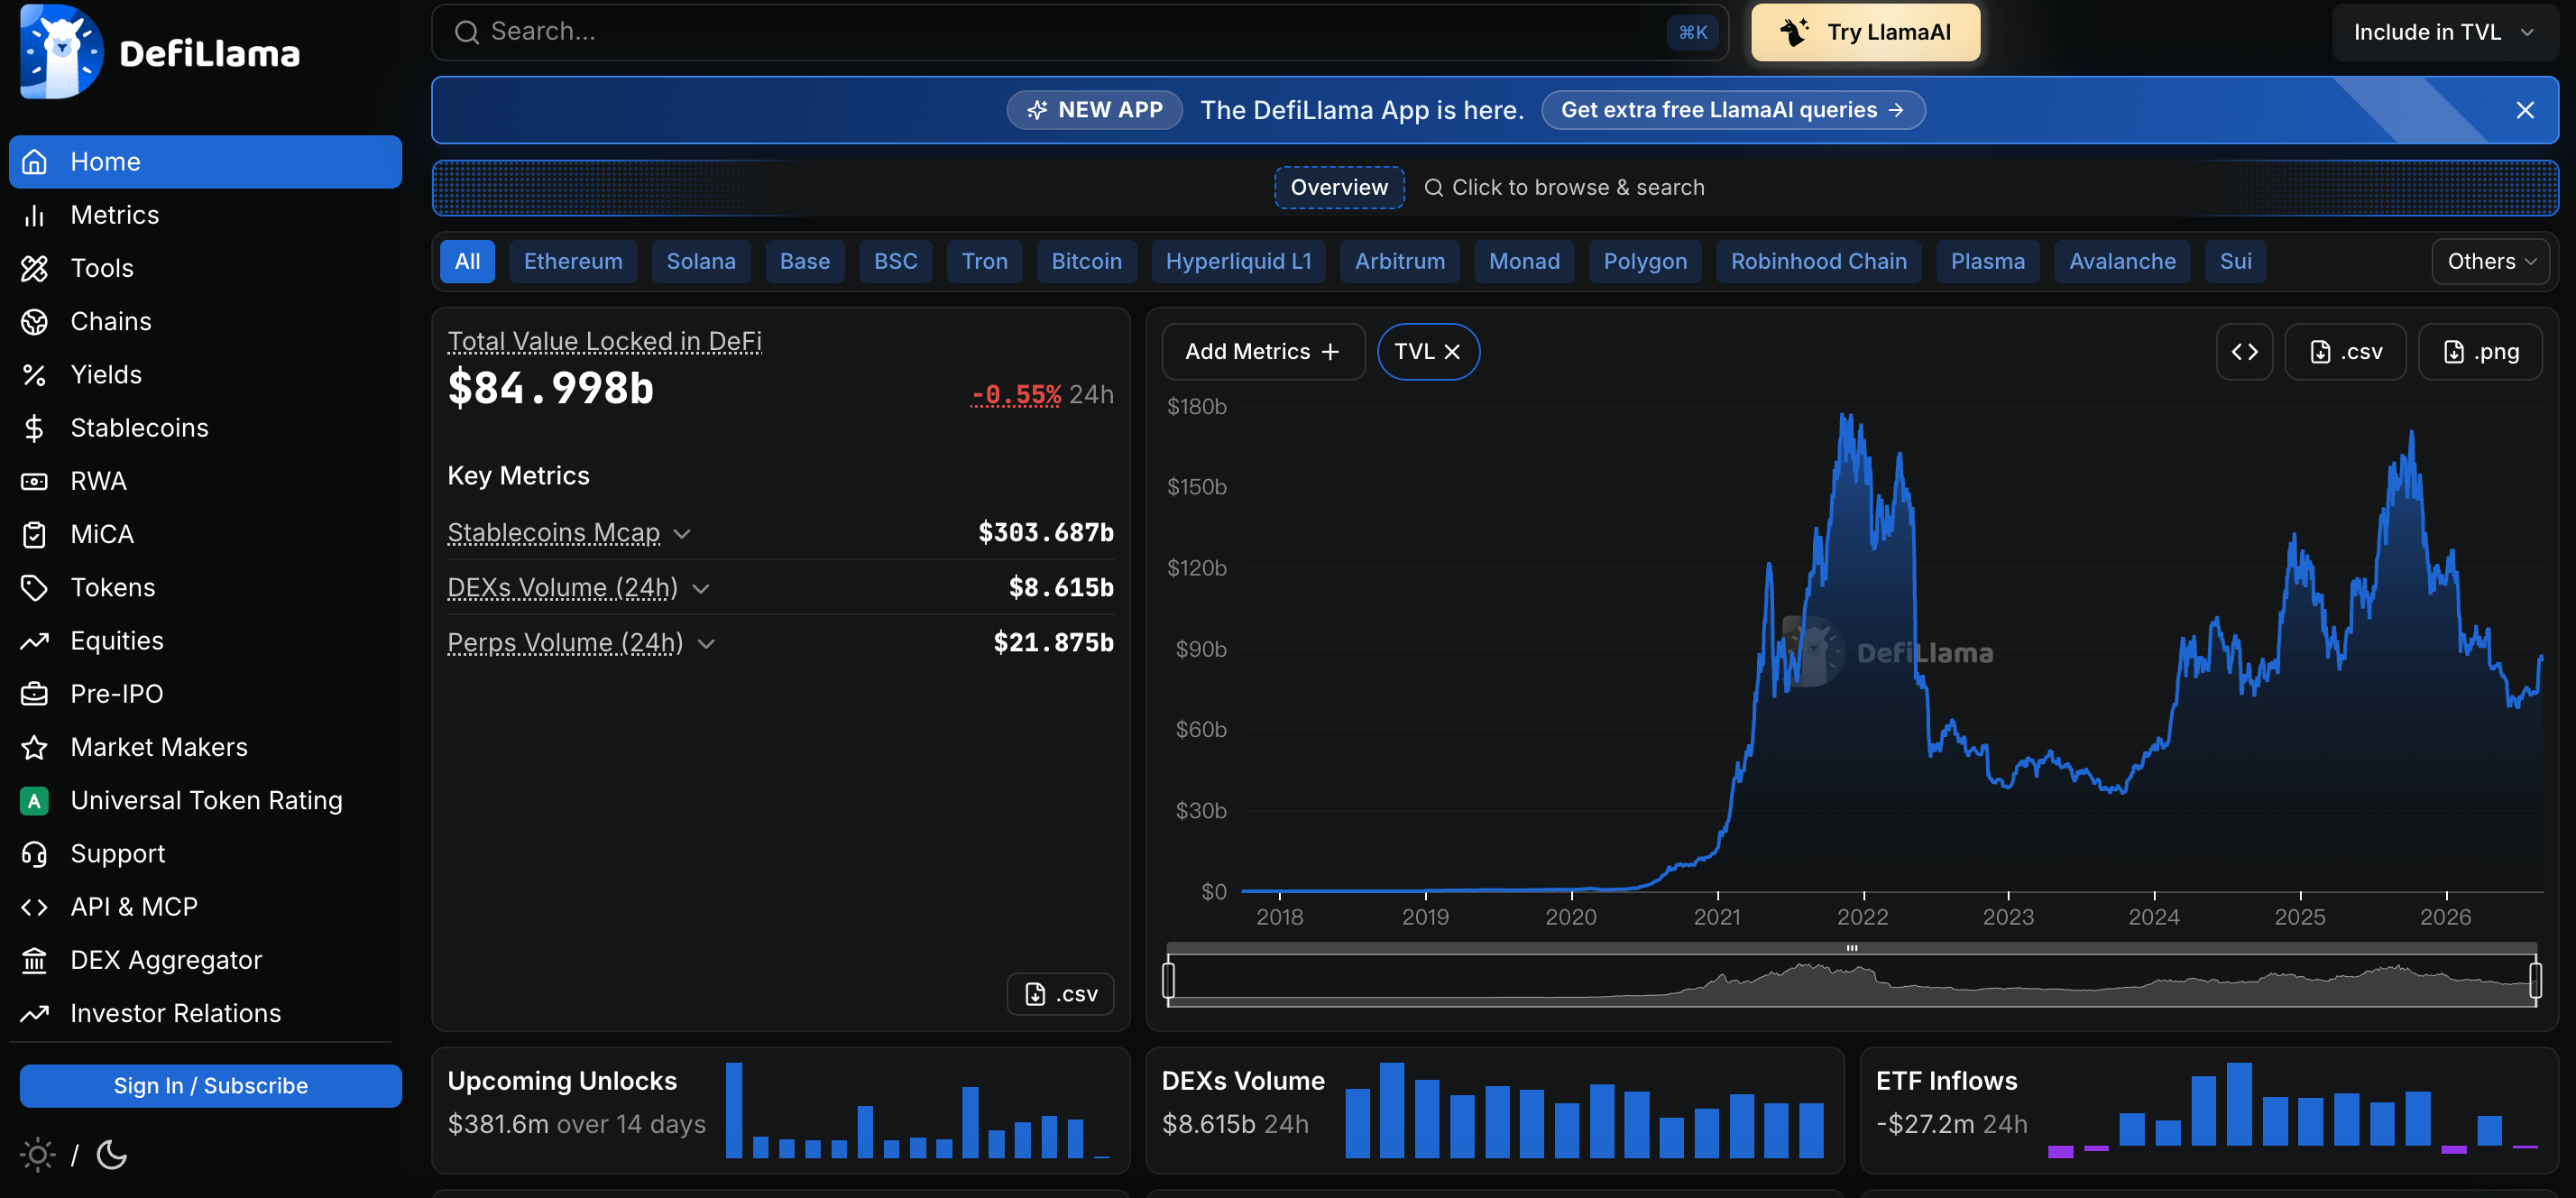
DeFi TVL is also falling across the board: $Lido -2.2%, $Aave -2.5%, Binance Staked ETH -2.5%. Even mainstream protocols are bleeding, which suggests fewer people are betting on the future while funds are locked on-chain.
It’s not that nobody believes in Web3—it's that everyone is more willing to hold stablecoins and wait for signals.
The U.S. Dollar Index (DXY) is up slightly by 0.08%; crude oil is up 0.75%; and gold is down 0.93%:
The classic stagflation combo—everything is going up, but your wallet isn’t 📉
#美联储加息概率升至68%
{future}(牛来USDT)
GM Young Master 🌞
After waking up from a nap, mainstream coins all got wiped out: $BTC -1.38%, $ETH -2.21%, $SOL -3.29%. SOL is leading the decline; the biggest pullback pressure is on the high-beta assets. Given that 10Y U.S. Treasury yields are still sitting at a high 4.796%, it’s really not surprising.
Last night, U.S. stocks also fell: S&P -0.71%, Nasdaq -1.03%, with tech stocks taking the lead. Rates drag valuations; risk appetite shrinks—it's hard for crypto to stay unaffected.
The fear index is still hovering in the “greed” zone around 63, but at times like this, greed is often the most expensive contrarian indicator. History has repeatedly proven that when the fear index is above 60 and people still rush in, odds are high—about 6 to 7 times out of 10—you end up getting trapped.
But what’s truly interesting is always on-chain.
Over at ETH, there’s a big fish bleeding: on Hyperliquid, someone is long ETH with 25x leverage, with a position size of $98.0 million. They’re only $6.3k away from liquidation; they burn $4.3 million per week.
Another BIT-related entity added to the ETH longs, bringing them to 33,000 ETH (about $79.3 million). Currently they’re down $2.48 million, ranking as the fifth-largest position. Sharks eating sharks—this kind of signal is more real than any technical indicator. I don’t know whether they’ll survive in the end, but I know that every time you see position data like this, the direction retail investors tend to take is usually wrong.
Another one worth looking at twice is $arb. After Robinhood Chain went live for two months, fee revenue is $13.05 million, annualized at $110 million. In traditional internet products, that kind of number is top-tier growth.
$1.3 million flowed into the Arbitrum ecosystem, and over the past two weeks, ARB has risen 46.7%. But don’t get too excited yet: on September 23, 139.2 million ARB will be unlocked, and the sell pressure then will require real money to absorb. On the same day, TD Cowen cut its BTC year-end target from $141,000 down to $97,500. The strategist backed off first—so why would you think you can be more accurate than institutions?
DeFi TVL is also falling across the board: $Lido -2.2%, $Aave -2.5%, Binance Staked ETH -2.5%. Even mainstream protocols are bleeding, which suggests fewer people are betting on the future while funds are locked on-chain.
It’s not that nobody believes in Web3—it's that everyone is more willing to hold stablecoins and wait for signals.
The U.S. Dollar Index (DXY) is up slightly by 0.08%; crude oil is up 0.75%; and gold is down 0.93%:
The classic stagflation combo—everything is going up, but your wallet isn’t 📉
#美联储加息概率升至68%
After waking up from a nap, mainstream coins all got wiped out: $BTC -1.38%, $ETH -2.21%, $SOL -3.29%. SOL is leading the decline; the biggest pullback pressure is on the high-beta assets. Given that 10Y U.S. Treasury yields are still sitting at a high 4.796%, it’s really not surprising.
Last night, U.S. stocks also fell: S&P -0.71%, Nasdaq -1.03%, with tech stocks taking the lead. Rates drag valuations; risk appetite shrinks—it's hard for crypto to stay unaffected.
The fear index is still hovering in the “greed” zone around 63, but at times like this, greed is often the most expensive contrarian indicator. History has repeatedly proven that when the fear index is above 60 and people still rush in, odds are high—about 6 to 7 times out of 10—you end up getting trapped.
But what’s truly interesting is always on-chain.
Over at ETH, there’s a big fish bleeding: on Hyperliquid, someone is long ETH with 25x leverage, with a position size of $98.0 million. They’re only $6.3k away from liquidation; they burn $4.3 million per week.
Another BIT-related entity added to the ETH longs, bringing them to 33,000 ETH (about $79.3 million). Currently they’re down $2.48 million, ranking as the fifth-largest position. Sharks eating sharks—this kind of signal is more real than any technical indicator. I don’t know whether they’ll survive in the end, but I know that every time you see position data like this, the direction retail investors tend to take is usually wrong.
Another one worth looking at twice is $arb. After Robinhood Chain went live for two months, fee revenue is $13.05 million, annualized at $110 million. In traditional internet products, that kind of number is top-tier growth.
$1.3 million flowed into the Arbitrum ecosystem, and over the past two weeks, ARB has risen 46.7%. But don’t get too excited yet: on September 23, 139.2 million ARB will be unlocked, and the sell pressure then will require real money to absorb. On the same day, TD Cowen cut its BTC year-end target from $141,000 down to $97,500. The strategist backed off first—so why would you think you can be more accurate than institutions?
DeFi TVL is also falling across the board: $Lido -2.2%, $Aave -2.5%, Binance Staked ETH -2.5%. Even mainstream protocols are bleeding, which suggests fewer people are betting on the future while funds are locked on-chain.
It’s not that nobody believes in Web3—it's that everyone is more willing to hold stablecoins and wait for signals.
The U.S. Dollar Index (DXY) is up slightly by 0.08%; crude oil is up 0.75%; and gold is down 0.93%:
The classic stagflation combo—everything is going up, but your wallet isn’t 📉
#美联储加息概率升至68%
1
472
·
--
Bullish
Verified
“Wooden head sister” is picking up dead bodies again.
On Monday 1️⃣, Ark Invest dumped about $40.8 million into Block (XYZ) and Circle (CRCL) in a synchronized buying spree, covering three tiers of ARKK, ARKW, and ARKF ETFs. On the same day, Block’s stock price also fell 1.85%, closing at $82.02—this is clearly counter-trend entry, not chasing a rally.
This isn’t the first time Ark has done this. Every time the media writes that they’re “losing money,” it often means they’re adding positions heavily. Institutions always have ammo to pick up shares when others are fearful—this is a structural advantage.
But we shouldn’t impulsively follow the crowd. The reason is simple:
Block laid off 40% of staff to pivot to AI. Revenue beat expectations, but costs have also surged. The stock is tied extremely closely to Bitcoin—essentially an alternative product with crypto leverage. Ark’s purchase looks more like “buying on the left side” than “fundamental improvement.”
What truly makes me take a closer look is Circle.
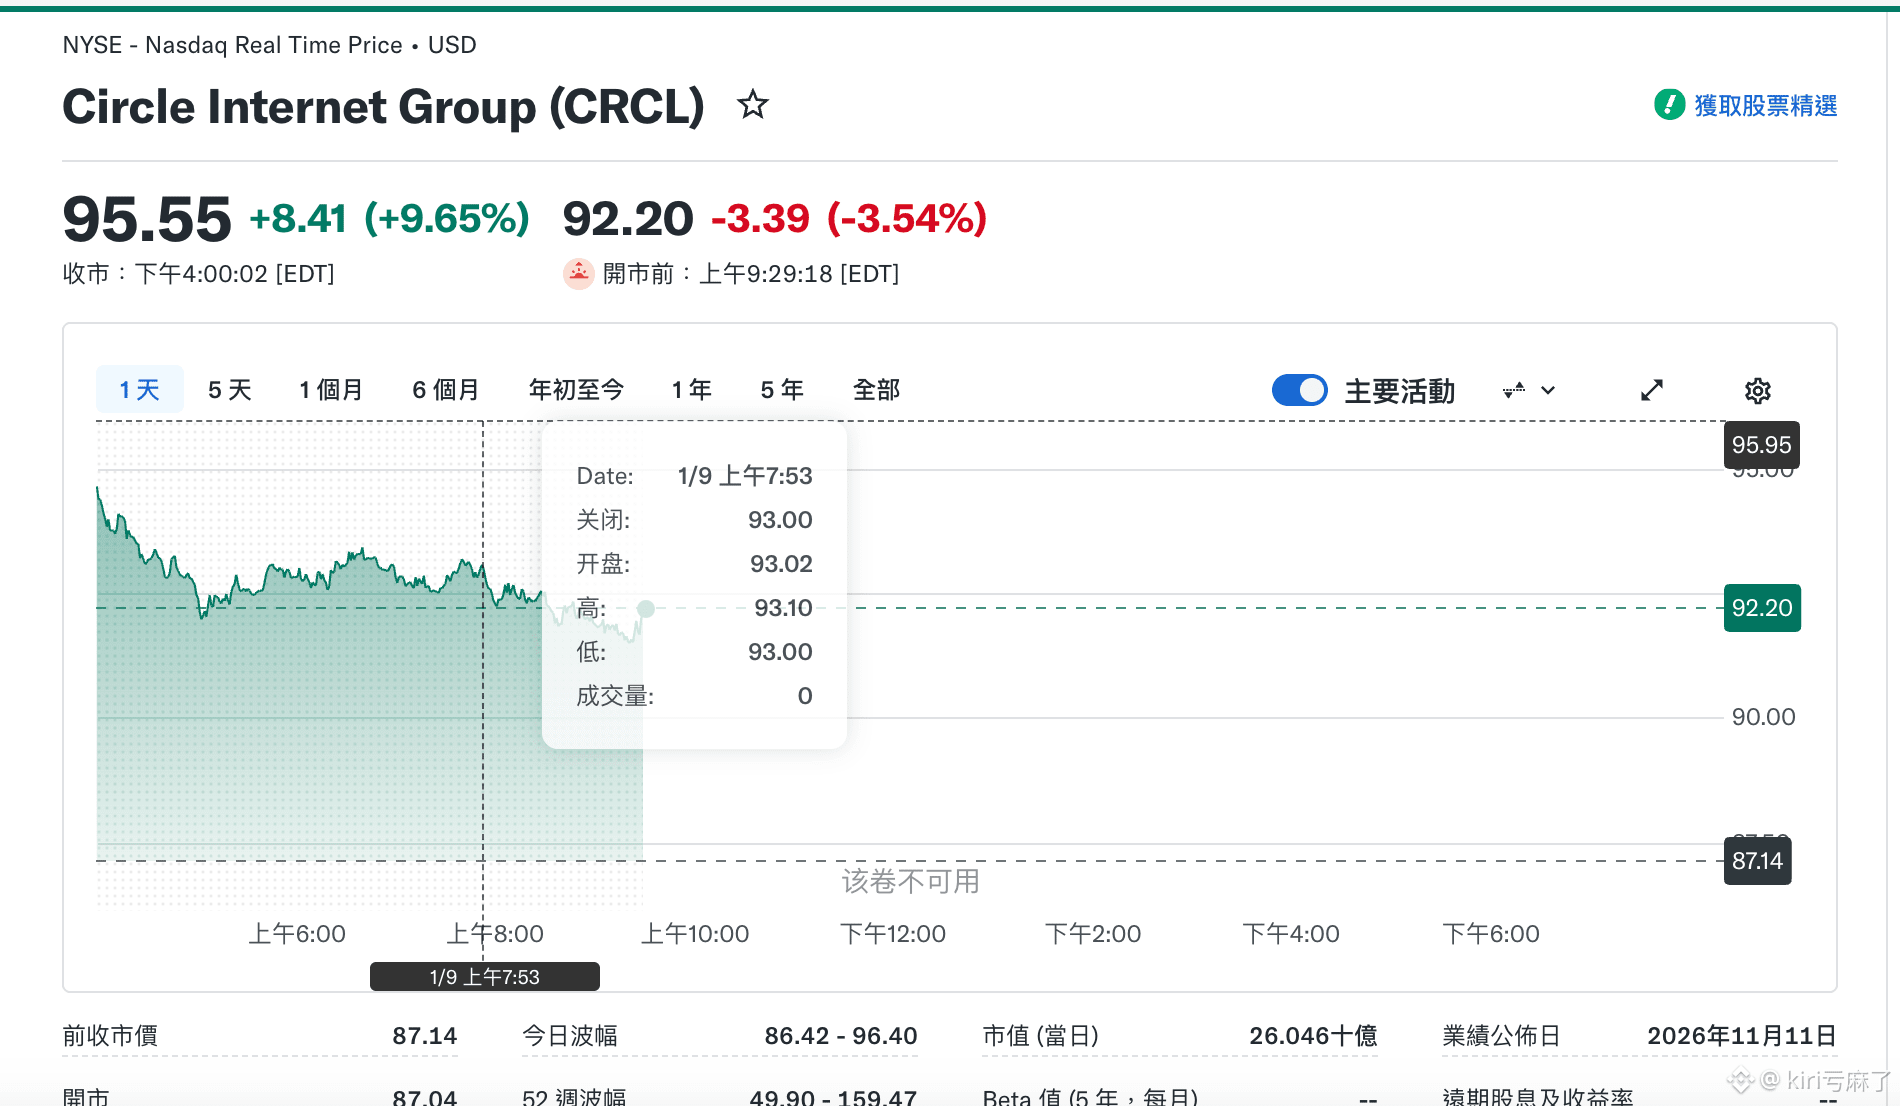
$CRCL surged 9.65% on Monday, closing at $95.55, after falling 7.5% last Friday and quickly rebounding. Over the past month, the gain is already 52.6%. Bernstein, the stablecoin issuer, just issued an “overweight” rating with a $140 target price. The rationale is that the adoption of stablecoin payments is increasing, the tokenization of real-world assets (RWA) is accelerating, and AI agent proxy payments are becoming a new track.
Ark timed this buy after CRCL had already risen 52.6%. This isn’t value hunting—it’s more like playing meme on SOL: you can always chase the rally 📈.
So the question is: Buying Circle at $95.55 with a target price of $140—there’s about 46% upside—but only if all four logics above fully play out. Whether the odds are worth it depends on how much you believe.
Personally, I think: wait for a pullback and then reassess—after all, the landlord’s leftover grain isn’t much.
Treat institutional moves as a thermometer, not a buy signal. Institutions have ammo and patience; we have FOMO and impulsiveness. The gap is right here.
In an era where everyone is rushing to tell you “what you should buy,” how do you slow yourself down and think things through?
Losing money is the result; learning is the process.#STRC优先股回购达6.35亿美元
{spot}(BTCUSDT)
“Wooden head sister” is picking up dead bodies again.
On Monday 1️⃣, Ark Invest dumped about $40.8 million into Block (XYZ) and Circle (CRCL) in a synchronized buying spree, covering three tiers of ARKK, ARKW, and ARKF ETFs. On the same day, Block’s stock price also fell 1.85%, closing at $82.02—this is clearly counter-trend entry, not chasing a rally.
This isn’t the first time Ark has done this. Every time the media writes that they’re “losing money,” it often means they’re adding positions heavily. Institutions always have ammo to pick up shares when others are fearful—this is a structural advantage.
But we shouldn’t impulsively follow the crowd. The reason is simple:
Block laid off 40% of staff to pivot to AI. Revenue beat expectations, but costs have also surged. The stock is tied extremely closely to Bitcoin—essentially an alternative product with crypto leverage. Ark’s purchase looks more like “buying on the left side” than “fundamental improvement.”
What truly makes me take a closer look is Circle.
$CRCL surged 9.65% on Monday, closing at $95.55, after falling 7.5% last Friday and quickly rebounding. Over the past month, the gain is already 52.6%. Bernstein, the stablecoin issuer, just issued an “overweight” rating with a $140 target price. The rationale is that the adoption of stablecoin payments is increasing, the tokenization of real-world assets (RWA) is accelerating, and AI agent proxy payments are becoming a new track.
Ark timed this buy after CRCL had already risen 52.6%. This isn’t value hunting—it’s more like playing meme on SOL: you can always chase the rally 📈.
So the question is: Buying Circle at $95.55 with a target price of $140—there’s about 46% upside—but only if all four logics above fully play out. Whether the odds are worth it depends on how much you believe.
Personally, I think: wait for a pullback and then reassess—after all, the landlord’s leftover grain isn’t much.
Treat institutional moves as a thermometer, not a buy signal. Institutions have ammo and patience; we have FOMO and impulsiveness. The gap is right here.
In an era where everyone is rushing to tell you “what you should buy,” how do you slow yourself down and think things through?
Losing money is the result; learning is the process.#STRC优先股回购达6.35亿美元
On Monday 1️⃣, Ark Invest dumped about $40.8 million into Block (XYZ) and Circle (CRCL) in a synchronized buying spree, covering three tiers of ARKK, ARKW, and ARKF ETFs. On the same day, Block’s stock price also fell 1.85%, closing at $82.02—this is clearly counter-trend entry, not chasing a rally.
This isn’t the first time Ark has done this. Every time the media writes that they’re “losing money,” it often means they’re adding positions heavily. Institutions always have ammo to pick up shares when others are fearful—this is a structural advantage.
But we shouldn’t impulsively follow the crowd. The reason is simple:
Block laid off 40% of staff to pivot to AI. Revenue beat expectations, but costs have also surged. The stock is tied extremely closely to Bitcoin—essentially an alternative product with crypto leverage. Ark’s purchase looks more like “buying on the left side” than “fundamental improvement.”
What truly makes me take a closer look is Circle.
$CRCL surged 9.65% on Monday, closing at $95.55, after falling 7.5% last Friday and quickly rebounding. Over the past month, the gain is already 52.6%. Bernstein, the stablecoin issuer, just issued an “overweight” rating with a $140 target price. The rationale is that the adoption of stablecoin payments is increasing, the tokenization of real-world assets (RWA) is accelerating, and AI agent proxy payments are becoming a new track.
Ark timed this buy after CRCL had already risen 52.6%. This isn’t value hunting—it’s more like playing meme on SOL: you can always chase the rally 📈.
So the question is: Buying Circle at $95.55 with a target price of $140—there’s about 46% upside—but only if all four logics above fully play out. Whether the odds are worth it depends on how much you believe.
Personally, I think: wait for a pullback and then reassess—after all, the landlord’s leftover grain isn’t much.
Treat institutional moves as a thermometer, not a buy signal. Institutions have ammo and patience; we have FOMO and impulsiveness. The gap is right here.
In an era where everyone is rushing to tell you “what you should buy,” how do you slow yourself down and think things through?
Losing money is the result; learning is the process.#STRC优先股回购达6.35亿美元
1
666
·
--
Bullish
This recent dip in gold has triggered a surprisingly unified reaction in social circles and trading groups: bulls are panicking, while bears are celebrating. But if we take a closer look at the market structure, this pullback seems more like a "normal profit-taking" rather than a signal of a trend reversal.
Why do I say that?
First, let's examine the reasons behind the retracement. The dollar has been experiencing a temporary rebound, U.S. Treasury yields are on the rise, and geopolitical risks have eased a bit—these are facts, but they alter the rhythm, not the direction. Central banks have been buying over a thousand tons of gold consistently for three years, U.S. debt has surpassed $36 trillion, and core inflation in the U.S. is still at 2.8%—none of these fundamental factors supporting the long-term thesis for gold have disappeared.
Now, looking at the technical side. The $3,050 to $3,080 range is the trendline support for this rally, as well as where the 50-day moving average sits. If this level holds, the high-level consolidation pattern remains intact; only if we effectively break below $3,000 would we need to reassess the formation. It’s not yet time to jump to conclusions.
What we should really keep an eye on is sentiment. The formation of every major top has been accompanied by institutions going all-in bullish, retail traders leveraging up, and even the local aunties chatting about gold—yet right now, there’s still huge division in the market, with solid arguments on both the bearish and bullish sides. This is precisely not how a top should look.
Historical data also backs this judgment. Since 2008, every intermediate pullback in gold bull markets has generally ranged from 10% to 20%, which at current prices translates to a zone of $2,820 to $3,000. Every so-called "technical bear market" has turned out to be a buying opportunity for gold in hindsight.
So, is this dip signaling a top for the bull market or just a pit stop?
The answer depends on your time horizon. If you're a swing trader, the $3,050 to $3,000 range is worth considering in batches; if you're thinking like the central banks with a three to five-year outlook, we might not even be halfway up the mountain yet.
Control your position size and keep plenty of ammo. Cash in a bull market is an option in itself. $XAU
{future}(XAUUSDT)
#在币安广场聊传统金融
This recent dip in gold has triggered a surprisingly unified reaction in social circles and trading groups: bulls are panicking, while bears are celebrating. But if we take a closer look at the market structure, this pullback seems more like a "normal profit-taking" rather than a signal of a trend reversal.
Why do I say that?
First, let's examine the reasons behind the retracement. The dollar has been experiencing a temporary rebound, U.S. Treasury yields are on the rise, and geopolitical risks have eased a bit—these are facts, but they alter the rhythm, not the direction. Central banks have been buying over a thousand tons of gold consistently for three years, U.S. debt has surpassed $36 trillion, and core inflation in the U.S. is still at 2.8%—none of these fundamental factors supporting the long-term thesis for gold have disappeared.
Now, looking at the technical side. The $3,050 to $3,080 range is the trendline support for this rally, as well as where the 50-day moving average sits. If this level holds, the high-level consolidation pattern remains intact; only if we effectively break below $3,000 would we need to reassess the formation. It’s not yet time to jump to conclusions.
What we should really keep an eye on is sentiment. The formation of every major top has been accompanied by institutions going all-in bullish, retail traders leveraging up, and even the local aunties chatting about gold—yet right now, there’s still huge division in the market, with solid arguments on both the bearish and bullish sides. This is precisely not how a top should look.
Historical data also backs this judgment. Since 2008, every intermediate pullback in gold bull markets has generally ranged from 10% to 20%, which at current prices translates to a zone of $2,820 to $3,000. Every so-called "technical bear market" has turned out to be a buying opportunity for gold in hindsight.
So, is this dip signaling a top for the bull market or just a pit stop?
The answer depends on your time horizon. If you're a swing trader, the $3,050 to $3,000 range is worth considering in batches; if you're thinking like the central banks with a three to five-year outlook, we might not even be halfway up the mountain yet.
Control your position size and keep plenty of ammo. Cash in a bull market is an option in itself. $XAU
#在币安广场聊传统金融
Why do I say that?
First, let's examine the reasons behind the retracement. The dollar has been experiencing a temporary rebound, U.S. Treasury yields are on the rise, and geopolitical risks have eased a bit—these are facts, but they alter the rhythm, not the direction. Central banks have been buying over a thousand tons of gold consistently for three years, U.S. debt has surpassed $36 trillion, and core inflation in the U.S. is still at 2.8%—none of these fundamental factors supporting the long-term thesis for gold have disappeared.
Now, looking at the technical side. The $3,050 to $3,080 range is the trendline support for this rally, as well as where the 50-day moving average sits. If this level holds, the high-level consolidation pattern remains intact; only if we effectively break below $3,000 would we need to reassess the formation. It’s not yet time to jump to conclusions.
What we should really keep an eye on is sentiment. The formation of every major top has been accompanied by institutions going all-in bullish, retail traders leveraging up, and even the local aunties chatting about gold—yet right now, there’s still huge division in the market, with solid arguments on both the bearish and bullish sides. This is precisely not how a top should look.
Historical data also backs this judgment. Since 2008, every intermediate pullback in gold bull markets has generally ranged from 10% to 20%, which at current prices translates to a zone of $2,820 to $3,000. Every so-called "technical bear market" has turned out to be a buying opportunity for gold in hindsight.
So, is this dip signaling a top for the bull market or just a pit stop?
The answer depends on your time horizon. If you're a swing trader, the $3,050 to $3,000 range is worth considering in batches; if you're thinking like the central banks with a three to five-year outlook, we might not even be halfway up the mountain yet.
Control your position size and keep plenty of ammo. Cash in a bull market is an option in itself. $XAU
#在币安广场聊传统金融
kiri亏麻了
·
--
The Dusk of Gold, the Dawn of Bitcoin? As Global Markets Stand at a Crossroads
There's a question that almost every trader thinks about late at night while checking the charts: prices are dropping, should I cut my losses or double down?
This question doesn't have a standard answer. But the real problem lies not in the answer itself—but in how we frame the question. We tend to simplify the market into two options: continuation of a bull run or the start of a bear market. But the real world never hands out clear signals. It just moves, step by step, leaving behind a trail that no one can predict in advance.
Recently, the global markets are speaking through their price actions. After failing to break through the $3500 mark, gold has entered a high-level consolidation. The internal structure of the U.S. stock market is starting to show significant divergence—tech giants are stagnating, small caps have already fallen behind, while crude oil is hesitating around the $80 mark. Bitcoin, on the other hand, has carved out its own independent trajectory: not fully following gold nor the Nasdaq, it feels like a child searching for its own narrative.
This question doesn't have a standard answer. But the real problem lies not in the answer itself—but in how we frame the question. We tend to simplify the market into two options: continuation of a bull run or the start of a bear market. But the real world never hands out clear signals. It just moves, step by step, leaving behind a trail that no one can predict in advance.
Recently, the global markets are speaking through their price actions. After failing to break through the $3500 mark, gold has entered a high-level consolidation. The internal structure of the U.S. stock market is starting to show significant divergence—tech giants are stagnating, small caps have already fallen behind, while crude oil is hesitating around the $80 mark. Bitcoin, on the other hand, has carved out its own independent trajectory: not fully following gold nor the Nasdaq, it feels like a child searching for its own narrative.

1
407
·
--
Bearish
Verified
Yesterday, the market took two heavy hits, plunging into a freeze, with risk assets getting hammered indiscriminately.
The first hit came from the crackdown on cross-border brokers. The Securities Regulatory Commission, together with eight departments, took action, with Futu fined 1.85 billion and Tiger Brokers over 300 million plus a confiscation of 100 million, and both CEOs facing personal fines of 1.25 million each. The killer blow is that during this two-year regulatory phase, existing investors can only sell and not buy—new capital is locked out, leaving only selling pressure. Futu plummeted nearly 35%, Tiger over 30%, and Futu stated that the proportion of mainland clients has dropped to 13%, but the market isn't buying it, fearing more surprises during the regulatory period.
The second hit came from a double whammy from the crypto space and the Federal Reserve. BTC dropped below 77,000, with 175 million in liquidations in 24 hours, washing out over 70,000 traders. The signals are even more unsettling—Cuban dumped most of his holdings, Coinbase premiums fell to monthly lows, and MSTR dropped nearly 10% this week, with institutions pulling back. Spot gold also slipped below 4,500 dollars, with both safe-haven and risk assets falling together, a classic case of liquidity being drained.
To top it off, the Fed is still taking more shots. Trump attended the Wash inauguration to stabilize expectations, but Waller immediately turned hawkish—interest rate hikes not off the table, rates steady at 3.5%-3.75%, and further balance sheet reduction of 300 to 500 billion. The market quickly priced in a 25 basis point hike by year-end.
The logic connecting these three news pieces is clear: Chinese concept brokers are blocking the outbound capital flow to the East, the Fed's hawkish stance is tightening global liquidity, and Bitcoin is just one piece being pressed down in the whole risk asset chain. All the obvious bearish news is laid out, but the worst moments often come when you think it can't get any worse, and then there's still more we haven't seen #Saylor考虑出售BTC
{spot}(BTCUSDT)
Yesterday, the market took two heavy hits, plunging into a freeze, with risk assets getting hammered indiscriminately.
The first hit came from the crackdown on cross-border brokers. The Securities Regulatory Commission, together with eight departments, took action, with Futu fined 1.85 billion and Tiger Brokers over 300 million plus a confiscation of 100 million, and both CEOs facing personal fines of 1.25 million each. The killer blow is that during this two-year regulatory phase, existing investors can only sell and not buy—new capital is locked out, leaving only selling pressure. Futu plummeted nearly 35%, Tiger over 30%, and Futu stated that the proportion of mainland clients has dropped to 13%, but the market isn't buying it, fearing more surprises during the regulatory period.
The second hit came from a double whammy from the crypto space and the Federal Reserve. BTC dropped below 77,000, with 175 million in liquidations in 24 hours, washing out over 70,000 traders. The signals are even more unsettling—Cuban dumped most of his holdings, Coinbase premiums fell to monthly lows, and MSTR dropped nearly 10% this week, with institutions pulling back. Spot gold also slipped below 4,500 dollars, with both safe-haven and risk assets falling together, a classic case of liquidity being drained.
To top it off, the Fed is still taking more shots. Trump attended the Wash inauguration to stabilize expectations, but Waller immediately turned hawkish—interest rate hikes not off the table, rates steady at 3.5%-3.75%, and further balance sheet reduction of 300 to 500 billion. The market quickly priced in a 25 basis point hike by year-end.
The logic connecting these three news pieces is clear: Chinese concept brokers are blocking the outbound capital flow to the East, the Fed's hawkish stance is tightening global liquidity, and Bitcoin is just one piece being pressed down in the whole risk asset chain. All the obvious bearish news is laid out, but the worst moments often come when you think it can't get any worse, and then there's still more we haven't seen #Saylor考虑出售BTC
The first hit came from the crackdown on cross-border brokers. The Securities Regulatory Commission, together with eight departments, took action, with Futu fined 1.85 billion and Tiger Brokers over 300 million plus a confiscation of 100 million, and both CEOs facing personal fines of 1.25 million each. The killer blow is that during this two-year regulatory phase, existing investors can only sell and not buy—new capital is locked out, leaving only selling pressure. Futu plummeted nearly 35%, Tiger over 30%, and Futu stated that the proportion of mainland clients has dropped to 13%, but the market isn't buying it, fearing more surprises during the regulatory period.
The second hit came from a double whammy from the crypto space and the Federal Reserve. BTC dropped below 77,000, with 175 million in liquidations in 24 hours, washing out over 70,000 traders. The signals are even more unsettling—Cuban dumped most of his holdings, Coinbase premiums fell to monthly lows, and MSTR dropped nearly 10% this week, with institutions pulling back. Spot gold also slipped below 4,500 dollars, with both safe-haven and risk assets falling together, a classic case of liquidity being drained.
To top it off, the Fed is still taking more shots. Trump attended the Wash inauguration to stabilize expectations, but Waller immediately turned hawkish—interest rate hikes not off the table, rates steady at 3.5%-3.75%, and further balance sheet reduction of 300 to 500 billion. The market quickly priced in a 25 basis point hike by year-end.
The logic connecting these three news pieces is clear: Chinese concept brokers are blocking the outbound capital flow to the East, the Fed's hawkish stance is tightening global liquidity, and Bitcoin is just one piece being pressed down in the whole risk asset chain. All the obvious bearish news is laid out, but the worst moments often come when you think it can't get any worse, and then there's still more we haven't seen #Saylor考虑出售BTC
kiri亏麻了
·
--
BullishTonight at 11:00 PM, Kevin Warsh will take the oath of office as the Fed Chair at the White House. Trump breaks tradition by personally endorsing him, while Powell, who has been criticized for four years as 'Mr. Too Late,' finally steps down. However, Warsh is inheriting what is likely the hottest potato in the history of the Fed.
His nomination confirmation vote was 54:45, almost entirely split along party lines, setting a record for the largest divide in chair nominations. More critically, the April meeting minutes leaked: "The vast majority" of officials believe that a return to 2% inflation is far off, and "most" officials clearly state that if inflation remains high, further rate hikes are appropriate. Some even advocate for removing any mention of "easing bias." The door for rate cuts has been effectively welded shut from the inside.
Warsh is fundamentally a moderate pragmatist wearing a hawkish mask. He is focused on the interest burden of $36 trillion in national debt and has devised a strategy of "balance sheet reduction for rate cuts"—actively selling long-term bonds to lower inflation expectations, then adjusting the methodology for inflation statistics to exclude oil price volatility, all to create room for rate cuts. But this plan is unlikely to succeed. The US-Iran conflict has pushed oil prices above 50%, the April CPI has risen to 3.8%, and the PPI has hit 6%. Nomura has wiped out all rate cut expectations for 2026, bluntly stating that he "cannot convince the majority of the FOMC members to support rate cuts." Even Trump has sensed danger and recently changed his tune, no longer shouting for immediate rate cuts, which is often the calm before the storm.
What makes the market uneasy is his identity crisis. Handpicked by Trump and taking the oath at the White House fundamentally contradicts the tradition of Fed independence. Not cutting rates could lead to Warsh being labeled a "traitor" like Powell; forcing rate cuts, if long-term US bond yields spiral out of control, would tag him as a "political puppet." Harvard economist Rogoff warns: "Once the market thinks you are undermining central bank independence, they will immediately push rates higher, exactly the opposite of what you want."
Warsh was once Bernanke's deputy, and now he finally takes the helm but finds himself facing a tidal wave of inflation and political pressures. The market is already betting on a rate hike in July. The truly brutal question is: when inflation continues to worsen, will this new chair, who is expected to cut rates, be forced to cast a vote in favor of a rate hike? If that day comes, tonight's noise at the White House will become the most ironic footnote. #Warsh出任美联储主席
$HYPE
His nomination confirmation vote was 54:45, almost entirely split along party lines, setting a record for the largest divide in chair nominations. More critically, the April meeting minutes leaked: "The vast majority" of officials believe that a return to 2% inflation is far off, and "most" officials clearly state that if inflation remains high, further rate hikes are appropriate. Some even advocate for removing any mention of "easing bias." The door for rate cuts has been effectively welded shut from the inside.
Warsh is fundamentally a moderate pragmatist wearing a hawkish mask. He is focused on the interest burden of $36 trillion in national debt and has devised a strategy of "balance sheet reduction for rate cuts"—actively selling long-term bonds to lower inflation expectations, then adjusting the methodology for inflation statistics to exclude oil price volatility, all to create room for rate cuts. But this plan is unlikely to succeed. The US-Iran conflict has pushed oil prices above 50%, the April CPI has risen to 3.8%, and the PPI has hit 6%. Nomura has wiped out all rate cut expectations for 2026, bluntly stating that he "cannot convince the majority of the FOMC members to support rate cuts." Even Trump has sensed danger and recently changed his tune, no longer shouting for immediate rate cuts, which is often the calm before the storm.
What makes the market uneasy is his identity crisis. Handpicked by Trump and taking the oath at the White House fundamentally contradicts the tradition of Fed independence. Not cutting rates could lead to Warsh being labeled a "traitor" like Powell; forcing rate cuts, if long-term US bond yields spiral out of control, would tag him as a "political puppet." Harvard economist Rogoff warns: "Once the market thinks you are undermining central bank independence, they will immediately push rates higher, exactly the opposite of what you want."
Warsh was once Bernanke's deputy, and now he finally takes the helm but finds himself facing a tidal wave of inflation and political pressures. The market is already betting on a rate hike in July. The truly brutal question is: when inflation continues to worsen, will this new chair, who is expected to cut rates, be forced to cast a vote in favor of a rate hike? If that day comes, tonight's noise at the White House will become the most ironic footnote. #Warsh出任美联储主席
$HYPE
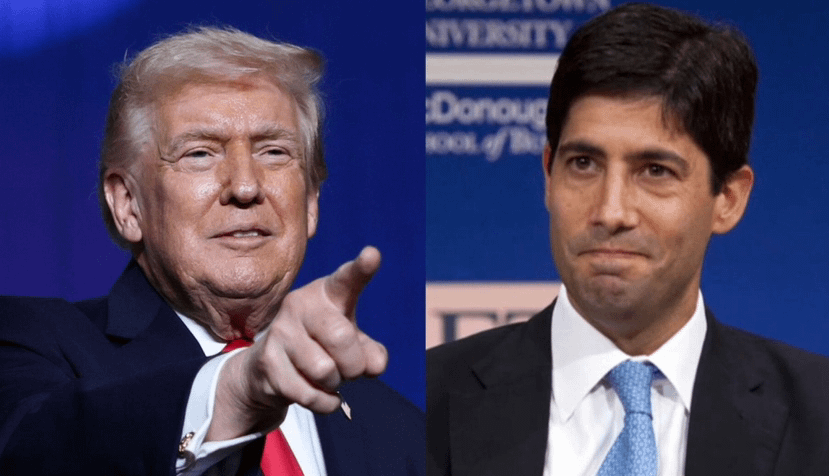
3
2.1k
·
--
Bullish
Verified
Tonight at 11:00 PM, Kevin Warsh will take the oath of office as the Fed Chair at the White House. Trump breaks tradition by personally endorsing him, while Powell, who has been criticized for four years as 'Mr. Too Late,' finally steps down. However, Warsh is inheriting what is likely the hottest potato in the history of the Fed.
His nomination confirmation vote was 54:45, almost entirely split along party lines, setting a record for the largest divide in chair nominations. More critically, the April meeting minutes leaked: "The vast majority" of officials believe that a return to 2% inflation is far off, and "most" officials clearly state that if inflation remains high, further rate hikes are appropriate. Some even advocate for removing any mention of "easing bias." The door for rate cuts has been effectively welded shut from the inside.
Warsh is fundamentally a moderate pragmatist wearing a hawkish mask. He is focused on the interest burden of $36 trillion in national debt and has devised a strategy of "balance sheet reduction for rate cuts"—actively selling long-term bonds to lower inflation expectations, then adjusting the methodology for inflation statistics to exclude oil price volatility, all to create room for rate cuts. But this plan is unlikely to succeed. The US-Iran conflict has pushed oil prices above 50%, the April CPI has risen to 3.8%, and the PPI has hit 6%. Nomura has wiped out all rate cut expectations for 2026, bluntly stating that he "cannot convince the majority of the FOMC members to support rate cuts." Even Trump has sensed danger and recently changed his tune, no longer shouting for immediate rate cuts, which is often the calm before the storm.
What makes the market uneasy is his identity crisis. Handpicked by Trump and taking the oath at the White House fundamentally contradicts the tradition of Fed independence. Not cutting rates could lead to Warsh being labeled a "traitor" like Powell; forcing rate cuts, if long-term US bond yields spiral out of control, would tag him as a "political puppet." Harvard economist Rogoff warns: "Once the market thinks you are undermining central bank independence, they will immediately push rates higher, exactly the opposite of what you want."
Warsh was once Bernanke's deputy, and now he finally takes the helm but finds himself facing a tidal wave of inflation and political pressures. The market is already betting on a rate hike in July. The truly brutal question is: when inflation continues to worsen, will this new chair, who is expected to cut rates, be forced to cast a vote in favor of a rate hike? If that day comes, tonight's noise at the White House will become the most ironic footnote. #Warsh出任美联储主席
$HYPE
Tonight at 11:00 PM, Kevin Warsh will take the oath of office as the Fed Chair at the White House. Trump breaks tradition by personally endorsing him, while Powell, who has been criticized for four years as 'Mr. Too Late,' finally steps down. However, Warsh is inheriting what is likely the hottest potato in the history of the Fed.
His nomination confirmation vote was 54:45, almost entirely split along party lines, setting a record for the largest divide in chair nominations. More critically, the April meeting minutes leaked: "The vast majority" of officials believe that a return to 2% inflation is far off, and "most" officials clearly state that if inflation remains high, further rate hikes are appropriate. Some even advocate for removing any mention of "easing bias." The door for rate cuts has been effectively welded shut from the inside.
Warsh is fundamentally a moderate pragmatist wearing a hawkish mask. He is focused on the interest burden of $36 trillion in national debt and has devised a strategy of "balance sheet reduction for rate cuts"—actively selling long-term bonds to lower inflation expectations, then adjusting the methodology for inflation statistics to exclude oil price volatility, all to create room for rate cuts. But this plan is unlikely to succeed. The US-Iran conflict has pushed oil prices above 50%, the April CPI has risen to 3.8%, and the PPI has hit 6%. Nomura has wiped out all rate cut expectations for 2026, bluntly stating that he "cannot convince the majority of the FOMC members to support rate cuts." Even Trump has sensed danger and recently changed his tune, no longer shouting for immediate rate cuts, which is often the calm before the storm.
What makes the market uneasy is his identity crisis. Handpicked by Trump and taking the oath at the White House fundamentally contradicts the tradition of Fed independence. Not cutting rates could lead to Warsh being labeled a "traitor" like Powell; forcing rate cuts, if long-term US bond yields spiral out of control, would tag him as a "political puppet." Harvard economist Rogoff warns: "Once the market thinks you are undermining central bank independence, they will immediately push rates higher, exactly the opposite of what you want."
Warsh was once Bernanke's deputy, and now he finally takes the helm but finds himself facing a tidal wave of inflation and political pressures. The market is already betting on a rate hike in July. The truly brutal question is: when inflation continues to worsen, will this new chair, who is expected to cut rates, be forced to cast a vote in favor of a rate hike? If that day comes, tonight's noise at the White House will become the most ironic footnote. #Warsh出任美联储主席
$HYPE
His nomination confirmation vote was 54:45, almost entirely split along party lines, setting a record for the largest divide in chair nominations. More critically, the April meeting minutes leaked: "The vast majority" of officials believe that a return to 2% inflation is far off, and "most" officials clearly state that if inflation remains high, further rate hikes are appropriate. Some even advocate for removing any mention of "easing bias." The door for rate cuts has been effectively welded shut from the inside.
Warsh is fundamentally a moderate pragmatist wearing a hawkish mask. He is focused on the interest burden of $36 trillion in national debt and has devised a strategy of "balance sheet reduction for rate cuts"—actively selling long-term bonds to lower inflation expectations, then adjusting the methodology for inflation statistics to exclude oil price volatility, all to create room for rate cuts. But this plan is unlikely to succeed. The US-Iran conflict has pushed oil prices above 50%, the April CPI has risen to 3.8%, and the PPI has hit 6%. Nomura has wiped out all rate cut expectations for 2026, bluntly stating that he "cannot convince the majority of the FOMC members to support rate cuts." Even Trump has sensed danger and recently changed his tune, no longer shouting for immediate rate cuts, which is often the calm before the storm.
What makes the market uneasy is his identity crisis. Handpicked by Trump and taking the oath at the White House fundamentally contradicts the tradition of Fed independence. Not cutting rates could lead to Warsh being labeled a "traitor" like Powell; forcing rate cuts, if long-term US bond yields spiral out of control, would tag him as a "political puppet." Harvard economist Rogoff warns: "Once the market thinks you are undermining central bank independence, they will immediately push rates higher, exactly the opposite of what you want."
Warsh was once Bernanke's deputy, and now he finally takes the helm but finds himself facing a tidal wave of inflation and political pressures. The market is already betting on a rate hike in July. The truly brutal question is: when inflation continues to worsen, will this new chair, who is expected to cut rates, be forced to cast a vote in favor of a rate hike? If that day comes, tonight's noise at the White House will become the most ironic footnote. #Warsh出任美联储主席
$HYPE
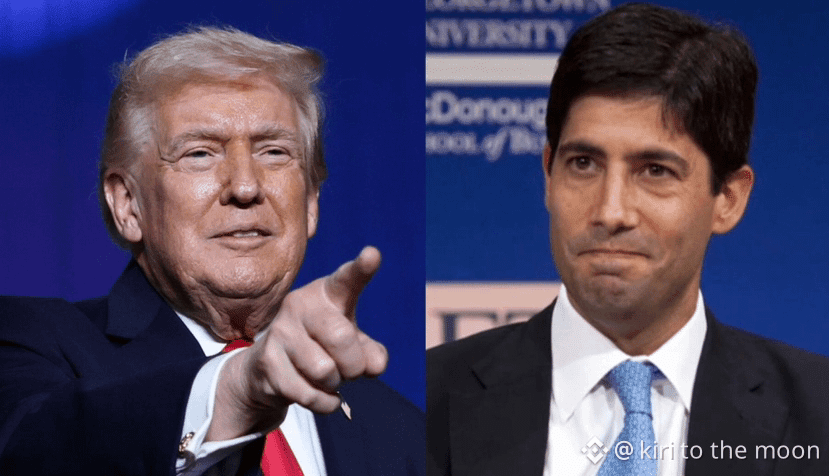
2
2
9
21.8k
·
--

Article
The Dusk of Gold, the Dawn of Bitcoin? As Global Markets Stand at a CrossroadsThere's a question that almost every trader thinks about late at night while checking the charts: prices are dropping, should I cut my losses or double down?
This question doesn't have a standard answer. But the real problem lies not in the answer itself—but in how we frame the question. We tend to simplify the market into two options: continuation of a bull run or the start of a bear market. But the real world never hands out clear signals. It just moves, step by step, leaving behind a trail that no one can predict in advance.
Recently, the global markets are speaking through their price actions. After failing to break through the $3500 mark, gold has entered a high-level consolidation. The internal structure of the U.S. stock market is starting to show significant divergence—tech giants are stagnating, small caps have already fallen behind, while crude oil is hesitating around the $80 mark. Bitcoin, on the other hand, has carved out its own independent trajectory: not fully following gold nor the Nasdaq, it feels like a child searching for its own narrative.
The Dusk of Gold, the Dawn of Bitcoin? As Global Markets Stand at a Crossroads
There's a question that almost every trader thinks about late at night while checking the charts: prices are dropping, should I cut my losses or double down?
This question doesn't have a standard answer. But the real problem lies not in the answer itself—but in how we frame the question. We tend to simplify the market into two options: continuation of a bull run or the start of a bear market. But the real world never hands out clear signals. It just moves, step by step, leaving behind a trail that no one can predict in advance.
Recently, the global markets are speaking through their price actions. After failing to break through the $3500 mark, gold has entered a high-level consolidation. The internal structure of the U.S. stock market is starting to show significant divergence—tech giants are stagnating, small caps have already fallen behind, while crude oil is hesitating around the $80 mark. Bitcoin, on the other hand, has carved out its own independent trajectory: not fully following gold nor the Nasdaq, it feels like a child searching for its own narrative.
This question doesn't have a standard answer. But the real problem lies not in the answer itself—but in how we frame the question. We tend to simplify the market into two options: continuation of a bull run or the start of a bear market. But the real world never hands out clear signals. It just moves, step by step, leaving behind a trail that no one can predict in advance.
Recently, the global markets are speaking through their price actions. After failing to break through the $3500 mark, gold has entered a high-level consolidation. The internal structure of the U.S. stock market is starting to show significant divergence—tech giants are stagnating, small caps have already fallen behind, while crude oil is hesitating around the $80 mark. Bitcoin, on the other hand, has carved out its own independent trajectory: not fully following gold nor the Nasdaq, it feels like a child searching for its own narrative.
1
1
542
·
--
Bullish
BTC Today's Data Overview (May 22, 2026)📰
Price Range📈
- Current Price: $77,517
- Intraday High: $82,496
- Intraday Low: $75,437
- Daily Change: -$471 (-0.6%)
Macro Environment✈️
1. Fed Rate Expectations — Bearish
- Fed meeting minutes show officials are worried about inflation, raising rate hike expectations
2. Rising Geopolitical Risk in Iran
- Trump indicates US-Iran negotiations are in the "final stages," increasing market risk aversion
- Risk assets are under short-term pressure, with increased volatility due to uncertainty in the Middle East
3. Institutional ETF Outflows Persist
BlackRock IBIT has seen a net outflow for 5 consecutive days (single-day outflow of $103.64M on 5/21)
In the past 7 days, BTC ETF has seen a net outflow of 15,915 BTC (approximately $1.23B)
4. Inflation Data🥖
US CPI reaches 3.8%, inflation resilience exceeds expectations
This is the core reason for the Fed delaying rate cuts
Rising real rates are detrimental to BTC in the mid-term
On-chain and Market Structure🙏
- BTC options implied volatility (BVIV) is low at around 42%, suggesting potential for increased volatility around CPI/Fed rate decisions
- Long leverage has been flushed ($661M in liquidations), which is favorable for bottoming
- Fear and Greed Index: 27 (Fear), consistently below 30
- Clear resistance formed around the high of $82,500
Direction👇
Short-term: Bearish consolidation, waiting for a bottom signal
ETF outflows + rising rate hike expectations = Difficult to see a significant rebound in the short term
The high of $82,500 has formed a short-term top
Mid-term: Wide-range oscillation, waiting for better entry points
- Macro liquidity tightening, significant mid-term upside requires new catalysts (return of rate cut expectations / easing geopolitical risks)
Entry Points🤖
Short-term Short (Priority) | $78,000-$79,000 | Twice blocked today, insufficient bullish confidence
Short-term Long for a Bounce | $75,500-$76,500 | Support at intraday low, dense trading area
Mid-term Positioning | $74,000-$75,500 | Overlapping 200-day moving average + previous support
Breakout Long | After reclaiming $82,500 | Valid breakout from previous highs, confirming a new trend
Stop-loss Recommendations🍺
- Short Position: $80,000 Stop-loss
- Long Position (Bounce): $74,500 Stop-loss
- Mid-term Long: $72,000 Stop-loss
#BTC走势分析
{spot}(BTCUSDT)
BTC Today's Data Overview (May 22, 2026)📰
Price Range📈
- Current Price: $77,517
- Intraday High: $82,496
- Intraday Low: $75,437
- Daily Change: -$471 (-0.6%)
Macro Environment✈️
1. Fed Rate Expectations — Bearish
- Fed meeting minutes show officials are worried about inflation, raising rate hike expectations
2. Rising Geopolitical Risk in Iran
- Trump indicates US-Iran negotiations are in the "final stages," increasing market risk aversion
- Risk assets are under short-term pressure, with increased volatility due to uncertainty in the Middle East
3. Institutional ETF Outflows Persist
BlackRock IBIT has seen a net outflow for 5 consecutive days (single-day outflow of $103.64M on 5/21)
In the past 7 days, BTC ETF has seen a net outflow of 15,915 BTC (approximately $1.23B)
4. Inflation Data🥖
US CPI reaches 3.8%, inflation resilience exceeds expectations
This is the core reason for the Fed delaying rate cuts
Rising real rates are detrimental to BTC in the mid-term
On-chain and Market Structure🙏
- BTC options implied volatility (BVIV) is low at around 42%, suggesting potential for increased volatility around CPI/Fed rate decisions
- Long leverage has been flushed ($661M in liquidations), which is favorable for bottoming
- Fear and Greed Index: 27 (Fear), consistently below 30
- Clear resistance formed around the high of $82,500
Direction👇
Short-term: Bearish consolidation, waiting for a bottom signal
ETF outflows + rising rate hike expectations = Difficult to see a significant rebound in the short term
The high of $82,500 has formed a short-term top
Mid-term: Wide-range oscillation, waiting for better entry points
- Macro liquidity tightening, significant mid-term upside requires new catalysts (return of rate cut expectations / easing geopolitical risks)
Entry Points🤖
Short-term Short (Priority) | $78,000-$79,000 | Twice blocked today, insufficient bullish confidence
Short-term Long for a Bounce | $75,500-$76,500 | Support at intraday low, dense trading area
Mid-term Positioning | $74,000-$75,500 | Overlapping 200-day moving average + previous support
Breakout Long | After reclaiming $82,500 | Valid breakout from previous highs, confirming a new trend
Stop-loss Recommendations🍺
- Short Position: $80,000 Stop-loss
- Long Position (Bounce): $74,500 Stop-loss
- Mid-term Long: $72,000 Stop-loss
#BTC走势分析
Price Range📈
- Current Price: $77,517
- Intraday High: $82,496
- Intraday Low: $75,437
- Daily Change: -$471 (-0.6%)
Macro Environment✈️
1. Fed Rate Expectations — Bearish
- Fed meeting minutes show officials are worried about inflation, raising rate hike expectations
2. Rising Geopolitical Risk in Iran
- Trump indicates US-Iran negotiations are in the "final stages," increasing market risk aversion
- Risk assets are under short-term pressure, with increased volatility due to uncertainty in the Middle East
3. Institutional ETF Outflows Persist
BlackRock IBIT has seen a net outflow for 5 consecutive days (single-day outflow of $103.64M on 5/21)
In the past 7 days, BTC ETF has seen a net outflow of 15,915 BTC (approximately $1.23B)
4. Inflation Data🥖
US CPI reaches 3.8%, inflation resilience exceeds expectations
This is the core reason for the Fed delaying rate cuts
Rising real rates are detrimental to BTC in the mid-term
On-chain and Market Structure🙏
- BTC options implied volatility (BVIV) is low at around 42%, suggesting potential for increased volatility around CPI/Fed rate decisions
- Long leverage has been flushed ($661M in liquidations), which is favorable for bottoming
- Fear and Greed Index: 27 (Fear), consistently below 30
- Clear resistance formed around the high of $82,500
Direction👇
Short-term: Bearish consolidation, waiting for a bottom signal
ETF outflows + rising rate hike expectations = Difficult to see a significant rebound in the short term
The high of $82,500 has formed a short-term top
Mid-term: Wide-range oscillation, waiting for better entry points
- Macro liquidity tightening, significant mid-term upside requires new catalysts (return of rate cut expectations / easing geopolitical risks)
Entry Points🤖
Short-term Short (Priority) | $78,000-$79,000 | Twice blocked today, insufficient bullish confidence
Short-term Long for a Bounce | $75,500-$76,500 | Support at intraday low, dense trading area
Mid-term Positioning | $74,000-$75,500 | Overlapping 200-day moving average + previous support
Breakout Long | After reclaiming $82,500 | Valid breakout from previous highs, confirming a new trend
Stop-loss Recommendations🍺
- Short Position: $80,000 Stop-loss
- Long Position (Bounce): $74,500 Stop-loss
- Mid-term Long: $72,000 Stop-loss
#BTC走势分析
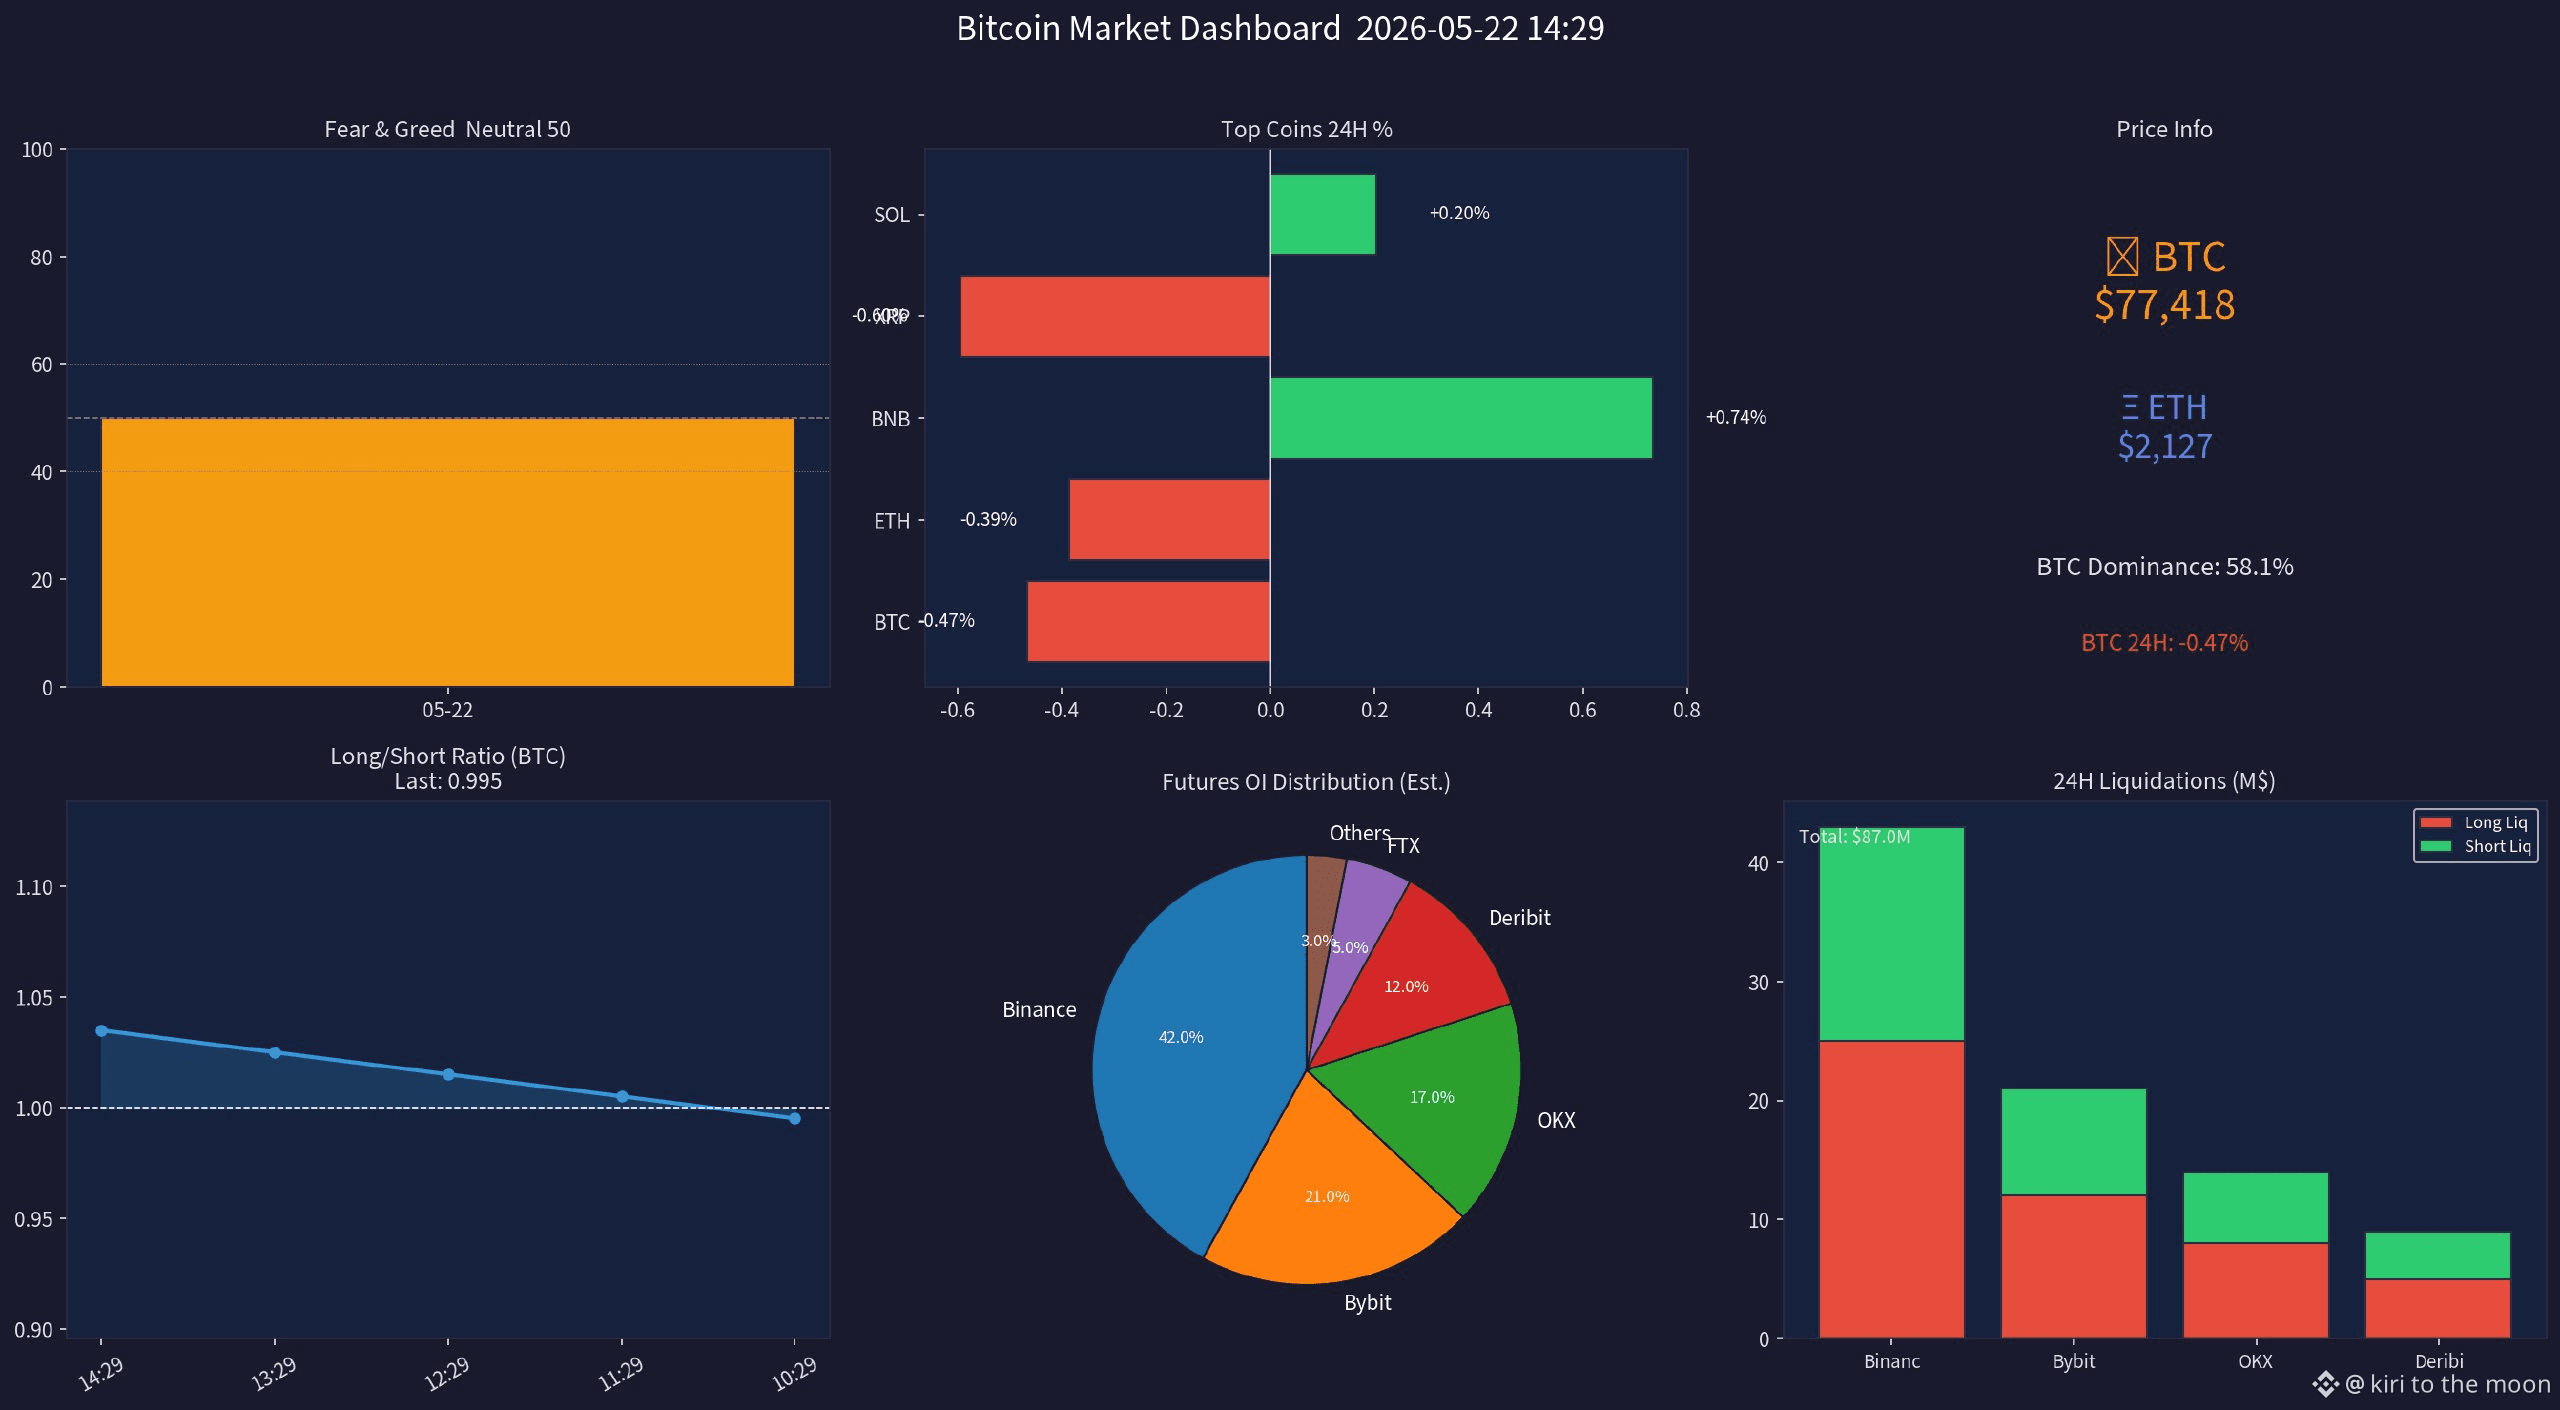
1
370
·
--
Bullish
Crypto Market Analysis Today 📰 2026.05.01
🎲Sentiment
😍Fear & Greed Index: 45 (Neutral)
From late April to early May, there's been a significant bounce from the Extreme Fear (25-28) zone, hitting a local low on May 1 (BTC $76,436). It then rebounded continuously to today, with an increase of +20 points, currently in the Neutral range, still with space to reach Greed (60+). Overall, we remain cautiously optimistic, with no signs of FOMO frenzy.
Mainstream Coin Performance💨
$BTC $81,060 +0.61% (24h high $81,791 / low $80,457)
$ETH $2,361 -0.43% (24h high $2,399 / low $2,354)
$SOL $86.44 +2.20% (24h high $87.00 / low $84.41)
Trading Volume🌊
BTC 24h volume 17,798 BTC ($42.7B), recently at a high level.
ETH 24h volume 293,092 ETH ($16.7B)
SOL 24h volume 2.57M SOL ($3.69B), SOL ecosystem is active.
Overall volume aligns with price rebounds; volume and price rising together is a healthy sign.
Technical Analysis Reference🎲BTC
• Rebounded from the bottom at $75,667 by approximately +$5,393 (+7.1%)
• Daily RSI ≈ 68-71 — strong but not overbought
• Currently facing resistance in the $81,000-81,791 range (previous high point pressure)
• If it breaks through $81,800 → next target $83,500-85,000
• Key support has moved up to the $78,500-79,000 range.
Today's Important News/Narratives🗞️
1️⃣ Bitcoin ETF Continues to See Inflows
BTC ETF saw a net inflow of $824M this week, MicroStrategy increased holdings by 3,273 BTC, institutions are building positions, which is bullish for the mid-term.
2️⃣ Aave Proposal Discussing Post-crisis Handling of rsETH
TokenLogic suggests pausing AAVE buybacks; community voting started on April 28, with limited impact on the DeFi ecosystem's localized risk event.
3️⃣ XRP Maintains Range of $1.38-$1.44
Intense bull-bear battle, $1.50 is the key breakout level. Ripple RLUSD stablecoin supply is approaching $1.6B (strong institutional demand). XRP fundamentals are continually improving, watch for a breakout.
Overall Judgment🎯
Short Term: Neutral to Bullish (60/100)
- Fear index has rebounded from the bottom, sentiment is recovering.
- BTC holds above $78,500 support; trend is intact.
- Smaller cap coins like SOL/TON/DOGE are performing actively.
- Market is cautious ahead of the FOMC; a breakout requires new catalysts.
Mid Term: Bullish Consolidation
- Institutions continue buying (ETF + MicroStrategy)
- $80K psychological level still needs consolidation.
- If it breaks $81,800 → looking towards $85K.
- Key risk: FOMC hawkishness + escalation of geopolitical events.
#BTC走势分析
Crypto Market Analysis Today 📰 2026.05.01
🎲Sentiment
😍Fear & Greed Index: 45 (Neutral)
From late April to early May, there's been a significant bounce from the Extreme Fear (25-28) zone, hitting a local low on May 1 (BTC $76,436). It then rebounded continuously to today, with an increase of +20 points, currently in the Neutral range, still with space to reach Greed (60+). Overall, we remain cautiously optimistic, with no signs of FOMO frenzy.
Mainstream Coin Performance💨
$BTC $81,060 +0.61% (24h high $81,791 / low $80,457)
$ETH $2,361 -0.43% (24h high $2,399 / low $2,354)
$SOL $86.44 +2.20% (24h high $87.00 / low $84.41)
Trading Volume🌊
BTC 24h volume 17,798 BTC ($42.7B), recently at a high level.
ETH 24h volume 293,092 ETH ($16.7B)
SOL 24h volume 2.57M SOL ($3.69B), SOL ecosystem is active.
Overall volume aligns with price rebounds; volume and price rising together is a healthy sign.
Technical Analysis Reference🎲BTC
• Rebounded from the bottom at $75,667 by approximately +$5,393 (+7.1%)
• Daily RSI ≈ 68-71 — strong but not overbought
• Currently facing resistance in the $81,000-81,791 range (previous high point pressure)
• If it breaks through $81,800 → next target $83,500-85,000
• Key support has moved up to the $78,500-79,000 range.
Today's Important News/Narratives🗞️
1️⃣ Bitcoin ETF Continues to See Inflows
BTC ETF saw a net inflow of $824M this week, MicroStrategy increased holdings by 3,273 BTC, institutions are building positions, which is bullish for the mid-term.
2️⃣ Aave Proposal Discussing Post-crisis Handling of rsETH
TokenLogic suggests pausing AAVE buybacks; community voting started on April 28, with limited impact on the DeFi ecosystem's localized risk event.
3️⃣ XRP Maintains Range of $1.38-$1.44
Intense bull-bear battle, $1.50 is the key breakout level. Ripple RLUSD stablecoin supply is approaching $1.6B (strong institutional demand). XRP fundamentals are continually improving, watch for a breakout.
Overall Judgment🎯
Short Term: Neutral to Bullish (60/100)
- Fear index has rebounded from the bottom, sentiment is recovering.
- BTC holds above $78,500 support; trend is intact.
- Smaller cap coins like SOL/TON/DOGE are performing actively.
- Market is cautious ahead of the FOMC; a breakout requires new catalysts.
Mid Term: Bullish Consolidation
- Institutions continue buying (ETF + MicroStrategy)
- $80K psychological level still needs consolidation.
- If it breaks $81,800 → looking towards $85K.
- Key risk: FOMC hawkishness + escalation of geopolitical events.
#BTC走势分析
🎲Sentiment
😍Fear & Greed Index: 45 (Neutral)
From late April to early May, there's been a significant bounce from the Extreme Fear (25-28) zone, hitting a local low on May 1 (BTC $76,436). It then rebounded continuously to today, with an increase of +20 points, currently in the Neutral range, still with space to reach Greed (60+). Overall, we remain cautiously optimistic, with no signs of FOMO frenzy.
Mainstream Coin Performance💨
$BTC $81,060 +0.61% (24h high $81,791 / low $80,457)
$ETH $2,361 -0.43% (24h high $2,399 / low $2,354)
$SOL $86.44 +2.20% (24h high $87.00 / low $84.41)
Trading Volume🌊
BTC 24h volume 17,798 BTC ($42.7B), recently at a high level.
ETH 24h volume 293,092 ETH ($16.7B)
SOL 24h volume 2.57M SOL ($3.69B), SOL ecosystem is active.
Overall volume aligns with price rebounds; volume and price rising together is a healthy sign.
Technical Analysis Reference🎲BTC
• Rebounded from the bottom at $75,667 by approximately +$5,393 (+7.1%)
• Daily RSI ≈ 68-71 — strong but not overbought
• Currently facing resistance in the $81,000-81,791 range (previous high point pressure)
• If it breaks through $81,800 → next target $83,500-85,000
• Key support has moved up to the $78,500-79,000 range.
Today's Important News/Narratives🗞️
1️⃣ Bitcoin ETF Continues to See Inflows
BTC ETF saw a net inflow of $824M this week, MicroStrategy increased holdings by 3,273 BTC, institutions are building positions, which is bullish for the mid-term.
2️⃣ Aave Proposal Discussing Post-crisis Handling of rsETH
TokenLogic suggests pausing AAVE buybacks; community voting started on April 28, with limited impact on the DeFi ecosystem's localized risk event.
3️⃣ XRP Maintains Range of $1.38-$1.44
Intense bull-bear battle, $1.50 is the key breakout level. Ripple RLUSD stablecoin supply is approaching $1.6B (strong institutional demand). XRP fundamentals are continually improving, watch for a breakout.
Overall Judgment🎯
Short Term: Neutral to Bullish (60/100)
- Fear index has rebounded from the bottom, sentiment is recovering.
- BTC holds above $78,500 support; trend is intact.
- Smaller cap coins like SOL/TON/DOGE are performing actively.
- Market is cautious ahead of the FOMC; a breakout requires new catalysts.
Mid Term: Bullish Consolidation
- Institutions continue buying (ETF + MicroStrategy)
- $80K psychological level still needs consolidation.
- If it breaks $81,800 → looking towards $85K.
- Key risk: FOMC hawkishness + escalation of geopolitical events.
#BTC走势分析
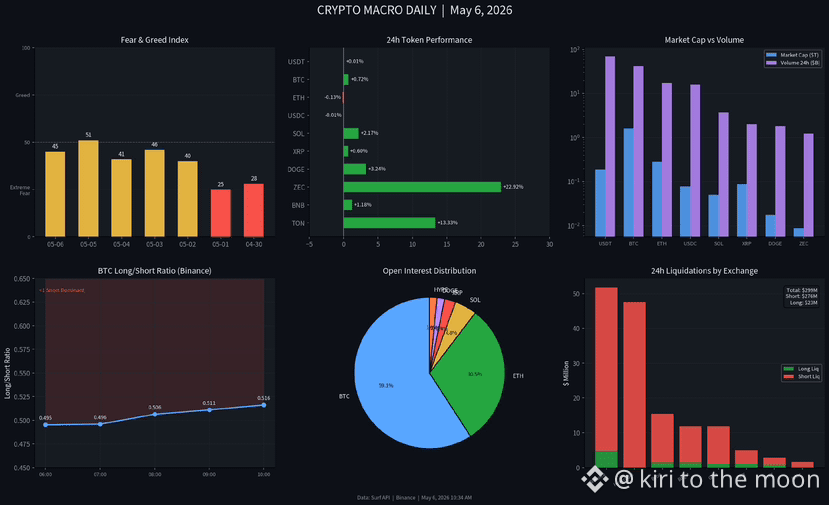
1
550
·
--
Article
4️⃣8️⃣ hour ultimatum is back❕ How much longer will Trump torment Bitcoin❓Trump has given Iran another 48 hours. This is not the first time, and it probably won't be the last.
Iran this time did not beat around the bush, directly saying: If you touch my infrastructure, I will strike all your military bases 'unrestrictedly', including those of Israel. The US military has already been discussing listing Iran's power plants and bridges as 'legitimate military targets'. Senator Graham was even more straightforward: Either open the Strait, or get hit.
Sounds scary, right? But the market hasn't really reacted. Oil prices are rising, while Bitcoin is hovering between 65,000 and 67,000, and the funding rate is not panicking. It seems everyone has gotten used to it—or rather, has been forced to get used to it. War is no longer news, but background noise.
4️⃣8️⃣ hour ultimatum is back❕ How much longer will Trump torment Bitcoin❓
Trump has given Iran another 48 hours. This is not the first time, and it probably won't be the last.
Iran this time did not beat around the bush, directly saying: If you touch my infrastructure, I will strike all your military bases 'unrestrictedly', including those of Israel. The US military has already been discussing listing Iran's power plants and bridges as 'legitimate military targets'. Senator Graham was even more straightforward: Either open the Strait, or get hit.
Sounds scary, right? But the market hasn't really reacted. Oil prices are rising, while Bitcoin is hovering between 65,000 and 67,000, and the funding rate is not panicking. It seems everyone has gotten used to it—or rather, has been forced to get used to it. War is no longer news, but background noise.
Iran this time did not beat around the bush, directly saying: If you touch my infrastructure, I will strike all your military bases 'unrestrictedly', including those of Israel. The US military has already been discussing listing Iran's power plants and bridges as 'legitimate military targets'. Senator Graham was even more straightforward: Either open the Strait, or get hit.
Sounds scary, right? But the market hasn't really reacted. Oil prices are rising, while Bitcoin is hovering between 65,000 and 67,000, and the funding rate is not panicking. It seems everyone has gotten used to it—or rather, has been forced to get used to it. War is no longer news, but background noise.
11
5.7k
·
--

Article
When war is no longer 'rhetoric,' can Bitcoin bottom out?Today's information volume is large, but what is truly worth chewing over are two seemingly contradictory signals: on one side, the U.S. military's F-15 was shot down over Iran, and the aircraft crashed in the Persian Gulf, with the insurance limit in the Strait of Hormuz doubling to $40 billion; on the other side, Charles Schwab, which manages $12 trillion in assets, announced it will launch spot trading for Bitcoin and Ethereum.
This is not some cliche about 'conflict and compliance coexisting.' These are two completely opposite forces violently colliding on the same timeline. On one side is the violent escalation in the physical world, while on the other side is the institutional acceptance in the financial world. Bitcoin is caught in the middle, being torn apart by both forces repeatedly.
When war is no longer 'rhetoric,' can Bitcoin bottom out?
Today's information volume is large, but what is truly worth chewing over are two seemingly contradictory signals: on one side, the U.S. military's F-15 was shot down over Iran, and the aircraft crashed in the Persian Gulf, with the insurance limit in the Strait of Hormuz doubling to $40 billion; on the other side, Charles Schwab, which manages $12 trillion in assets, announced it will launch spot trading for Bitcoin and Ethereum.
This is not some cliche about 'conflict and compliance coexisting.' These are two completely opposite forces violently colliding on the same timeline. On one side is the violent escalation in the physical world, while on the other side is the institutional acceptance in the financial world. Bitcoin is caught in the middle, being torn apart by both forces repeatedly.
This is not some cliche about 'conflict and compliance coexisting.' These are two completely opposite forces violently colliding on the same timeline. On one side is the violent escalation in the physical world, while on the other side is the institutional acceptance in the financial world. Bitcoin is caught in the middle, being torn apart by both forces repeatedly.
2
366
·
--
Bearish
When bulls become fuel, bears are the true "holders". Who could have imagined that a few years ago, the phrase "the bull army will never be enslaved" would ultimately become prophetic. 😭
This wave of pullback in mid-March superficially appears to be a Taco trade by Chuanzi, but in reality, it is not an ordinary pullback.
On March 17, Bitcoin was $74,883, with a position index 30-day moving average of +3.0. A bull's carnival. 📈
On April 3, Bitcoin was $66,603, with the same index at -3.1. A bear's silent accumulation. 📉
On the surface, it has fallen 11%, but the truly fatal aspect is that bulls are being systematically forced to liquidate day by day, while the red bars for bears have disappeared for a full six months.
The 18.6% liquidation oscillation indicator is not volatility; it is a body count. ☠️
Many people are still asking, "Where is the bottom?" But real traders (those who are prepared to take a dive 🌊) should ask: Who still has ammunition? Who is being forced to sell?
Since October 2025, the market has not seen a structure dominated by bear liquidations. This means:
In the past six months, every rebound has not been a short squeeze; it has merely been bulls giving themselves an IV drip. Liquidity has not been inversely squeezed; there has only been one-way consumption.
This is not a confidence issue; it is a mathematical issue.
As long as the 30-day moving average does not reverse downward, and as long as the red bars do not return, every time someone says, "I think I can buy at the bottom now," they are handing a knife to the bears.
If it cannot break through the resistance zone of 69,000, then it will be hard to hold $66,000. Not because it "should fall," but because the current derivatives structure does not allow the market to rest.
Avoiding risk is not pessimism. It is a hope that when everyone is focused on the price, they can understand the language of positions through on-chain data analysis. 📊
#BTC行情
{spot}(BTCUSDT)
When bulls become fuel, bears are the true "holders". Who could have imagined that a few years ago, the phrase "the bull army will never be enslaved" would ultimately become prophetic. 😭
This wave of pullback in mid-March superficially appears to be a Taco trade by Chuanzi, but in reality, it is not an ordinary pullback.
On March 17, Bitcoin was $74,883, with a position index 30-day moving average of +3.0. A bull's carnival. 📈
On April 3, Bitcoin was $66,603, with the same index at -3.1. A bear's silent accumulation. 📉
On the surface, it has fallen 11%, but the truly fatal aspect is that bulls are being systematically forced to liquidate day by day, while the red bars for bears have disappeared for a full six months.
The 18.6% liquidation oscillation indicator is not volatility; it is a body count. ☠️
Many people are still asking, "Where is the bottom?" But real traders (those who are prepared to take a dive 🌊) should ask: Who still has ammunition? Who is being forced to sell?
Since October 2025, the market has not seen a structure dominated by bear liquidations. This means:
In the past six months, every rebound has not been a short squeeze; it has merely been bulls giving themselves an IV drip. Liquidity has not been inversely squeezed; there has only been one-way consumption.
This is not a confidence issue; it is a mathematical issue.
As long as the 30-day moving average does not reverse downward, and as long as the red bars do not return, every time someone says, "I think I can buy at the bottom now," they are handing a knife to the bears.
If it cannot break through the resistance zone of 69,000, then it will be hard to hold $66,000. Not because it "should fall," but because the current derivatives structure does not allow the market to rest.
Avoiding risk is not pessimism. It is a hope that when everyone is focused on the price, they can understand the language of positions through on-chain data analysis. 📊
#BTC行情
This wave of pullback in mid-March superficially appears to be a Taco trade by Chuanzi, but in reality, it is not an ordinary pullback.
On March 17, Bitcoin was $74,883, with a position index 30-day moving average of +3.0. A bull's carnival. 📈
On April 3, Bitcoin was $66,603, with the same index at -3.1. A bear's silent accumulation. 📉
On the surface, it has fallen 11%, but the truly fatal aspect is that bulls are being systematically forced to liquidate day by day, while the red bars for bears have disappeared for a full six months.
The 18.6% liquidation oscillation indicator is not volatility; it is a body count. ☠️
Many people are still asking, "Where is the bottom?" But real traders (those who are prepared to take a dive 🌊) should ask: Who still has ammunition? Who is being forced to sell?
Since October 2025, the market has not seen a structure dominated by bear liquidations. This means:
In the past six months, every rebound has not been a short squeeze; it has merely been bulls giving themselves an IV drip. Liquidity has not been inversely squeezed; there has only been one-way consumption.
This is not a confidence issue; it is a mathematical issue.
As long as the 30-day moving average does not reverse downward, and as long as the red bars do not return, every time someone says, "I think I can buy at the bottom now," they are handing a knife to the bears.
If it cannot break through the resistance zone of 69,000, then it will be hard to hold $66,000. Not because it "should fall," but because the current derivatives structure does not allow the market to rest.
Avoiding risk is not pessimism. It is a hope that when everyone is focused on the price, they can understand the language of positions through on-chain data analysis. 📊
#BTC行情
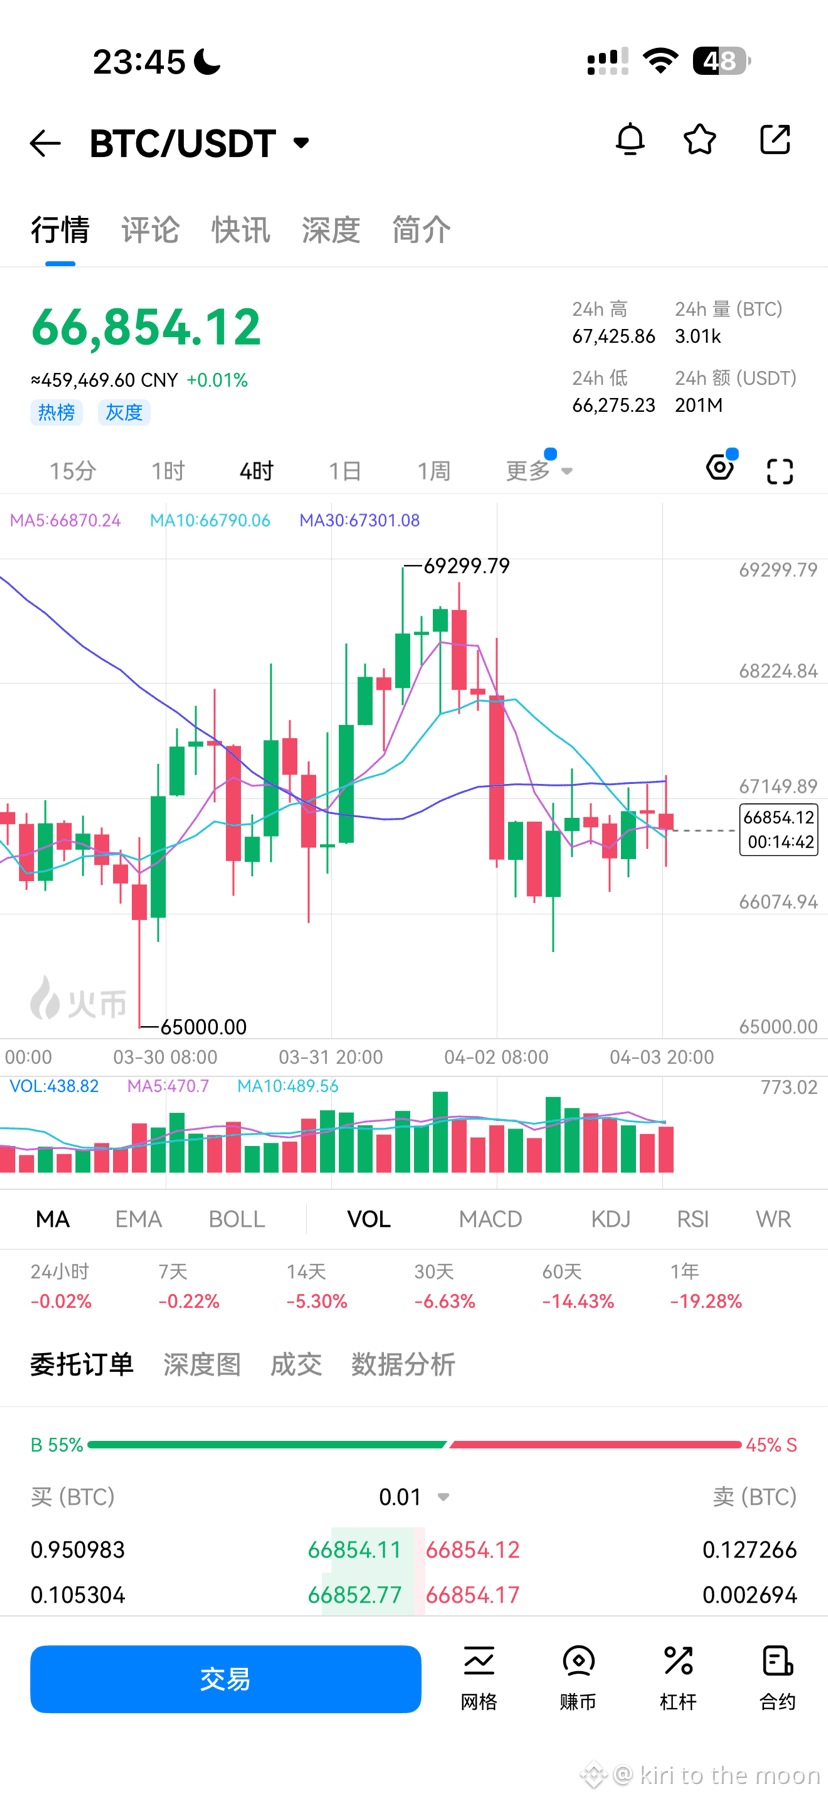
489
Log in to explore more content
Join global crypto users on Binance Square
⚡️ Get latest and useful information about crypto.
💬 Trusted by the world’s largest crypto exchange.
👍 Discover real insights from verified creators.
Email / Phone number
Trending Topics
USAugustPPIRisesLessThanExpected
860 views
78 Discussing
🚨 US AUG PPI: Rises LESS Than Expected! Bullish for Crypto? 🚀
PPI +0.4% MoM as expected, but CORE PPI only +0.2% vs +0.3% expected - cooling!
What it means:
• Wholesale inflation softer than feared
• Fed rate hike chance now 62% - but dovish signals coming
• Core PCE revisions expected downward - bullish
• BTC usually pumps on softer PPI
Fed meeting Sep 15-16 - Market now expects pause, not hike?
Is this the green light for Q4 rally?
#Bitcoin #PPI #Fed #CryptoNews #BTC#usaugustppiriseslessthanexpected
True News
·1 Likes
·357 views
SECApprovesNasdaqTexasCommodityTrustRule
2,760 views
146 Discussing
ECBRaisesRatesSecondTimeTo2.5%
1,300 views
94 Discussing