

Leo524
543 Posts

Leo524

ICP Holder
High-Frequency Trader
3.3 Years
0 Following
797 Followers
3.0K+ Liked
Posts
All
Quotes
Videos
Leo524
·
--
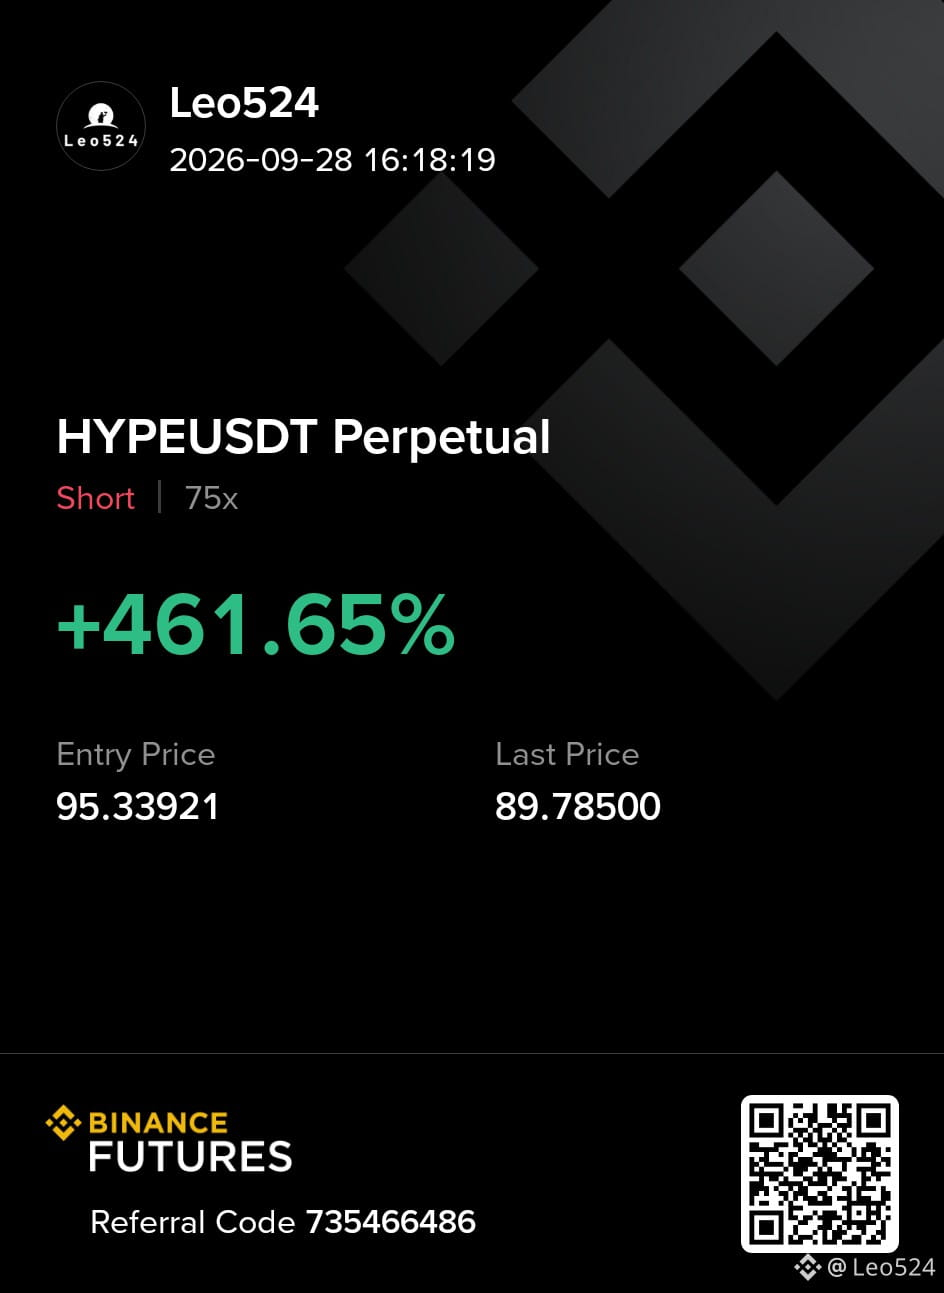
Bearish$HYPE: The Liquidity Trap Above $93 !!
$HYPE is showing a strong bullish expansion after breaking above the previous structure. Price is now trading around $91.6, while a major liquidity area sits near $93–95.
The key point is that the $93.8 area holds around $1.85M in liquidation leverage, making it an important level to watch. Price may first test or sweep this liquidity before showing a meaningful reaction.
From a structure perspective, the current move is still bullish. A short setup should not be taken simply because RSI is high or price has moved fast.
For a bearish setup, we want to see liquidity sweep → rejection → bearish CHoCH/BOS → displacement.
If that confirmation appears, the next downside area becomes the $80–82 demand zone.
$HYPE is showing a strong bullish expansion after breaking above the previous structure. Price is now trading around $91.6, while a major liquidity area sits near $93–95.
The key point is that the $93.8 area holds around $1.85M in liquidation leverage, making it an important level to watch. Price may first test or sweep this liquidity before showing a meaningful reaction.
From a structure perspective, the current move is still bullish. A short setup should not be taken simply because RSI is high or price has moved fast.
For a bearish setup, we want to see liquidity sweep → rejection → bearish CHoCH/BOS → displacement.
If that confirmation appears, the next downside area becomes the $80–82 demand zone.

Leo524
·
--
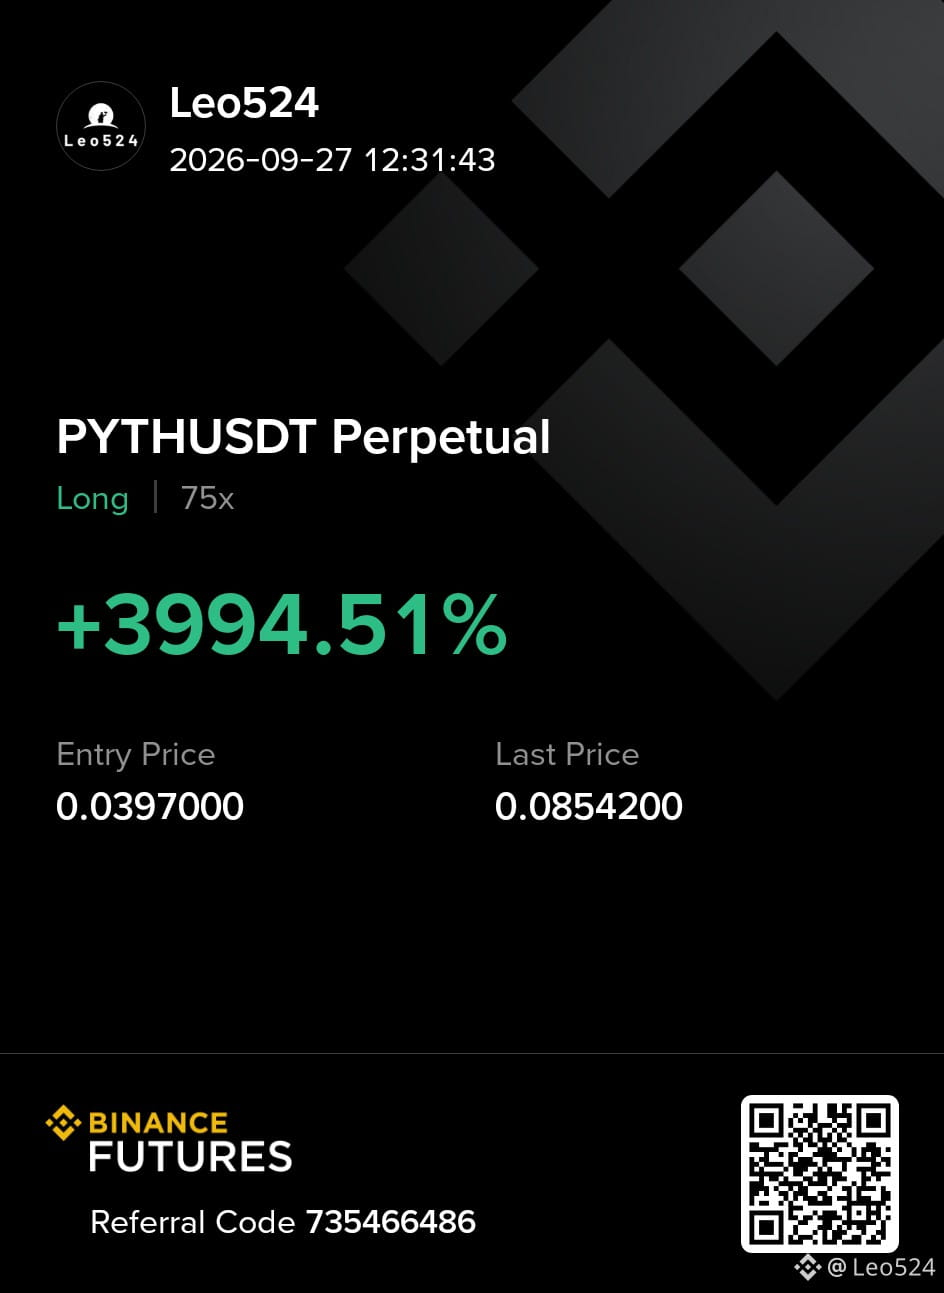
$PYTH HOLDERS: THIS LEVEL DECIDES EVERYTHING!
$PYTH is approaching one of the most important areas on the chart. The green demand zone remains the key support for this trend. As long as price holds above that area, the bullish structure stays valid and a move toward $0.061 and eventually $0.072 is still on the table.
However, if this support breaks with a strong bearish candle, increasing sell volume, and the market starts printing lower lows, the current long idea becomes invalid. In that case, I would wait for a new structure instead of forcing a trade.
$PYTH is approaching one of the most important areas on the chart. The green demand zone remains the key support for this trend. As long as price holds above that area, the bullish structure stays valid and a move toward $0.061 and eventually $0.072 is still on the table.
However, if this support breaks with a strong bearish candle, increasing sell volume, and the market starts printing lower lows, the current long idea becomes invalid. In that case, I would wait for a new structure instead of forcing a trade.
Leo524
·
--
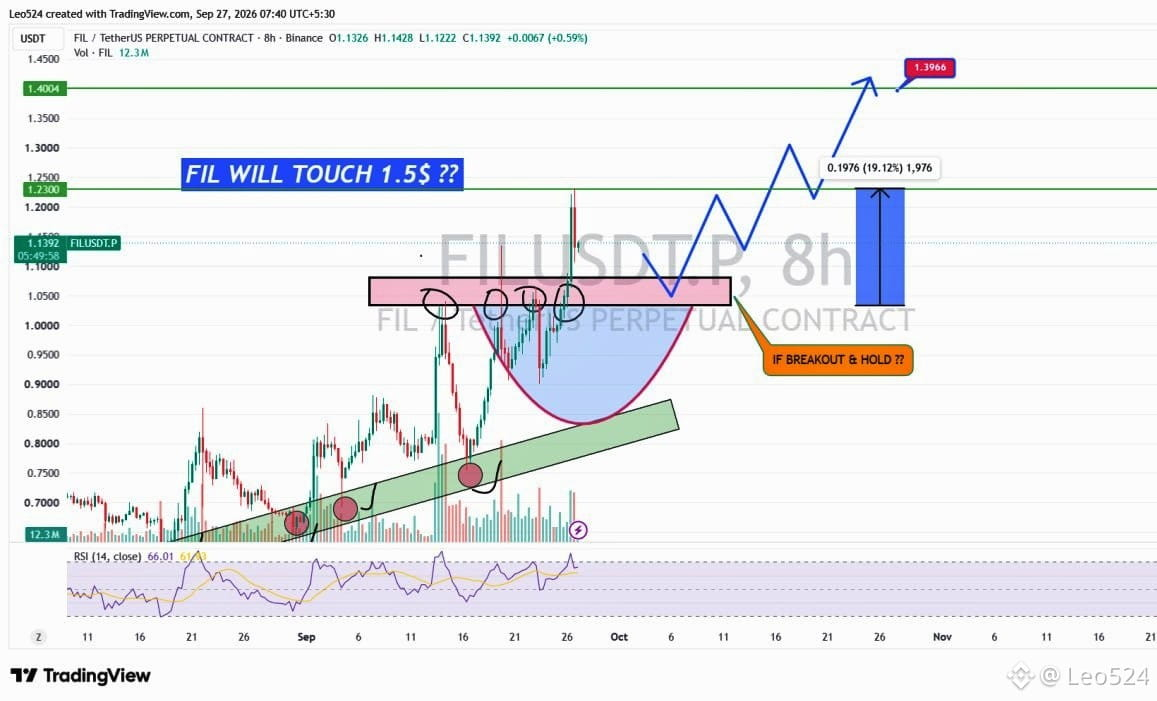
$FIL — Is $1.50 Coming? 👀
FIL is currently testing a major resistance zone around $1.04–$1.08 on the 8H chart.
What I’m watching:
• FIL has been respecting an ascending support structure
• Multiple reactions from the rising trendline show buyers are still defending it
• Price is now back at the same resistance area
• A clean breakout followed by a strong hold could open the way toward the $1.50 area
But there’s one important condition:
I want to see FIL break the resistance and hold above it, not just wick through it.
If that happens, the structure becomes much more interesting.
FIL is currently testing a major resistance zone around $1.04–$1.08 on the 8H chart.
What I’m watching:
• FIL has been respecting an ascending support structure
• Multiple reactions from the rising trendline show buyers are still defending it
• Price is now back at the same resistance area
• A clean breakout followed by a strong hold could open the way toward the $1.50 area
But there’s one important condition:
I want to see FIL break the resistance and hold above it, not just wick through it.
If that happens, the structure becomes much more interesting.
Leo524
·
--
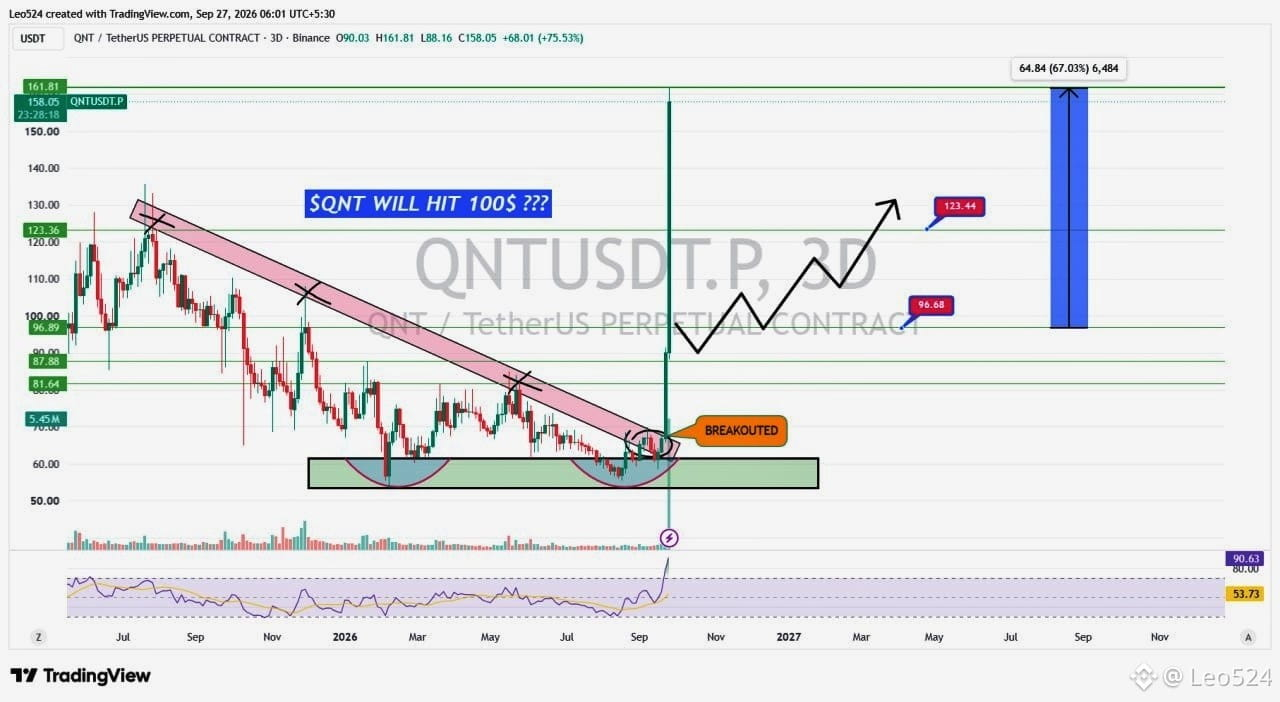
$QNT JUST EXPLODED 39% — IS $120 THE NEXT STOP ??
QNT is suddenly getting serious attention after a strong +39% move.On the 3D chart, QNT spent months moving inside a clear descending trendline while repeatedly finding support around the $54–$61 zone.
Now things have changed.QNT has broken above that long-term descending trendline, and the breakout came with a strong bullish candle and increased volume.
The first major area I’m watching is around $96–$97.If QNT can reclaim and hold that zone, the next important resistance on my chart sits around $123.
#QNT
#qntrises39%
QNT is suddenly getting serious attention after a strong +39% move.On the 3D chart, QNT spent months moving inside a clear descending trendline while repeatedly finding support around the $54–$61 zone.
Now things have changed.QNT has broken above that long-term descending trendline, and the breakout came with a strong bullish candle and increased volume.
The first major area I’m watching is around $96–$97.If QNT can reclaim and hold that zone, the next important resistance on my chart sits around $123.
#QNT
#qntrises39%

Leo524
·
--
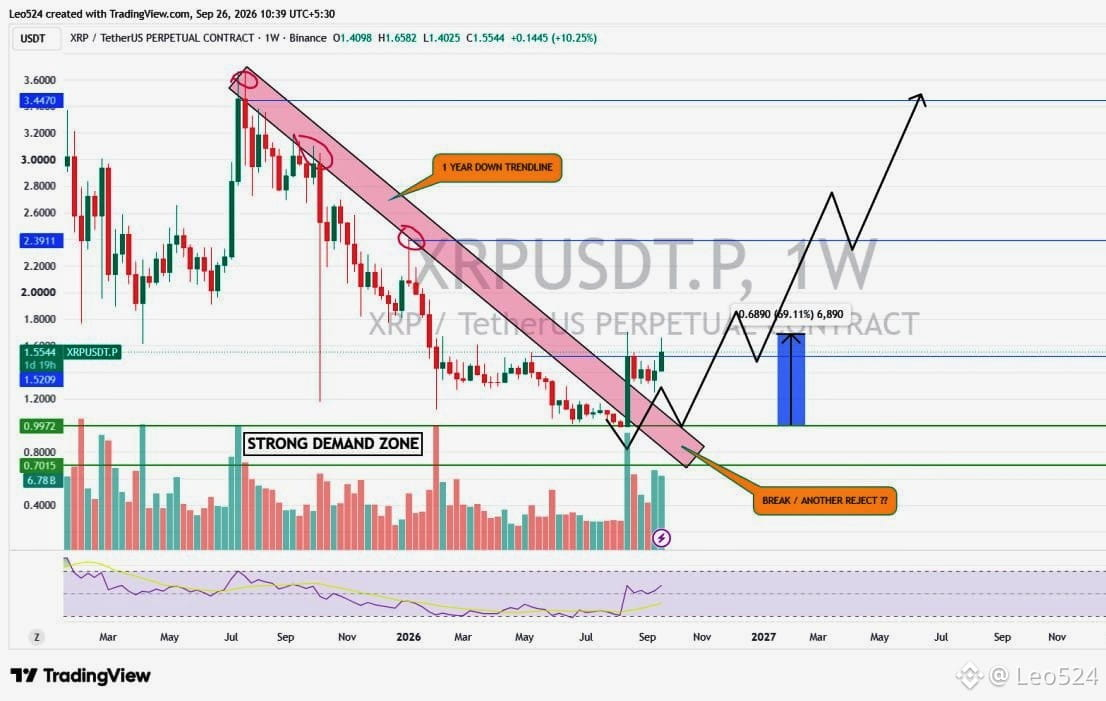
Bullish$XRP Is Sitting At A Major Long-Term Decision Zone 👀
One thing stands out on XRP right now: price has been respecting a long-term descending trendline for almost a year, with sellers repeatedly stepping in whenever price approaches the upper boundary.
Now, XRP is back inside a strong demand area after another extended decline. This is an important decision zone because buyers have an opportunity to defend the area and start building a new recovery structure. 📈
The key thing I’m watching is whether price can break the descending trendline and then hold above it. A clean breakout followed by a successful retest could mark a major shift in the long-term structure and open the path toward the higher resistance zones.
I would still avoid chasing the first breakout. Confirmation and a retest would provide a much cleaner setup. If sellers reject the trendline again, however, XRP could remain trapped inside the long-term bearish structure. ⚠️
#LEO524 #XRP #Ripple #Crypto #PriceAction #SMC
Analysis by LEO524
One thing stands out on XRP right now: price has been respecting a long-term descending trendline for almost a year, with sellers repeatedly stepping in whenever price approaches the upper boundary.
Now, XRP is back inside a strong demand area after another extended decline. This is an important decision zone because buyers have an opportunity to defend the area and start building a new recovery structure. 📈
The key thing I’m watching is whether price can break the descending trendline and then hold above it. A clean breakout followed by a successful retest could mark a major shift in the long-term structure and open the path toward the higher resistance zones.
I would still avoid chasing the first breakout. Confirmation and a retest would provide a much cleaner setup. If sellers reject the trendline again, however, XRP could remain trapped inside the long-term bearish structure. ⚠️
#LEO524 #XRP #Ripple #Crypto #PriceAction #SMC
Analysis by LEO524


Log in to explore more content