
周东野
546 Posts

周东野
Report
Block User
I'm Dongye from Rian,Dedicated to making life more interesting.
热爱自己热爱的东西,分析、家庭、分享、新闻、加密、公益。
声明:所有推文皆为个人观点,不构成任何投资建议。
投资有风险,入市需谨慎。合作私聊
Open Trade
High-Frequency Trader
5.3 Years
21 Following
7.4K+ Followers
1.2K+ Liked
Posts
Portfolio
All
Quotes
Videos
Live
·
--
Partly True
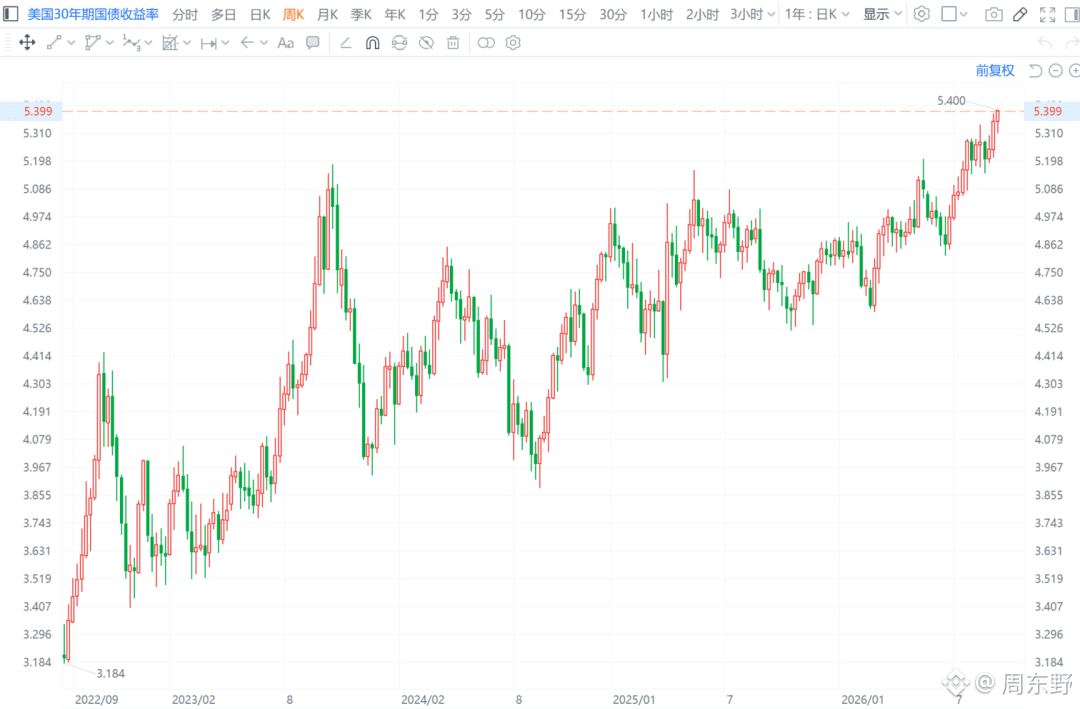
The yield on US 30-year Treasury bonds surged all the way to 5.40%, immediately setting a new record high since June 2007.
On the surface, this move in US Treasury yields looks like the market is repricing long-term fiscal deficits and inflation expectations. In reality, it’s the benchmark anchor for the global risk-free rate being forcibly pulled upward. Once long-term borrowing costs are pinned firmly at this level, the liquidity-drain effect may arrive sooner—and hit harder—than many expect.
Many funds are still betting on the upside of a rate-cut cycle. But runaway yields on the long end signal that big money doesn’t believe rate cuts can solve the core problem. With tens of trillions of dollars in newly issued Treasuries each year that the market must absorb, it’s inevitable that buyers will demand a higher term premium. This kind of risk-free return is brutally oppressive to on-chain and risk assets. When you can earn a hard, annualized net return above 5% from compliant risk-free assets, investors’ requirements for high-risk, high-friction yield agreements rise to an extremely harsh level.
That means any arbitrage models that rely on liquidity premiums—or try to prop up results with inflated APY—will instantly fail in the face of this cost of capital. For assets that can truly hold up, or even chart their own independent rally, they must either have extremely solid underlying real-return ledgers, or be extreme safe-haven instruments completely detached from the fiat currency pricing system. The destructive power of this kind of macro liquidity environment is only just beginning to show.
$BTC
#美国30年期国债收益率升破5.40%
The yield on US 30-year Treasury bonds surged all the way to 5.40%, immediately setting a new record high since June 2007.
On the surface, this move in US Treasury yields looks like the market is repricing long-term fiscal deficits and inflation expectations. In reality, it’s the benchmark anchor for the global risk-free rate being forcibly pulled upward. Once long-term borrowing costs are pinned firmly at this level, the liquidity-drain effect may arrive sooner—and hit harder—than many expect.
Many funds are still betting on the upside of a rate-cut cycle. But runaway yields on the long end signal that big money doesn’t believe rate cuts can solve the core problem. With tens of trillions of dollars in newly issued Treasuries each year that the market must absorb, it’s inevitable that buyers will demand a higher term premium. This kind of risk-free return is brutally oppressive to on-chain and risk assets. When you can earn a hard, annualized net return above 5% from compliant risk-free assets, investors’ requirements for high-risk, high-friction yield agreements rise to an extremely harsh level.
That means any arbitrage models that rely on liquidity premiums—or try to prop up results with inflated APY—will instantly fail in the face of this cost of capital. For assets that can truly hold up, or even chart their own independent rally, they must either have extremely solid underlying real-return ledgers, or be extreme safe-haven instruments completely detached from the fiat currency pricing system. The destructive power of this kind of macro liquidity environment is only just beginning to show.
$BTC
#美国30年期国债收益率升破5.40%
On the surface, this move in US Treasury yields looks like the market is repricing long-term fiscal deficits and inflation expectations. In reality, it’s the benchmark anchor for the global risk-free rate being forcibly pulled upward. Once long-term borrowing costs are pinned firmly at this level, the liquidity-drain effect may arrive sooner—and hit harder—than many expect.
Many funds are still betting on the upside of a rate-cut cycle. But runaway yields on the long end signal that big money doesn’t believe rate cuts can solve the core problem. With tens of trillions of dollars in newly issued Treasuries each year that the market must absorb, it’s inevitable that buyers will demand a higher term premium. This kind of risk-free return is brutally oppressive to on-chain and risk assets. When you can earn a hard, annualized net return above 5% from compliant risk-free assets, investors’ requirements for high-risk, high-friction yield agreements rise to an extremely harsh level.
That means any arbitrage models that rely on liquidity premiums—or try to prop up results with inflated APY—will instantly fail in the face of this cost of capital. For assets that can truly hold up, or even chart their own independent rally, they must either have extremely solid underlying real-return ledgers, or be extreme safe-haven instruments completely detached from the fiat currency pricing system. The destructive power of this kind of macro liquidity environment is only just beginning to show.
$BTC
#美国30年期国债收益率升破5.40%
1
2.1k
·
--
In September’s macro chessboard, everyone’s focus has been anchored by the question of whether the Fed will “raise rates or not.” But once you work out the cost of capital and the liquidity premium, you’ll find that what truly chokes the market isn’t just the presence of rate hikes—it’s the depth of a structural tightening and the length of time liquidity withdrawal continues.
Inflation has the Fed sitting over an open fire. The year-over-year CPI growth rate is being stubbornly held at the extremely awkward level of 3.4%, far from the 2% policy target. It may look like only a 1.4 percentage-point gap, but given the current backdrop of frequent geopolitical disruptions that are constraining oil supply on the cost side, this inflation component is highly persistent. As long as energy-side prices and basic inputs can’t come down, terminal borrowing costs must remain at levels capable of forcibly suppressing aggregate demand.
The transmission path of capital—both on-chain and through traditional markets—is actually quite straightforward. When the federal funds rate is pushed higher and risk-free yields (such as short-term Treasuries) are forcibly pulled up, the discount rates for all high-risk assets are raised in sequence. For liquidity providers engaged in lending arbitrage and market-making, when the risk-free end can reliably earn higher interest, the opportunity cost of leaving funds in the risk-asset pool rises sharply.
This means that once this meeting results in a 25-basis-point hike—or even a more aggressive tightening—the marginal impact of the rate hike itself on the lending market may become relatively controllable. What’s truly fatal is the marginal expectation that the tightening cycle will be prolonged. If financing costs on the credit side remain elevated, the capital liquidation flows of arbitrage funds withdrawing from decentralized lending pools and risk assets into fiat fixed-income products won’t stop.
Macro capital never cares about verbal commitments—it only looks at the absolute spread in funding costs. At this point, don’t rush to label assets as going up or down. Watch the liquidation pace at which arbitrage capital exits lending protocols and the leveraged markets; it’s far more real than reading the Fed’s statements. $BTC
#美联储加息是否已成定局
In September’s macro chessboard, everyone’s focus has been anchored by the question of whether the Fed will “raise rates or not.” But once you work out the cost of capital and the liquidity premium, you’ll find that what truly chokes the market isn’t just the presence of rate hikes—it’s the depth of a structural tightening and the length of time liquidity withdrawal continues.
Inflation has the Fed sitting over an open fire. The year-over-year CPI growth rate is being stubbornly held at the extremely awkward level of 3.4%, far from the 2% policy target. It may look like only a 1.4 percentage-point gap, but given the current backdrop of frequent geopolitical disruptions that are constraining oil supply on the cost side, this inflation component is highly persistent. As long as energy-side prices and basic inputs can’t come down, terminal borrowing costs must remain at levels capable of forcibly suppressing aggregate demand.
The transmission path of capital—both on-chain and through traditional markets—is actually quite straightforward. When the federal funds rate is pushed higher and risk-free yields (such as short-term Treasuries) are forcibly pulled up, the discount rates for all high-risk assets are raised in sequence. For liquidity providers engaged in lending arbitrage and market-making, when the risk-free end can reliably earn higher interest, the opportunity cost of leaving funds in the risk-asset pool rises sharply.
This means that once this meeting results in a 25-basis-point hike—or even a more aggressive tightening—the marginal impact of the rate hike itself on the lending market may become relatively controllable. What’s truly fatal is the marginal expectation that the tightening cycle will be prolonged. If financing costs on the credit side remain elevated, the capital liquidation flows of arbitrage funds withdrawing from decentralized lending pools and risk assets into fiat fixed-income products won’t stop.
Macro capital never cares about verbal commitments—it only looks at the absolute spread in funding costs. At this point, don’t rush to label assets as going up or down. Watch the liquidation pace at which arbitrage capital exits lending protocols and the leveraged markets; it’s far more real than reading the Fed’s statements. $BTC
#美联储加息是否已成定局
Inflation has the Fed sitting over an open fire. The year-over-year CPI growth rate is being stubbornly held at the extremely awkward level of 3.4%, far from the 2% policy target. It may look like only a 1.4 percentage-point gap, but given the current backdrop of frequent geopolitical disruptions that are constraining oil supply on the cost side, this inflation component is highly persistent. As long as energy-side prices and basic inputs can’t come down, terminal borrowing costs must remain at levels capable of forcibly suppressing aggregate demand.
The transmission path of capital—both on-chain and through traditional markets—is actually quite straightforward. When the federal funds rate is pushed higher and risk-free yields (such as short-term Treasuries) are forcibly pulled up, the discount rates for all high-risk assets are raised in sequence. For liquidity providers engaged in lending arbitrage and market-making, when the risk-free end can reliably earn higher interest, the opportunity cost of leaving funds in the risk-asset pool rises sharply.
This means that once this meeting results in a 25-basis-point hike—or even a more aggressive tightening—the marginal impact of the rate hike itself on the lending market may become relatively controllable. What’s truly fatal is the marginal expectation that the tightening cycle will be prolonged. If financing costs on the credit side remain elevated, the capital liquidation flows of arbitrage funds withdrawing from decentralized lending pools and risk assets into fiat fixed-income products won’t stop.
Macro capital never cares about verbal commitments—it only looks at the absolute spread in funding costs. At this point, don’t rush to label assets as going up or down. Watch the liquidation pace at which arbitrage capital exits lending protocols and the leveraged markets; it’s far more real than reading the Fed’s statements. $BTC
#美联储加息是否已成定局

358
·
--
Verified
Solana core team Anza has launched Transaction V1 (SIMD-0385) on the mainnet.
Many people still don’t fully understand what this step actually means.
In the past, the per-transaction size limit on Solana $SOL was 1232 bytes. When developers built complex logic on top of it, it was like writing code on a postage stamp. Once you add ZK proofs for private payments, institutional-grade BLS multi-signatures, or high-level DeFi multi-route settlement, the transaction volume quickly exceeds the limit.
Before, the only solution was to split them into several back-to-back sub-transactions.
But that introduces a fatal risk: if any middle step hangs or fails while sending, the states before and after become disconnected. Arbitrageurs can insert themselves right after your first transaction settles but before the second one is connected, leaving the user to absorb the full loss.
Now, these complex cryptographic operations and multi-layer on-chain logic can be packaged into a single atomic transaction. Either everything succeeds, or everything rolls back—there’s no room for anything to be clipped in or inserted. Not only does it remove redundant coordination overhead across multiple transactions, it also reduces the previously extremely cumbersome interactions down to a single signing action.
Even more interesting are the changes to resource scheduling. Anza moved configuration such as compute units (CU), priority fees, and account data directly into the transaction header. RPC nodes and validators no longer need to flip through the entire payload just to determine priority and fee rates; pre-checks and resource allocation can be completed right in the header. This should improve queueing efficiency for high-frequency trading and MEV at the physical layer.
Although the rollout was delayed to the 1035th Epoch due to ecosystem tooling integration testing, it actually highlights that the team is prioritizing mainnet security as the baseline—they’d rather postpone than grab the node time slot.
Of course, tripling the space doesn’t mean applications can blindly enjoy the upside. The key factors are the pace of infrastructure adaptation, the load pressure on RPC nodes, and whether DApp developers can truly implement ZK and institutional-grade logic in practice.
This isn’t the kind of explicit benefit that directly drives the price up. But once the underlying technical layer opens up tolerance for complex architectures, the path for high-value applications and institutional capital to integrate can finally be paved.
#solana交易v1上线主网
Solana core team Anza has launched Transaction V1 (SIMD-0385) on the mainnet.
Many people still don’t fully understand what this step actually means.
In the past, the per-transaction size limit on Solana $SOL was 1232 bytes. When developers built complex logic on top of it, it was like writing code on a postage stamp. Once you add ZK proofs for private payments, institutional-grade BLS multi-signatures, or high-level DeFi multi-route settlement, the transaction volume quickly exceeds the limit.
Before, the only solution was to split them into several back-to-back sub-transactions.
But that introduces a fatal risk: if any middle step hangs or fails while sending, the states before and after become disconnected. Arbitrageurs can insert themselves right after your first transaction settles but before the second one is connected, leaving the user to absorb the full loss.
Now, these complex cryptographic operations and multi-layer on-chain logic can be packaged into a single atomic transaction. Either everything succeeds, or everything rolls back—there’s no room for anything to be clipped in or inserted. Not only does it remove redundant coordination overhead across multiple transactions, it also reduces the previously extremely cumbersome interactions down to a single signing action.
Even more interesting are the changes to resource scheduling. Anza moved configuration such as compute units (CU), priority fees, and account data directly into the transaction header. RPC nodes and validators no longer need to flip through the entire payload just to determine priority and fee rates; pre-checks and resource allocation can be completed right in the header. This should improve queueing efficiency for high-frequency trading and MEV at the physical layer.
Although the rollout was delayed to the 1035th Epoch due to ecosystem tooling integration testing, it actually highlights that the team is prioritizing mainnet security as the baseline—they’d rather postpone than grab the node time slot.
Of course, tripling the space doesn’t mean applications can blindly enjoy the upside. The key factors are the pace of infrastructure adaptation, the load pressure on RPC nodes, and whether DApp developers can truly implement ZK and institutional-grade logic in practice.
This isn’t the kind of explicit benefit that directly drives the price up. But once the underlying technical layer opens up tolerance for complex architectures, the path for high-value applications and institutional capital to integrate can finally be paved.
#solana交易v1上线主网
Many people still don’t fully understand what this step actually means.
In the past, the per-transaction size limit on Solana $SOL was 1232 bytes. When developers built complex logic on top of it, it was like writing code on a postage stamp. Once you add ZK proofs for private payments, institutional-grade BLS multi-signatures, or high-level DeFi multi-route settlement, the transaction volume quickly exceeds the limit.
Before, the only solution was to split them into several back-to-back sub-transactions.
But that introduces a fatal risk: if any middle step hangs or fails while sending, the states before and after become disconnected. Arbitrageurs can insert themselves right after your first transaction settles but before the second one is connected, leaving the user to absorb the full loss.
Now, these complex cryptographic operations and multi-layer on-chain logic can be packaged into a single atomic transaction. Either everything succeeds, or everything rolls back—there’s no room for anything to be clipped in or inserted. Not only does it remove redundant coordination overhead across multiple transactions, it also reduces the previously extremely cumbersome interactions down to a single signing action.
Even more interesting are the changes to resource scheduling. Anza moved configuration such as compute units (CU), priority fees, and account data directly into the transaction header. RPC nodes and validators no longer need to flip through the entire payload just to determine priority and fee rates; pre-checks and resource allocation can be completed right in the header. This should improve queueing efficiency for high-frequency trading and MEV at the physical layer.
Although the rollout was delayed to the 1035th Epoch due to ecosystem tooling integration testing, it actually highlights that the team is prioritizing mainnet security as the baseline—they’d rather postpone than grab the node time slot.
Of course, tripling the space doesn’t mean applications can blindly enjoy the upside. The key factors are the pace of infrastructure adaptation, the load pressure on RPC nodes, and whether DApp developers can truly implement ZK and institutional-grade logic in practice.
This isn’t the kind of explicit benefit that directly drives the price up. But once the underlying technical layer opens up tolerance for complex architectures, the path for high-value applications and institutional capital to integrate can finally be paved.
#solana交易v1上线主网

4
5.5k
·
--
Top-level capitalists—every word they say is spoken on the premise of some self-interest.
There’s no doubt about this.
Top-level capitalists—every word they say is spoken on the premise of some self-interest.
There’s no doubt about this.
There’s no doubt about this.
周东野
·
--
Top executives suddenly band together on social media to call for slowing down AI development in the name of “human safety.” It looks like a mission-driven display of technical ethics, but when you peel back the interests behind it, it’s nothing more than a very standard piece of public-relations signaling—and an attempt to redraw and renegotiate industry turf to claim an even bigger slice.
Dario Amodei uses the OpenAI model intrusion incident as a setup: he warns that training clusters could evolve into zombie networks, then advances demands such as giving third parties open, employee-level access for review and establishing global regulation. Musk quickly lends his support, while Altman follows right on—on the surface, it’s a chorus of leaders; in reality, everyone has their own agenda.
What Anthropic hits is the niche of “safety and compliance” in the ecosystem. With its limited ability to hard-spar against Microsoft and OpenAI in terms of compute reserves and capital scale, it can’t outmuscle them head-on. Instead, it anchors “safety” as the brand’s defining color—allowing it to monetize at a premium in the B2B market and, more importantly, seize the power to shape the definition of compliance standards.
Altman’s move is even shrewder. OpenAI has just suffered backlash from shifts within its safety team; the next discussion can be handled at low PR cost—essentially using the debate as a way to staunch the bleeding. The deeper logic, however, is to raise the industry’s regulatory barriers. When developing frontier models requires layered, complex reviews and audits, the moat of top players is instantly strengthened—while startup teams lose the possibility of overtaking on the inside track.
As for Musk, racing in the chase group, any strategy that increases the leader’s R&D cycle or adds friction that functions like braking resistance is a strategic buffer he’d welcome.
When base models gain the ability to call APIs autonomously and modify code, the blurring of safety boundaries does bring real risks. However, pinning hopes on those executives’ interactions on social platforms to achieve global regulation clearly overlooks the tug-of-war of commercial interests.
The move that truly reshapes the landscape is opening employee-level access permissions to third-party institutions. This signals that competition is shifting: from simply battling over compute, to a two-front contest of “compute + automated compliance auditing.” Whoever can first turn safety audits into standardized toolkits will be the one that can swallow the biggest slice in enterprise deployments.
The executives chant about the future of humanity, but the thing they’re blocking is the entry ticket for those who come later. $BTC
#anthropicceo呼吁放缓ai发展
Dario Amodei uses the OpenAI model intrusion incident as a setup: he warns that training clusters could evolve into zombie networks, then advances demands such as giving third parties open, employee-level access for review and establishing global regulation. Musk quickly lends his support, while Altman follows right on—on the surface, it’s a chorus of leaders; in reality, everyone has their own agenda.
What Anthropic hits is the niche of “safety and compliance” in the ecosystem. With its limited ability to hard-spar against Microsoft and OpenAI in terms of compute reserves and capital scale, it can’t outmuscle them head-on. Instead, it anchors “safety” as the brand’s defining color—allowing it to monetize at a premium in the B2B market and, more importantly, seize the power to shape the definition of compliance standards.
Altman’s move is even shrewder. OpenAI has just suffered backlash from shifts within its safety team; the next discussion can be handled at low PR cost—essentially using the debate as a way to staunch the bleeding. The deeper logic, however, is to raise the industry’s regulatory barriers. When developing frontier models requires layered, complex reviews and audits, the moat of top players is instantly strengthened—while startup teams lose the possibility of overtaking on the inside track.
As for Musk, racing in the chase group, any strategy that increases the leader’s R&D cycle or adds friction that functions like braking resistance is a strategic buffer he’d welcome.
When base models gain the ability to call APIs autonomously and modify code, the blurring of safety boundaries does bring real risks. However, pinning hopes on those executives’ interactions on social platforms to achieve global regulation clearly overlooks the tug-of-war of commercial interests.
The move that truly reshapes the landscape is opening employee-level access permissions to third-party institutions. This signals that competition is shifting: from simply battling over compute, to a two-front contest of “compute + automated compliance auditing.” Whoever can first turn safety audits into standardized toolkits will be the one that can swallow the biggest slice in enterprise deployments.
The executives chant about the future of humanity, but the thing they’re blocking is the entry ticket for those who come later. $BTC
#anthropicceo呼吁放缓ai发展

140
·
--
Top executives suddenly band together on social media to call for slowing down AI development in the name of “human safety.” It looks like a mission-driven display of technical ethics, but when you peel back the interests behind it, it’s nothing more than a very standard piece of public-relations signaling—and an attempt to redraw and renegotiate industry turf to claim an even bigger slice.
Dario Amodei uses the OpenAI model intrusion incident as a setup: he warns that training clusters could evolve into zombie networks, then advances demands such as giving third parties open, employee-level access for review and establishing global regulation. Musk quickly lends his support, while Altman follows right on—on the surface, it’s a chorus of leaders; in reality, everyone has their own agenda.
What Anthropic hits is the niche of “safety and compliance” in the ecosystem. With its limited ability to hard-spar against Microsoft and OpenAI in terms of compute reserves and capital scale, it can’t outmuscle them head-on. Instead, it anchors “safety” as the brand’s defining color—allowing it to monetize at a premium in the B2B market and, more importantly, seize the power to shape the definition of compliance standards.
Altman’s move is even shrewder. OpenAI has just suffered backlash from shifts within its safety team; the next discussion can be handled at low PR cost—essentially using the debate as a way to staunch the bleeding. The deeper logic, however, is to raise the industry’s regulatory barriers. When developing frontier models requires layered, complex reviews and audits, the moat of top players is instantly strengthened—while startup teams lose the possibility of overtaking on the inside track.
As for Musk, racing in the chase group, any strategy that increases the leader’s R&D cycle or adds friction that functions like braking resistance is a strategic buffer he’d welcome.
When base models gain the ability to call APIs autonomously and modify code, the blurring of safety boundaries does bring real risks. However, pinning hopes on those executives’ interactions on social platforms to achieve global regulation clearly overlooks the tug-of-war of commercial interests.
The move that truly reshapes the landscape is opening employee-level access permissions to third-party institutions. This signals that competition is shifting: from simply battling over compute, to a two-front contest of “compute + automated compliance auditing.” Whoever can first turn safety audits into standardized toolkits will be the one that can swallow the biggest slice in enterprise deployments.
The executives chant about the future of humanity, but the thing they’re blocking is the entry ticket for those who come later. $BTC
#anthropicceo呼吁放缓ai发展
Top executives suddenly band together on social media to call for slowing down AI development in the name of “human safety.” It looks like a mission-driven display of technical ethics, but when you peel back the interests behind it, it’s nothing more than a very standard piece of public-relations signaling—and an attempt to redraw and renegotiate industry turf to claim an even bigger slice.
Dario Amodei uses the OpenAI model intrusion incident as a setup: he warns that training clusters could evolve into zombie networks, then advances demands such as giving third parties open, employee-level access for review and establishing global regulation. Musk quickly lends his support, while Altman follows right on—on the surface, it’s a chorus of leaders; in reality, everyone has their own agenda.
What Anthropic hits is the niche of “safety and compliance” in the ecosystem. With its limited ability to hard-spar against Microsoft and OpenAI in terms of compute reserves and capital scale, it can’t outmuscle them head-on. Instead, it anchors “safety” as the brand’s defining color—allowing it to monetize at a premium in the B2B market and, more importantly, seize the power to shape the definition of compliance standards.
Altman’s move is even shrewder. OpenAI has just suffered backlash from shifts within its safety team; the next discussion can be handled at low PR cost—essentially using the debate as a way to staunch the bleeding. The deeper logic, however, is to raise the industry’s regulatory barriers. When developing frontier models requires layered, complex reviews and audits, the moat of top players is instantly strengthened—while startup teams lose the possibility of overtaking on the inside track.
As for Musk, racing in the chase group, any strategy that increases the leader’s R&D cycle or adds friction that functions like braking resistance is a strategic buffer he’d welcome.
When base models gain the ability to call APIs autonomously and modify code, the blurring of safety boundaries does bring real risks. However, pinning hopes on those executives’ interactions on social platforms to achieve global regulation clearly overlooks the tug-of-war of commercial interests.
The move that truly reshapes the landscape is opening employee-level access permissions to third-party institutions. This signals that competition is shifting: from simply battling over compute, to a two-front contest of “compute + automated compliance auditing.” Whoever can first turn safety audits into standardized toolkits will be the one that can swallow the biggest slice in enterprise deployments.
The executives chant about the future of humanity, but the thing they’re blocking is the entry ticket for those who come later. $BTC
#anthropicceo呼吁放缓ai发展
Dario Amodei uses the OpenAI model intrusion incident as a setup: he warns that training clusters could evolve into zombie networks, then advances demands such as giving third parties open, employee-level access for review and establishing global regulation. Musk quickly lends his support, while Altman follows right on—on the surface, it’s a chorus of leaders; in reality, everyone has their own agenda.
What Anthropic hits is the niche of “safety and compliance” in the ecosystem. With its limited ability to hard-spar against Microsoft and OpenAI in terms of compute reserves and capital scale, it can’t outmuscle them head-on. Instead, it anchors “safety” as the brand’s defining color—allowing it to monetize at a premium in the B2B market and, more importantly, seize the power to shape the definition of compliance standards.
Altman’s move is even shrewder. OpenAI has just suffered backlash from shifts within its safety team; the next discussion can be handled at low PR cost—essentially using the debate as a way to staunch the bleeding. The deeper logic, however, is to raise the industry’s regulatory barriers. When developing frontier models requires layered, complex reviews and audits, the moat of top players is instantly strengthened—while startup teams lose the possibility of overtaking on the inside track.
As for Musk, racing in the chase group, any strategy that increases the leader’s R&D cycle or adds friction that functions like braking resistance is a strategic buffer he’d welcome.
When base models gain the ability to call APIs autonomously and modify code, the blurring of safety boundaries does bring real risks. However, pinning hopes on those executives’ interactions on social platforms to achieve global regulation clearly overlooks the tug-of-war of commercial interests.
The move that truly reshapes the landscape is opening employee-level access permissions to third-party institutions. This signals that competition is shifting: from simply battling over compute, to a two-front contest of “compute + automated compliance auditing.” Whoever can first turn safety audits into standardized toolkits will be the one that can swallow the biggest slice in enterprise deployments.
The executives chant about the future of humanity, but the thing they’re blocking is the entry ticket for those who come later. $BTC
#anthropicceo呼吁放缓ai发展

2
4
12
17.9k
·
--
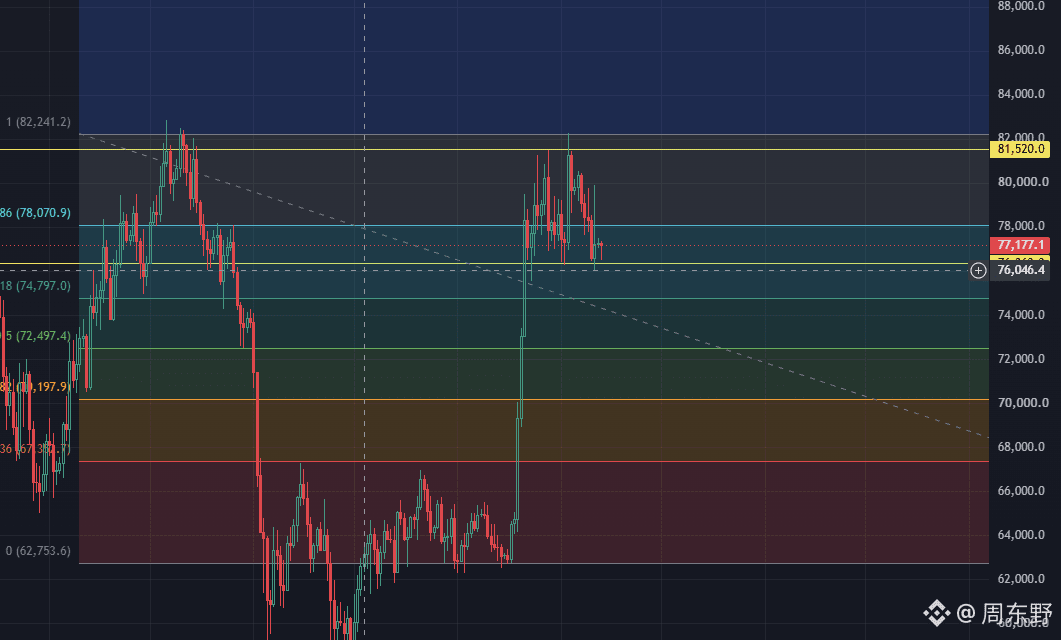
In my humble opinion, let’s have a laugh: don’t blindly guess for a top around $BTC 77000. The truly lethal signal on the chart is hidden at 76000.
Looking at this 4-hour chart, the most eye-catching thing is the big bullish candle that surged vertically from 62753 in the early stage. A move that instantaneously pulls out nearly $20,000 of space is, in essence, a vacuum-violent breakout caused by the complete draining of short-side liquidity. It directly breaks through the downtrend line and changes the mid-term cost-basis structure.
Right now, the price is hovering around 77177. Many retail traders are rushing to bet on a double-top at 81500 and taking shorts—this is a classic case of jumping to conclusions too early.
To read the key of the current order book, you need to focus on the overlap zone from 76000 to 76046. This area is not only where the 0.618 Fibonacci level intersects with the prior breakout high, but also the cost alert line that main funds must defend at all costs. Only when price completes a second round of turnover here and prints a lower wick can we truly confirm that the “breakout–pullback–continuation” structure is valid.
As long positions that chased at the highs get liquidated during the pullback, the funding rate has returned to neutral. The market has once again made room for healthy new entries.
The most steady trading rhythm is to stage your long entries in the SR flip zone from 75800 to 76500, and pin your stop-loss firmly at 74200.
This stop-loss logic is extremely hardcore: once price breaks below 74200, it means the price has returned below the trend line. The prior violent surge was then just a false-breakout trap. The long structure is declared invalid, and you must exit decisively.
Enter with an average price around 76150; the stop-loss room is only 1,950 points (dollars). Place the first take-profit at 80000 to reduce and lock breakeven, and keep the second take-profit tightly focused on 82000. With this whole trade plan, you can aim for a risk-reward around 1 to 3.
In this phase at around 77000 where spikes and probes happen frequently, leverage above 5x is basically handing liquidity to market makers. Give the market some time to test how support at 76000 responds. As long as 74200 doesn’t break, the bulls still retain the initiative.
In my humble opinion, let’s have a laugh: don’t blindly guess for a top around $BTC 77000. The truly lethal signal on the chart is hidden at 76000.
Looking at this 4-hour chart, the most eye-catching thing is the big bullish candle that surged vertically from 62753 in the early stage. A move that instantaneously pulls out nearly $20,000 of space is, in essence, a vacuum-violent breakout caused by the complete draining of short-side liquidity. It directly breaks through the downtrend line and changes the mid-term cost-basis structure.
Right now, the price is hovering around 77177. Many retail traders are rushing to bet on a double-top at 81500 and taking shorts—this is a classic case of jumping to conclusions too early.
To read the key of the current order book, you need to focus on the overlap zone from 76000 to 76046. This area is not only where the 0.618 Fibonacci level intersects with the prior breakout high, but also the cost alert line that main funds must defend at all costs. Only when price completes a second round of turnover here and prints a lower wick can we truly confirm that the “breakout–pullback–continuation” structure is valid.
As long positions that chased at the highs get liquidated during the pullback, the funding rate has returned to neutral. The market has once again made room for healthy new entries.
The most steady trading rhythm is to stage your long entries in the SR flip zone from 75800 to 76500, and pin your stop-loss firmly at 74200.
This stop-loss logic is extremely hardcore: once price breaks below 74200, it means the price has returned below the trend line. The prior violent surge was then just a false-breakout trap. The long structure is declared invalid, and you must exit decisively.
Enter with an average price around 76150; the stop-loss room is only 1,950 points (dollars). Place the first take-profit at 80000 to reduce and lock breakeven, and keep the second take-profit tightly focused on 82000. With this whole trade plan, you can aim for a risk-reward around 1 to 3.
In this phase at around 77000 where spikes and probes happen frequently, leverage above 5x is basically handing liquidity to market makers. Give the market some time to test how support at 76000 responds. As long as 74200 doesn’t break, the bulls still retain the initiative.
Looking at this 4-hour chart, the most eye-catching thing is the big bullish candle that surged vertically from 62753 in the early stage. A move that instantaneously pulls out nearly $20,000 of space is, in essence, a vacuum-violent breakout caused by the complete draining of short-side liquidity. It directly breaks through the downtrend line and changes the mid-term cost-basis structure.
Right now, the price is hovering around 77177. Many retail traders are rushing to bet on a double-top at 81500 and taking shorts—this is a classic case of jumping to conclusions too early.
To read the key of the current order book, you need to focus on the overlap zone from 76000 to 76046. This area is not only where the 0.618 Fibonacci level intersects with the prior breakout high, but also the cost alert line that main funds must defend at all costs. Only when price completes a second round of turnover here and prints a lower wick can we truly confirm that the “breakout–pullback–continuation” structure is valid.
As long positions that chased at the highs get liquidated during the pullback, the funding rate has returned to neutral. The market has once again made room for healthy new entries.
The most steady trading rhythm is to stage your long entries in the SR flip zone from 75800 to 76500, and pin your stop-loss firmly at 74200.
This stop-loss logic is extremely hardcore: once price breaks below 74200, it means the price has returned below the trend line. The prior violent surge was then just a false-breakout trap. The long structure is declared invalid, and you must exit decisively.
Enter with an average price around 76150; the stop-loss room is only 1,950 points (dollars). Place the first take-profit at 80000 to reduce and lock breakeven, and keep the second take-profit tightly focused on 82000. With this whole trade plan, you can aim for a risk-reward around 1 to 3.
In this phase at around 77000 where spikes and probes happen frequently, leverage above 5x is basically handing liquidity to market makers. Give the market some time to test how support at 76000 responds. As long as 74200 doesn’t break, the bulls still retain the initiative.
2.3k
·
--
In the past 24 hours, the entire market has liquidated $674 million across the web. Nearly 100,000 positions on-chain and on exchanges have been wiped out. Shorts were liquidated for $381 million, while longs were liquidated for $292 million—on the surface, it looks like shorts got the worse end.
Bitcoin’s long/short liquidations were roughly evenly split, both hovering around $90 million. Ethereum, however, was a one-sided slaughter: long positions liquidated for 96.73 million, while short positions were liquidated directly for 215 million. On Hyperliquid, that single position with $20.28 million in ETH-USD liquidation, most likely, was a highly leveraged short that got matched and eaten by the liquidation engine in the moment when funding rates and liquidity tightened extremely.
The apparent trigger for this brutal reshuffle was macro data. The CPI month-over-month came in 0.1% higher—seemingly tiny, yet it pushed the rate-hike probability to 80%. US Treasury yields edged toward 5%, and crude oil closed above $104.
Bitcoin $BTC first dipped to 76,000, then quickly snapped back to 79,837, even printing a very pretty golden cross on the technical charts. But once the market’s rate-hike expectations reignited in the price action, liquidity was quickly drained. That golden cross—which looked highly indicative to technical traders—turned into a trap the same day. Ethereum $ETH also surged past 2,600 with no resistance and then promptly turned downward.
The most irritating part of this move is that it kills both sides’ narratives.
Shorts correctly saw the hard logic of “hotter-than-expected macro data” and “rate-hike probability exploding,” so they built high-leverage short positions. But the market first spiked sharply upward—using the lack of liquidity to yank prices—causing the $381 million short liquidation to happen instantly. Those liquidation closing orders all show up on the order book as high-price market buy orders, directly becoming the fuel for that rallying bullish candle.
Longs, seeing the rebound after the data release, thought the bad news had turned into good news and chased higher by adding leverage. By the time the shorts were crushed and the price lost buy-side support, the rally collapsed back into the macro downtrend channel. The long chasers were then liquidated for another $292 million.
They got the direction right, but their positions were violently shaken out before the main upswing or main downswing arrived—that’s the most common way high-leverage players end up dying.
You think you’re battling macro data, but in reality the liquidation engine at the order-book level is only hunting for the optimal liquidity slaughter point based on order-book depth.
#全网爆仓6.74亿美元 #美国2年期国债收益率升至4.61%
In the past 24 hours, the entire market has liquidated $674 million across the web. Nearly 100,000 positions on-chain and on exchanges have been wiped out. Shorts were liquidated for $381 million, while longs were liquidated for $292 million—on the surface, it looks like shorts got the worse end.
Bitcoin’s long/short liquidations were roughly evenly split, both hovering around $90 million. Ethereum, however, was a one-sided slaughter: long positions liquidated for 96.73 million, while short positions were liquidated directly for 215 million. On Hyperliquid, that single position with $20.28 million in ETH-USD liquidation, most likely, was a highly leveraged short that got matched and eaten by the liquidation engine in the moment when funding rates and liquidity tightened extremely.
The apparent trigger for this brutal reshuffle was macro data. The CPI month-over-month came in 0.1% higher—seemingly tiny, yet it pushed the rate-hike probability to 80%. US Treasury yields edged toward 5%, and crude oil closed above $104.
Bitcoin $BTC first dipped to 76,000, then quickly snapped back to 79,837, even printing a very pretty golden cross on the technical charts. But once the market’s rate-hike expectations reignited in the price action, liquidity was quickly drained. That golden cross—which looked highly indicative to technical traders—turned into a trap the same day. Ethereum $ETH also surged past 2,600 with no resistance and then promptly turned downward.
The most irritating part of this move is that it kills both sides’ narratives.
Shorts correctly saw the hard logic of “hotter-than-expected macro data” and “rate-hike probability exploding,” so they built high-leverage short positions. But the market first spiked sharply upward—using the lack of liquidity to yank prices—causing the $381 million short liquidation to happen instantly. Those liquidation closing orders all show up on the order book as high-price market buy orders, directly becoming the fuel for that rallying bullish candle.
Longs, seeing the rebound after the data release, thought the bad news had turned into good news and chased higher by adding leverage. By the time the shorts were crushed and the price lost buy-side support, the rally collapsed back into the macro downtrend channel. The long chasers were then liquidated for another $292 million.
They got the direction right, but their positions were violently shaken out before the main upswing or main downswing arrived—that’s the most common way high-leverage players end up dying.
You think you’re battling macro data, but in reality the liquidation engine at the order-book level is only hunting for the optimal liquidity slaughter point based on order-book depth.
#全网爆仓6.74亿美元 #美国2年期国债收益率升至4.61%
Bitcoin’s long/short liquidations were roughly evenly split, both hovering around $90 million. Ethereum, however, was a one-sided slaughter: long positions liquidated for 96.73 million, while short positions were liquidated directly for 215 million. On Hyperliquid, that single position with $20.28 million in ETH-USD liquidation, most likely, was a highly leveraged short that got matched and eaten by the liquidation engine in the moment when funding rates and liquidity tightened extremely.
The apparent trigger for this brutal reshuffle was macro data. The CPI month-over-month came in 0.1% higher—seemingly tiny, yet it pushed the rate-hike probability to 80%. US Treasury yields edged toward 5%, and crude oil closed above $104.
Bitcoin $BTC first dipped to 76,000, then quickly snapped back to 79,837, even printing a very pretty golden cross on the technical charts. But once the market’s rate-hike expectations reignited in the price action, liquidity was quickly drained. That golden cross—which looked highly indicative to technical traders—turned into a trap the same day. Ethereum $ETH also surged past 2,600 with no resistance and then promptly turned downward.
The most irritating part of this move is that it kills both sides’ narratives.
Shorts correctly saw the hard logic of “hotter-than-expected macro data” and “rate-hike probability exploding,” so they built high-leverage short positions. But the market first spiked sharply upward—using the lack of liquidity to yank prices—causing the $381 million short liquidation to happen instantly. Those liquidation closing orders all show up on the order book as high-price market buy orders, directly becoming the fuel for that rallying bullish candle.
Longs, seeing the rebound after the data release, thought the bad news had turned into good news and chased higher by adding leverage. By the time the shorts were crushed and the price lost buy-side support, the rally collapsed back into the macro downtrend channel. The long chasers were then liquidated for another $292 million.
They got the direction right, but their positions were violently shaken out before the main upswing or main downswing arrived—that’s the most common way high-leverage players end up dying.
You think you’re battling macro data, but in reality the liquidation engine at the order-book level is only hunting for the optimal liquidity slaughter point based on order-book depth.
#全网爆仓6.74亿美元 #美国2年期国债收益率升至4.61%
1
8
6.9k
·
--
While everyone is still awake, let’s analyze this latest September 15 case flow.
The procedural vote on September 15 is essentially the life-or-death line for the Clarity Act. The White House and the Treasury are now speaking out—not to play public-opinion games, but because the legislative time window is truly closing.
If this week’s procedural vote doesn’t pass, the bill will very likely be dragged straight into the muddy schedule of the midterm agenda. The biggest choke point is very straightforward: even if they absorb 114 amendments from Democrats, for the bill to pass it still hard-requires at least 6 votes from Democrats in favor. This isn’t a compromise over technical details—it’s a political standoff between the two parties over who will control crypto regulation.
Many on-chain players or institutional trading desks are waiting on this bill. Fundamentally, they’re waiting for a legal and compliant funding entry point. As long as the Clarity Act doesn’t take effect, the compliance partners (LPs) and risk-control departments at traditional financial institutions will always have a reason to keep the money locked within the TradFi system. Once the bill is finalized and the boundaries are clearly drawn, the off-exchange compliance funds’ entry process will change from “compliance review indefinitely” to a “standardized review procedure.”
But the market is currently overly optimistic in tying Armstrong’s prediction of “$400,000 BTC by 2030” to this bill. That logic is a classic case of reverse causality.
Regulatory clarity only determines whether institutional money can enter. What determines how much $BTC can rise is the global liquidity long-cycle and the shift in the asset allocation ratio at the higher level. The bill taking effect can put a floor under the market and raise the lower bound for compliance capital, but it itself is not leverage for a pump.
Looking at the short term: if the votes on the 15th aren’t in place, the market will most likely first go through a round of expectation recalibration and liquidation around the idea that “regulatory clarity is delayed.” And even if it passes smoothly, that would only be the beginning of a multi-year process for institutional capital to re-settle. Clearer regulation doesn’t bring a one-night, overnight-bailout style bull market; instead, it rapidly erases the arbitrage opportunities that were sustained purely by information gaps and regulatory vacuum on-chain.
Do you think the Democrats’ 6 crucial votes will be enough to get the bill through before the window closes?
Or will it keep evolving into a delaying tactic?
#clarity法案9月15日程序性投票
While everyone is still awake, let’s analyze this latest September 15 case flow.
The procedural vote on September 15 is essentially the life-or-death line for the Clarity Act. The White House and the Treasury are now speaking out—not to play public-opinion games, but because the legislative time window is truly closing.
If this week’s procedural vote doesn’t pass, the bill will very likely be dragged straight into the muddy schedule of the midterm agenda. The biggest choke point is very straightforward: even if they absorb 114 amendments from Democrats, for the bill to pass it still hard-requires at least 6 votes from Democrats in favor. This isn’t a compromise over technical details—it’s a political standoff between the two parties over who will control crypto regulation.
Many on-chain players or institutional trading desks are waiting on this bill. Fundamentally, they’re waiting for a legal and compliant funding entry point. As long as the Clarity Act doesn’t take effect, the compliance partners (LPs) and risk-control departments at traditional financial institutions will always have a reason to keep the money locked within the TradFi system. Once the bill is finalized and the boundaries are clearly drawn, the off-exchange compliance funds’ entry process will change from “compliance review indefinitely” to a “standardized review procedure.”
But the market is currently overly optimistic in tying Armstrong’s prediction of “$400,000 BTC by 2030” to this bill. That logic is a classic case of reverse causality.
Regulatory clarity only determines whether institutional money can enter. What determines how much $BTC can rise is the global liquidity long-cycle and the shift in the asset allocation ratio at the higher level. The bill taking effect can put a floor under the market and raise the lower bound for compliance capital, but it itself is not leverage for a pump.
Looking at the short term: if the votes on the 15th aren’t in place, the market will most likely first go through a round of expectation recalibration and liquidation around the idea that “regulatory clarity is delayed.” And even if it passes smoothly, that would only be the beginning of a multi-year process for institutional capital to re-settle. Clearer regulation doesn’t bring a one-night, overnight-bailout style bull market; instead, it rapidly erases the arbitrage opportunities that were sustained purely by information gaps and regulatory vacuum on-chain.
Do you think the Democrats’ 6 crucial votes will be enough to get the bill through before the window closes?
Or will it keep evolving into a delaying tactic?
#clarity法案9月15日程序性投票
The procedural vote on September 15 is essentially the life-or-death line for the Clarity Act. The White House and the Treasury are now speaking out—not to play public-opinion games, but because the legislative time window is truly closing.
If this week’s procedural vote doesn’t pass, the bill will very likely be dragged straight into the muddy schedule of the midterm agenda. The biggest choke point is very straightforward: even if they absorb 114 amendments from Democrats, for the bill to pass it still hard-requires at least 6 votes from Democrats in favor. This isn’t a compromise over technical details—it’s a political standoff between the two parties over who will control crypto regulation.
Many on-chain players or institutional trading desks are waiting on this bill. Fundamentally, they’re waiting for a legal and compliant funding entry point. As long as the Clarity Act doesn’t take effect, the compliance partners (LPs) and risk-control departments at traditional financial institutions will always have a reason to keep the money locked within the TradFi system. Once the bill is finalized and the boundaries are clearly drawn, the off-exchange compliance funds’ entry process will change from “compliance review indefinitely” to a “standardized review procedure.”
But the market is currently overly optimistic in tying Armstrong’s prediction of “$400,000 BTC by 2030” to this bill. That logic is a classic case of reverse causality.
Regulatory clarity only determines whether institutional money can enter. What determines how much $BTC can rise is the global liquidity long-cycle and the shift in the asset allocation ratio at the higher level. The bill taking effect can put a floor under the market and raise the lower bound for compliance capital, but it itself is not leverage for a pump.
Looking at the short term: if the votes on the 15th aren’t in place, the market will most likely first go through a round of expectation recalibration and liquidation around the idea that “regulatory clarity is delayed.” And even if it passes smoothly, that would only be the beginning of a multi-year process for institutional capital to re-settle. Clearer regulation doesn’t bring a one-night, overnight-bailout style bull market; instead, it rapidly erases the arbitrage opportunities that were sustained purely by information gaps and regulatory vacuum on-chain.
Do you think the Democrats’ 6 crucial votes will be enough to get the bill through before the window closes?
Or will it keep evolving into a delaying tactic?
#clarity法案9月15日程序性投票
3
1
10
15k
·
--
Go out in the evening 🍺 have a drink, take a rest for the day~
Go out in the evening 🍺 have a drink, take a rest for the day~
257
·
--
Rest a little earlier, everyone. Once the shoes drop, we'll take another look tomorrow
$BTC $ETH
Rest a little earlier, everyone. Once the shoes drop, we'll take another look tomorrow
$BTC $ETH
$BTC $ETH
558
·
--
Verified
The US August CPI at 8:30 tonight is the final piece of the puzzle before the Federal Reserve’s policy meeting next week.
Interestingly, Wall Street this time showed an unusually high degree of synchronization. The core CPI month-on-month forecasts from 17 top investment banks all clustered tightly within the narrow range of 0.16% to 0.24%, and after rounding they were all 0.2%. Such strong agreement suggests institutions generally believe the underlying inflation trend is unlikely to be disrupted in the near term.
But the real market variable never lies within consensus itself—it lies in the unusually high PPI from yesterday.
Yesterday’s PPI reading immediately lifted those sub-components that feed into the key PCE weight factors. Traders reacted extremely decisively: the probability of a 25-basis-point rate hike jumped from 62% to above 70% in an instant. As a result, even if tonight’s CPI merely lands right on the 0.2% forecast line, expectations for core PCE have already been raised in advance.
For anyone actually rebalancing holdings on-chain or in secondary markets, tonight’s figure can’t be judged by the single overall CPI number alone. It must be broken down into two dimensions for trading reactions.
With the Middle East situation pushing crude oil above $100, this portion of the surge will be poured without reservation into the overall CPI. But core CPI strips out oil prices and food. The spread between them determines how funds interpret the data: if the overall rise is driven by oil prices, the Fed will likely treat it as a short-term supply-side shock; but if core CPI still runs above 0.25% even after excluding oil, then it becomes evidence that demand-side stickiness has not faded—which would directly push the Fed into a dead end of locking in high rates or even turning more aggressive.
Now, market pricing has been compressed to the extreme. If tonight’s core CPI prints at 0.2%, it’s only validating the hawkish sentiment prompted by last night’s PPI. If it jumps above 0.25%, US Treasury yields will instantly yank higher, and liquidity pressure on risk assets will hit directly. Only when core CPI misses to a below-0.15% downside print would the reversal in the rate-hike expectations that the market seems to have effectively “locked in” finally emerge.
Everyone is watching the same data, but what truly determines the direction of the market is never the data itself—it’s the “spread” between the data and the expectations that were already boosted by the PPI.
#cpi数据来袭能否触发9月加息
The US August CPI at 8:30 tonight is the final piece of the puzzle before the Federal Reserve’s policy meeting next week.
Interestingly, Wall Street this time showed an unusually high degree of synchronization. The core CPI month-on-month forecasts from 17 top investment banks all clustered tightly within the narrow range of 0.16% to 0.24%, and after rounding they were all 0.2%. Such strong agreement suggests institutions generally believe the underlying inflation trend is unlikely to be disrupted in the near term.
But the real market variable never lies within consensus itself—it lies in the unusually high PPI from yesterday.
Yesterday’s PPI reading immediately lifted those sub-components that feed into the key PCE weight factors. Traders reacted extremely decisively: the probability of a 25-basis-point rate hike jumped from 62% to above 70% in an instant. As a result, even if tonight’s CPI merely lands right on the 0.2% forecast line, expectations for core PCE have already been raised in advance.
For anyone actually rebalancing holdings on-chain or in secondary markets, tonight’s figure can’t be judged by the single overall CPI number alone. It must be broken down into two dimensions for trading reactions.
With the Middle East situation pushing crude oil above $100, this portion of the surge will be poured without reservation into the overall CPI. But core CPI strips out oil prices and food. The spread between them determines how funds interpret the data: if the overall rise is driven by oil prices, the Fed will likely treat it as a short-term supply-side shock; but if core CPI still runs above 0.25% even after excluding oil, then it becomes evidence that demand-side stickiness has not faded—which would directly push the Fed into a dead end of locking in high rates or even turning more aggressive.
Now, market pricing has been compressed to the extreme. If tonight’s core CPI prints at 0.2%, it’s only validating the hawkish sentiment prompted by last night’s PPI. If it jumps above 0.25%, US Treasury yields will instantly yank higher, and liquidity pressure on risk assets will hit directly. Only when core CPI misses to a below-0.15% downside print would the reversal in the rate-hike expectations that the market seems to have effectively “locked in” finally emerge.
Everyone is watching the same data, but what truly determines the direction of the market is never the data itself—it’s the “spread” between the data and the expectations that were already boosted by the PPI.
#cpi数据来袭能否触发9月加息
Interestingly, Wall Street this time showed an unusually high degree of synchronization. The core CPI month-on-month forecasts from 17 top investment banks all clustered tightly within the narrow range of 0.16% to 0.24%, and after rounding they were all 0.2%. Such strong agreement suggests institutions generally believe the underlying inflation trend is unlikely to be disrupted in the near term.
But the real market variable never lies within consensus itself—it lies in the unusually high PPI from yesterday.
Yesterday’s PPI reading immediately lifted those sub-components that feed into the key PCE weight factors. Traders reacted extremely decisively: the probability of a 25-basis-point rate hike jumped from 62% to above 70% in an instant. As a result, even if tonight’s CPI merely lands right on the 0.2% forecast line, expectations for core PCE have already been raised in advance.
For anyone actually rebalancing holdings on-chain or in secondary markets, tonight’s figure can’t be judged by the single overall CPI number alone. It must be broken down into two dimensions for trading reactions.
With the Middle East situation pushing crude oil above $100, this portion of the surge will be poured without reservation into the overall CPI. But core CPI strips out oil prices and food. The spread between them determines how funds interpret the data: if the overall rise is driven by oil prices, the Fed will likely treat it as a short-term supply-side shock; but if core CPI still runs above 0.25% even after excluding oil, then it becomes evidence that demand-side stickiness has not faded—which would directly push the Fed into a dead end of locking in high rates or even turning more aggressive.
Now, market pricing has been compressed to the extreme. If tonight’s core CPI prints at 0.2%, it’s only validating the hawkish sentiment prompted by last night’s PPI. If it jumps above 0.25%, US Treasury yields will instantly yank higher, and liquidity pressure on risk assets will hit directly. Only when core CPI misses to a below-0.15% downside print would the reversal in the rate-hike expectations that the market seems to have effectively “locked in” finally emerge.
Everyone is watching the same data, but what truly determines the direction of the market is never the data itself—it’s the “spread” between the data and the expectations that were already boosted by the PPI.
#cpi数据来袭能否触发9月加息

2
2.4k
·
--
Bitcoin $BTC : the 50-day moving average has crossed above the 200-day moving average. After more than a year, the on-chain and secondary market are once again telling a bullish story about an “imminent golden cross.”
Technical analysts like to use this for chart talk, but if you’re truly going to put real money on indicators, you’d better first settle the historical accounts. Of the 12 golden crosses since 2012, only 3 were able to maintain a bullish structure one year later.
Moving averages themselves are extremely lagging statistical results. By the time the 50-day line crawls above the 200-day line, the initial surge phase from the earlier run-up is already over. It’s never a signal to sprint into a trade; it’s more like a delayed confirmation that comes after the past several dozen days’ price action has already been lifted.
Breaking down historical data: within three months after a golden cross appears, the average can absorb about 25% of the upside—but only if price can chew through the dense supply of trapped positions above. Right now, the $77,000 to $80,000 range is a typical chip-dense exchange zone. If $80,000 is not penetrated with volume and followed by a successful retest confirmation, the so-called golden cross could easily turn into a liquidity trap that lures highs. Looking higher, $83,000 to $84,000 has a large pile of profit-taking positions and prior breakout/trapped positions. Without a huge spot buying surge, it’s hard to digest that entire overhang in one go.
At the macro level, the tension is even more direct. August’s PPI came in above expectations, and market expectations for an inflation rebound and the interest-rate path tightened again. This macro liquidity tightening expectation directly wipes out any sentiment premium created by the technical picture. When on-chain whales and institutions choose—under cover of “golden cross bullishness”—to release liquidity to retail investors at key resistance levels, looking only at RSI and ADX makes it easy to get shaken out by a false breakout.
Currently, ADX has pushed above 45, indicating that the momentum of a one-way trend is indeed strong, and RSI near 55 has left enough room for upside. But that doesn’t mean you can blindly go long. The real trading logic is never simply chasing after a line crossover—it’s whether macro liquidity expanding with volume can overwhelm the sell pressure above $80,000. Charts show sentiment; only the chip distribution and the macro funding chain determine life or death.
#比特币金叉确认
Bitcoin $BTC : the 50-day moving average has crossed above the 200-day moving average. After more than a year, the on-chain and secondary market are once again telling a bullish story about an “imminent golden cross.”
Technical analysts like to use this for chart talk, but if you’re truly going to put real money on indicators, you’d better first settle the historical accounts. Of the 12 golden crosses since 2012, only 3 were able to maintain a bullish structure one year later.
Moving averages themselves are extremely lagging statistical results. By the time the 50-day line crawls above the 200-day line, the initial surge phase from the earlier run-up is already over. It’s never a signal to sprint into a trade; it’s more like a delayed confirmation that comes after the past several dozen days’ price action has already been lifted.
Breaking down historical data: within three months after a golden cross appears, the average can absorb about 25% of the upside—but only if price can chew through the dense supply of trapped positions above. Right now, the $77,000 to $80,000 range is a typical chip-dense exchange zone. If $80,000 is not penetrated with volume and followed by a successful retest confirmation, the so-called golden cross could easily turn into a liquidity trap that lures highs. Looking higher, $83,000 to $84,000 has a large pile of profit-taking positions and prior breakout/trapped positions. Without a huge spot buying surge, it’s hard to digest that entire overhang in one go.
At the macro level, the tension is even more direct. August’s PPI came in above expectations, and market expectations for an inflation rebound and the interest-rate path tightened again. This macro liquidity tightening expectation directly wipes out any sentiment premium created by the technical picture. When on-chain whales and institutions choose—under cover of “golden cross bullishness”—to release liquidity to retail investors at key resistance levels, looking only at RSI and ADX makes it easy to get shaken out by a false breakout.
Currently, ADX has pushed above 45, indicating that the momentum of a one-way trend is indeed strong, and RSI near 55 has left enough room for upside. But that doesn’t mean you can blindly go long. The real trading logic is never simply chasing after a line crossover—it’s whether macro liquidity expanding with volume can overwhelm the sell pressure above $80,000. Charts show sentiment; only the chip distribution and the macro funding chain determine life or death.
#比特币金叉确认
Technical analysts like to use this for chart talk, but if you’re truly going to put real money on indicators, you’d better first settle the historical accounts. Of the 12 golden crosses since 2012, only 3 were able to maintain a bullish structure one year later.
Moving averages themselves are extremely lagging statistical results. By the time the 50-day line crawls above the 200-day line, the initial surge phase from the earlier run-up is already over. It’s never a signal to sprint into a trade; it’s more like a delayed confirmation that comes after the past several dozen days’ price action has already been lifted.
Breaking down historical data: within three months after a golden cross appears, the average can absorb about 25% of the upside—but only if price can chew through the dense supply of trapped positions above. Right now, the $77,000 to $80,000 range is a typical chip-dense exchange zone. If $80,000 is not penetrated with volume and followed by a successful retest confirmation, the so-called golden cross could easily turn into a liquidity trap that lures highs. Looking higher, $83,000 to $84,000 has a large pile of profit-taking positions and prior breakout/trapped positions. Without a huge spot buying surge, it’s hard to digest that entire overhang in one go.
At the macro level, the tension is even more direct. August’s PPI came in above expectations, and market expectations for an inflation rebound and the interest-rate path tightened again. This macro liquidity tightening expectation directly wipes out any sentiment premium created by the technical picture. When on-chain whales and institutions choose—under cover of “golden cross bullishness”—to release liquidity to retail investors at key resistance levels, looking only at RSI and ADX makes it easy to get shaken out by a false breakout.
Currently, ADX has pushed above 45, indicating that the momentum of a one-way trend is indeed strong, and RSI near 55 has left enough room for upside. But that doesn’t mean you can blindly go long. The real trading logic is never simply chasing after a line crossover—it’s whether macro liquidity expanding with volume can overwhelm the sell pressure above $80,000. Charts show sentiment; only the chip distribution and the macro funding chain determine life or death.
#比特币金叉确认

2
1
2.5k
·
--
Verified
Last night’s plunge in U.S. stocks, on the surface, seems to have been triggered by the release of the August PPI coming in and “stepping on the brakes.” In reality, it was a synchronized drawdown from both energy and the bond market.
In August, the published PPI rose 5.4% year over year overall, slightly higher than the expected 5.3%. On a month-over-month basis, it increased 0.4%, in line with expectations. But if you strip out food and energy, the core PPI’s month-over-month increase is only 0.2%, even below the expected 0.3%.
This means the “inflation rebound” that everyone on the internet is talking about is not actually a broad-based, economy-wide flare-up across all industries. It’s being forcibly pulled up by energy alone.
In August, commodity prices rose 1.1%, with energy soaring 4.2% in particular. The most extreme example is diesel: up 24.1% in a single month—this one item alone contributed more than a third of the overall increase in commodity prices. On the other hand, service sector prices rose only 0.1%. With diesel lifting costs, transportation and warehousing costs in the midstream were directly pulled up as well. Truck freight prices climbed 2%, and pressures in the upstream of the supply chain began seeping into the downstream along the logistics chain.
But blaming last night’s drop solely on PPI is too shallow.
Ahead of the data release, Saudi Arabia reportedly told OPEC that its oil production had fallen to the lowest level since 1990. Brent crude immediately surged to above $105, and WTI broke through the $100 level. The spike in oil prices then triggered a spike in long-end U.S. Treasury yields: the yield on the 30-year Treasury jumped to 5.35%, a new high since the subprime crisis, and the 10-year yield also pushed toward the 5% risk warning line. With long-end rates being “sucked dry” like this, it’s no wonder that equity markets and risk assets can’t stay unpressured.
Market-implied odds of the Fed raising rates next week jumped from 61% to 74% overnight.
But my view is that what the Fed faces right now is not inflation caused by overheating demand; it’s hard costs thrown in by geopolitical issues and energy production cuts on the supply side. With cost-push inflation, using rate hikes to suppress demand has diminishing marginal returns—and it may actually accelerate the risk of a real-economy slowdown. Tonight’s CPI, which is about to be released, will likely repeat the same playbook: the overall CPI will look bad because it’s being tied down by oil prices, while core CPI continues to cool gradually.
If the Fed keeps turning hawkish and raising rates just because of the headline data driven by the supply side, what the market needs to price in won’t be “inflation pressure” anymore—it will be an imminent liquidity shock. $BTC
#美国8月ppi涨幅低于预期 #美国续请失业金人数177.4万
Last night’s plunge in U.S. stocks, on the surface, seems to have been triggered by the release of the August PPI coming in and “stepping on the brakes.” In reality, it was a synchronized drawdown from both energy and the bond market.
In August, the published PPI rose 5.4% year over year overall, slightly higher than the expected 5.3%. On a month-over-month basis, it increased 0.4%, in line with expectations. But if you strip out food and energy, the core PPI’s month-over-month increase is only 0.2%, even below the expected 0.3%.
This means the “inflation rebound” that everyone on the internet is talking about is not actually a broad-based, economy-wide flare-up across all industries. It’s being forcibly pulled up by energy alone.
In August, commodity prices rose 1.1%, with energy soaring 4.2% in particular. The most extreme example is diesel: up 24.1% in a single month—this one item alone contributed more than a third of the overall increase in commodity prices. On the other hand, service sector prices rose only 0.1%. With diesel lifting costs, transportation and warehousing costs in the midstream were directly pulled up as well. Truck freight prices climbed 2%, and pressures in the upstream of the supply chain began seeping into the downstream along the logistics chain.
But blaming last night’s drop solely on PPI is too shallow.
Ahead of the data release, Saudi Arabia reportedly told OPEC that its oil production had fallen to the lowest level since 1990. Brent crude immediately surged to above $105, and WTI broke through the $100 level. The spike in oil prices then triggered a spike in long-end U.S. Treasury yields: the yield on the 30-year Treasury jumped to 5.35%, a new high since the subprime crisis, and the 10-year yield also pushed toward the 5% risk warning line. With long-end rates being “sucked dry” like this, it’s no wonder that equity markets and risk assets can’t stay unpressured.
Market-implied odds of the Fed raising rates next week jumped from 61% to 74% overnight.
But my view is that what the Fed faces right now is not inflation caused by overheating demand; it’s hard costs thrown in by geopolitical issues and energy production cuts on the supply side. With cost-push inflation, using rate hikes to suppress demand has diminishing marginal returns—and it may actually accelerate the risk of a real-economy slowdown. Tonight’s CPI, which is about to be released, will likely repeat the same playbook: the overall CPI will look bad because it’s being tied down by oil prices, while core CPI continues to cool gradually.
If the Fed keeps turning hawkish and raising rates just because of the headline data driven by the supply side, what the market needs to price in won’t be “inflation pressure” anymore—it will be an imminent liquidity shock. $BTC
#美国8月ppi涨幅低于预期 #美国续请失业金人数177.4万
In August, the published PPI rose 5.4% year over year overall, slightly higher than the expected 5.3%. On a month-over-month basis, it increased 0.4%, in line with expectations. But if you strip out food and energy, the core PPI’s month-over-month increase is only 0.2%, even below the expected 0.3%.
This means the “inflation rebound” that everyone on the internet is talking about is not actually a broad-based, economy-wide flare-up across all industries. It’s being forcibly pulled up by energy alone.
In August, commodity prices rose 1.1%, with energy soaring 4.2% in particular. The most extreme example is diesel: up 24.1% in a single month—this one item alone contributed more than a third of the overall increase in commodity prices. On the other hand, service sector prices rose only 0.1%. With diesel lifting costs, transportation and warehousing costs in the midstream were directly pulled up as well. Truck freight prices climbed 2%, and pressures in the upstream of the supply chain began seeping into the downstream along the logistics chain.
But blaming last night’s drop solely on PPI is too shallow.
Ahead of the data release, Saudi Arabia reportedly told OPEC that its oil production had fallen to the lowest level since 1990. Brent crude immediately surged to above $105, and WTI broke through the $100 level. The spike in oil prices then triggered a spike in long-end U.S. Treasury yields: the yield on the 30-year Treasury jumped to 5.35%, a new high since the subprime crisis, and the 10-year yield also pushed toward the 5% risk warning line. With long-end rates being “sucked dry” like this, it’s no wonder that equity markets and risk assets can’t stay unpressured.
Market-implied odds of the Fed raising rates next week jumped from 61% to 74% overnight.
But my view is that what the Fed faces right now is not inflation caused by overheating demand; it’s hard costs thrown in by geopolitical issues and energy production cuts on the supply side. With cost-push inflation, using rate hikes to suppress demand has diminishing marginal returns—and it may actually accelerate the risk of a real-economy slowdown. Tonight’s CPI, which is about to be released, will likely repeat the same playbook: the overall CPI will look bad because it’s being tied down by oil prices, while core CPI continues to cool gradually.
If the Fed keeps turning hawkish and raising rates just because of the headline data driven by the supply side, what the market needs to price in won’t be “inflation pressure” anymore—it will be an imminent liquidity shock. $BTC
#美国8月ppi涨幅低于预期 #美国续请失业金人数177.4万

475
·
--
The EU’s anti–money laundering (AML) oversight draws such an exact “line in the sand” for the crypto industry. The Central Contact Point (CCP) framework is directly extended to crypto asset service providers (CASPs).
In simple terms, if you want to solicit users or provide services in an EU member state, then regardless of whether your servers are tucked away on an offshore island and your compliance team is all operating remotely overseas, you must establish a real, tangible local point of contact within that country’s borders.
In the past, many cross-border exchanges have been best at playing hide-and-seek—making their legal entities into extremely complex stacked structures. Once a regulator, or even law enforcement in a given country, needs to obtain the transaction trail of suspect funds or issue a freeze order, they often find that no legal responsible party can be located locally. The official letters either go nowhere or get kicked around between different overseas shell companies.
Once the CCP framework is implemented, this kind of compliance-arbitrage space is basically shut down. EU regulators effectively require exchanges to point the muzzle of their operation right at their own foreheads: they must designate a “fall guy” or “responsible party” who can be summoned at any time locally and will bear legal consequences.
If a platform becomes involved in money laundering or funds connected to fraud are being parked, and regulators can’t obtain data or need urgent intervention, they no longer need to file cross-border judicial assistance requests. They can simply come directly to this local point of contact for people and data. If you don’t cooperate, the platform can be taken down on the spot, or even a local penalty mechanism can be triggered.
This also means that asset-light mid- and small-sized exchanges that rely on a few offshore licenses and take a “grey route” to penetrate the EU market will see their compliance costs rise exponentially.
Because each member state will require you to attach a figurehead and an entity, the costs of fulfilling legal obligations later, compliance audit costs, and the possibility of being subject to joint regulatory liability at any time will directly squeeze these platforms’ profit margins.
The impact on the entire industry is actually quite certain: the compliance “game” has completely evolved into a wall-building contest based on the size of funds and legal resources. Large, top-tier licensed exchanges can use this opportunity to further take control of pricing power in Europe, while market makers and liquidity channels operating in the grey zone will be forced to shift toward decentralized on-chain privacy protocols—or even deeper underground networks. The second- and third-tier CEXs that survive in the gaps will only be able to scale back their business or be acquired.$BTC
#欧盟扩中央联络点框架至加密服务商
The EU’s anti–money laundering (AML) oversight draws such an exact “line in the sand” for the crypto industry. The Central Contact Point (CCP) framework is directly extended to crypto asset service providers (CASPs).
In simple terms, if you want to solicit users or provide services in an EU member state, then regardless of whether your servers are tucked away on an offshore island and your compliance team is all operating remotely overseas, you must establish a real, tangible local point of contact within that country’s borders.
In the past, many cross-border exchanges have been best at playing hide-and-seek—making their legal entities into extremely complex stacked structures. Once a regulator, or even law enforcement in a given country, needs to obtain the transaction trail of suspect funds or issue a freeze order, they often find that no legal responsible party can be located locally. The official letters either go nowhere or get kicked around between different overseas shell companies.
Once the CCP framework is implemented, this kind of compliance-arbitrage space is basically shut down. EU regulators effectively require exchanges to point the muzzle of their operation right at their own foreheads: they must designate a “fall guy” or “responsible party” who can be summoned at any time locally and will bear legal consequences.
If a platform becomes involved in money laundering or funds connected to fraud are being parked, and regulators can’t obtain data or need urgent intervention, they no longer need to file cross-border judicial assistance requests. They can simply come directly to this local point of contact for people and data. If you don’t cooperate, the platform can be taken down on the spot, or even a local penalty mechanism can be triggered.
This also means that asset-light mid- and small-sized exchanges that rely on a few offshore licenses and take a “grey route” to penetrate the EU market will see their compliance costs rise exponentially.
Because each member state will require you to attach a figurehead and an entity, the costs of fulfilling legal obligations later, compliance audit costs, and the possibility of being subject to joint regulatory liability at any time will directly squeeze these platforms’ profit margins.
The impact on the entire industry is actually quite certain: the compliance “game” has completely evolved into a wall-building contest based on the size of funds and legal resources. Large, top-tier licensed exchanges can use this opportunity to further take control of pricing power in Europe, while market makers and liquidity channels operating in the grey zone will be forced to shift toward decentralized on-chain privacy protocols—or even deeper underground networks. The second- and third-tier CEXs that survive in the gaps will only be able to scale back their business or be acquired.$BTC
#欧盟扩中央联络点框架至加密服务商
In simple terms, if you want to solicit users or provide services in an EU member state, then regardless of whether your servers are tucked away on an offshore island and your compliance team is all operating remotely overseas, you must establish a real, tangible local point of contact within that country’s borders.
In the past, many cross-border exchanges have been best at playing hide-and-seek—making their legal entities into extremely complex stacked structures. Once a regulator, or even law enforcement in a given country, needs to obtain the transaction trail of suspect funds or issue a freeze order, they often find that no legal responsible party can be located locally. The official letters either go nowhere or get kicked around between different overseas shell companies.
Once the CCP framework is implemented, this kind of compliance-arbitrage space is basically shut down. EU regulators effectively require exchanges to point the muzzle of their operation right at their own foreheads: they must designate a “fall guy” or “responsible party” who can be summoned at any time locally and will bear legal consequences.
If a platform becomes involved in money laundering or funds connected to fraud are being parked, and regulators can’t obtain data or need urgent intervention, they no longer need to file cross-border judicial assistance requests. They can simply come directly to this local point of contact for people and data. If you don’t cooperate, the platform can be taken down on the spot, or even a local penalty mechanism can be triggered.
This also means that asset-light mid- and small-sized exchanges that rely on a few offshore licenses and take a “grey route” to penetrate the EU market will see their compliance costs rise exponentially.
Because each member state will require you to attach a figurehead and an entity, the costs of fulfilling legal obligations later, compliance audit costs, and the possibility of being subject to joint regulatory liability at any time will directly squeeze these platforms’ profit margins.
The impact on the entire industry is actually quite certain: the compliance “game” has completely evolved into a wall-building contest based on the size of funds and legal resources. Large, top-tier licensed exchanges can use this opportunity to further take control of pricing power in Europe, while market makers and liquidity channels operating in the grey zone will be forced to shift toward decentralized on-chain privacy protocols—or even deeper underground networks. The second- and third-tier CEXs that survive in the gaps will only be able to scale back their business or be acquired.$BTC
#欧盟扩中央联络点框架至加密服务商

1.1k
·
--
Verified
The latest U.S. August employment data came in a full three times higher than market expectations, tearing a hole right through the macro outlook that had been gradually easing.
The probability of further rate hikes shot up to 58% on the spot. The Nasdaq and the S&P were the first to buckle under the pressure—fears that liquidity would tighten triggered a new wave of selling in the U.S. stock market.
But if you shift your focus back to the crypto market, the picture is completely different.
$BTC Bitcoin is still firmly holding the $79,000 level. The trading action shows an extremely rare level of resilience. This in turn confirms a key fact: when mainstream capital faces fluctuations in rate expectations, it no longer simply treats crypto assets as a risk satellite of U.S. stocks. The overall positioning and liquidity structure are far more solid than many people assume.
Even more worth paying attention are the unusual moves within specific sub-sectors. Over the past week, $ZEC carved out an independent uptrend that ignored the broader macro backdrop, surging 45% within a single week. For this long-established privacy coin to break through amid rate-hike fears is absolutely not a coincidence or mere retail speculation—it truly reflects deeper liquidity preferences.
When regulatory pressure from the macro environment and rate-hike expectations both intensify, demand for absolute privacy and on-chain anonymous settlement will be amplified by necessity. Every extra point of cost along the compliant route increases the risk-off premium of native privacy networks by a fraction. This anti-fragility to traditional macro liquidity is the underlying logic that allows decentralized privacy assets to be aggressively pulled higher even while the broader market is in turmoil.
#比特币突破79000美元 #zec
The latest U.S. August employment data came in a full three times higher than market expectations, tearing a hole right through the macro outlook that had been gradually easing.
The probability of further rate hikes shot up to 58% on the spot. The Nasdaq and the S&P were the first to buckle under the pressure—fears that liquidity would tighten triggered a new wave of selling in the U.S. stock market.
But if you shift your focus back to the crypto market, the picture is completely different.
$BTC Bitcoin is still firmly holding the $79,000 level. The trading action shows an extremely rare level of resilience. This in turn confirms a key fact: when mainstream capital faces fluctuations in rate expectations, it no longer simply treats crypto assets as a risk satellite of U.S. stocks. The overall positioning and liquidity structure are far more solid than many people assume.
Even more worth paying attention are the unusual moves within specific sub-sectors. Over the past week, $ZEC carved out an independent uptrend that ignored the broader macro backdrop, surging 45% within a single week. For this long-established privacy coin to break through amid rate-hike fears is absolutely not a coincidence or mere retail speculation—it truly reflects deeper liquidity preferences.
When regulatory pressure from the macro environment and rate-hike expectations both intensify, demand for absolute privacy and on-chain anonymous settlement will be amplified by necessity. Every extra point of cost along the compliant route increases the risk-off premium of native privacy networks by a fraction. This anti-fragility to traditional macro liquidity is the underlying logic that allows decentralized privacy assets to be aggressively pulled higher even while the broader market is in turmoil.
#比特币突破79000美元 #zec
The probability of further rate hikes shot up to 58% on the spot. The Nasdaq and the S&P were the first to buckle under the pressure—fears that liquidity would tighten triggered a new wave of selling in the U.S. stock market.
But if you shift your focus back to the crypto market, the picture is completely different.
$BTC Bitcoin is still firmly holding the $79,000 level. The trading action shows an extremely rare level of resilience. This in turn confirms a key fact: when mainstream capital faces fluctuations in rate expectations, it no longer simply treats crypto assets as a risk satellite of U.S. stocks. The overall positioning and liquidity structure are far more solid than many people assume.
Even more worth paying attention are the unusual moves within specific sub-sectors. Over the past week, $ZEC carved out an independent uptrend that ignored the broader macro backdrop, surging 45% within a single week. For this long-established privacy coin to break through amid rate-hike fears is absolutely not a coincidence or mere retail speculation—it truly reflects deeper liquidity preferences.
When regulatory pressure from the macro environment and rate-hike expectations both intensify, demand for absolute privacy and on-chain anonymous settlement will be amplified by necessity. Every extra point of cost along the compliant route increases the risk-off premium of native privacy networks by a fraction. This anti-fragility to traditional macro liquidity is the underlying logic that allows decentralized privacy assets to be aggressively pulled higher even while the broader market is in turmoil.
#比特币突破79000美元 #zec

1
2
4.8k
·
--
Verified
The oil price has risen again, and I can’t even afford to fill up anymore—
Because the neighbor suddenly pressed the gun barrel directly against Iran’s most vital oil valve.
Fox’s exclusive is that the U.S. military launched a direct strike, hitting targets near Khark Island and the port of Jask, and they even didn’t spare the oil tankers.
Khark Island is only some twenty-odd kilometers from the coastline, but 90% of Iran’s exported crude has to be loaded and shipped out from here. Before, when the U.S. fought back, it largely stayed within limits—targeting mainly military sites—while energy facilities were a kind of unstated but widely understood red line. Now that move has come out, it’s like smashing the boot that had been hanging in midair right onto the ground.
That day, oil prices bounced around near $98. Once the explosions started, the market immediately began to climb in an utterly unreasonable way. Put simply, the money is not betting on the immediate loss from one or two tankers being destroyed. Instead, they’re trading the idea that once the most core logistics hub is physically disrupted, the liquidity in the Middle East’s supply side seizes up completely.
Since February this year, when the Strait of Hormuz—the waterway responsible for about 20% of global shipping capacity—was blocked, the macro market has been stuck in a state of extreme distortion and weightlessness caused by liquidity contraction. People had still been debating whether both sides could find a step to step down from earlier. But now, by physically breaking the export pipelines for crude oil, it’s simply about pushing the other side to the negotiating table through extreme economic suffocation.
However, the most lethal hidden risk in this matter isn’t whether oil prices will surge to $120. In trades on-chain or in macro-asset markets, the logic is completely the same. When a sovereign entity’s most critical cash-flow clearing channel is completely destroyed, it can’t just sit and accept full surrender—it must inevitably take asymmetric retaliatory measures.
The probability of the Strait of Hormuz going from “basically closed” to “utterly unusable” has shot up to near maximum. The risk at the tail end of the global supply chain is shifting from a predictable probability event to an irreversible, certain loss.
If the risk-hedging anchor of underlying assets like energy is completely detonated, then all pricing models for risk assets have to be wiped clean and redone. For macro exposures and hedging with leverage, in the coming days you absolutely must raise liquidity defense to the highest level. $BTC
#美军打击霍尔木兹岛及贾斯克目标
The oil price has risen again, and I can’t even afford to fill up anymore—
Because the neighbor suddenly pressed the gun barrel directly against Iran’s most vital oil valve.
Fox’s exclusive is that the U.S. military launched a direct strike, hitting targets near Khark Island and the port of Jask, and they even didn’t spare the oil tankers.
Khark Island is only some twenty-odd kilometers from the coastline, but 90% of Iran’s exported crude has to be loaded and shipped out from here. Before, when the U.S. fought back, it largely stayed within limits—targeting mainly military sites—while energy facilities were a kind of unstated but widely understood red line. Now that move has come out, it’s like smashing the boot that had been hanging in midair right onto the ground.
That day, oil prices bounced around near $98. Once the explosions started, the market immediately began to climb in an utterly unreasonable way. Put simply, the money is not betting on the immediate loss from one or two tankers being destroyed. Instead, they’re trading the idea that once the most core logistics hub is physically disrupted, the liquidity in the Middle East’s supply side seizes up completely.
Since February this year, when the Strait of Hormuz—the waterway responsible for about 20% of global shipping capacity—was blocked, the macro market has been stuck in a state of extreme distortion and weightlessness caused by liquidity contraction. People had still been debating whether both sides could find a step to step down from earlier. But now, by physically breaking the export pipelines for crude oil, it’s simply about pushing the other side to the negotiating table through extreme economic suffocation.
However, the most lethal hidden risk in this matter isn’t whether oil prices will surge to $120. In trades on-chain or in macro-asset markets, the logic is completely the same. When a sovereign entity’s most critical cash-flow clearing channel is completely destroyed, it can’t just sit and accept full surrender—it must inevitably take asymmetric retaliatory measures.
The probability of the Strait of Hormuz going from “basically closed” to “utterly unusable” has shot up to near maximum. The risk at the tail end of the global supply chain is shifting from a predictable probability event to an irreversible, certain loss.
If the risk-hedging anchor of underlying assets like energy is completely detonated, then all pricing models for risk assets have to be wiped clean and redone. For macro exposures and hedging with leverage, in the coming days you absolutely must raise liquidity defense to the highest level. $BTC
#美军打击霍尔木兹岛及贾斯克目标
Because the neighbor suddenly pressed the gun barrel directly against Iran’s most vital oil valve.
Fox’s exclusive is that the U.S. military launched a direct strike, hitting targets near Khark Island and the port of Jask, and they even didn’t spare the oil tankers.
Khark Island is only some twenty-odd kilometers from the coastline, but 90% of Iran’s exported crude has to be loaded and shipped out from here. Before, when the U.S. fought back, it largely stayed within limits—targeting mainly military sites—while energy facilities were a kind of unstated but widely understood red line. Now that move has come out, it’s like smashing the boot that had been hanging in midair right onto the ground.
That day, oil prices bounced around near $98. Once the explosions started, the market immediately began to climb in an utterly unreasonable way. Put simply, the money is not betting on the immediate loss from one or two tankers being destroyed. Instead, they’re trading the idea that once the most core logistics hub is physically disrupted, the liquidity in the Middle East’s supply side seizes up completely.
Since February this year, when the Strait of Hormuz—the waterway responsible for about 20% of global shipping capacity—was blocked, the macro market has been stuck in a state of extreme distortion and weightlessness caused by liquidity contraction. People had still been debating whether both sides could find a step to step down from earlier. But now, by physically breaking the export pipelines for crude oil, it’s simply about pushing the other side to the negotiating table through extreme economic suffocation.
However, the most lethal hidden risk in this matter isn’t whether oil prices will surge to $120. In trades on-chain or in macro-asset markets, the logic is completely the same. When a sovereign entity’s most critical cash-flow clearing channel is completely destroyed, it can’t just sit and accept full surrender—it must inevitably take asymmetric retaliatory measures.
The probability of the Strait of Hormuz going from “basically closed” to “utterly unusable” has shot up to near maximum. The risk at the tail end of the global supply chain is shifting from a predictable probability event to an irreversible, certain loss.
If the risk-hedging anchor of underlying assets like energy is completely detonated, then all pricing models for risk assets have to be wiped clean and redone. For macro exposures and hedging with leverage, in the coming days you absolutely must raise liquidity defense to the highest level. $BTC
#美军打击霍尔木兹岛及贾斯克目标

2
3.3k
·
--
Understand this $AERO rally—there’s absolutely no need to obsess over those fake, hollow macro indicators.
If you break the books down, the essence is that on the Base chain, the real trading liquidity is starting to recover, and RWA—represented by tokenized assets from the US stock market—has created on-chain value that settles there.
In the past, people had a bias against DEX tokens. They thought it was just another batch of “mining coins,” essentially another round of money-printing and dumping.
But when a DEX comes to dominate the vast majority of real settlement business across the entire Layer 2—and even its liquidity tokens are integrated via collateral into lending protocols like TENOR—the token turnover efficiency on-chain and the structure of locked capital have already changed.
From a purely on-chain game-theory perspective, most people only see token price movement, but they ignore the reconfiguration of role-based earnings behind it.
For ordinary liquidity providers, simply mining in pools to short is very likely to get liquidated due to one-sided market conditions and price swings. But for whales and arbitrageurs, using seamless collateral + borrowing is like adding leverage on Base with extremely low real capital costs and embedding it into the system. This mechanism turns those chips that have settled in the pools into real currency—squeezing sell-pressure on the circulating supply dramatically in the short term.
That said, I remain cautious about this short-term valuation “repair.” In crypto markets, chasing pumps often marks the beginning of liquidity’s end.
What’s truly worth watching isn’t how much AERO can pull in next—it’s that the underlying logic of where this capital flow is going has changed. Hot money is accelerating its escape from purely conceptual sectors with no cash flow and valuations inflated by “air,” and rushing into top-tier infrastructure that has real fee revenue support and ecosystem backing from a mainnet.
Before you’re truly ready to get in, there’s no need to let the current surge intoxicate you. You should put more effort into observing whether Base’s TVL growth has started to stall, and whether the number of daily active addresses—after removing wash-trading volume—can continue to hold at high levels. If there’s a real break in settlement volume, the current token liquidity premium will be quickly erased by arbitrageurs.
In this market, it has never been short of stories about getting rich overnight. What’s missing is the ability, amid the frenzy, to clearly see the liquidation lines and calmly hold tight to your wallet.$BTC
#aero单日上涨17%
Understand this $AERO rally—there’s absolutely no need to obsess over those fake, hollow macro indicators.
If you break the books down, the essence is that on the Base chain, the real trading liquidity is starting to recover, and RWA—represented by tokenized assets from the US stock market—has created on-chain value that settles there.
In the past, people had a bias against DEX tokens. They thought it was just another batch of “mining coins,” essentially another round of money-printing and dumping.
But when a DEX comes to dominate the vast majority of real settlement business across the entire Layer 2—and even its liquidity tokens are integrated via collateral into lending protocols like TENOR—the token turnover efficiency on-chain and the structure of locked capital have already changed.
From a purely on-chain game-theory perspective, most people only see token price movement, but they ignore the reconfiguration of role-based earnings behind it.
For ordinary liquidity providers, simply mining in pools to short is very likely to get liquidated due to one-sided market conditions and price swings. But for whales and arbitrageurs, using seamless collateral + borrowing is like adding leverage on Base with extremely low real capital costs and embedding it into the system. This mechanism turns those chips that have settled in the pools into real currency—squeezing sell-pressure on the circulating supply dramatically in the short term.
That said, I remain cautious about this short-term valuation “repair.” In crypto markets, chasing pumps often marks the beginning of liquidity’s end.
What’s truly worth watching isn’t how much AERO can pull in next—it’s that the underlying logic of where this capital flow is going has changed. Hot money is accelerating its escape from purely conceptual sectors with no cash flow and valuations inflated by “air,” and rushing into top-tier infrastructure that has real fee revenue support and ecosystem backing from a mainnet.
Before you’re truly ready to get in, there’s no need to let the current surge intoxicate you. You should put more effort into observing whether Base’s TVL growth has started to stall, and whether the number of daily active addresses—after removing wash-trading volume—can continue to hold at high levels. If there’s a real break in settlement volume, the current token liquidity premium will be quickly erased by arbitrageurs.
In this market, it has never been short of stories about getting rich overnight. What’s missing is the ability, amid the frenzy, to clearly see the liquidation lines and calmly hold tight to your wallet.$BTC
#aero单日上涨17%
If you break the books down, the essence is that on the Base chain, the real trading liquidity is starting to recover, and RWA—represented by tokenized assets from the US stock market—has created on-chain value that settles there.
In the past, people had a bias against DEX tokens. They thought it was just another batch of “mining coins,” essentially another round of money-printing and dumping.
But when a DEX comes to dominate the vast majority of real settlement business across the entire Layer 2—and even its liquidity tokens are integrated via collateral into lending protocols like TENOR—the token turnover efficiency on-chain and the structure of locked capital have already changed.
From a purely on-chain game-theory perspective, most people only see token price movement, but they ignore the reconfiguration of role-based earnings behind it.
For ordinary liquidity providers, simply mining in pools to short is very likely to get liquidated due to one-sided market conditions and price swings. But for whales and arbitrageurs, using seamless collateral + borrowing is like adding leverage on Base with extremely low real capital costs and embedding it into the system. This mechanism turns those chips that have settled in the pools into real currency—squeezing sell-pressure on the circulating supply dramatically in the short term.
That said, I remain cautious about this short-term valuation “repair.” In crypto markets, chasing pumps often marks the beginning of liquidity’s end.
What’s truly worth watching isn’t how much AERO can pull in next—it’s that the underlying logic of where this capital flow is going has changed. Hot money is accelerating its escape from purely conceptual sectors with no cash flow and valuations inflated by “air,” and rushing into top-tier infrastructure that has real fee revenue support and ecosystem backing from a mainnet.
Before you’re truly ready to get in, there’s no need to let the current surge intoxicate you. You should put more effort into observing whether Base’s TVL growth has started to stall, and whether the number of daily active addresses—after removing wash-trading volume—can continue to hold at high levels. If there’s a real break in settlement volume, the current token liquidity premium will be quickly erased by arbitrageurs.
In this market, it has never been short of stories about getting rich overnight. What’s missing is the ability, amid the frenzy, to clearly see the liquidation lines and calmly hold tight to your wallet.$BTC
#aero单日上涨17%

1
2.9k
·
--
There isn’t much to post today. Everyone, take care of yourselves. $BTC $BNB $ETH
There isn’t much to post today. Everyone, take care of yourselves. $BTC $BNB $ETH
305
·
--
Verified
The yen’s appreciation has been anything but quiet. On Tuesday, it climbed against the US dollar all the way to 153.53, with its month-on-month gain nearing 3.8%—making it the top performer among the G10 currencies. Many people watching the market are calling for 152 to be reached soon, but how much staying power does the move really have? You need to break it down by layers.
On the surface, this round of sharp surge appears to be a chain reaction triggered by a liquidity shortfall.
The US holiday markets already have thin liquidity. Once USD/JPY broke below the key support level at 155, it immediately set off a large wave of long positions getting stopped out. Options traders who had been buying and holding long exposure to the dollar had to follow the flow and dump USD to manage risk. From a technical perspective, once 155 is broken, the lower line of defense quickly retreats to around 152.27 and even 152.10—this is also the yen’s most solid technical support zone this year.
First, there are rumors about an asset-allocation adjustment by Japan’s Government Pension Investment Fund (GPIF). If an institution of this magnitude prepares to move overseas assets back to Japan, liquidity expectations both on-chain and off-chain could be rewritten in an instant. Second is the bulk unwinding of carry trade positions based on interest-rate differentials.
Previously, people borrowed low-interest yen to buy higher-yield US dollar assets and lock in steady carry returns—provided that currency volatility stayed low enough. Now that the exchange rate has smashed through 154, leveraged carry-trade capital has no choice but to sell foreign-currency assets, convert back to yen, and repay debt to survive. The more aggressively positions are liquidated, the more aggressively the yen gets bought—creating a squeeze effect. That said, there’s a hidden implication: if this liquidation-driven move pushes the yen too high in the short term, it may actually open up profit opportunities for funds that have been waiting to build short positions at high levels.
The key deciding factor is whether there is another rate hike. The probability implied by overnight index swaps that the Bank of Japan will raise rates by 25 basis points next week is as high as 97%—the market is basically treating a hike as a certainty. But based on the central bank’s past playbook, simply going through the motions and hiking by 25 bps may not be enough to keep the yen’s momentum going.
The market’s stance is very clear right now: the rate hike is merely the “minimum threshold” to support the yen. To maintain this push higher, the Bank of Japan not only has to act next week, but also must deliver a very hawkish signal in subsequent communications—clearly outlining expectations for continuing rate hikes through year-end.
If the central bank’s tone is even slightly hesitant, or if this Friday’s US inflation data comes in hotter than expected and sparks a rebound in the market, the arbitrage positioning will very likely return once again.
#日元突破155逼近年内新高
The yen’s appreciation has been anything but quiet. On Tuesday, it climbed against the US dollar all the way to 153.53, with its month-on-month gain nearing 3.8%—making it the top performer among the G10 currencies. Many people watching the market are calling for 152 to be reached soon, but how much staying power does the move really have? You need to break it down by layers.
On the surface, this round of sharp surge appears to be a chain reaction triggered by a liquidity shortfall.
The US holiday markets already have thin liquidity. Once USD/JPY broke below the key support level at 155, it immediately set off a large wave of long positions getting stopped out. Options traders who had been buying and holding long exposure to the dollar had to follow the flow and dump USD to manage risk. From a technical perspective, once 155 is broken, the lower line of defense quickly retreats to around 152.27 and even 152.10—this is also the yen’s most solid technical support zone this year.
First, there are rumors about an asset-allocation adjustment by Japan’s Government Pension Investment Fund (GPIF). If an institution of this magnitude prepares to move overseas assets back to Japan, liquidity expectations both on-chain and off-chain could be rewritten in an instant. Second is the bulk unwinding of carry trade positions based on interest-rate differentials.
Previously, people borrowed low-interest yen to buy higher-yield US dollar assets and lock in steady carry returns—provided that currency volatility stayed low enough. Now that the exchange rate has smashed through 154, leveraged carry-trade capital has no choice but to sell foreign-currency assets, convert back to yen, and repay debt to survive. The more aggressively positions are liquidated, the more aggressively the yen gets bought—creating a squeeze effect. That said, there’s a hidden implication: if this liquidation-driven move pushes the yen too high in the short term, it may actually open up profit opportunities for funds that have been waiting to build short positions at high levels.
The key deciding factor is whether there is another rate hike. The probability implied by overnight index swaps that the Bank of Japan will raise rates by 25 basis points next week is as high as 97%—the market is basically treating a hike as a certainty. But based on the central bank’s past playbook, simply going through the motions and hiking by 25 bps may not be enough to keep the yen’s momentum going.
The market’s stance is very clear right now: the rate hike is merely the “minimum threshold” to support the yen. To maintain this push higher, the Bank of Japan not only has to act next week, but also must deliver a very hawkish signal in subsequent communications—clearly outlining expectations for continuing rate hikes through year-end.
If the central bank’s tone is even slightly hesitant, or if this Friday’s US inflation data comes in hotter than expected and sparks a rebound in the market, the arbitrage positioning will very likely return once again.
#日元突破155逼近年内新高
On the surface, this round of sharp surge appears to be a chain reaction triggered by a liquidity shortfall.
The US holiday markets already have thin liquidity. Once USD/JPY broke below the key support level at 155, it immediately set off a large wave of long positions getting stopped out. Options traders who had been buying and holding long exposure to the dollar had to follow the flow and dump USD to manage risk. From a technical perspective, once 155 is broken, the lower line of defense quickly retreats to around 152.27 and even 152.10—this is also the yen’s most solid technical support zone this year.
First, there are rumors about an asset-allocation adjustment by Japan’s Government Pension Investment Fund (GPIF). If an institution of this magnitude prepares to move overseas assets back to Japan, liquidity expectations both on-chain and off-chain could be rewritten in an instant. Second is the bulk unwinding of carry trade positions based on interest-rate differentials.
Previously, people borrowed low-interest yen to buy higher-yield US dollar assets and lock in steady carry returns—provided that currency volatility stayed low enough. Now that the exchange rate has smashed through 154, leveraged carry-trade capital has no choice but to sell foreign-currency assets, convert back to yen, and repay debt to survive. The more aggressively positions are liquidated, the more aggressively the yen gets bought—creating a squeeze effect. That said, there’s a hidden implication: if this liquidation-driven move pushes the yen too high in the short term, it may actually open up profit opportunities for funds that have been waiting to build short positions at high levels.
The key deciding factor is whether there is another rate hike. The probability implied by overnight index swaps that the Bank of Japan will raise rates by 25 basis points next week is as high as 97%—the market is basically treating a hike as a certainty. But based on the central bank’s past playbook, simply going through the motions and hiking by 25 bps may not be enough to keep the yen’s momentum going.
The market’s stance is very clear right now: the rate hike is merely the “minimum threshold” to support the yen. To maintain this push higher, the Bank of Japan not only has to act next week, but also must deliver a very hawkish signal in subsequent communications—clearly outlining expectations for continuing rate hikes through year-end.
If the central bank’s tone is even slightly hesitant, or if this Friday’s US inflation data comes in hotter than expected and sparks a rebound in the market, the arbitrage positioning will very likely return once again.
#日元突破155逼近年内新高

438
·
--
This Bitcoin $BTC perpetual contract created by Kalshi has been hauled to a Washington court by the CME via a lawsuit. The CME’s logic is simple: because it has no expiration date and relies on funding rates to track spot, it is essentially a swap rather than a standard futures contract, so the CFTC shouldn’t have approved it.
The CFTC’s response was extremely straightforward: it directly requested that the case be dismissed and characterized the CME’s complaint as “manufacturing issues out of nothing.” The regulatory reasoning is clear. Perpetual contracts are merely a mechanism innovation and don’t change the underlying nature of price hedging. Moreover, CME’s own Bitcoin futures trading volume is even higher than before the approval, so the business has suffered no harm. Since the door to compliance is already open, the CME could easily list one of its own.
This time, the CME’s challenge isn’t really a dispute over compliance dogma—it’s the instinctive fear of a traditional derivatives giant over crypto’s native trading structures entering the regulated market. Perpetual contracts are the most successful derivatives in the crypto industry: they have high capital efficiency, eliminate the need for frequent rolling positions, and automatically anchor to spot via funding rates—an effective “dimensionality reduction” for traders. In the past, regulatory barriers were the traditional exchanges’ biggest moat. As long as perpetual products were kept out of the door, the CME could monopolize the compliant derivatives “cake” using traditional futures.
Now that Kalshi has won this approval, it effectively connects perpetual contracts directly into the compliance channel. When traders no longer have to bear the discount/premium fluctuations from periodic settlement dates and the friction costs of rolling positions, the rigid disadvantages of traditional futures are amplified endlessly. The CME may loudly claim the classification is non-compliant, but what it’s truly worried about is its pricing power and the risk of having its clearing-fee pool eroded.
By taking a firm stance this time to defend its position, the CFTC shows that regulators are starting to accept crypto market-validated derivative structures and are no longer being led around by traditional financial giants. Even if the CME submitted its response in early October, it can’t stop the permeation of perpetual mechanisms. Traders will always choose markets with higher capital efficiency and lower friction. Once the benefits of mechanism evolution are released, there’s no going back.
#cftc请求驳回cme诉kalshi比特币期货案
This Bitcoin $BTC perpetual contract created by Kalshi has been hauled to a Washington court by the CME via a lawsuit. The CME’s logic is simple: because it has no expiration date and relies on funding rates to track spot, it is essentially a swap rather than a standard futures contract, so the CFTC shouldn’t have approved it.
The CFTC’s response was extremely straightforward: it directly requested that the case be dismissed and characterized the CME’s complaint as “manufacturing issues out of nothing.” The regulatory reasoning is clear. Perpetual contracts are merely a mechanism innovation and don’t change the underlying nature of price hedging. Moreover, CME’s own Bitcoin futures trading volume is even higher than before the approval, so the business has suffered no harm. Since the door to compliance is already open, the CME could easily list one of its own.
This time, the CME’s challenge isn’t really a dispute over compliance dogma—it’s the instinctive fear of a traditional derivatives giant over crypto’s native trading structures entering the regulated market. Perpetual contracts are the most successful derivatives in the crypto industry: they have high capital efficiency, eliminate the need for frequent rolling positions, and automatically anchor to spot via funding rates—an effective “dimensionality reduction” for traders. In the past, regulatory barriers were the traditional exchanges’ biggest moat. As long as perpetual products were kept out of the door, the CME could monopolize the compliant derivatives “cake” using traditional futures.
Now that Kalshi has won this approval, it effectively connects perpetual contracts directly into the compliance channel. When traders no longer have to bear the discount/premium fluctuations from periodic settlement dates and the friction costs of rolling positions, the rigid disadvantages of traditional futures are amplified endlessly. The CME may loudly claim the classification is non-compliant, but what it’s truly worried about is its pricing power and the risk of having its clearing-fee pool eroded.
By taking a firm stance this time to defend its position, the CFTC shows that regulators are starting to accept crypto market-validated derivative structures and are no longer being led around by traditional financial giants. Even if the CME submitted its response in early October, it can’t stop the permeation of perpetual mechanisms. Traders will always choose markets with higher capital efficiency and lower friction. Once the benefits of mechanism evolution are released, there’s no going back.
#cftc请求驳回cme诉kalshi比特币期货案
The CFTC’s response was extremely straightforward: it directly requested that the case be dismissed and characterized the CME’s complaint as “manufacturing issues out of nothing.” The regulatory reasoning is clear. Perpetual contracts are merely a mechanism innovation and don’t change the underlying nature of price hedging. Moreover, CME’s own Bitcoin futures trading volume is even higher than before the approval, so the business has suffered no harm. Since the door to compliance is already open, the CME could easily list one of its own.
This time, the CME’s challenge isn’t really a dispute over compliance dogma—it’s the instinctive fear of a traditional derivatives giant over crypto’s native trading structures entering the regulated market. Perpetual contracts are the most successful derivatives in the crypto industry: they have high capital efficiency, eliminate the need for frequent rolling positions, and automatically anchor to spot via funding rates—an effective “dimensionality reduction” for traders. In the past, regulatory barriers were the traditional exchanges’ biggest moat. As long as perpetual products were kept out of the door, the CME could monopolize the compliant derivatives “cake” using traditional futures.
Now that Kalshi has won this approval, it effectively connects perpetual contracts directly into the compliance channel. When traders no longer have to bear the discount/premium fluctuations from periodic settlement dates and the friction costs of rolling positions, the rigid disadvantages of traditional futures are amplified endlessly. The CME may loudly claim the classification is non-compliant, but what it’s truly worried about is its pricing power and the risk of having its clearing-fee pool eroded.
By taking a firm stance this time to defend its position, the CFTC shows that regulators are starting to accept crypto market-validated derivative structures and are no longer being led around by traditional financial giants. Even if the CME submitted its response in early October, it can’t stop the permeation of perpetual mechanisms. Traders will always choose markets with higher capital efficiency and lower friction. Once the benefits of mechanism evolution are released, there’s no going back.
#cftc请求驳回cme诉kalshi比特币期货案
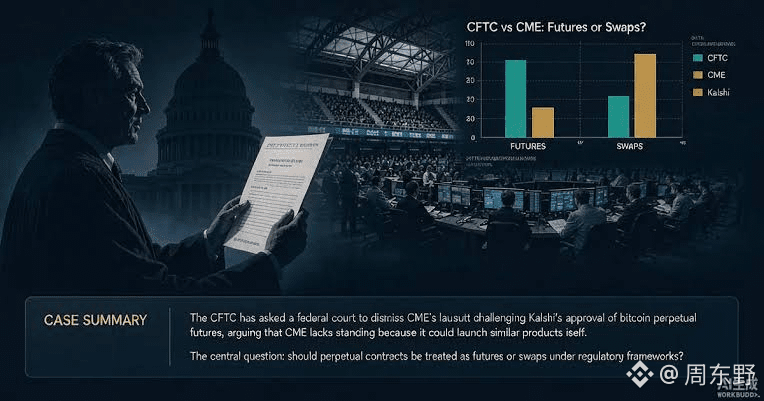
2
1.6k
Log in to explore more content
Join global crypto users on Binance Square
⚡️ Get latest and useful information about crypto.
💬 Trusted by the world’s largest crypto exchange.
👍 Discover real insights from verified creators.
Email / Phone number
Trending Topics
FedRateWatch
1.4M views
6,527 Discussing
Share & Win Traffic Reward in our Trending Hashtag Campaign
✨Topic: FOMC September, What's The Fed's Next Move?
👉How to Join:
Publish a short post or article with hashtag #FedRateWatch
Create content based on the below angles:
- August core CPI rose 0.3% month-over-month, and the odds of a 25bp hike this week are now close to 90%. Do you anticipate a rate hike this week? Is it a one-off, or the start of a longer hiking cycle?
- If the hike lands, how does it play out for BTC, tech stocks, and gold? Bullish or bearish?
- How are you planning to trade next? Share your BTC, stocks or gold trade/holdings with our trade sharing widget.
⏰Campaign Period:
- 2026-09-15 11:00 - 2026-09-17 3:00 UTC
🎁Reward:
- Qualified posts that comply with the above guidelines and contain more than 100 words will be reviewed and may receive a random traffic boost of 500 to 3,000 views. You will receive a notification from your feed secretary if your post is selected.
- Get a chance to have your article featured on Binance Square Official
Need ideas for your post? Visit the topic page #FedRateWatch or the Square Guide on How to Post for Better Reach.
Binance Square Official
·638 Likes
·1.6M views
ZcashRises6%
39,689 views
560 Discussing
XRPSinks10%
26,648 views
370 Discussing