

杜浔
28 Posts

杜浔
Report
Block User
很懒很佛系,不想录视频!文字将就看! 手续费八折邀请码:JMSYYDS
1 Following
8 Followers
3 Liked
Posts
·
--
Go long on Ethereum at around the current price of 2305
Stop loss: 2245
Take profit: 2400
Follow trades rationally!
Go long on Ethereum at around the current price of 2305
Stop loss: 2245
Take profit: 2400
Follow trades rationally!
Stop loss: 2245
Take profit: 2400
Follow trades rationally!
118
·
--
Article
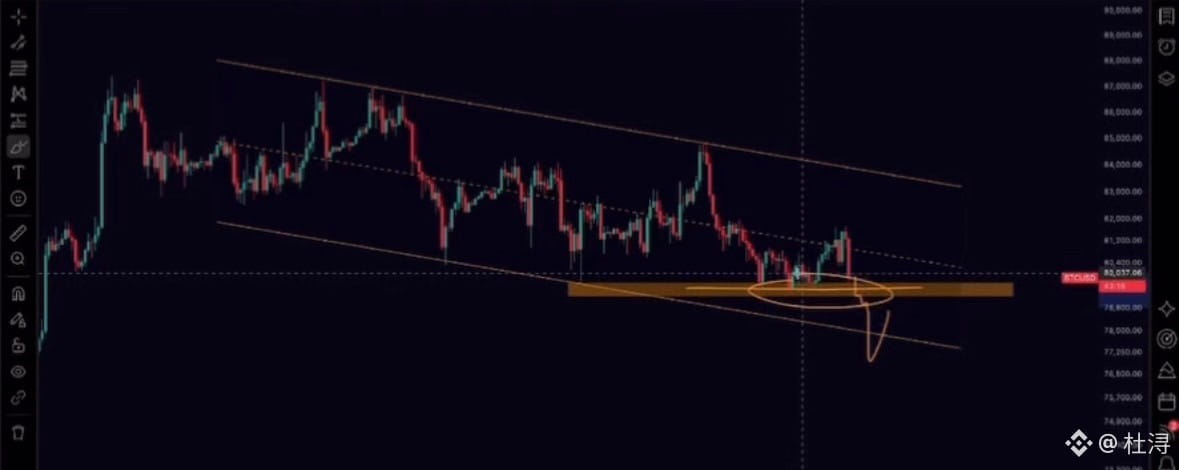
We should see a clear direction by Tuesday or Wednesday at the latest—most likely a sharp rally. More choppy action this week! When should you enter? Read the articleHello, everyone! I’m Du Xun! This morning, we saw a sharp drop on increased volume. This move came after yesterday’s price twice surged to 81,800. It looked as though the price was about to stabilize above 80,000 and start a new rally. But it began turning down late yesterday evening, then accelerated lower this morning. The price has now slipped slightly below 80,000 again. The key support zone below is between 80,000 and 79,000, so this is a crucial area. If this key support—which is currently the only effective support—breaks, I believe we could see an accelerating sell-off rather than a prolonged, gradual decline. It could be a sharp drop that takes us straight to the bottom. Exactly how far the price could fall is hard to say for now, but I don’t think there’s much room for further downside from here. Overall, I remain bullish on the larger time frame. There is certainly some uncontrollable risk in the short term, so lately we’ve mainly been trading short-term moves. As for medium- and long-term positioning, you can wait a little longer. If you’re building a position on the left side of the chart, be sure to manage your risk. After the Fed’s interest rate decision last night, U.S. stocks also experienced a sharp drop. Google in particular fell by 8%. The U.S. stock market took a major hit, and Bitcoin also fell in tandem. But we can see that Bitcoin’s decline wasn’t as steep as that of the U.S. stock market. It fell at the same time, but not by the same amount, so it has held up relatively well. The current accelerated decline hasn’t stopped yet. The key thing to watch next is whether support between 79,000 and 80,000 can halt the drop again. This is extremely important. For the larger time frame, we believe we’re near a relative bottom and remain bullish. Yesterday, the price broke above 80,000 and held above it, testing above 81,000 twice. We therefore thought that 80,000 might provide effective support during this pullback, so I also think it would have been quite risky to bet on a short at these high levels. On the four-hour chart, this is still a downward consolidation. In terms of the actual price move, it fell from a high of 87,000 to just over 79,000—a drop of several thousand points, but less than 10,000.
We should see a clear direction by Tuesday or Wednesday at the latest—most likely a sharp rally. More choppy action this week! When should you enter? Read the article
Hello, everyone! I’m Du Xun! This morning, we saw a sharp drop on increased volume. This move came after yesterday’s price twice surged to 81,800. It looked as though the price was about to stabilize above 80,000 and start a new rally. But it began turning down late yesterday evening, then accelerated lower this morning. The price has now slipped slightly below 80,000 again. The key support zone below is between 80,000 and 79,000, so this is a crucial area. If this key support—which is currently the only effective support—breaks, I believe we could see an accelerating sell-off rather than a prolonged, gradual decline. It could be a sharp drop that takes us straight to the bottom. Exactly how far the price could fall is hard to say for now, but I don’t think there’s much room for further downside from here. Overall, I remain bullish on the larger time frame. There is certainly some uncontrollable risk in the short term, so lately we’ve mainly been trading short-term moves. As for medium- and long-term positioning, you can wait a little longer. If you’re building a position on the left side of the chart, be sure to manage your risk. After the Fed’s interest rate decision last night, U.S. stocks also experienced a sharp drop. Google in particular fell by 8%. The U.S. stock market took a major hit, and Bitcoin also fell in tandem. But we can see that Bitcoin’s decline wasn’t as steep as that of the U.S. stock market. It fell at the same time, but not by the same amount, so it has held up relatively well. The current accelerated decline hasn’t stopped yet. The key thing to watch next is whether support between 79,000 and 80,000 can halt the drop again. This is extremely important. For the larger time frame, we believe we’re near a relative bottom and remain bullish. Yesterday, the price broke above 80,000 and held above it, testing above 81,000 twice. We therefore thought that 80,000 might provide effective support during this pullback, so I also think it would have been quite risky to bet on a short at these high levels. On the four-hour chart, this is still a downward consolidation. In terms of the actual price move, it fell from a high of 87,000 to just over 79,000—a drop of several thousand points, but less than 10,000.
321
·
--
Go long on Bitcoin near 79,700
Stop loss: 79,000
Take profit: 82,750
Manage your position size prudently!
For medium- to long-term spot holdings, place limit orders near 78,550 and 76,000.
Go long on Bitcoin near 79,700
Stop loss: 79,000
Take profit: 82,750
Manage your position size prudently!
For medium- to long-term spot holdings, place limit orders near 78,550 and 76,000.
Stop loss: 79,000
Take profit: 82,750
Manage your position size prudently!
For medium- to long-term spot holdings, place limit orders near 78,550 and 76,000.
199
·
--
Article
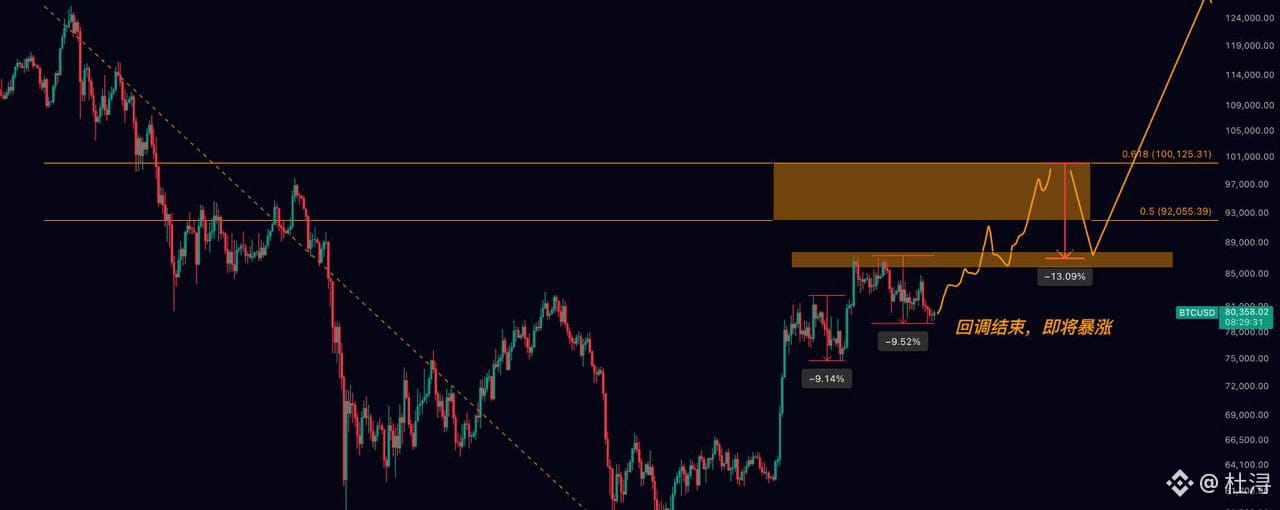
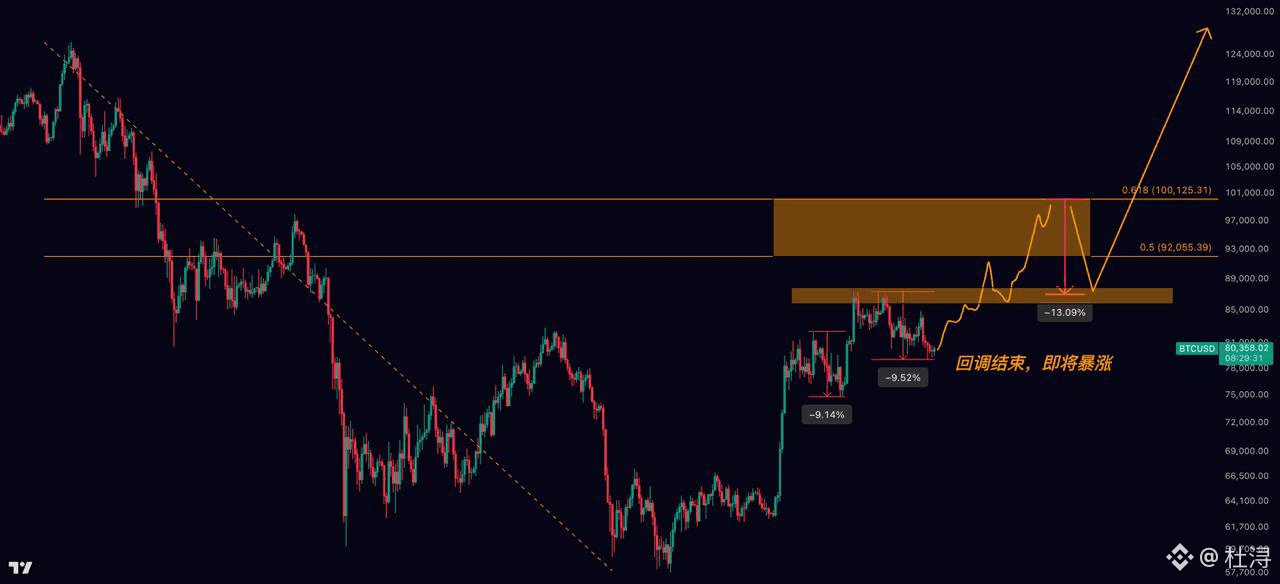
On the Eve of a Surge: When Should You Get In?Hello, everyone! I’m Du Xun! Bitcoin has now climbed to around 81,000! Back then, 48% of people were waiting for it to drop below 50,000. They waited until it reached 60,000, 70,000, and 80,000. Even if it pulled back to 70,000, you still might not dare to get in! No matter how the market corrects, or how much of a correction you’re hoping for, it can’t change the fact that the price has risen from 60,000 to 80,000. Each new level is actually higher than the last—that’s a fact too! So, if you bought spot with Du Xun, cherish your holdings and hold on to them! Based on the current market, let me share why I think the next targets are 92,000–100,000!
On the Eve of a Surge: When Should You Get In?
Hello, everyone! I’m Du Xun! Bitcoin has now climbed to around 81,000! Back then, 48% of people were waiting for it to drop below 50,000. They waited until it reached 60,000, 70,000, and 80,000. Even if it pulled back to 70,000, you still might not dare to get in! No matter how the market corrects, or how much of a correction you’re hoping for, it can’t change the fact that the price has risen from 60,000 to 80,000. Each new level is actually higher than the last—that’s a fact too! So, if you bought spot with Du Xun, cherish your holdings and hold on to them! Based on the current market, let me share why I think the next targets are 92,000–100,000!
91
·
--
Bitcoin’s current correction has ended. The next bullish target range is 92,000–100,000.
Bitcoin’s current correction has ended. The next bullish target range is 92,000–100,000.
1
445
·
--
Article
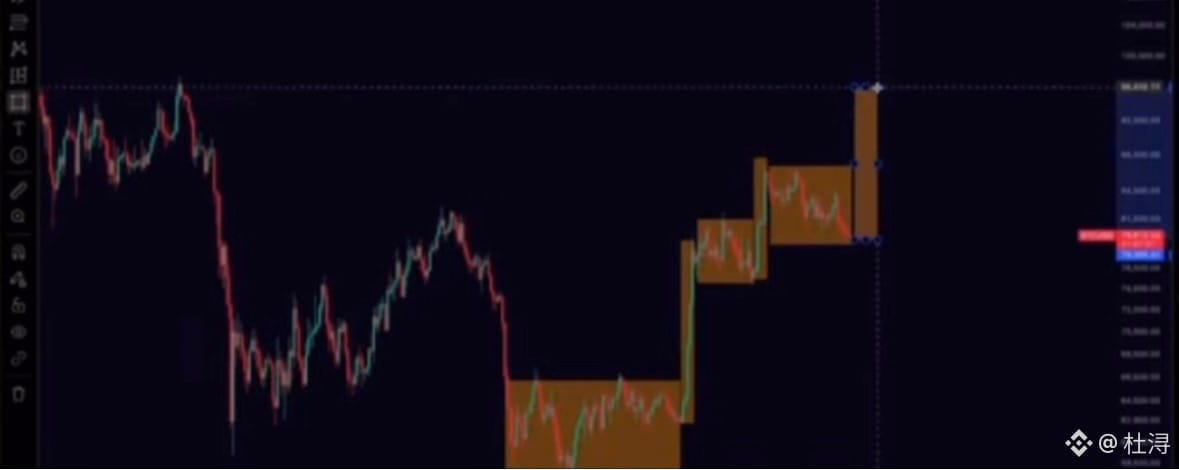
BTC Continues to Drift Lower! When Will It Bottom?Hello everyone! I’m Du Xun. Looking at Bitcoin on the daily chart, we’re seeing a sustained decline. From yesterday to today, the price has repeatedly tested the $80,000 level, crossing above and then below it several times. It has been moving sideways around $80,000 throughout this period, so the short-term trend does look somewhat weak. Earlier, we saw a sharp drop on heavy volume, followed by a slower decline. But on the daily chart, although the past few days have all closed lower, the actual downside has been fairly limited. Each time the price dipped, it left a relatively long lower wick and quickly recovered, rebounding soon after the drop. So, is $80,000 a genuinely strong support level? It is indeed acting as support: whenever the price tests $80,000, it tends to bounce to some extent. But if we’re asking how well this support is holding and how strong it is, we haven’t yet seen new buyers step in aggressively at this level. Nor have we seen a particularly strong rebound from $80,000 so far.
BTC Continues to Drift Lower! When Will It Bottom?
Hello everyone! I’m Du Xun. Looking at Bitcoin on the daily chart, we’re seeing a sustained decline. From yesterday to today, the price has repeatedly tested the $80,000 level, crossing above and then below it several times. It has been moving sideways around $80,000 throughout this period, so the short-term trend does look somewhat weak. Earlier, we saw a sharp drop on heavy volume, followed by a slower decline. But on the daily chart, although the past few days have all closed lower, the actual downside has been fairly limited. Each time the price dipped, it left a relatively long lower wick and quickly recovered, rebounding soon after the drop. So, is $80,000 a genuinely strong support level? It is indeed acting as support: whenever the price tests $80,000, it tends to bounce to some extent. But if we’re asking how well this support is holding and how strong it is, we haven’t yet seen new buyers step in aggressively at this level. Nor have we seen a particularly strong rebound from $80,000 so far.
1.2k
·
--
Article
Bitcoin Falls Below $80K—Is It Running Out of Room to Drop?Hello, everyone! I’m Du Xun. After two days of volatility over the weekend, Bitcoin’s weekly price closed right at the $80,000 mark. Looking at the weekly chart, it has closed lower for three consecutive weeks and moved downward amid volatility. The recent trend looks extremely weak, but the actual downside hasn’t been as great as people might have expected. There have certainly been a lot of bearish factors weighing on the market lately. U.S. stocks have undergone a downward correction, with AI and tech stocks in particular suffering a major crash. Bitcoin has also been affected by this correlation and fallen in tandem. Add stubbornly high inflation, rising U.S. Treasury yields, and the recent rebound in oil prices—with crude now above $100 a barrel—and the approaching midterm elections, and it’s clear the market is facing many headwinds and some short-term uncertainty. In my view, Bitcoin hasn’t been affected by these market forces as much as it might seem. So I still see this decline as a technical correction—a normal, healthy structural pullback within an overall bullish trend.
Bitcoin Falls Below $80K—Is It Running Out of Room to Drop?
Hello, everyone! I’m Du Xun. After two days of volatility over the weekend, Bitcoin’s weekly price closed right at the $80,000 mark. Looking at the weekly chart, it has closed lower for three consecutive weeks and moved downward amid volatility. The recent trend looks extremely weak, but the actual downside hasn’t been as great as people might have expected. There have certainly been a lot of bearish factors weighing on the market lately. U.S. stocks have undergone a downward correction, with AI and tech stocks in particular suffering a major crash. Bitcoin has also been affected by this correlation and fallen in tandem. Add stubbornly high inflation, rising U.S. Treasury yields, and the recent rebound in oil prices—with crude now above $100 a barrel—and the approaching midterm elections, and it’s clear the market is facing many headwinds and some short-term uncertainty. In my view, Bitcoin hasn’t been affected by these market forces as much as it might seem. So I still see this decline as a technical correction—a normal, healthy structural pullback within an overall bullish trend.
1
1.4k
·
--
Go long on Ethereum in the 2300–2315 range
Take profit: 2520–2600
Reduce position: 2235
Stop loss: 2200
Copy trade rationally!
Go long on Ethereum in the 2300–2315 range
Take profit: 2520–2600
Reduce position: 2235
Stop loss: 2200
Copy trade rationally!
Take profit: 2520–2600
Reduce position: 2235
Stop loss: 2200
Copy trade rationally!
194
·
--
Go long on Bitcoin near 80,900
Stop loss: 79,000
Take profit: 85,000
Trade rationally and manage your position size.
Go long on Bitcoin near 80,900
Stop loss: 79,000
Take profit: 85,000
Trade rationally and manage your position size.
Stop loss: 79,000
Take profit: 85,000
Trade rationally and manage your position size.
138
·
--
Watch more and trade less this weekend. Bitcoin may still make one more wick down.
Around 76,000, the 50-day moving average is the bottom support.
If it holds, the price will reach 84,000–87,000.
If it doesn’t, we’re in for another long period of sideways movement.
Watch more and trade less this weekend. Bitcoin may still make one more wick down.
Around 76,000, the 50-day moving average is the bottom support.
If it holds, the price will reach 84,000–87,000.
If it doesn’t, we’re in for another long period of sideways movement.
Around 76,000, the 50-day moving average is the bottom support.
If it holds, the price will reach 84,000–87,000.
If it doesn’t, we’re in for another long period of sideways movement.
148
·
--
Bitcoin is continuing with yesterday’s strategy.
Go long near the 80,000 support below.
Stop-loss: 79,700.
Initial take-profit target: 84,000.
The silver long hit its stop-loss—the move exceeded expectations, and the market is closed over the weekend.
You can open starter long positions in silver and gold!
Go long near the 80,000 support below.
Stop-loss: 79,700.
Initial take-profit target: 84,000.
The silver long hit its stop-loss—the move exceeded expectations, and the market is closed over the weekend.
You can open starter long positions in silver and gold!
399
·
--
I won’t trade crude oil today; I’m already short anyway.
Short around 100; stop-loss at 102.5.
Today I’ll take a small position in silver, going long around 56.
Stop-loss at 54.8; take-profit at 60.
Investing involves risk. Manage your position size! You are responsible for your own profits and losses.
Short around 100; stop-loss at 102.5.
Today I’ll take a small position in silver, going long around 56.
Stop-loss at 54.8; take-profit at 60.
Investing involves risk. Manage your position size! You are responsible for your own profits and losses.
674
·
--
Article
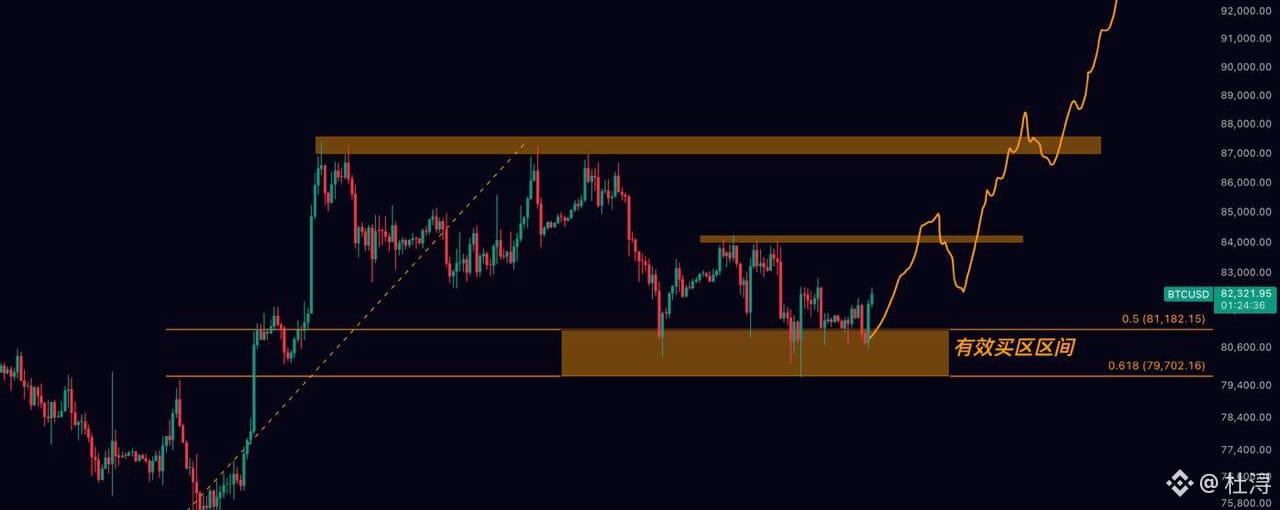
Remember This Chart Pattern! Buy the Dips, Buy the DipsHello everyone! I’m Du Xun! Yesterday, the market finally showed some movement. It first rose and broke through the initial resistance zone at 84,000, reaching a high of around 84,900. Early this morning, it made a modest pullback. This kind of price action really isn’t surprising at all. In my analysis a few days ago, I projected that the market would need a second push, and this move fits my projection perfectly!A reminder: the first upside target has been reached. Next, we’re looking for a pullback. After breaking above the previous high, the price pulled back, the longs were liquidated, and then we saw a small, choppy correction. After that, the market should make a second push higher and break through 87,000. So for now, we’ll wait for this downward move to finish. If you opened a short near the highs, around 84,500, you could consider taking profits in stages at this point. If you haven’t opened a short, I wouldn’t open one here. It may be better to wait for this move to finish and the price to return to a lower level, then look for key support levels where you can enter a long position. If you open a short at the current level, your stop would be around 85,000, and I think the risk-reward ratio would be a little unfavorable. So the plan is to wait for a pullback, then look to go long at a lower level. Many people are wondering whether the price could fail to break through the key resistance at 84,000, triggering another sustained downward move and a new low. I think that’s unlikely. I’ve marked a descending channel here for you. Could the price retest the channel, break below this range, and create a bear trap? I think that’s also unlikely. Why? Because, in terms of the duration of this correction, I don’t think that scenario is supported. If the correction lasts too long, it will be difficult for the price to rise again. So I also think it’s unlikely that the market will enter a liquidity-dry-up phase here. In terms of both the duration and depth of the pullback, I think things are about where they should be: roughly a month of consolidation, followed by a pullback of around 9%. There is also solid support below this level, and it has been tested and validated repeatedly. Now that the first key resistance has been broken, the question is how far this correction will go. Of course, the path I’ve laid out may not be exactly right. I’ve marked a possible target in the low 82,000s—let’s see whether the price reaches around 82,000. If it does, that would be ideal; we could build long positions at a lower level. Our stop would still be around 80,000, which would mean a smaller stop-loss range. Naturally, we also need to see when this downward move finds a bottom. I think the price may dip a little further today, so if you’re looking to go long, you could wait a bit longer. As for the path ahead, I’m still watching the second resistance level above, at 87,000. After breaking through 87,000, there may be another modest correction, but it should be relatively shallow. I think the next target could be around 93,000, with the price continuing to rise after a pullback—essentially, another move upward of a similar length. This current decline is still part of a consolidation structure. Looking at the daily chart, this is still a flag-shaped correction—a bull flag, or a consolidation structure. Once the correction is over, we’ll need to see whether the new bullish trend continues. Trends tend to rise for only a short time; most of the time, the market is correcting, testing your patience, and moving sideways. So be patient during this process, and don’t lose confidence in what may come next. For now, we’ll firmly hold spot positions for the long term. For short-term trades, we’ll look to go long near the support around 80,000, and take profits when we’re in the green—lock them in! If you follow Du Xun, you won’t need to panic about trading!
Remember This Chart Pattern! Buy the Dips, Buy the Dips
Hello everyone! I’m Du Xun! Yesterday, the market finally showed some movement. It first rose and broke through the initial resistance zone at 84,000, reaching a high of around 84,900. Early this morning, it made a modest pullback. This kind of price action really isn’t surprising at all. In my analysis a few days ago, I projected that the market would need a second push, and this move fits my projection perfectly!A reminder: the first upside target has been reached. Next, we’re looking for a pullback. After breaking above the previous high, the price pulled back, the longs were liquidated, and then we saw a small, choppy correction. After that, the market should make a second push higher and break through 87,000. So for now, we’ll wait for this downward move to finish. If you opened a short near the highs, around 84,500, you could consider taking profits in stages at this point. If you haven’t opened a short, I wouldn’t open one here. It may be better to wait for this move to finish and the price to return to a lower level, then look for key support levels where you can enter a long position. If you open a short at the current level, your stop would be around 85,000, and I think the risk-reward ratio would be a little unfavorable. So the plan is to wait for a pullback, then look to go long at a lower level. Many people are wondering whether the price could fail to break through the key resistance at 84,000, triggering another sustained downward move and a new low. I think that’s unlikely. I’ve marked a descending channel here for you. Could the price retest the channel, break below this range, and create a bear trap? I think that’s also unlikely. Why? Because, in terms of the duration of this correction, I don’t think that scenario is supported. If the correction lasts too long, it will be difficult for the price to rise again. So I also think it’s unlikely that the market will enter a liquidity-dry-up phase here. In terms of both the duration and depth of the pullback, I think things are about where they should be: roughly a month of consolidation, followed by a pullback of around 9%. There is also solid support below this level, and it has been tested and validated repeatedly. Now that the first key resistance has been broken, the question is how far this correction will go. Of course, the path I’ve laid out may not be exactly right. I’ve marked a possible target in the low 82,000s—let’s see whether the price reaches around 82,000. If it does, that would be ideal; we could build long positions at a lower level. Our stop would still be around 80,000, which would mean a smaller stop-loss range. Naturally, we also need to see when this downward move finds a bottom. I think the price may dip a little further today, so if you’re looking to go long, you could wait a bit longer. As for the path ahead, I’m still watching the second resistance level above, at 87,000. After breaking through 87,000, there may be another modest correction, but it should be relatively shallow. I think the next target could be around 93,000, with the price continuing to rise after a pullback—essentially, another move upward of a similar length. This current decline is still part of a consolidation structure. Looking at the daily chart, this is still a flag-shaped correction—a bull flag, or a consolidation structure. Once the correction is over, we’ll need to see whether the new bullish trend continues. Trends tend to rise for only a short time; most of the time, the market is correcting, testing your patience, and moving sideways. So be patient during this process, and don’t lose confidence in what may come next. For now, we’ll firmly hold spot positions for the long term. For short-term trades, we’ll look to go long near the support around 80,000, and take profits when we’re in the green—lock them in! If you follow Du Xun, you won’t need to panic about trading!
150
·
--
Continue shorting crude oil today
Short around 101
Stop loss at 102.5
Take profit at 95.5. Long-term take profit around 87
Manage position size appropriately
Continue shorting crude oil today
Short around 101
Stop loss at 102.5
Take profit at 95.5. Long-term take profit around 87
Manage position size appropriately
Short around 101
Stop loss at 102.5
Take profit at 95.5. Long-term take profit around 87
Manage position size appropriately
2
707
·
--
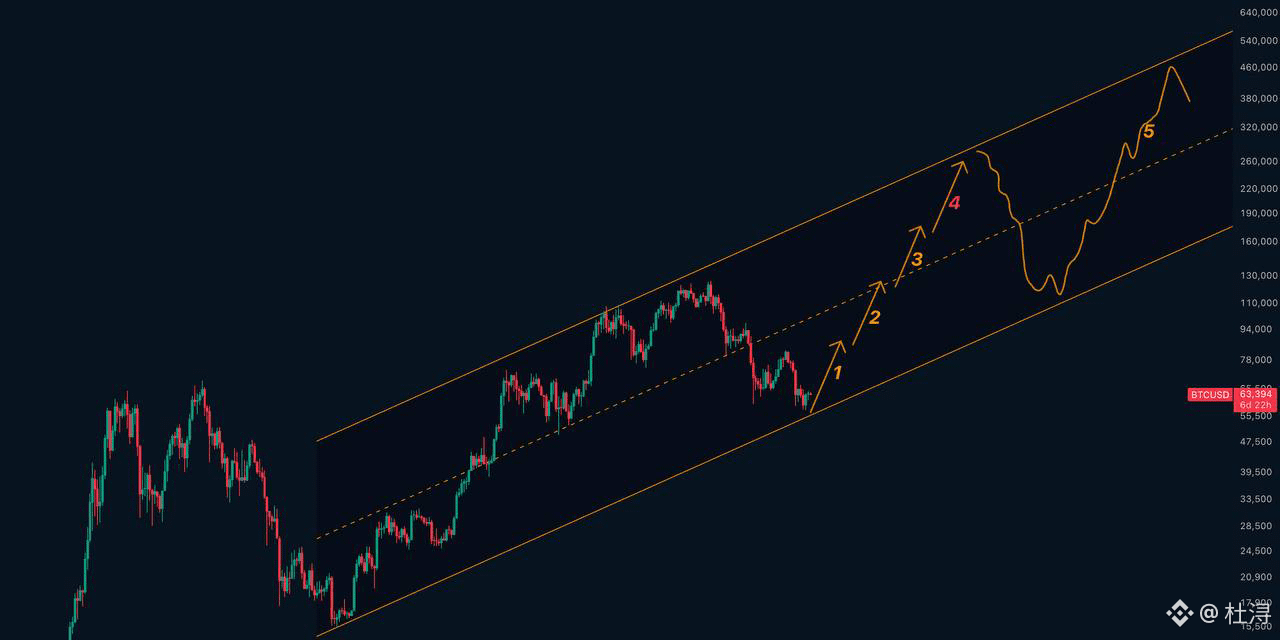
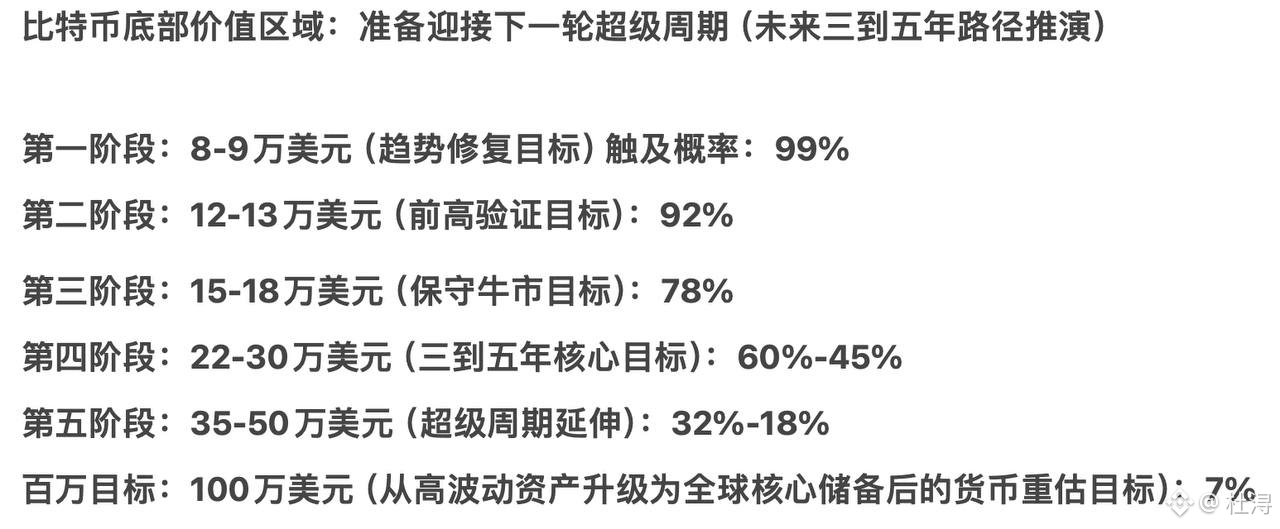
Bitcoin’s first target has been reached. It’s now in the bottoming phase, so a sharp drop is unlikely in the short term. Buying support at $80,000 is strong. Keep buying the dips, with $80,000 as the key support level!
Bitcoin’s first target has been reached. It’s now in the bottoming phase, so a sharp drop is unlikely in the short term. Buying support at $80,000 is strong. Keep buying the dips, with $80,000 as the key support level!
2
816
·
--
Short crude oil near CLU 100.5
Stop loss: 102.1
Take profit: 92
Manage position size responsibly #clu
Short crude oil near CLU 100.5
Stop loss: 102.1
Take profit: 92
Manage position size responsibly #clu
Stop loss: 102.1
Take profit: 92
Manage position size responsibly #clu
410
·
--

Article
This is so tedious—something big is about to happenHello, everyone! I'm Du Xun! The recent market action has been rather dull, with prolonged sideways movement and no new breakout. Yesterday, I publicly called a long position at 82,400, with a take-profit at 86,000 and a stop-loss at 80,300. It is currently showing an unrealized loss. I haven't issued any new trading signals for now, and I'm still holding this long position. I'll let you know as soon as anything changes, so follow Du Xun to get the latest updates! Let's take a look at the charts.
Since reaching a new high of 87,000, Bitcoin has moved sideways and drifted lower. So far, liquidity has been gradually contracting. Over the past few days, I've told you that this correction is quite similar to the previous one: in both cases, the market has moved sideways and down to liquidate long positions, complete the correction, and shift positions at higher levels before beginning a new accelerated rise. Compared with the previous correction, this one has lasted about the same amount of time—roughly a month—and the pullback has also been similar, at around 9%. I think the current level is close to the end of the correction, so the market will soon choose a new direction. The key resistance is currently at 84,000, while the main support below is at 80,000. As for our directional bias, we still favor going long. In the support zone below, price has retraced between 0.5 and 0.618 of the preceding rise. As long as this zone holds, we can look to enter long positions near the lows, using the support zone as a reference. The key defensive level is the round-number mark of 80,000. I believe that as long as the support zone holds, we should favor longs while leaning on that support. The main trend remains bullish on the monthly, weekly, and daily charts. On the hourly chart, this kind of sideways-to-down movement is essentially clearing out long positions. Once the correction is over, a new period of accelerated gains should follow. I think the next rally could reach a new high in two legs: a rise, a pullback, and then another rise, taking price above 87,000. There are two resistance levels to overcome: the first at 84,000 and the second at 87,000. So, a breakout to a new high may take two upward moves. However, within the support zone below, I still think it is worth building a medium- to long-term long position. That's my view of the market. This dull action may be a sign that a storm is coming. Let's stay protected and wait patiently!
This is so tedious—something big is about to happen
Hello, everyone! I'm Du Xun! The recent market action has been rather dull, with prolonged sideways movement and no new breakout. Yesterday, I publicly called a long position at 82,400, with a take-profit at 86,000 and a stop-loss at 80,300. It is currently showing an unrealized loss. I haven't issued any new trading signals for now, and I'm still holding this long position. I'll let you know as soon as anything changes, so follow Du Xun to get the latest updates! Let's take a look at the charts.
Since reaching a new high of 87,000, Bitcoin has moved sideways and drifted lower. So far, liquidity has been gradually contracting. Over the past few days, I've told you that this correction is quite similar to the previous one: in both cases, the market has moved sideways and down to liquidate long positions, complete the correction, and shift positions at higher levels before beginning a new accelerated rise. Compared with the previous correction, this one has lasted about the same amount of time—roughly a month—and the pullback has also been similar, at around 9%. I think the current level is close to the end of the correction, so the market will soon choose a new direction. The key resistance is currently at 84,000, while the main support below is at 80,000. As for our directional bias, we still favor going long. In the support zone below, price has retraced between 0.5 and 0.618 of the preceding rise. As long as this zone holds, we can look to enter long positions near the lows, using the support zone as a reference. The key defensive level is the round-number mark of 80,000. I believe that as long as the support zone holds, we should favor longs while leaning on that support. The main trend remains bullish on the monthly, weekly, and daily charts. On the hourly chart, this kind of sideways-to-down movement is essentially clearing out long positions. Once the correction is over, a new period of accelerated gains should follow. I think the next rally could reach a new high in two legs: a rise, a pullback, and then another rise, taking price above 87,000. There are two resistance levels to overcome: the first at 84,000 and the second at 87,000. So, a breakout to a new high may take two upward moves. However, within the support zone below, I still think it is worth building a medium- to long-term long position. That's my view of the market. This dull action may be a sign that a storm is coming. Let's stay protected and wait patiently!
Since reaching a new high of 87,000, Bitcoin has moved sideways and drifted lower. So far, liquidity has been gradually contracting. Over the past few days, I've told you that this correction is quite similar to the previous one: in both cases, the market has moved sideways and down to liquidate long positions, complete the correction, and shift positions at higher levels before beginning a new accelerated rise. Compared with the previous correction, this one has lasted about the same amount of time—roughly a month—and the pullback has also been similar, at around 9%. I think the current level is close to the end of the correction, so the market will soon choose a new direction. The key resistance is currently at 84,000, while the main support below is at 80,000. As for our directional bias, we still favor going long. In the support zone below, price has retraced between 0.5 and 0.618 of the preceding rise. As long as this zone holds, we can look to enter long positions near the lows, using the support zone as a reference. The key defensive level is the round-number mark of 80,000. I believe that as long as the support zone holds, we should favor longs while leaning on that support. The main trend remains bullish on the monthly, weekly, and daily charts. On the hourly chart, this kind of sideways-to-down movement is essentially clearing out long positions. Once the correction is over, a new period of accelerated gains should follow. I think the next rally could reach a new high in two legs: a rise, a pullback, and then another rise, taking price above 87,000. There are two resistance levels to overcome: the first at 84,000 and the second at 87,000. So, a breakout to a new high may take two upward moves. However, within the support zone below, I still think it is worth building a medium- to long-term long position. That's my view of the market. This dull action may be a sign that a storm is coming. Let's stay protected and wait patiently!
87
·
--
Go long on Bitcoin around the current price of 82,400
Stop-loss: 80,300
Take-profit: 86,000
Bonus strategy—allocate your funds wisely!
Go long on Bitcoin around the current price of 82,400
Stop-loss: 80,300
Take-profit: 86,000
Bonus strategy—allocate your funds wisely!
Stop-loss: 80,300
Take-profit: 86,000
Bonus strategy—allocate your funds wisely!
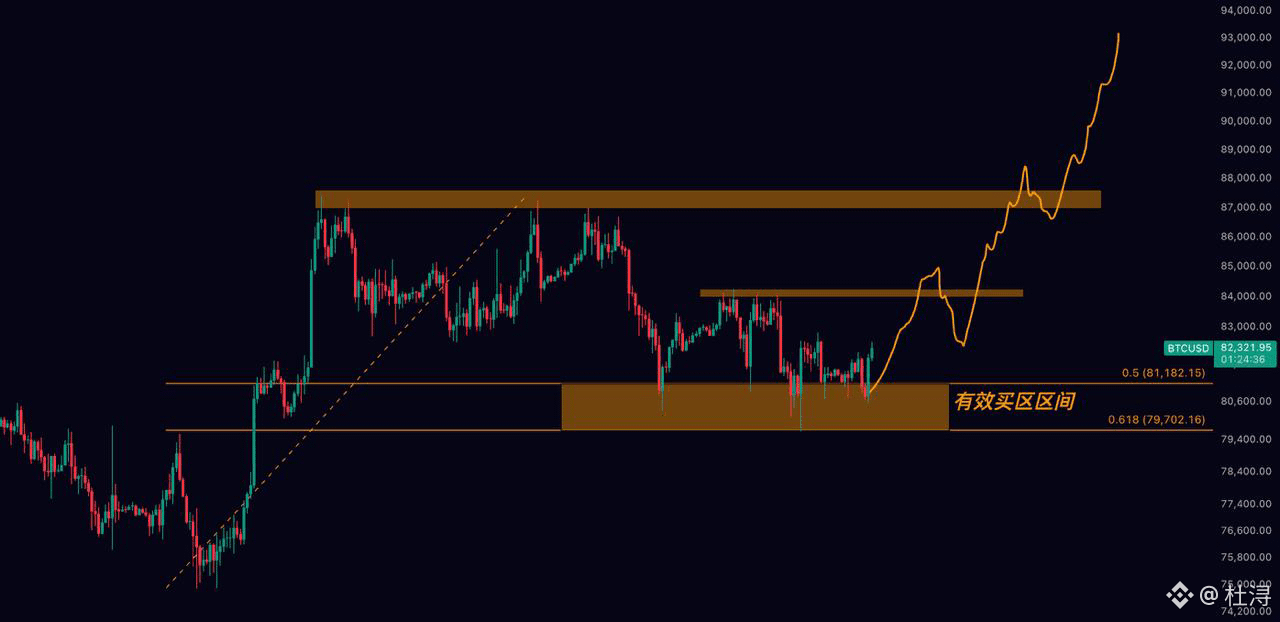
165
·
--

Article
Buy spot at $80,000, target $130,000Hello, everyone! I’m Du Xun! Yesterday, Bitcoin fell below the key $80,000 level, and many people started turning bearish. Let’s first look at how the market carried out a massive liquidation sweep against the bulls over the past two days. BTC was around $80,000 and ETH around $2,320, wiping out a large number of big holders and whales. The short-term objective was achieved. The market is very fair: last night’s sharp rally quickly moved prices away from the largest, most concentrated liquidation zones, then went on to liquidate the shorts.
Now let’s look at the latest news. The biggest factor affecting Bitcoin recently is actually the U.S. midterm elections—not the current high-interest-rate environment, the possibility of further rate hikes, or the impact of future rate hikes on Bitcoin. I don’t think those factors are having that much of an effect.
Buy spot at $80,000, target $130,000
Hello, everyone! I’m Du Xun! Yesterday, Bitcoin fell below the key $80,000 level, and many people started turning bearish. Let’s first look at how the market carried out a massive liquidation sweep against the bulls over the past two days. BTC was around $80,000 and ETH around $2,320, wiping out a large number of big holders and whales. The short-term objective was achieved. The market is very fair: last night’s sharp rally quickly moved prices away from the largest, most concentrated liquidation zones, then went on to liquidate the shorts.
Now let’s look at the latest news. The biggest factor affecting Bitcoin recently is actually the U.S. midterm elections—not the current high-interest-rate environment, the possibility of further rate hikes, or the impact of future rate hikes on Bitcoin. I don’t think those factors are having that much of an effect.
Now let’s look at the latest news. The biggest factor affecting Bitcoin recently is actually the U.S. midterm elections—not the current high-interest-rate environment, the possibility of further rate hikes, or the impact of future rate hikes on Bitcoin. I don’t think those factors are having that much of an effect.
272
·
--

Article
Crisis and opportunity go hand in hand: both bulls and bears have a chance—how should you trade?Hi everyone, I’m Du Xun! CPI was released last night and the market plunged. This morning, Bitcoin fell as low as 80,188! With a key round-number level approaching but not yet broken, here’s my trading plan: go long around 80,650, with a stop-loss at 80,000. For now, look to take profit around 84,000. I won’t Monday-morning quarterback—I’ll get straight to my reasoning!The 84,000 level has been tested several times in the past, but price never managed to break through. So for now, it remains a valid resistance zone above. However, the pullback from this recent rally has reached a key support zone below: the 0.5–0.618 retracement area, around 79,700–81,000. This is also currently a valid support zone. So as long as price holds above this support zone and doesn’t break below the previous swing low, I think the best approach for now is still to look for buying opportunities on dips. In the short term, the previous horizontal high is around 84,000, making that the bulls’ near-term target. Once price reaches that level, the next medium-term target is the horizontal resistance above 87,000.
Crisis and opportunity go hand in hand: both bulls and bears have a chance—how should you trade?
Hi everyone, I’m Du Xun! CPI was released last night and the market plunged. This morning, Bitcoin fell as low as 80,188! With a key round-number level approaching but not yet broken, here’s my trading plan: go long around 80,650, with a stop-loss at 80,000. For now, look to take profit around 84,000. I won’t Monday-morning quarterback—I’ll get straight to my reasoning!The 84,000 level has been tested several times in the past, but price never managed to break through. So for now, it remains a valid resistance zone above. However, the pullback from this recent rally has reached a key support zone below: the 0.5–0.618 retracement area, around 79,700–81,000. This is also currently a valid support zone. So as long as price holds above this support zone and doesn’t break below the previous swing low, I think the best approach for now is still to look for buying opportunities on dips. In the short term, the previous horizontal high is around 84,000, making that the bulls’ near-term target. Once price reaches that level, the next medium-term target is the horizontal resistance above 87,000.
281
Log in to explore more content
Join global crypto users on Binance Square
⚡️ Get latest and useful information about crypto.
💬 Trusted by the world’s largest crypto exchange.
👍 Discover real insights from verified creators.
Email / Phone number
Trending Topics
FedWatch
16.2M views
38,705 Discussing
🚨 BREAKING: THE US ECONOMY JUST BEAT ON EVERYTHING. THAT IS THE WORST NEWS FOR YOUR PORTFOLIO.
GDP Q3: 3.4% vs 3.2% expected. Previous: 2.2%
Jobless claims: 194K vs 199K expected. Previous: 194K
PCE inflation: 3.6%, as expected. Previous: 3.4%
Strong growth. Almost no layoffs. Inflation going UP, not down. The Fed has zero reason to stop, and a December hike is priced near 80%.
In this market, good news for the economy is bad news for stocks and crypto. PCE in line is not a relief, it is 0.2 points higher than last month.
Rate cut hopes are dead. Stay alert.
12 years in these markets. This is what I do.
Follow me and turn notifications on.
#FedWatch
#EarningsSeason
#Nasdaq100FuturesFall0.9%
$BTC
$SOL
$SUI
MARKET STRUCTURE GUIDE
·4 Likes
·1k views
EarningsSeason
6.3M views
31,450 Discussing
USMidtermElections
9,172 views
292 Discussing