Hello everyone! I’m Du Xun! Yesterday, the market finally showed some movement. It first rose and broke through the initial resistance zone at 84,000, reaching a high of around 84,900. Early this morning, it made a modest pullback. This kind of price action really isn’t surprising at all. In my analysis a few days ago, I projected that the market would need a second push, and this move fits my projection perfectly!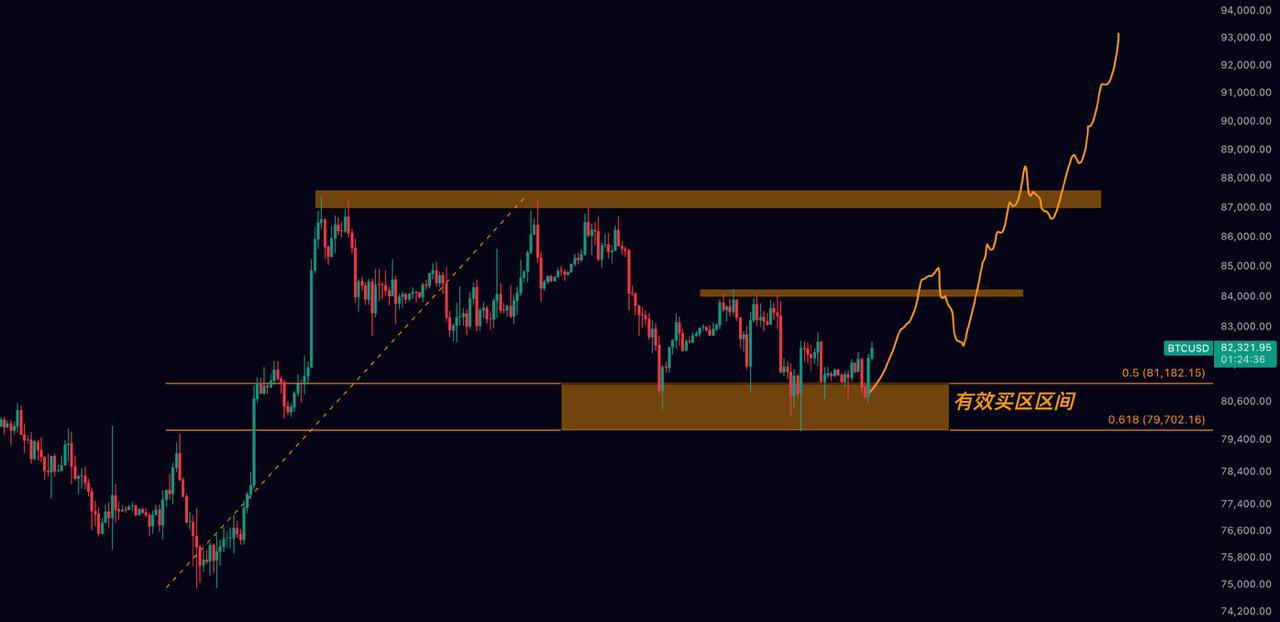 A reminder: the first upside target has been reached. Next, we’re looking for a pullback. After breaking above the previous high, the price pulled back, the longs were liquidated, and then we saw a small, choppy correction. After that, the market should make a second push higher and break through 87,000. So for now, we’ll wait for this downward move to finish. If you opened a short near the highs, around 84,500, you could consider taking profits in stages at this point. If you haven’t opened a short, I wouldn’t open one here. It may be better to wait for this move to finish and the price to return to a lower level, then look for key support levels where you can enter a long position. If you open a short at the current level, your stop would be around 85,000, and I think the risk-reward ratio would be a little unfavorable. So the plan is to wait for a pullback, then look to go long at a lower level. Many people are wondering whether the price could fail to break through the key resistance at 84,000, triggering another sustained downward move and a new low. I think that’s unlikely. I’ve marked a descending channel here for you. Could the price retest the channel, break below this range, and create a bear trap? I think that’s also unlikely. Why? Because, in terms of the duration of this correction, I don’t think that scenario is supported. If the correction lasts too long, it will be difficult for the price to rise again. So I also think it’s unlikely that the market will enter a liquidity-dry-up phase here. In terms of both the duration and depth of the pullback, I think things are about where they should be: roughly a month of consolidation, followed by a pullback of around 9%. There is also solid support below this level, and it has been tested and validated repeatedly. Now that the first key resistance has been broken, the question is how far this correction will go. Of course, the path I’ve laid out may not be exactly right. I’ve marked a possible target in the low 82,000s—let’s see whether the price reaches around 82,000. If it does, that would be ideal; we could build long positions at a lower level. Our stop would still be around 80,000, which would mean a smaller stop-loss range. Naturally, we also need to see when this downward move finds a bottom. I think the price may dip a little further today, so if you’re looking to go long, you could wait a bit longer. As for the path ahead, I’m still watching the second resistance level above, at 87,000. After breaking through 87,000, there may be another modest correction, but it should be relatively shallow. I think the next target could be around 93,000, with the price continuing to rise after a pullback—essentially, another move upward of a similar length. This current decline is still part of a consolidation structure. Looking at the daily chart, this is still a flag-shaped correction—a bull flag, or a consolidation structure. Once the correction is over, we’ll need to see whether the new bullish trend continues. Trends tend to rise for only a short time; most of the time, the market is correcting, testing your patience, and moving sideways. So be patient during this process, and don’t lose confidence in what may come next. For now, we’ll firmly hold spot positions for the long term. For short-term trades, we’ll look to go long near the support around 80,000, and take profits when we’re in the green—lock them in! If you follow Du Xun, you won’t need to panic about trading!


Article
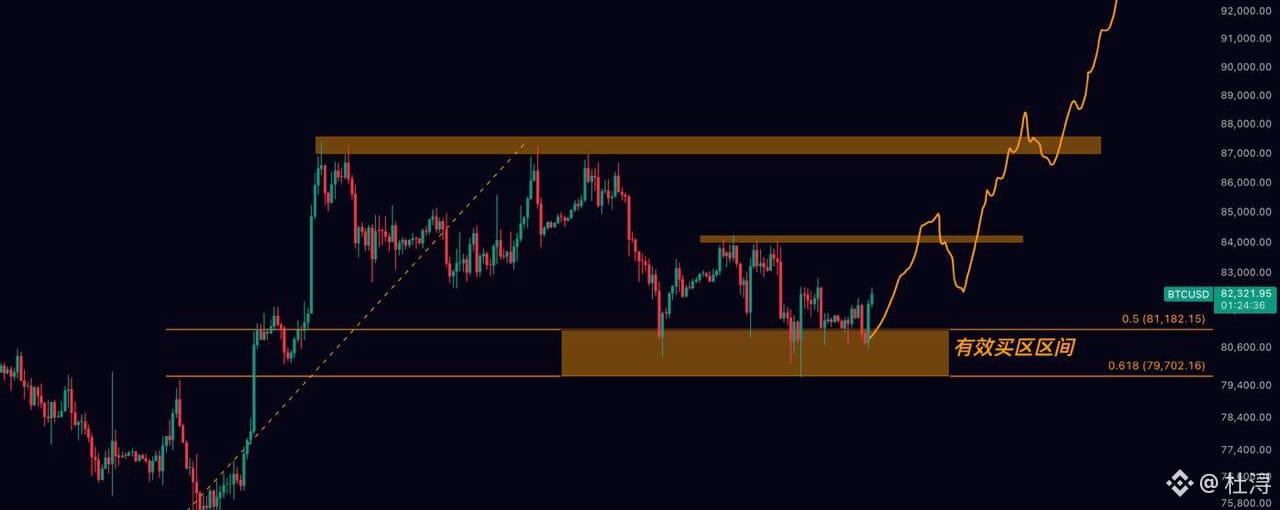
Remember This Chart Pattern! Buy the Dips, Buy the Dips

--