
元规律网络
198 Posts

元规律网络
Report
Block User
11 Following
211 Followers
496 Liked
Posts
All
Quotes
·
--
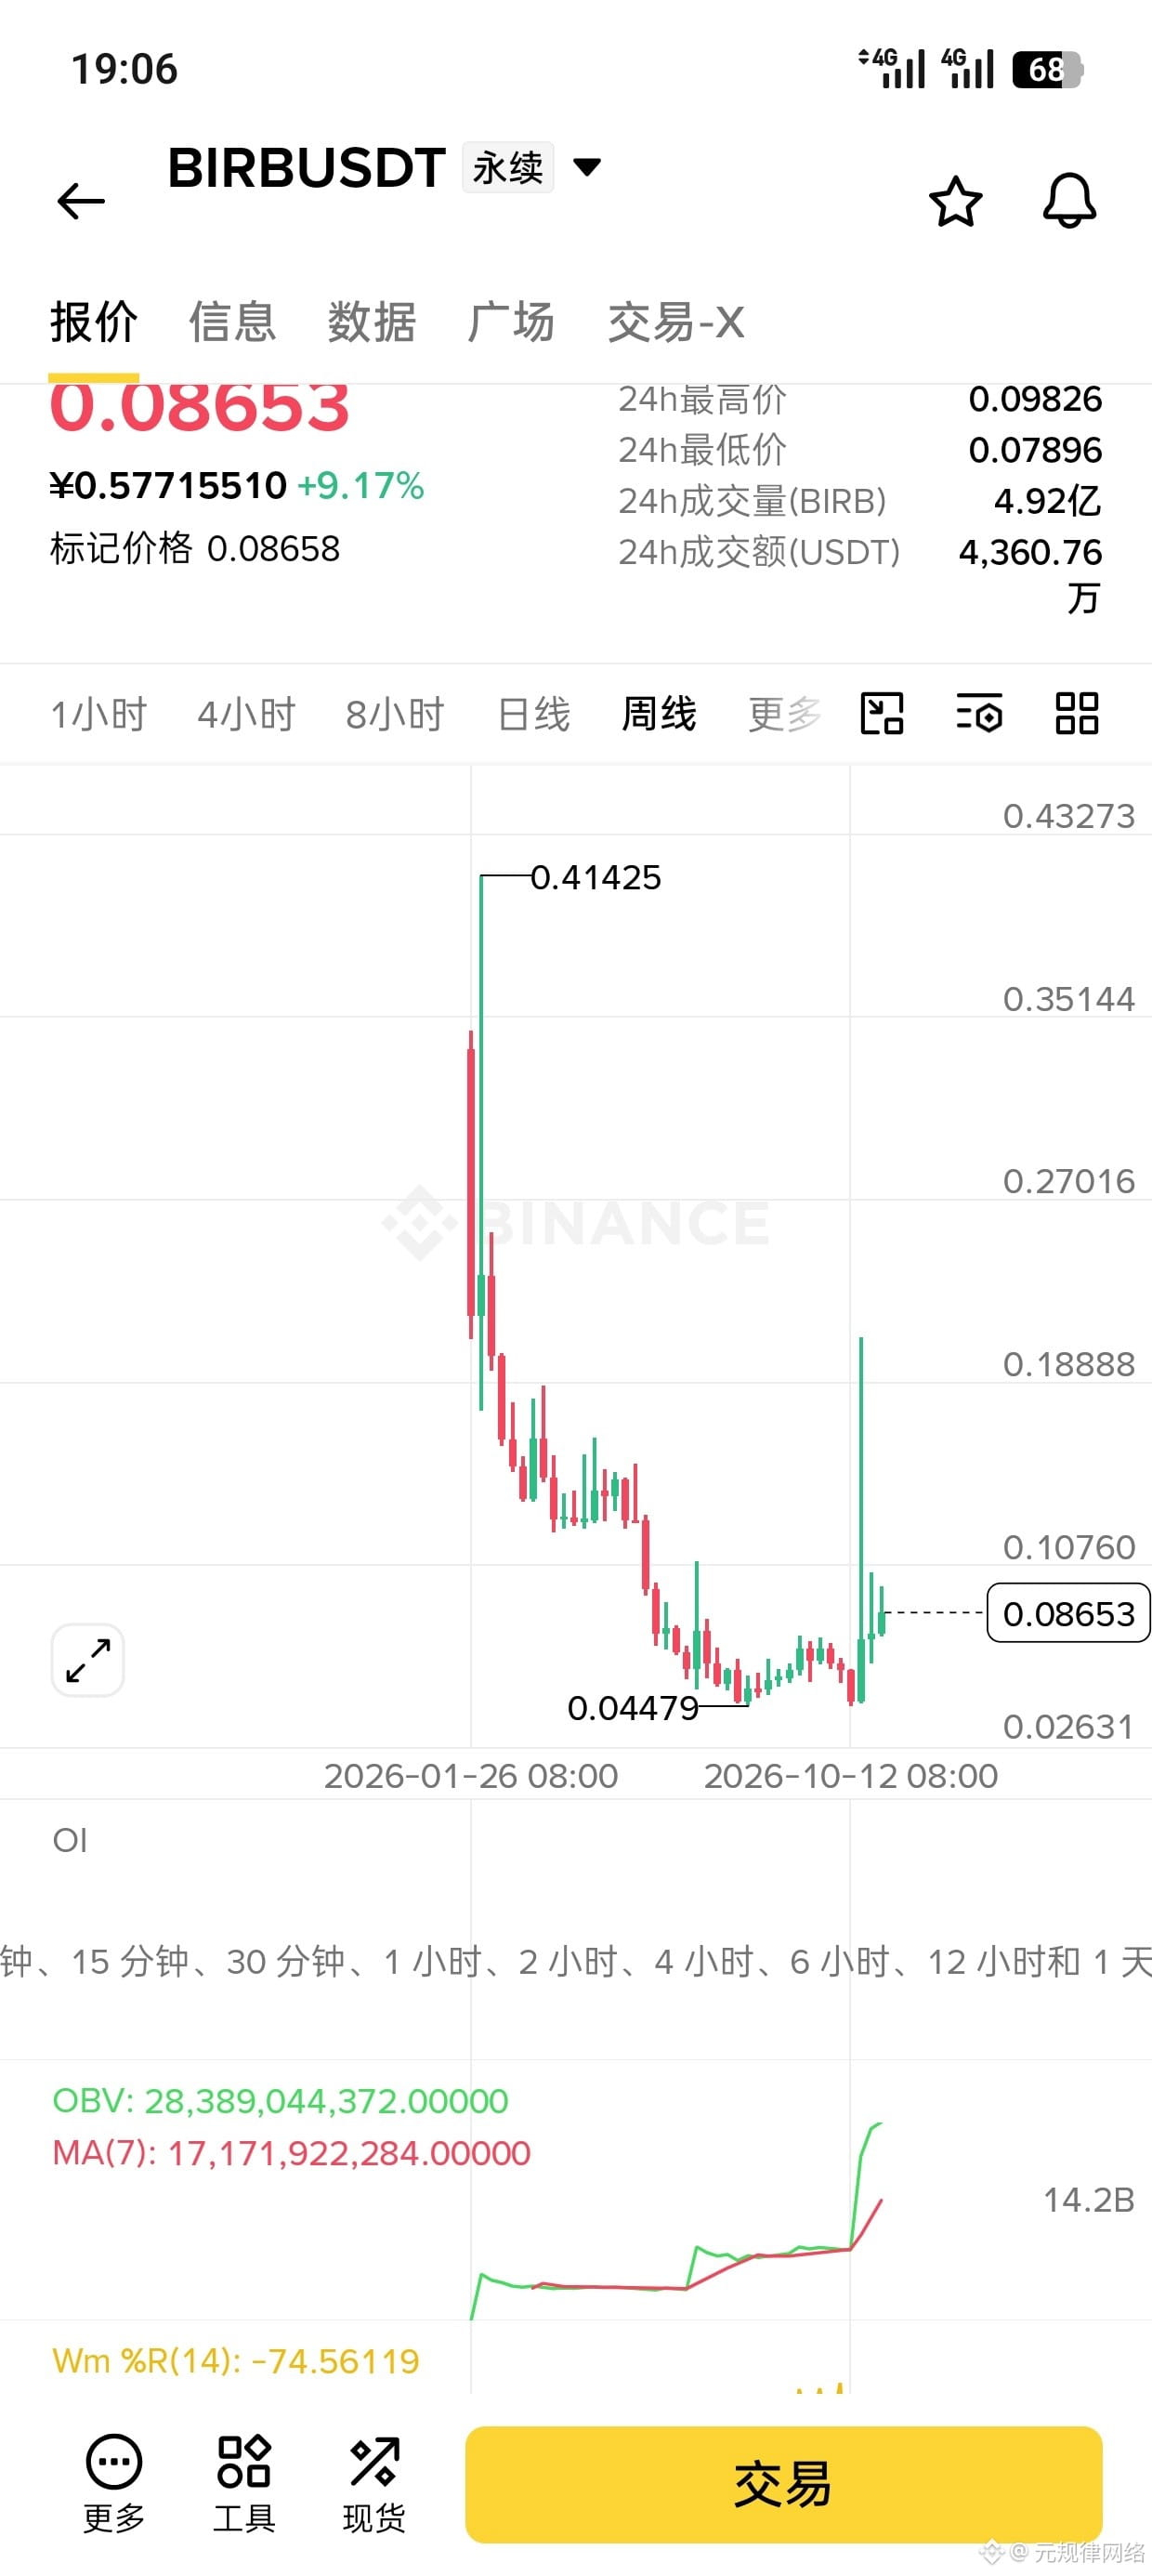
$BIRB 😡 Ridiculous! It plunged from 0.41 to 0.044, wiping out 90%, and now it’s risen from the dead and doubled—BIRB, this is a performance, not a reversal.
Let’s do the math first:
Open interest is 39.4M, with 24h trading volume of 43.6 million U—the circulating supply has been hammered down to a tiny fraction. A market this small needs no reason to pump, and even less of a reason to dump.
What’s the history of this coin? You’ll want to swear after seeing it:
① It slid all the way from 0.414 to 0.0447, down nearly 90%—every bounce along the way was a chance to escape, and anyone who went long got buried;
② In late October, it suddenly surged violently: from 0.045 straight to 0.2089, more than a 4x gain—with no news, just a sudden rush of money;
③ The very day it hit 0.2089, it started bleeding: falling back to 0.0865 and giving up more than half its gains—the harder it pumped, the harder it dumped;
④ A daily range of 22.93%—this kind of volatility isn’t here to make you money; it’s here to send you packing.
Three major red flags on the chart:
① The flagpole from the 90% plunge has yet to recover, and everything above 0.10 is a historical bagholder zone;
② After the rebound peak at 0.2089, it closed lower for several sessions in a row, with each high lower than the last—upward momentum is clearly fading;
③ OBV is still above its moving average, but the price has already fallen back near where the rally began—volume is still hanging around, but the price has already run off. Classic fake-out.
Let’s focus on this “4x up, then cut in half” move:
A corpse that fell 90% suddenly doubles, then drops 58% from its high—that’s not a market trend; it’s a roller coaster without seat belts. If the market makers really wanted to establish a trend, they wouldn’t pump it and immediately dump it halfway back down. Every bounce now is just looking for the next person to take the bags bought above 0.2.
Trading parameters:
Short entry zone: 0.098–0.108 (enter on a rebound; don’t chase the current price)
Stop-loss: 0.118
Targets: 0.078 → 0.068 → 0.058
Risk/reward ratio: about 1:2.4—acceptable
Invalidation level: if it holds above 0.118 on heavy volume, the setup is invalidated
Long side: completely off-limits. Down 90%+, doubled and then halved again, with a 22% daily range—buying the dip is like standing on a roller coaster track to pick up a coin.
In a nutshell: this bird of a coin crashed from 0.41 to 0.045, broke its bones, and still thinks it can fly—the rebound to 0.098–0.108 is its last flutter.
(Not investment advice. Futures trading involves risk.)
$BIRB 😡 Ridiculous! It plunged from 0.41 to 0.044, wiping out 90%, and now it’s risen from the dead and doubled—BIRB, this is a performance, not a reversal.
Let’s do the math first:
Open interest is 39.4M, with 24h trading volume of 43.6 million U—the circulating supply has been hammered down to a tiny fraction. A market this small needs no reason to pump, and even less of a reason to dump.
What’s the history of this coin? You’ll want to swear after seeing it:
① It slid all the way from 0.414 to 0.0447, down nearly 90%—every bounce along the way was a chance to escape, and anyone who went long got buried;
② In late October, it suddenly surged violently: from 0.045 straight to 0.2089, more than a 4x gain—with no news, just a sudden rush of money;
③ The very day it hit 0.2089, it started bleeding: falling back to 0.0865 and giving up more than half its gains—the harder it pumped, the harder it dumped;
④ A daily range of 22.93%—this kind of volatility isn’t here to make you money; it’s here to send you packing.
Three major red flags on the chart:
① The flagpole from the 90% plunge has yet to recover, and everything above 0.10 is a historical bagholder zone;
② After the rebound peak at 0.2089, it closed lower for several sessions in a row, with each high lower than the last—upward momentum is clearly fading;
③ OBV is still above its moving average, but the price has already fallen back near where the rally began—volume is still hanging around, but the price has already run off. Classic fake-out.
Let’s focus on this “4x up, then cut in half” move:
A corpse that fell 90% suddenly doubles, then drops 58% from its high—that’s not a market trend; it’s a roller coaster without seat belts. If the market makers really wanted to establish a trend, they wouldn’t pump it and immediately dump it halfway back down. Every bounce now is just looking for the next person to take the bags bought above 0.2.
Trading parameters:
Short entry zone: 0.098–0.108 (enter on a rebound; don’t chase the current price)
Stop-loss: 0.118
Targets: 0.078 → 0.068 → 0.058
Risk/reward ratio: about 1:2.4—acceptable
Invalidation level: if it holds above 0.118 on heavy volume, the setup is invalidated
Long side: completely off-limits. Down 90%+, doubled and then halved again, with a 22% daily range—buying the dip is like standing on a roller coaster track to pick up a coin.
In a nutshell: this bird of a coin crashed from 0.41 to 0.045, broke its bones, and still thinks it can fly—the rebound to 0.098–0.108 is its last flutter.
(Not investment advice. Futures trading involves risk.)
Let’s do the math first:
Open interest is 39.4M, with 24h trading volume of 43.6 million U—the circulating supply has been hammered down to a tiny fraction. A market this small needs no reason to pump, and even less of a reason to dump.
What’s the history of this coin? You’ll want to swear after seeing it:
① It slid all the way from 0.414 to 0.0447, down nearly 90%—every bounce along the way was a chance to escape, and anyone who went long got buried;
② In late October, it suddenly surged violently: from 0.045 straight to 0.2089, more than a 4x gain—with no news, just a sudden rush of money;
③ The very day it hit 0.2089, it started bleeding: falling back to 0.0865 and giving up more than half its gains—the harder it pumped, the harder it dumped;
④ A daily range of 22.93%—this kind of volatility isn’t here to make you money; it’s here to send you packing.
Three major red flags on the chart:
① The flagpole from the 90% plunge has yet to recover, and everything above 0.10 is a historical bagholder zone;
② After the rebound peak at 0.2089, it closed lower for several sessions in a row, with each high lower than the last—upward momentum is clearly fading;
③ OBV is still above its moving average, but the price has already fallen back near where the rally began—volume is still hanging around, but the price has already run off. Classic fake-out.
Let’s focus on this “4x up, then cut in half” move:
A corpse that fell 90% suddenly doubles, then drops 58% from its high—that’s not a market trend; it’s a roller coaster without seat belts. If the market makers really wanted to establish a trend, they wouldn’t pump it and immediately dump it halfway back down. Every bounce now is just looking for the next person to take the bags bought above 0.2.
Trading parameters:
Short entry zone: 0.098–0.108 (enter on a rebound; don’t chase the current price)
Stop-loss: 0.118
Targets: 0.078 → 0.068 → 0.058
Risk/reward ratio: about 1:2.4—acceptable
Invalidation level: if it holds above 0.118 on heavy volume, the setup is invalidated
Long side: completely off-limits. Down 90%+, doubled and then halved again, with a 22% daily range—buying the dip is like standing on a roller coaster track to pick up a coin.
In a nutshell: this bird of a coin crashed from 0.41 to 0.045, broke its bones, and still thinks it can fly—the rebound to 0.098–0.108 is its last flutter.
(Not investment advice. Futures trading involves risk.)
122
·
--
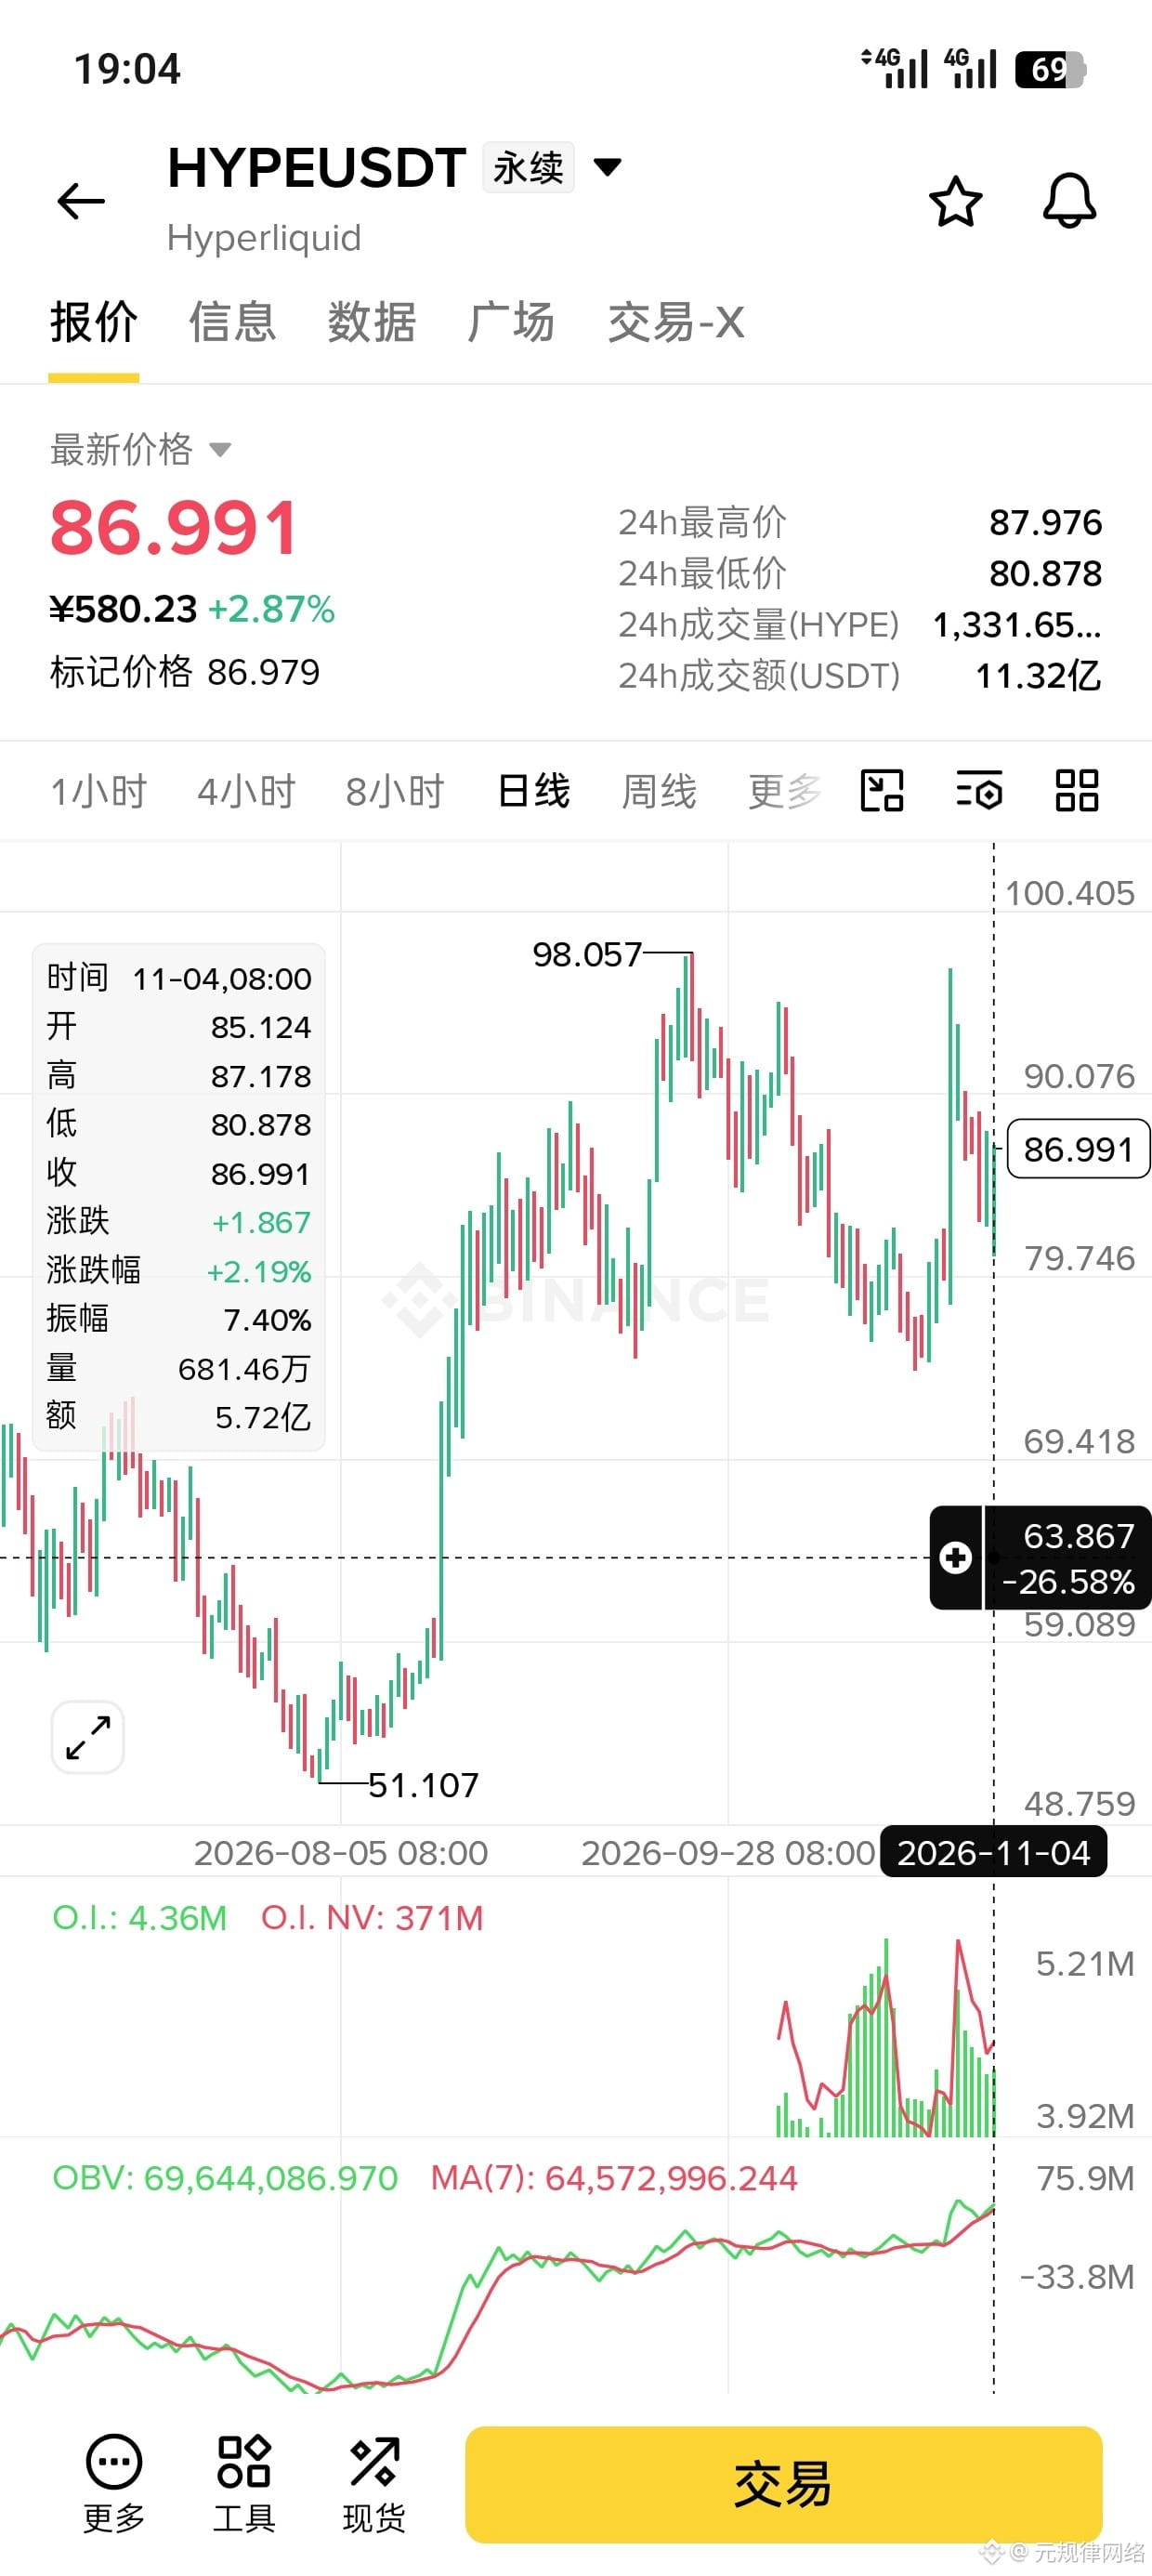
$HYPE 😄 Nice! The big bull coin that surged from 20 to 98 has pulled back—HYPE, this is the market makers sending you a welcome-aboard bonus
Let's run the numbers first:
Open interest: 4.36M; notional value: 371M; 24h trading volume: 1.132 billion U—a market with real money behind it, not some tiny coin where market makers draw wicks. Its price action has a logic to it.
What's behind this market? The more you look, the better it gets:
① The weekly chart climbed from 20.475 all the way to 98.057, nearly a 5x gain—this is a coin in an uptrend, not a corpse that has suddenly twitched back to life;
② Since rebounding from the daily low of 51, it's been bought back every time it pulls back—there are buyers lined up below to catch it;
③ OBV has stayed above its moving average and continued climbing, with money flowing steadily in—the big players haven't left; the pullback is just shaking people out;
④ At the current price of 86.99, there's still plenty of room to the previous high of 98.
Three key highlights on the chart:
① The uptrend is intact, with higher lows: 51→59→80.8. Every retest has formed another step up;
② The 24h low of 80.878 sits right at the upper edge of the previous range—this is the bulls' line of defense;
③ This pullback has been a low-volume, gradual drift down, with no panic selling—it's not distribution; they're waiting for people to get off.
Let's focus on this “pullback”:
A pullback in a bull coin is a gift; a rebound in a junk coin is a trap—what's the difference? A bull coin finds buyers on pullbacks, its money flow stays healthy, and its trend holds. HYPE checks all three boxes. This is the shakeout phase: flushing out those who chased the highs in August and those who lost patience in November, before pushing toward 98.
Trade parameters:
Long entry zone: 80.8~83 (enter on a retest; don't chase the current price)
Stop-loss: 76.5
Targets: 92→previous high at 98→105 if it breaks through
Risk/reward ratio: about 1:2.3—acceptable
Invalidation level: if the daily candle closes below 76.5, the trend thesis is invalidated
Short side: strictly off-limits. A 5x trend + rising money flow + a low-volume pullback—shorting against the trend is like picking up a coin in front of a high-speed train.
In one sentence: Be greedy when others are fearful—the flag at 98 is already planted, and 80.8~83 is the ticket price. Don't wait until it takes off to kick yourself.
(Not investment advice. Futures trading involves risk.)
$HYPE 😄 Nice! The big bull coin that surged from 20 to 98 has pulled back—HYPE, this is the market makers sending you a welcome-aboard bonus
Let's run the numbers first:
Open interest: 4.36M; notional value: 371M; 24h trading volume: 1.132 billion U—a market with real money behind it, not some tiny coin where market makers draw wicks. Its price action has a logic to it.
What's behind this market? The more you look, the better it gets:
① The weekly chart climbed from 20.475 all the way to 98.057, nearly a 5x gain—this is a coin in an uptrend, not a corpse that has suddenly twitched back to life;
② Since rebounding from the daily low of 51, it's been bought back every time it pulls back—there are buyers lined up below to catch it;
③ OBV has stayed above its moving average and continued climbing, with money flowing steadily in—the big players haven't left; the pullback is just shaking people out;
④ At the current price of 86.99, there's still plenty of room to the previous high of 98.
Three key highlights on the chart:
① The uptrend is intact, with higher lows: 51→59→80.8. Every retest has formed another step up;
② The 24h low of 80.878 sits right at the upper edge of the previous range—this is the bulls' line of defense;
③ This pullback has been a low-volume, gradual drift down, with no panic selling—it's not distribution; they're waiting for people to get off.
Let's focus on this “pullback”:
A pullback in a bull coin is a gift; a rebound in a junk coin is a trap—what's the difference? A bull coin finds buyers on pullbacks, its money flow stays healthy, and its trend holds. HYPE checks all three boxes. This is the shakeout phase: flushing out those who chased the highs in August and those who lost patience in November, before pushing toward 98.
Trade parameters:
Long entry zone: 80.8~83 (enter on a retest; don't chase the current price)
Stop-loss: 76.5
Targets: 92→previous high at 98→105 if it breaks through
Risk/reward ratio: about 1:2.3—acceptable
Invalidation level: if the daily candle closes below 76.5, the trend thesis is invalidated
Short side: strictly off-limits. A 5x trend + rising money flow + a low-volume pullback—shorting against the trend is like picking up a coin in front of a high-speed train.
In one sentence: Be greedy when others are fearful—the flag at 98 is already planted, and 80.8~83 is the ticket price. Don't wait until it takes off to kick yourself.
(Not investment advice. Futures trading involves risk.)
Let's run the numbers first:
Open interest: 4.36M; notional value: 371M; 24h trading volume: 1.132 billion U—a market with real money behind it, not some tiny coin where market makers draw wicks. Its price action has a logic to it.
What's behind this market? The more you look, the better it gets:
① The weekly chart climbed from 20.475 all the way to 98.057, nearly a 5x gain—this is a coin in an uptrend, not a corpse that has suddenly twitched back to life;
② Since rebounding from the daily low of 51, it's been bought back every time it pulls back—there are buyers lined up below to catch it;
③ OBV has stayed above its moving average and continued climbing, with money flowing steadily in—the big players haven't left; the pullback is just shaking people out;
④ At the current price of 86.99, there's still plenty of room to the previous high of 98.
Three key highlights on the chart:
① The uptrend is intact, with higher lows: 51→59→80.8. Every retest has formed another step up;
② The 24h low of 80.878 sits right at the upper edge of the previous range—this is the bulls' line of defense;
③ This pullback has been a low-volume, gradual drift down, with no panic selling—it's not distribution; they're waiting for people to get off.
Let's focus on this “pullback”:
A pullback in a bull coin is a gift; a rebound in a junk coin is a trap—what's the difference? A bull coin finds buyers on pullbacks, its money flow stays healthy, and its trend holds. HYPE checks all three boxes. This is the shakeout phase: flushing out those who chased the highs in August and those who lost patience in November, before pushing toward 98.
Trade parameters:
Long entry zone: 80.8~83 (enter on a retest; don't chase the current price)
Stop-loss: 76.5
Targets: 92→previous high at 98→105 if it breaks through
Risk/reward ratio: about 1:2.3—acceptable
Invalidation level: if the daily candle closes below 76.5, the trend thesis is invalidated
Short side: strictly off-limits. A 5x trend + rising money flow + a low-volume pullback—shorting against the trend is like picking up a coin in front of a high-speed train.
In one sentence: Be greedy when others are fearful—the flag at 98 is already planted, and 80.8~83 is the ticket price. Don't wait until it takes off to kick yourself.
(Not investment advice. Futures trading involves risk.)
2
172
·
--
$EVAA EVAA Verdict:
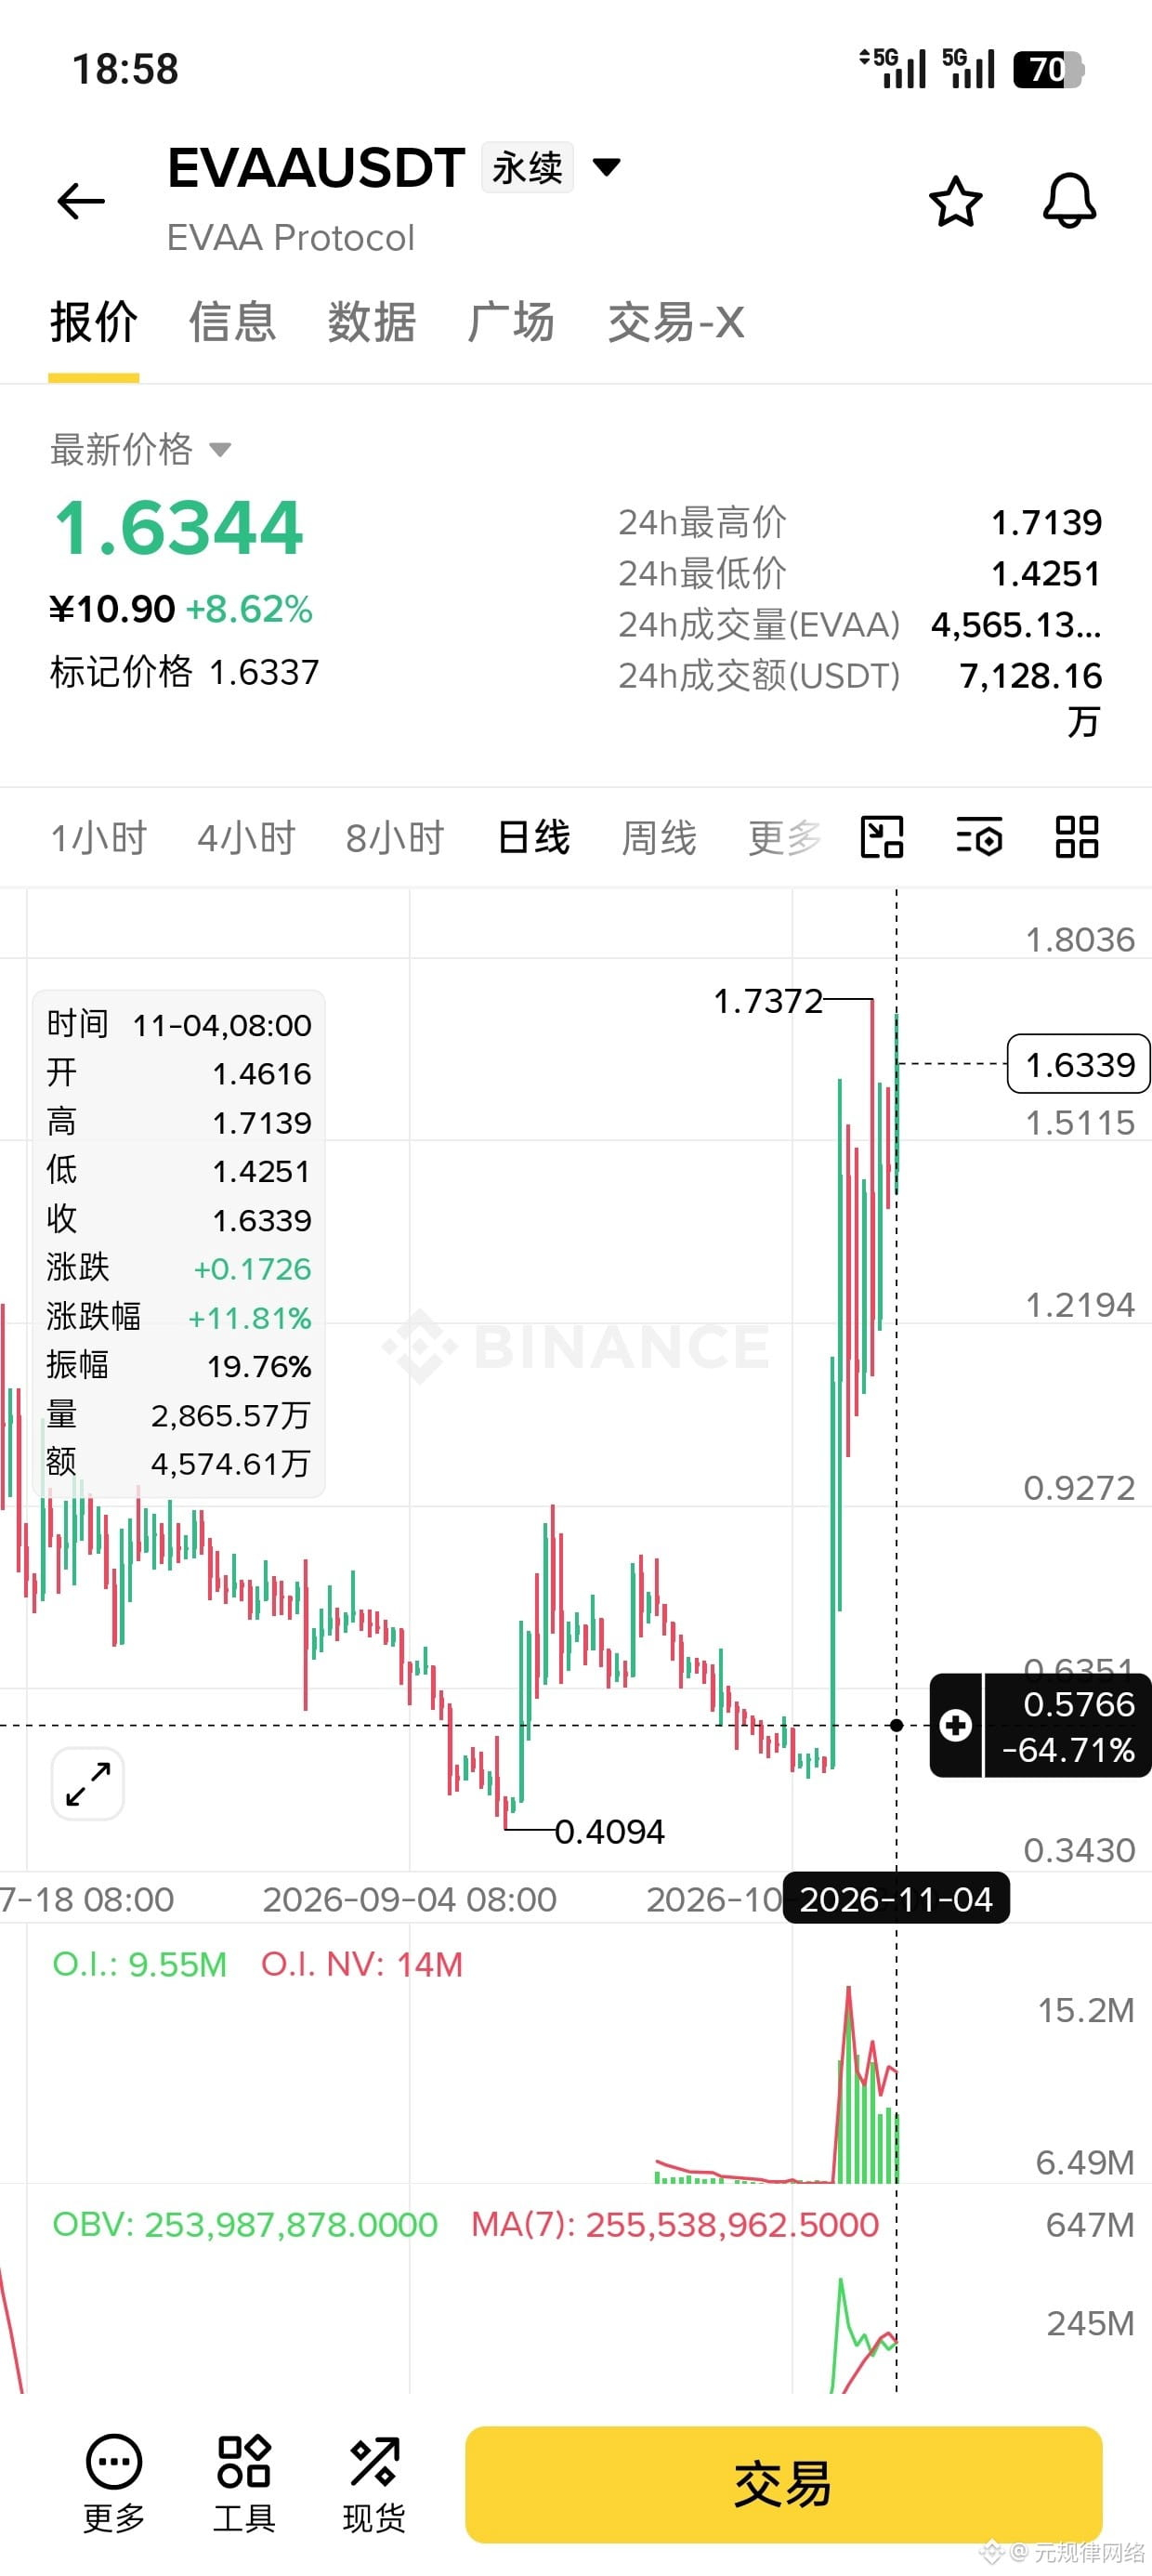
Up 3x in a day, then dumped 20%—this isn’t a market move; it’s another trap.
Let’s do the math first:
Open interest: 9.55M. 24h trading volume: 71.28 million U. Turnover is frighteningly high—on a market like this, every candlestick is drawn by the market makers.
What’s this market really like?
① It slid down from 0.4094 to 0.57, dropping 30% with nobody paying attention—a dead market left to languish for over half a year;
② Today it suddenly shot straight up: from 1.42 to 1.73, with a range of nearly 20%—no announcement, no news, just a sudden cash-fueled raid;
③ Open interest instantly surged from the bottom to 9.55M, more than doubling—today’s new longs just rushed in, all of them fuel;
④ It hit 1.73 and immediately dumped back to 1.63, leaving a long upper wick—the selling pressure overhead is real, and the market makers themselves are selling.
Three strikes on the chart:
① A flagpole formed after half a year of decline, with a single spike shooting straight up;
② Volume surged throughout the rally, but it also surged on the way down—both bulls and bears are running, while retail traders are the only ones left standing in the middle;
③ OBV turned down just after spiking, and MA(7) has already rolled over—capital flows aren’t backing this up.
Let’s focus on the “spike and pullback”:
A genuine breakout holds above the breakout level and moves sideways, giving retail traders time to chase. This one shot up and got dumped right back down in seconds—the goal isn’t to kick off a rally; it’s to lure you in and leave you holding the bag. The only explanation for a market that’s been left for dead for half a year suddenly jumping is that someone needs liquidity to sell into.
Trade setup:
Short entry zone: 1.70–1.75 (enter on a rebound; don’t chase the current price)
Stop loss: 1.83
Targets: 1.45 → 1.35 → 1.20
Risk/reward ratio: about 1:2.5—acceptable
Invalidation: A high-volume hold above 1.83 invalidates the setup
Long side: completely off-limits. A market down 66% in six months, a one-day pump, and no fundamental support—going long is just helping the market makers out.
In a nutshell: A dead market can twitch, but a twitch doesn’t mean it’s come back to life. That long upper wick is its tombstone; 1.70–1.75 is its second funeral.
(Not investment advice. Contract trading involves risk.)
$EVAA EVAA Verdict:
Up 3x in a day, then dumped 20%—this isn’t a market move; it’s another trap.
Let’s do the math first:
Open interest: 9.55M. 24h trading volume: 71.28 million U. Turnover is frighteningly high—on a market like this, every candlestick is drawn by the market makers.
What’s this market really like?
① It slid down from 0.4094 to 0.57, dropping 30% with nobody paying attention—a dead market left to languish for over half a year;
② Today it suddenly shot straight up: from 1.42 to 1.73, with a range of nearly 20%—no announcement, no news, just a sudden cash-fueled raid;
③ Open interest instantly surged from the bottom to 9.55M, more than doubling—today’s new longs just rushed in, all of them fuel;
④ It hit 1.73 and immediately dumped back to 1.63, leaving a long upper wick—the selling pressure overhead is real, and the market makers themselves are selling.
Three strikes on the chart:
① A flagpole formed after half a year of decline, with a single spike shooting straight up;
② Volume surged throughout the rally, but it also surged on the way down—both bulls and bears are running, while retail traders are the only ones left standing in the middle;
③ OBV turned down just after spiking, and MA(7) has already rolled over—capital flows aren’t backing this up.
Let’s focus on the “spike and pullback”:
A genuine breakout holds above the breakout level and moves sideways, giving retail traders time to chase. This one shot up and got dumped right back down in seconds—the goal isn’t to kick off a rally; it’s to lure you in and leave you holding the bag. The only explanation for a market that’s been left for dead for half a year suddenly jumping is that someone needs liquidity to sell into.
Trade setup:
Short entry zone: 1.70–1.75 (enter on a rebound; don’t chase the current price)
Stop loss: 1.83
Targets: 1.45 → 1.35 → 1.20
Risk/reward ratio: about 1:2.5—acceptable
Invalidation: A high-volume hold above 1.83 invalidates the setup
Long side: completely off-limits. A market down 66% in six months, a one-day pump, and no fundamental support—going long is just helping the market makers out.
In a nutshell: A dead market can twitch, but a twitch doesn’t mean it’s come back to life. That long upper wick is its tombstone; 1.70–1.75 is its second funeral.
(Not investment advice. Contract trading involves risk.)
Up 3x in a day, then dumped 20%—this isn’t a market move; it’s another trap.
Let’s do the math first:
Open interest: 9.55M. 24h trading volume: 71.28 million U. Turnover is frighteningly high—on a market like this, every candlestick is drawn by the market makers.
What’s this market really like?
① It slid down from 0.4094 to 0.57, dropping 30% with nobody paying attention—a dead market left to languish for over half a year;
② Today it suddenly shot straight up: from 1.42 to 1.73, with a range of nearly 20%—no announcement, no news, just a sudden cash-fueled raid;
③ Open interest instantly surged from the bottom to 9.55M, more than doubling—today’s new longs just rushed in, all of them fuel;
④ It hit 1.73 and immediately dumped back to 1.63, leaving a long upper wick—the selling pressure overhead is real, and the market makers themselves are selling.
Three strikes on the chart:
① A flagpole formed after half a year of decline, with a single spike shooting straight up;
② Volume surged throughout the rally, but it also surged on the way down—both bulls and bears are running, while retail traders are the only ones left standing in the middle;
③ OBV turned down just after spiking, and MA(7) has already rolled over—capital flows aren’t backing this up.
Let’s focus on the “spike and pullback”:
A genuine breakout holds above the breakout level and moves sideways, giving retail traders time to chase. This one shot up and got dumped right back down in seconds—the goal isn’t to kick off a rally; it’s to lure you in and leave you holding the bag. The only explanation for a market that’s been left for dead for half a year suddenly jumping is that someone needs liquidity to sell into.
Trade setup:
Short entry zone: 1.70–1.75 (enter on a rebound; don’t chase the current price)
Stop loss: 1.83
Targets: 1.45 → 1.35 → 1.20
Risk/reward ratio: about 1:2.5—acceptable
Invalidation: A high-volume hold above 1.83 invalidates the setup
Long side: completely off-limits. A market down 66% in six months, a one-day pump, and no fundamental support—going long is just helping the market makers out.
In a nutshell: A dead market can twitch, but a twitch doesn’t mean it’s come back to life. That long upper wick is its tombstone; 1.70–1.75 is its second funeral.
(Not investment advice. Contract trading involves risk.)
269
·
--
See translation
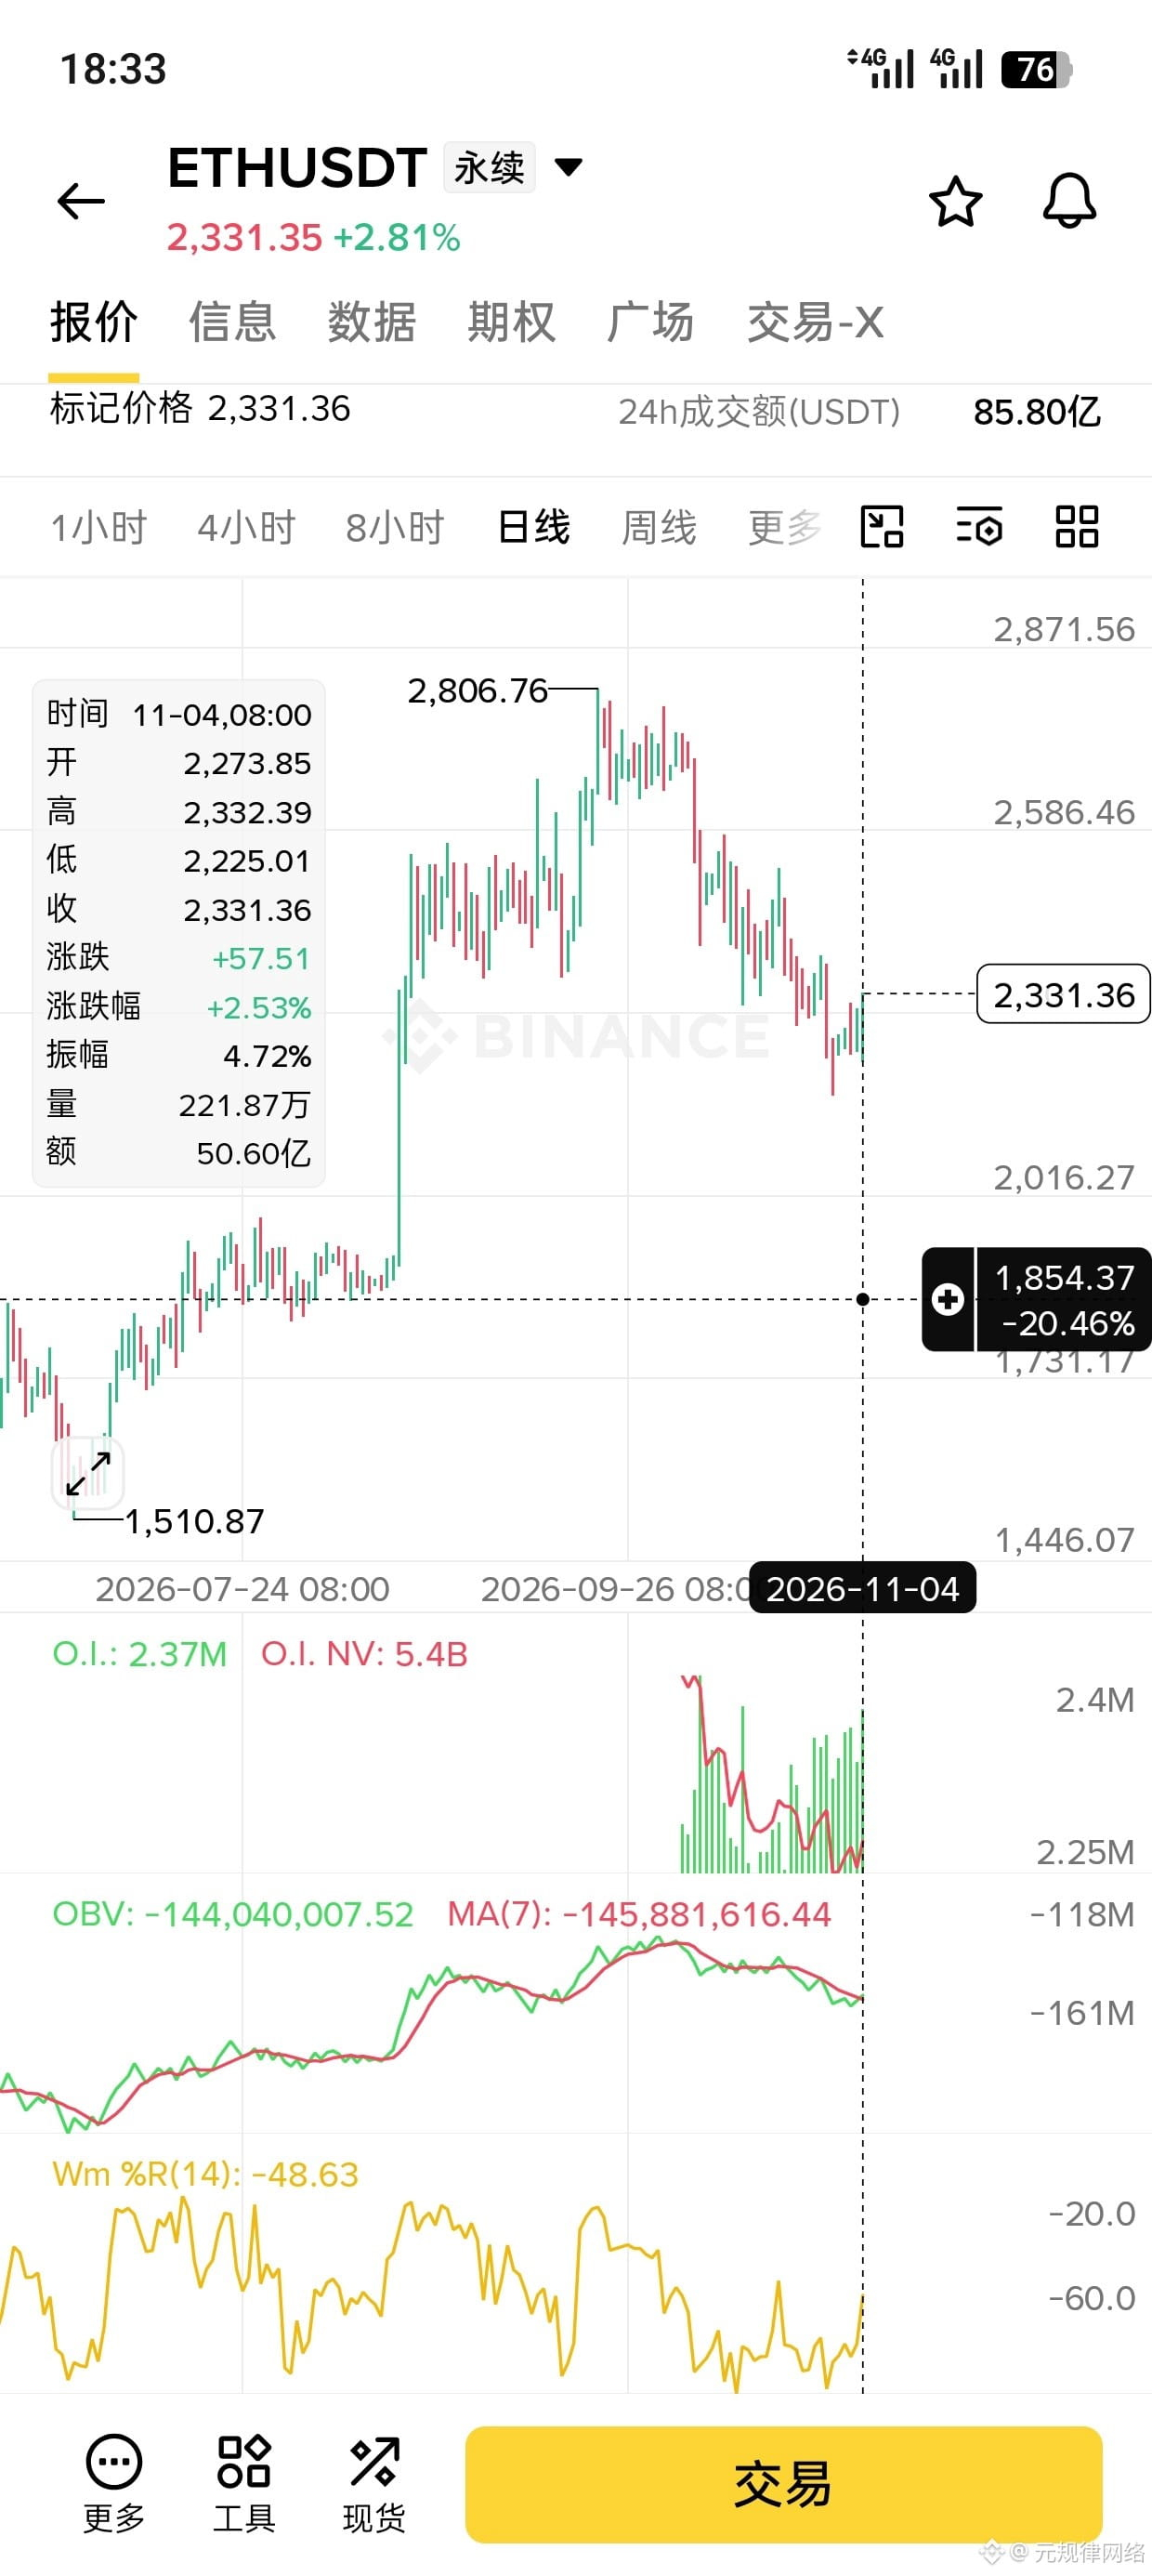
$ETH 🚨ETH从2800跌到2000,今天+2.81%—二哥这波反弹,是给你逃命用的。
怎么做:
✅ 空单等反抽2400~2460进场,止损2520,目标2150→2016前低→1900
❌ 别追多:从高点跌了20%多,一天反弹3%就想反转?想多了
❌ 别立刻空:日线刚收阳,反弹还有一口气,等它送到压力区
为啥敢空?盘面上写得明明白白:
1️⃣ 从2806砸到2016,28%没了,中途连个像样的平台都没筑——跌得这么顺滑,说明卖压是持续性的,不是一次砸完,上面全是没出完的货
2️⃣ 持仓量2.37M反弹时没放量增仓:价格弹了,仓位没跟上——这是空头回补弹起来的,不是新多进场扛大旗,弹完还得跌
3️⃣ OBV死叉之后一路阴跌,均线压着走:资金流一点回暖的意思都没有,+2.81%只是跌深了的技术性反抽
它接下来的剧本:
急跌→超卖反弹→反抽到2400附近的破位密集区→套牢盘解套出货→继续下探。2400~2460是从2800跌下来的中枢位置,弹到这里等于撞枪口,解套盘能把反弹按死。
纪律:
• 2400~2460再空,别在半山腰提前进,反弹末端最磨人
• 破2520认错——真站回去说明这轮调整走完,空单撤
• ETH流动性好波动相对可控,仓位正常给,止损严格执行
一句话: 二哥跌28%后的反弹,不是反转的号角,是下跌途中的休息站。2400~2460挂好空单,让它喘完这口气接着走。
(个人观点不构成建议,管好仓位)
$ETH 🚨ETH从2800跌到2000,今天+2.81%—二哥这波反弹,是给你逃命用的。
怎么做:
✅ 空单等反抽2400~2460进场,止损2520,目标2150→2016前低→1900
❌ 别追多:从高点跌了20%多,一天反弹3%就想反转?想多了
❌ 别立刻空:日线刚收阳,反弹还有一口气,等它送到压力区
为啥敢空?盘面上写得明明白白:
1️⃣ 从2806砸到2016,28%没了,中途连个像样的平台都没筑——跌得这么顺滑,说明卖压是持续性的,不是一次砸完,上面全是没出完的货
2️⃣ 持仓量2.37M反弹时没放量增仓:价格弹了,仓位没跟上——这是空头回补弹起来的,不是新多进场扛大旗,弹完还得跌
3️⃣ OBV死叉之后一路阴跌,均线压着走:资金流一点回暖的意思都没有,+2.81%只是跌深了的技术性反抽
它接下来的剧本:
急跌→超卖反弹→反抽到2400附近的破位密集区→套牢盘解套出货→继续下探。2400~2460是从2800跌下来的中枢位置,弹到这里等于撞枪口,解套盘能把反弹按死。
纪律:
• 2400~2460再空,别在半山腰提前进,反弹末端最磨人
• 破2520认错——真站回去说明这轮调整走完,空单撤
• ETH流动性好波动相对可控,仓位正常给,止损严格执行
一句话: 二哥跌28%后的反弹,不是反转的号角,是下跌途中的休息站。2400~2460挂好空单,让它喘完这口气接着走。
(个人观点不构成建议,管好仓位)
怎么做:
✅ 空单等反抽2400~2460进场,止损2520,目标2150→2016前低→1900
❌ 别追多:从高点跌了20%多,一天反弹3%就想反转?想多了
❌ 别立刻空:日线刚收阳,反弹还有一口气,等它送到压力区
为啥敢空?盘面上写得明明白白:
1️⃣ 从2806砸到2016,28%没了,中途连个像样的平台都没筑——跌得这么顺滑,说明卖压是持续性的,不是一次砸完,上面全是没出完的货
2️⃣ 持仓量2.37M反弹时没放量增仓:价格弹了,仓位没跟上——这是空头回补弹起来的,不是新多进场扛大旗,弹完还得跌
3️⃣ OBV死叉之后一路阴跌,均线压着走:资金流一点回暖的意思都没有,+2.81%只是跌深了的技术性反抽
它接下来的剧本:
急跌→超卖反弹→反抽到2400附近的破位密集区→套牢盘解套出货→继续下探。2400~2460是从2800跌下来的中枢位置,弹到这里等于撞枪口,解套盘能把反弹按死。
纪律:
• 2400~2460再空,别在半山腰提前进,反弹末端最磨人
• 破2520认错——真站回去说明这轮调整走完,空单撤
• ETH流动性好波动相对可控,仓位正常给,止损严格执行
一句话: 二哥跌28%后的反弹,不是反转的号角,是下跌途中的休息站。2400~2460挂好空单,让它喘完这口气接着走。
(个人观点不构成建议,管好仓位)
3
·
--
See translation
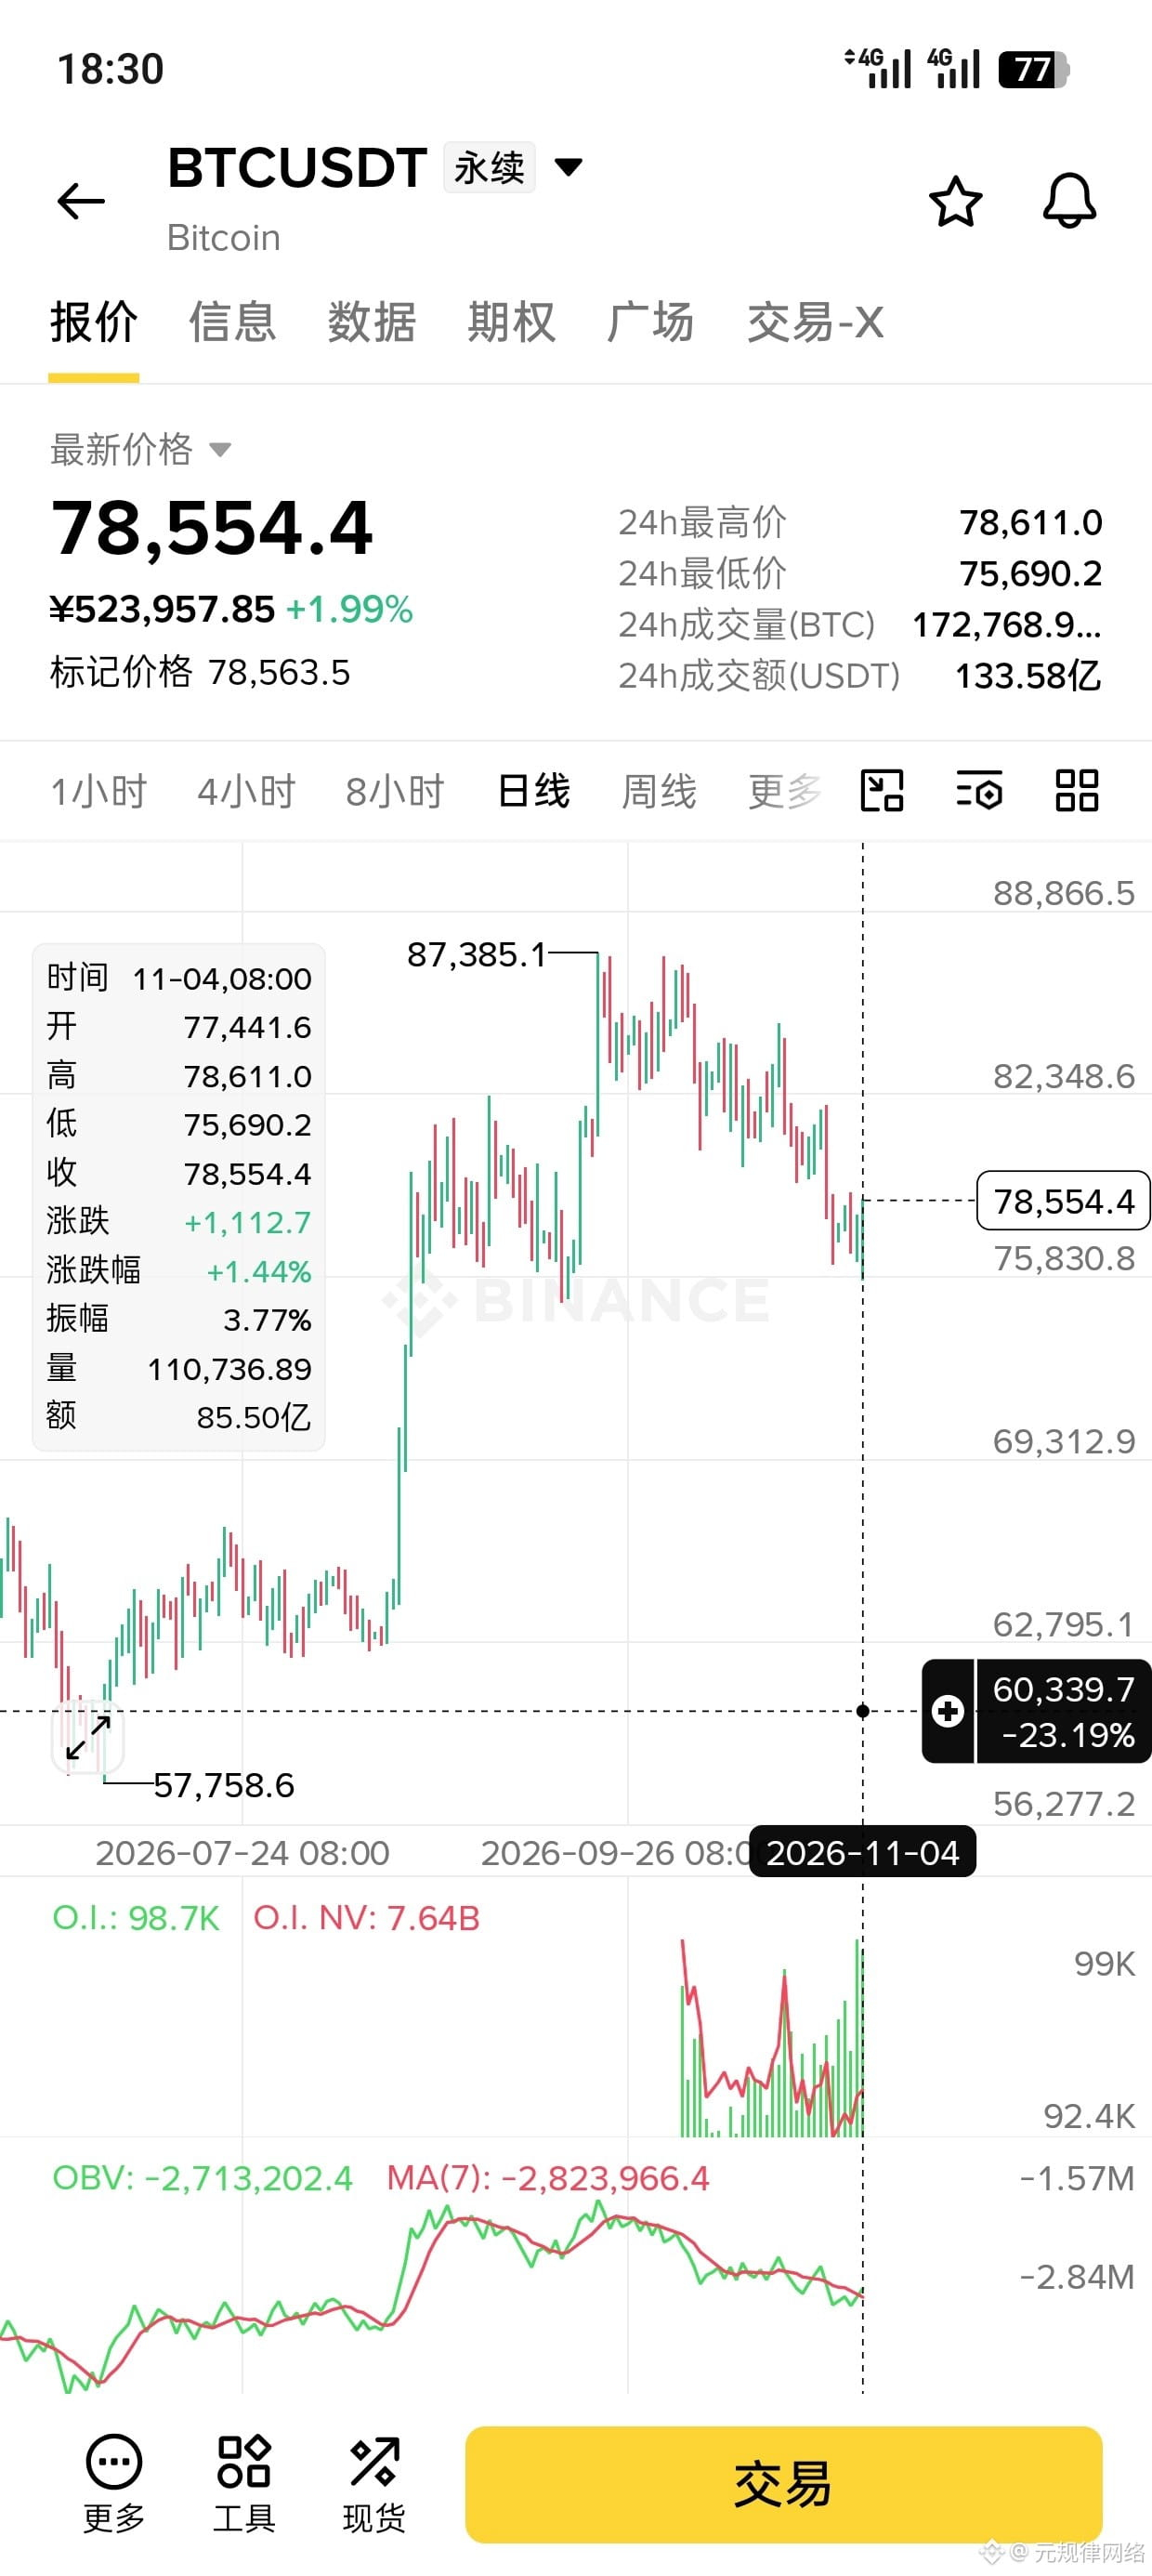
$BTC 🚨BTC从87k摔下来,今天弹回78k——这不是止跌,是中继
怎么做:
✅ 空单等反抽80.5~82k进场,止损83.8k,目标75.6→73→70k
❌ 别抄底:从87.4k砸到75.6k才两周,+2%的反弹改变不了什么
❌ 别追空:刚从底部弹起来,先让它把反抽走完
为啥敢空?三个信号摆在盘面上:
1️⃣ 从87.4k跌到75.6k,跌了13.5%没像样的抵抗——大饼这个体量跌成这样,说明不是散户砸盘,是机构在调仓,跌下来的筹码没人急着接
2️⃣ 持仓量只有98.7K,处于低位:反弹的时候仓位没起来,说明这波+2%是空头减仓弹的,不是多头真金白银买出来的
3️⃣ OBV贴着均线往下走:资金流没有回流迹象,价格弹了但量能不支持,典型的技术性反抽
它接下来的剧本:
下跌→技术性反弹→反抽到前跌破位→继续走低。80.5~82k是前面砸下来的密集区,也是这波下跌的破位点,反弹到这里全是解套盘和割肉盘等着出货,上去就是撞墙。
纪律:
• 80.5~82k再空,现在进场位太差,容易先被反弹扫
• 破83.8k认错——真站稳说明这波回调结束,重返强势区
• 大饼波动相对温和,仓位可以正常给,但止损必须带
一句话: 大哥摔了跟头,爬起来拍拍灰不等于没事。反抽到80.5~82k,把空单备好,趋势没坏完,但也没好起来。
(个人观点不构成建议,管好仓位)
$BTC 🚨BTC从87k摔下来,今天弹回78k——这不是止跌,是中继
怎么做:
✅ 空单等反抽80.5~82k进场,止损83.8k,目标75.6→73→70k
❌ 别抄底:从87.4k砸到75.6k才两周,+2%的反弹改变不了什么
❌ 别追空:刚从底部弹起来,先让它把反抽走完
为啥敢空?三个信号摆在盘面上:
1️⃣ 从87.4k跌到75.6k,跌了13.5%没像样的抵抗——大饼这个体量跌成这样,说明不是散户砸盘,是机构在调仓,跌下来的筹码没人急着接
2️⃣ 持仓量只有98.7K,处于低位:反弹的时候仓位没起来,说明这波+2%是空头减仓弹的,不是多头真金白银买出来的
3️⃣ OBV贴着均线往下走:资金流没有回流迹象,价格弹了但量能不支持,典型的技术性反抽
它接下来的剧本:
下跌→技术性反弹→反抽到前跌破位→继续走低。80.5~82k是前面砸下来的密集区,也是这波下跌的破位点,反弹到这里全是解套盘和割肉盘等着出货,上去就是撞墙。
纪律:
• 80.5~82k再空,现在进场位太差,容易先被反弹扫
• 破83.8k认错——真站稳说明这波回调结束,重返强势区
• 大饼波动相对温和,仓位可以正常给,但止损必须带
一句话: 大哥摔了跟头,爬起来拍拍灰不等于没事。反抽到80.5~82k,把空单备好,趋势没坏完,但也没好起来。
(个人观点不构成建议,管好仓位)
怎么做:
✅ 空单等反抽80.5~82k进场,止损83.8k,目标75.6→73→70k
❌ 别抄底:从87.4k砸到75.6k才两周,+2%的反弹改变不了什么
❌ 别追空:刚从底部弹起来,先让它把反抽走完
为啥敢空?三个信号摆在盘面上:
1️⃣ 从87.4k跌到75.6k,跌了13.5%没像样的抵抗——大饼这个体量跌成这样,说明不是散户砸盘,是机构在调仓,跌下来的筹码没人急着接
2️⃣ 持仓量只有98.7K,处于低位:反弹的时候仓位没起来,说明这波+2%是空头减仓弹的,不是多头真金白银买出来的
3️⃣ OBV贴着均线往下走:资金流没有回流迹象,价格弹了但量能不支持,典型的技术性反抽
它接下来的剧本:
下跌→技术性反弹→反抽到前跌破位→继续走低。80.5~82k是前面砸下来的密集区,也是这波下跌的破位点,反弹到这里全是解套盘和割肉盘等着出货,上去就是撞墙。
纪律:
• 80.5~82k再空,现在进场位太差,容易先被反弹扫
• 破83.8k认错——真站稳说明这波回调结束,重返强势区
• 大饼波动相对温和,仓位可以正常给,但止损必须带
一句话: 大哥摔了跟头,爬起来拍拍灰不等于没事。反抽到80.5~82k,把空单备好,趋势没坏完,但也没好起来。
(个人观点不构成建议,管好仓位)
1
·
--
$BTW 🚨BTW has fallen 67% from its peak, and today it's up 21%—remember, this bounce is for market makers to dump their bags.
What to do:
✅ Wait for a rebound to 1.25–1.35 to enter a short; stop-loss at 1.48, targets 0.95 → 0.87 (the previous low)
❌ Don’t buy the dip: it crashed from 2.75 to 0.87 in just two months. What you think is the bottom could just be halfway down.
❌ Don’t chase longs: +21% looks exciting, but volume tells you the truth is below.
Why am I willing to short? Look at these three clues:
1️⃣ It ran from 0.07 to 2.75—a 37x gain—then lost 67%. Coins that soar from the ashes only to crash back down have an awful holder structure: there are trapped holders all the way up, and every bounce gets dumped.
2️⃣ Open interest shrank from 86.8M to 15.5M. Money isn’t entering during the rebound, which means this rally has no fresh capital behind it—it’s all driven by short covering. Once shorts return, the price will fall.
3️⃣ OBV is flat below its moving average: there’s no sign of money flowing back in. The +21% move is hollow; a low-volume rebound won’t go far.
The likely next act:
After crashing 67%, it stabilizes → prints a big +21% bullish candle as bait → retail traders think it’s a V-shaped reversal and pile in → it rebounds to resistance, then keeps falling. The 1.25–1.35 area is a dense zone of trapped holders from the previous sell-off. A bounce here is just the market makers’ chance to unload one last batch.
Discipline:
• Short again at 1.25–1.35; if it doesn’t rebound, hold and wait.
• Admit you’re wrong if it breaks 1.48—a genuine high-volume move that holds above it means fresh money is stepping in, so exit.
• This low-cap shitcoin has only 16M in open interest; one wick can prove you wrong, so keep your position small.
In a nutshell: A coin that went up 37x, then got cut in half again and again—this rebound isn’t a revival; it’s a chance to unload the last of the bags. Set your short orders at 1.25–1.35 and wait for it to show its true colors.
(Personal opinion, not financial advice. Manage your position size.)
$BTW 🚨BTW has fallen 67% from its peak, and today it's up 21%—remember, this bounce is for market makers to dump their bags.
What to do:
✅ Wait for a rebound to 1.25–1.35 to enter a short; stop-loss at 1.48, targets 0.95 → 0.87 (the previous low)
❌ Don’t buy the dip: it crashed from 2.75 to 0.87 in just two months. What you think is the bottom could just be halfway down.
❌ Don’t chase longs: +21% looks exciting, but volume tells you the truth is below.
Why am I willing to short? Look at these three clues:
1️⃣ It ran from 0.07 to 2.75—a 37x gain—then lost 67%. Coins that soar from the ashes only to crash back down have an awful holder structure: there are trapped holders all the way up, and every bounce gets dumped.
2️⃣ Open interest shrank from 86.8M to 15.5M. Money isn’t entering during the rebound, which means this rally has no fresh capital behind it—it’s all driven by short covering. Once shorts return, the price will fall.
3️⃣ OBV is flat below its moving average: there’s no sign of money flowing back in. The +21% move is hollow; a low-volume rebound won’t go far.
The likely next act:
After crashing 67%, it stabilizes → prints a big +21% bullish candle as bait → retail traders think it’s a V-shaped reversal and pile in → it rebounds to resistance, then keeps falling. The 1.25–1.35 area is a dense zone of trapped holders from the previous sell-off. A bounce here is just the market makers’ chance to unload one last batch.
Discipline:
• Short again at 1.25–1.35; if it doesn’t rebound, hold and wait.
• Admit you’re wrong if it breaks 1.48—a genuine high-volume move that holds above it means fresh money is stepping in, so exit.
• This low-cap shitcoin has only 16M in open interest; one wick can prove you wrong, so keep your position small.
In a nutshell: A coin that went up 37x, then got cut in half again and again—this rebound isn’t a revival; it’s a chance to unload the last of the bags. Set your short orders at 1.25–1.35 and wait for it to show its true colors.
(Personal opinion, not financial advice. Manage your position size.)
What to do:
✅ Wait for a rebound to 1.25–1.35 to enter a short; stop-loss at 1.48, targets 0.95 → 0.87 (the previous low)
❌ Don’t buy the dip: it crashed from 2.75 to 0.87 in just two months. What you think is the bottom could just be halfway down.
❌ Don’t chase longs: +21% looks exciting, but volume tells you the truth is below.
Why am I willing to short? Look at these three clues:
1️⃣ It ran from 0.07 to 2.75—a 37x gain—then lost 67%. Coins that soar from the ashes only to crash back down have an awful holder structure: there are trapped holders all the way up, and every bounce gets dumped.
2️⃣ Open interest shrank from 86.8M to 15.5M. Money isn’t entering during the rebound, which means this rally has no fresh capital behind it—it’s all driven by short covering. Once shorts return, the price will fall.
3️⃣ OBV is flat below its moving average: there’s no sign of money flowing back in. The +21% move is hollow; a low-volume rebound won’t go far.
The likely next act:
After crashing 67%, it stabilizes → prints a big +21% bullish candle as bait → retail traders think it’s a V-shaped reversal and pile in → it rebounds to resistance, then keeps falling. The 1.25–1.35 area is a dense zone of trapped holders from the previous sell-off. A bounce here is just the market makers’ chance to unload one last batch.
Discipline:
• Short again at 1.25–1.35; if it doesn’t rebound, hold and wait.
• Admit you’re wrong if it breaks 1.48—a genuine high-volume move that holds above it means fresh money is stepping in, so exit.
• This low-cap shitcoin has only 16M in open interest; one wick can prove you wrong, so keep your position small.
In a nutshell: A coin that went up 37x, then got cut in half again and again—this rebound isn’t a revival; it’s a chance to unload the last of the bags. Set your short orders at 1.25–1.35 and wait for it to show its true colors.
(Personal opinion, not financial advice. Manage your position size.)
4
·
--
See translation
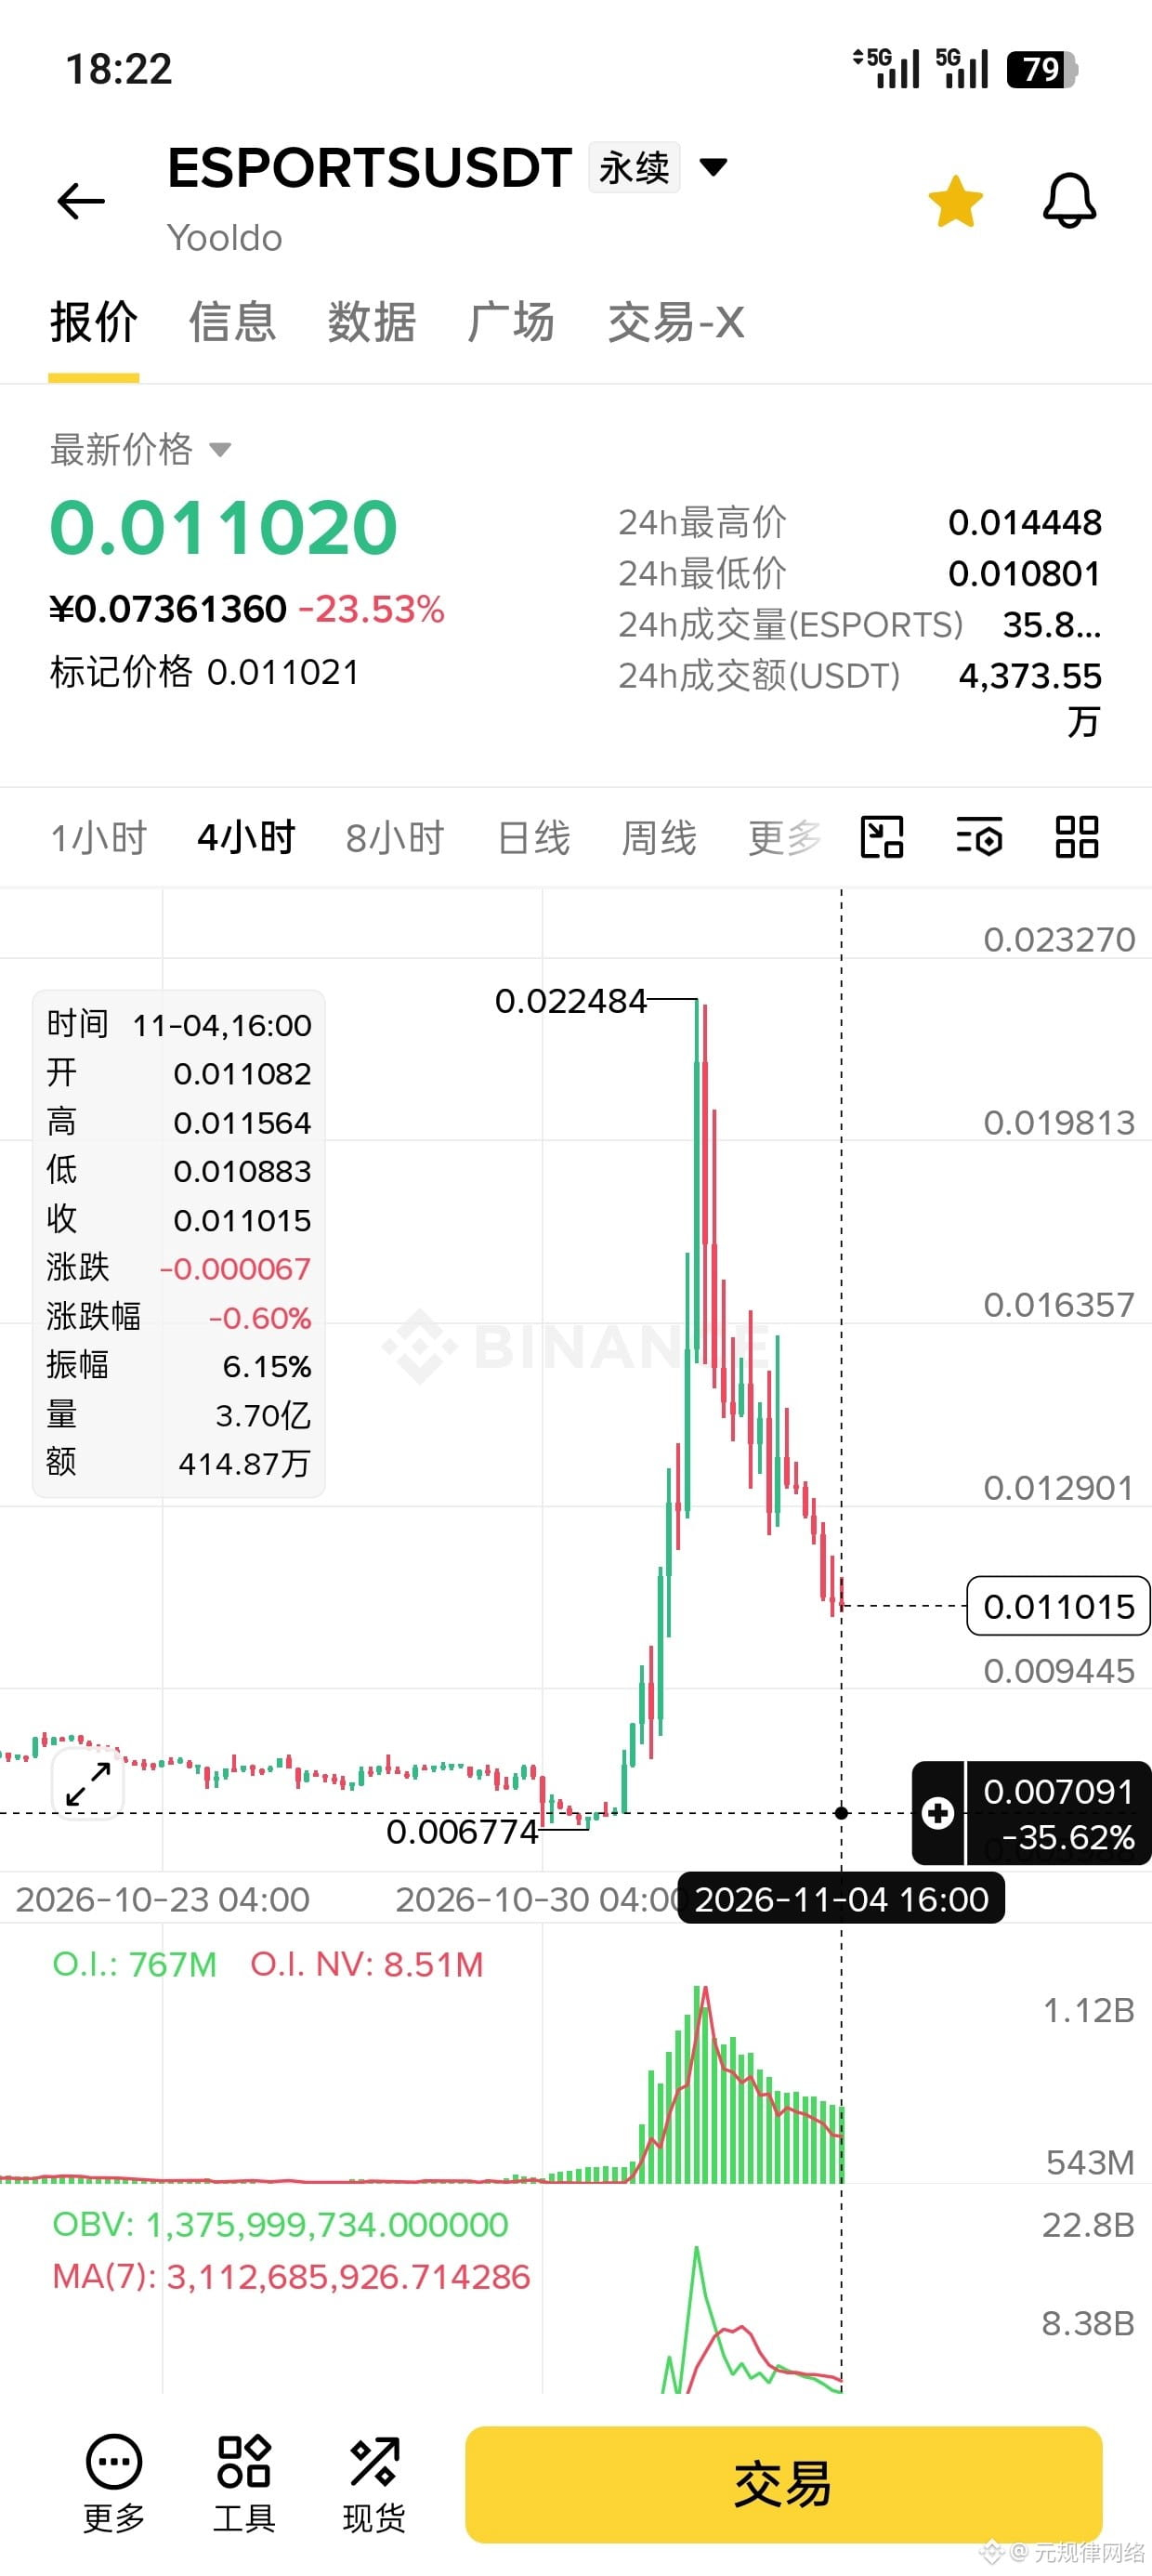
$ESPORTS 🚨ESPORTS一天崩了46%,追高的全埋了——现在轮到反抽出货,空!
怎么做:
✅ 空单等反抽0.0125~0.0135进场,止损0.0148,目标0.0095→0.008
❌ 别抄底:-23%看着便宜?从0.0224砸下来才一半,下面还有深渊
❌ 别追空:刚崩完第一波,先让子弹飞,反抽到位再进
为啥敢空?盘面已经招供了:
1️⃣ 典型的拉完就砸:从0.0067暴拉到0.0224翻3倍,然后一天跌46%砸回0.011——这不是回调,是庄家清仓跑路,跑之前连招呼都不打
2️⃣ 持仓量见顶回落:OI冲到967M后开始掉头往下,冲进去的多单已经在爆仓离场,接盘的人没了
3️⃣ OBV死叉下杀:资金流从顶部垂直往下砸,量价齐跌——没有承接,只有踩踏
它接下来的剧本:
崩盘→横住骗人“企稳了”→反抽一波让人以为V型反转→再砸。反抽就是庄家把最后的货倒给抄底的人,0.0125~0.0135那个位置就是倒货区。
纪律:
• 0.0125~0.0135再空,不反抽就拿着空单耐心等
• 破0.0148认错——真V回来说明还有资金接力,这单撤
• 这种刚崩的妖币波动极大,仓位砍半,一根针就能爆你
一句话: 翻3倍再腰斩的盘子,不是机会,是案发现场。别人抄底,我等着——反抽到了,把空单拍它脸上。
(个人观点不构成建议,管好仓位)
$ESPORTS 🚨ESPORTS一天崩了46%,追高的全埋了——现在轮到反抽出货,空!
怎么做:
✅ 空单等反抽0.0125~0.0135进场,止损0.0148,目标0.0095→0.008
❌ 别抄底:-23%看着便宜?从0.0224砸下来才一半,下面还有深渊
❌ 别追空:刚崩完第一波,先让子弹飞,反抽到位再进
为啥敢空?盘面已经招供了:
1️⃣ 典型的拉完就砸:从0.0067暴拉到0.0224翻3倍,然后一天跌46%砸回0.011——这不是回调,是庄家清仓跑路,跑之前连招呼都不打
2️⃣ 持仓量见顶回落:OI冲到967M后开始掉头往下,冲进去的多单已经在爆仓离场,接盘的人没了
3️⃣ OBV死叉下杀:资金流从顶部垂直往下砸,量价齐跌——没有承接,只有踩踏
它接下来的剧本:
崩盘→横住骗人“企稳了”→反抽一波让人以为V型反转→再砸。反抽就是庄家把最后的货倒给抄底的人,0.0125~0.0135那个位置就是倒货区。
纪律:
• 0.0125~0.0135再空,不反抽就拿着空单耐心等
• 破0.0148认错——真V回来说明还有资金接力,这单撤
• 这种刚崩的妖币波动极大,仓位砍半,一根针就能爆你
一句话: 翻3倍再腰斩的盘子,不是机会,是案发现场。别人抄底,我等着——反抽到了,把空单拍它脸上。
(个人观点不构成建议,管好仓位)
怎么做:
✅ 空单等反抽0.0125~0.0135进场,止损0.0148,目标0.0095→0.008
❌ 别抄底:-23%看着便宜?从0.0224砸下来才一半,下面还有深渊
❌ 别追空:刚崩完第一波,先让子弹飞,反抽到位再进
为啥敢空?盘面已经招供了:
1️⃣ 典型的拉完就砸:从0.0067暴拉到0.0224翻3倍,然后一天跌46%砸回0.011——这不是回调,是庄家清仓跑路,跑之前连招呼都不打
2️⃣ 持仓量见顶回落:OI冲到967M后开始掉头往下,冲进去的多单已经在爆仓离场,接盘的人没了
3️⃣ OBV死叉下杀:资金流从顶部垂直往下砸,量价齐跌——没有承接,只有踩踏
它接下来的剧本:
崩盘→横住骗人“企稳了”→反抽一波让人以为V型反转→再砸。反抽就是庄家把最后的货倒给抄底的人,0.0125~0.0135那个位置就是倒货区。
纪律:
• 0.0125~0.0135再空,不反抽就拿着空单耐心等
• 破0.0148认错——真V回来说明还有资金接力,这单撤
• 这种刚崩的妖币波动极大,仓位砍半,一根针就能爆你
一句话: 翻3倍再腰斩的盘子,不是机会,是案发现场。别人抄底,我等着——反抽到了,把空单拍它脸上。
(个人观点不构成建议,管好仓位)
3
·
--
30D trade $IDOL 1.9K USDT
See translation
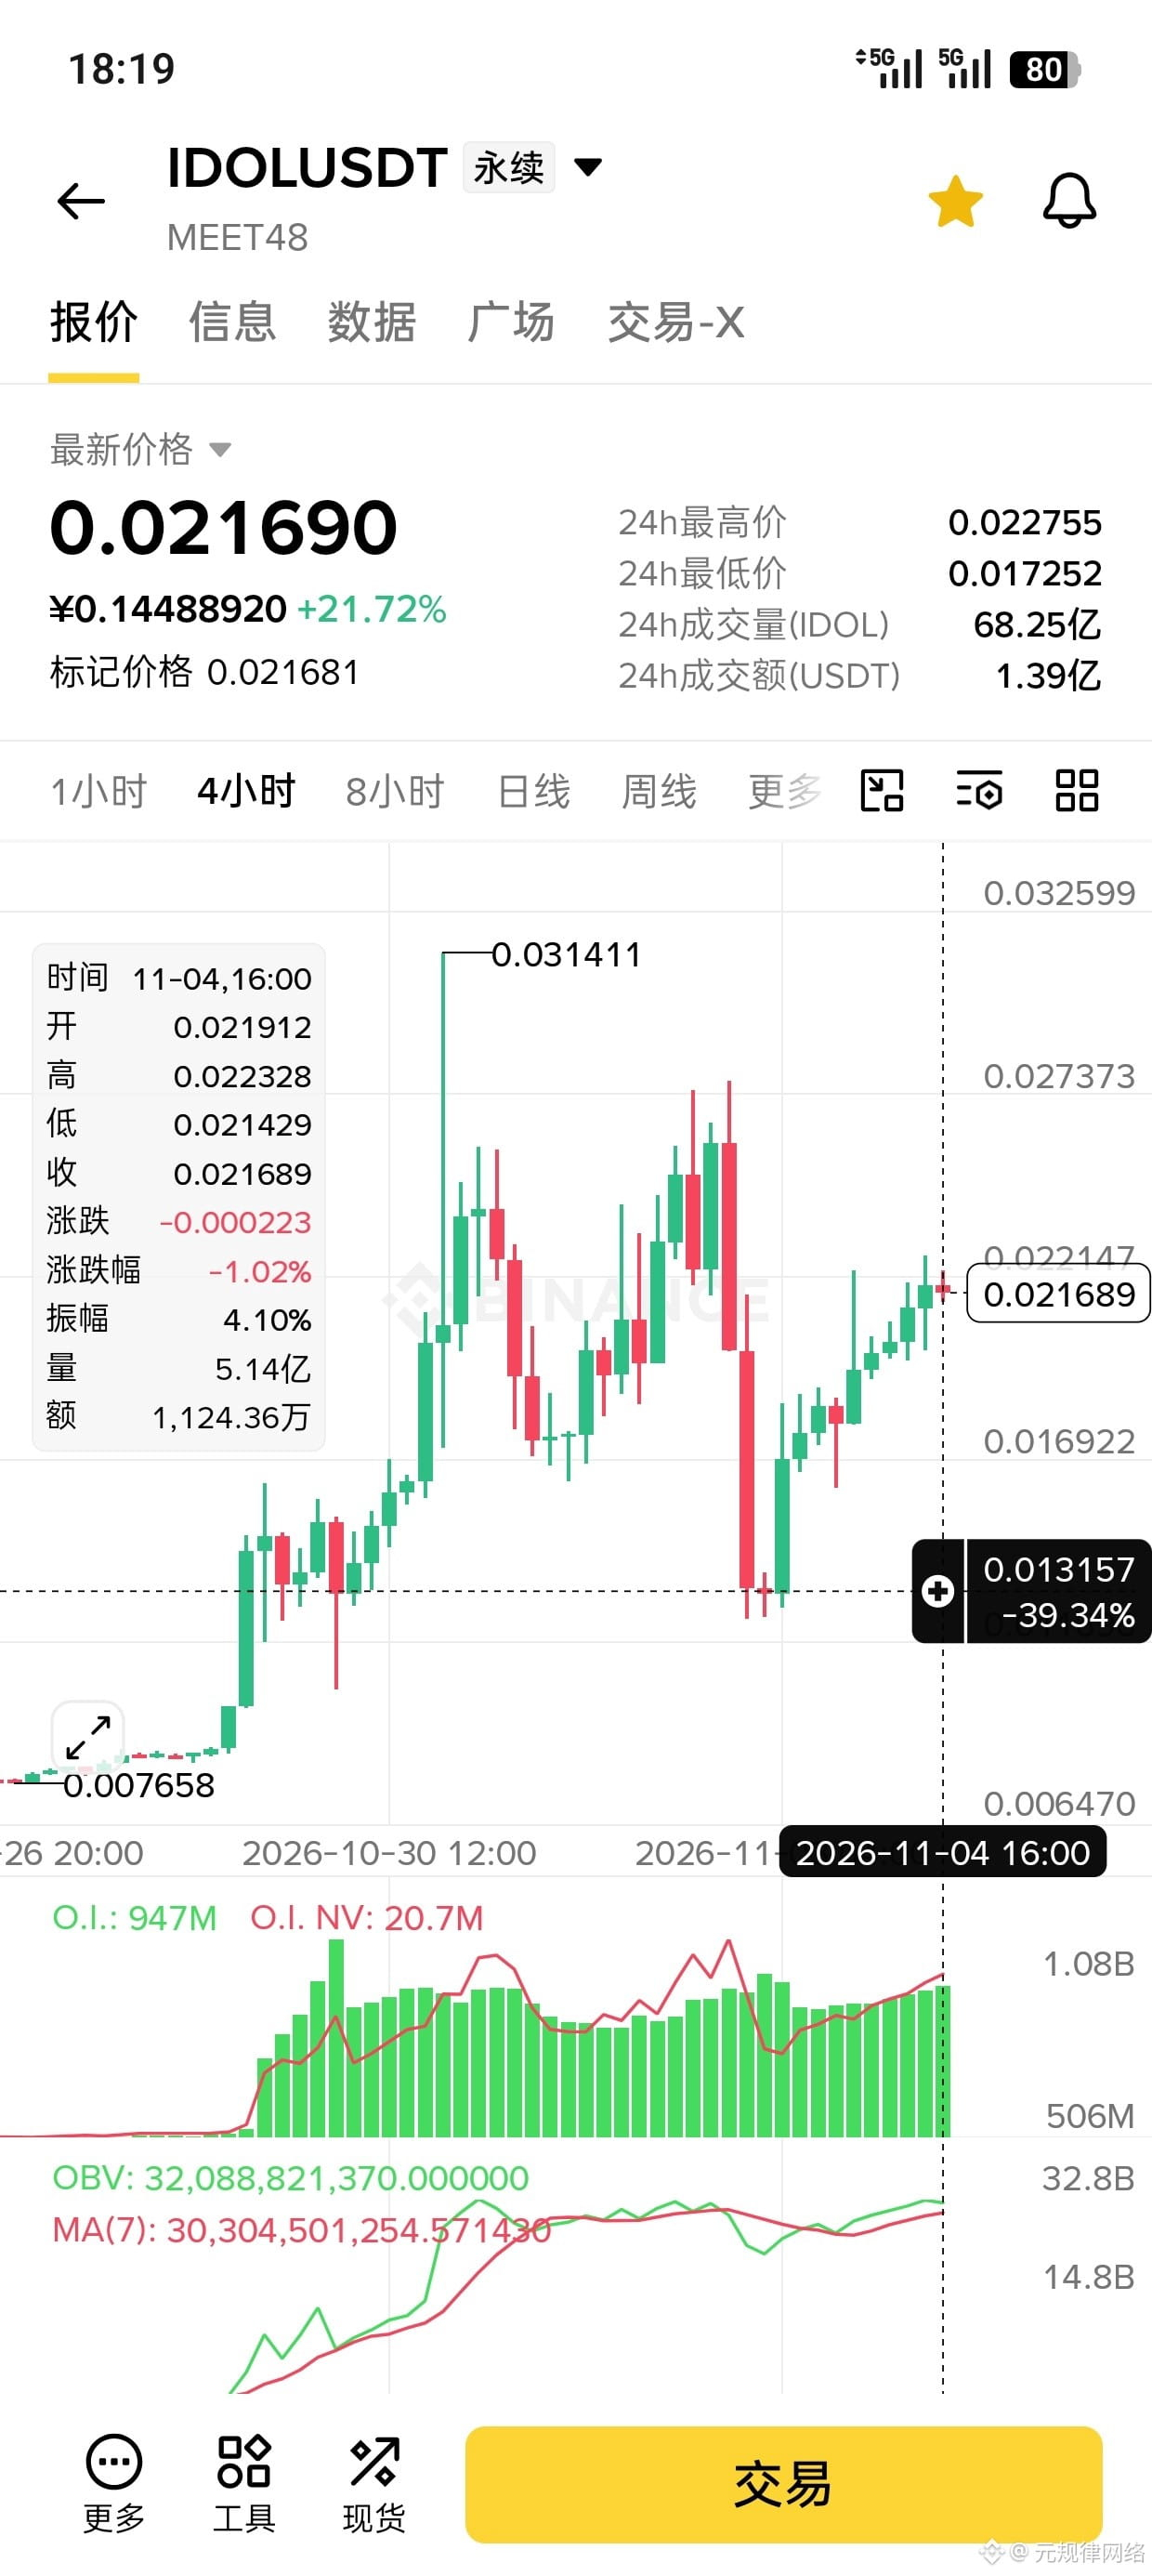
$IDOL 🚨IDOL从底部翻了3倍,现在回调——这是洗盘,不是崩盘。
怎么做:
✅ 回调0.0195~0.0205接多,止损0.0172,目标0.0245→0.0274→0.0314前高
❌ 别追:现在0.0217追进去,上下都是针,进去就是挨打
❌ 别空:量能和持仓都在撑着,空它等于逆着庄家的钱袋开炮
为啥敢多?看盘面说话:
1️⃣ 从0.0068拉到0.0314,翻了3倍多,但回调没破关键位——回落到0.0164就被买回来,今天又站回0.0217,说明拉完不是跑,是洗
2️⃣ 持仓量947M持续走高:拉盘之后的回调阶段,钱没撤,主力还在场内占着位置
3️⃣ OBV回踩MA(7)被撑住:资金流没有出货的走法,是典型的涨太多→甩掉追多的→再往上走
它接下来的剧本:
暴力拉升→回调喂料→横盘磨掉没耐心的人→二次冲前高。现在就在“磨”这个阶段,0.0314那根针不是终点,是下一次要捅破的窗户纸。
纪律:
• 0.0195~0.0205再进,提前进就多扛一段洗盘
• 跌破0.0172认错——那说明这波拉盘是真的结束了
• 二次冲前高如果放巨量站不稳,多单先落袋,别贪
一句话: 3倍行情后的回调不是让你逃命的,是给你二次上车的票。拿住0.0195~0.0205这个位置,吃到0.0314那一程。
(个人观点不构成建议,管好仓位)
$IDOL 🚨IDOL从底部翻了3倍,现在回调——这是洗盘,不是崩盘。
怎么做:
✅ 回调0.0195~0.0205接多,止损0.0172,目标0.0245→0.0274→0.0314前高
❌ 别追:现在0.0217追进去,上下都是针,进去就是挨打
❌ 别空:量能和持仓都在撑着,空它等于逆着庄家的钱袋开炮
为啥敢多?看盘面说话:
1️⃣ 从0.0068拉到0.0314,翻了3倍多,但回调没破关键位——回落到0.0164就被买回来,今天又站回0.0217,说明拉完不是跑,是洗
2️⃣ 持仓量947M持续走高:拉盘之后的回调阶段,钱没撤,主力还在场内占着位置
3️⃣ OBV回踩MA(7)被撑住:资金流没有出货的走法,是典型的涨太多→甩掉追多的→再往上走
它接下来的剧本:
暴力拉升→回调喂料→横盘磨掉没耐心的人→二次冲前高。现在就在“磨”这个阶段,0.0314那根针不是终点,是下一次要捅破的窗户纸。
纪律:
• 0.0195~0.0205再进,提前进就多扛一段洗盘
• 跌破0.0172认错——那说明这波拉盘是真的结束了
• 二次冲前高如果放巨量站不稳,多单先落袋,别贪
一句话: 3倍行情后的回调不是让你逃命的,是给你二次上车的票。拿住0.0195~0.0205这个位置,吃到0.0314那一程。
(个人观点不构成建议,管好仓位)
怎么做:
✅ 回调0.0195~0.0205接多,止损0.0172,目标0.0245→0.0274→0.0314前高
❌ 别追:现在0.0217追进去,上下都是针,进去就是挨打
❌ 别空:量能和持仓都在撑着,空它等于逆着庄家的钱袋开炮
为啥敢多?看盘面说话:
1️⃣ 从0.0068拉到0.0314,翻了3倍多,但回调没破关键位——回落到0.0164就被买回来,今天又站回0.0217,说明拉完不是跑,是洗
2️⃣ 持仓量947M持续走高:拉盘之后的回调阶段,钱没撤,主力还在场内占着位置
3️⃣ OBV回踩MA(7)被撑住:资金流没有出货的走法,是典型的涨太多→甩掉追多的→再往上走
它接下来的剧本:
暴力拉升→回调喂料→横盘磨掉没耐心的人→二次冲前高。现在就在“磨”这个阶段,0.0314那根针不是终点,是下一次要捅破的窗户纸。
纪律:
• 0.0195~0.0205再进,提前进就多扛一段洗盘
• 跌破0.0172认错——那说明这波拉盘是真的结束了
• 二次冲前高如果放巨量站不稳,多单先落袋,别贪
一句话: 3倍行情后的回调不是让你逃命的,是给你二次上车的票。拿住0.0195~0.0205这个位置,吃到0.0314那一程。
(个人观点不构成建议,管好仓位)
2
·
--
See translation
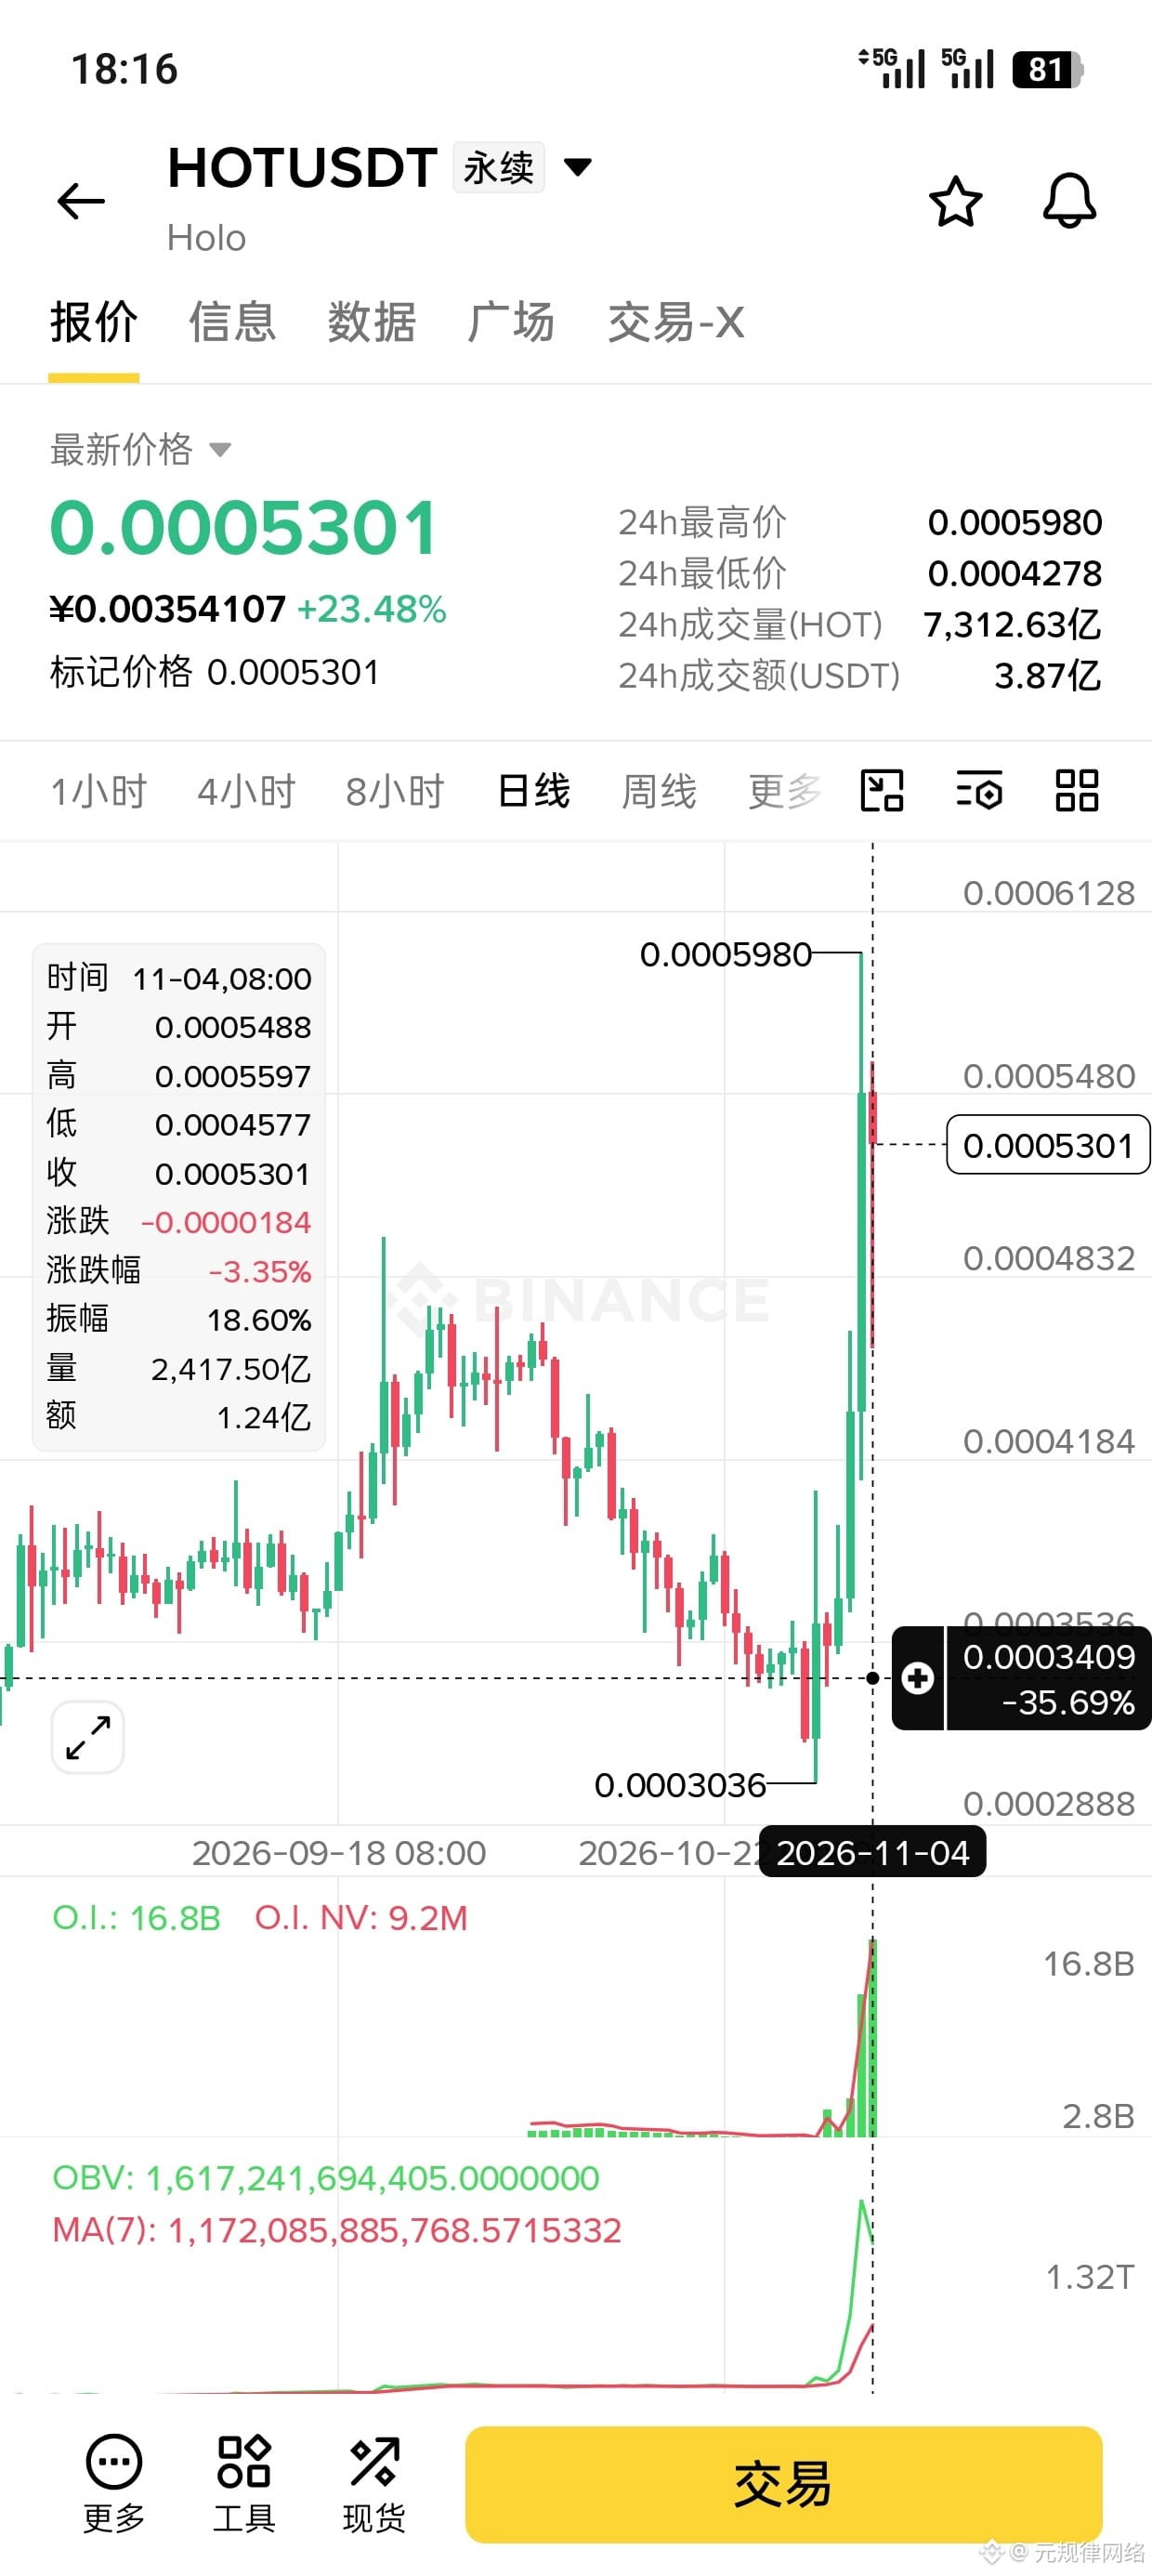
$HOT 🚨HOT一小时拉了近100%?庄家试盘呢,散户别当真
看到这根针先别喊牛市。0.0003036→0.000598,一小时翻倍,然后瞬间砸回0.00053——冲上去又砸下来,说明上方全是抛压,庄家自己都没敢接。
我的计划:
✅ 空单等反抽0.00056~0.000585进场,止损0.00062,目标0.00045→0.00038
❌ 现在追多?你是去给庄家送流动性的
❌ 立刻空?这种V型针下面还有余震,等它回抽再动手
为啥判定是出货不是启动:
• 持仓量16.8B,直接暴力拉升——今天进场的多单规模是平时的好几倍,谁在接?庄家在给
• 那根长上影针就是答案:拉到0.000598有人疯狂砸盘,硬生生砸回来。真突破不会长这样
• HOT这盘子常年半死不活,没有基本面配合,突然暴拉唯一的解释就是:有人需要流动性出货
它后面的剧本:
暴拉→回落→横住喂料→“突破失败”再砸一波。追多的现在被套在0.00055上方,他们一割肉,价格还会下去一趟。
纪律:
• 反抽到位再空,别在半山腰接
• 破0.00062认错——如果它真站稳了,说明这盘子有新故事,空单撤
• 这种合约仓位减半,振幅20%的盘子,正常仓位扛不住一次插针
一句话: 一小时翻倍再砸回来,不是机会,是钓鱼。鱼饵是+97%,鱼钩在0.00058等你。
(个人观点不构成建议,管好仓位)
$HOT 🚨HOT一小时拉了近100%?庄家试盘呢,散户别当真
看到这根针先别喊牛市。0.0003036→0.000598,一小时翻倍,然后瞬间砸回0.00053——冲上去又砸下来,说明上方全是抛压,庄家自己都没敢接。
我的计划:
✅ 空单等反抽0.00056~0.000585进场,止损0.00062,目标0.00045→0.00038
❌ 现在追多?你是去给庄家送流动性的
❌ 立刻空?这种V型针下面还有余震,等它回抽再动手
为啥判定是出货不是启动:
• 持仓量16.8B,直接暴力拉升——今天进场的多单规模是平时的好几倍,谁在接?庄家在给
• 那根长上影针就是答案:拉到0.000598有人疯狂砸盘,硬生生砸回来。真突破不会长这样
• HOT这盘子常年半死不活,没有基本面配合,突然暴拉唯一的解释就是:有人需要流动性出货
它后面的剧本:
暴拉→回落→横住喂料→“突破失败”再砸一波。追多的现在被套在0.00055上方,他们一割肉,价格还会下去一趟。
纪律:
• 反抽到位再空,别在半山腰接
• 破0.00062认错——如果它真站稳了,说明这盘子有新故事,空单撤
• 这种合约仓位减半,振幅20%的盘子,正常仓位扛不住一次插针
一句话: 一小时翻倍再砸回来,不是机会,是钓鱼。鱼饵是+97%,鱼钩在0.00058等你。
(个人观点不构成建议,管好仓位)
看到这根针先别喊牛市。0.0003036→0.000598,一小时翻倍,然后瞬间砸回0.00053——冲上去又砸下来,说明上方全是抛压,庄家自己都没敢接。
我的计划:
✅ 空单等反抽0.00056~0.000585进场,止损0.00062,目标0.00045→0.00038
❌ 现在追多?你是去给庄家送流动性的
❌ 立刻空?这种V型针下面还有余震,等它回抽再动手
为啥判定是出货不是启动:
• 持仓量16.8B,直接暴力拉升——今天进场的多单规模是平时的好几倍,谁在接?庄家在给
• 那根长上影针就是答案:拉到0.000598有人疯狂砸盘,硬生生砸回来。真突破不会长这样
• HOT这盘子常年半死不活,没有基本面配合,突然暴拉唯一的解释就是:有人需要流动性出货
它后面的剧本:
暴拉→回落→横住喂料→“突破失败”再砸一波。追多的现在被套在0.00055上方,他们一割肉,价格还会下去一趟。
纪律:
• 反抽到位再空,别在半山腰接
• 破0.00062认错——如果它真站稳了,说明这盘子有新故事,空单撤
• 这种合约仓位减半,振幅20%的盘子,正常仓位扛不住一次插针
一句话: 一小时翻倍再砸回来,不是机会,是钓鱼。鱼饵是+97%,鱼钩在0.00058等你。
(个人观点不构成建议,管好仓位)
2
·
--
See translation
$CLANKER 🚨CLANKER一天+32%,别激动—这是死猫跳,做空😅
怎么做:
✅ 空单等反抽16~17.5进场,止损18.5,目标12→10.5,盈亏比1:2.5
❌ 别追多:一天+32%,你冲进去就是庄家的接盘侠
❌ 别急着空:垂死反弹还有余劲,等反抽到位再动手
为啥敢空?看三个硬数据:
1️⃣ 案底太重:从94砸到10.44,跌了89%,一路阴跌没有任何像样的承接——这盘子已经在ICU躺了半年
2️⃣ 持仓量异动:O.I.从12万暴拉到22.9万,直接翻倍——今天冲进来的全是新多单,庄家等的就是这个
3️⃣ OBV垂直起飞但价格没跟上:量全砸在低位反弹这根针上,典型的诱多放量
它接下来怎么走:
剧本和所有死币一样:横尸半年→突然拉一根大阳线上热搜→散户FOMO进场→庄家把手里的低价筹码往你头上倒。反弹不是复活,是清仓大甩卖。
纪律:
• 16~17.5再空,现在追空也是接飞刀
• 止损18.5,真站上去了说明有新故事,认错离场
• 仓位轻,妖币波动大,48%的日振幅能把你来回打脸
一句话: 一年跌89%的盘子突然涨32%,不是起死回生,是回光返照。别人贪婪,我掏小本本——等反抽,挂空单。
(个人观点不构成建议,管好仓位)#BTC
$CLANKER 🚨CLANKER一天+32%,别激动—这是死猫跳,做空😅
怎么做:
✅ 空单等反抽16~17.5进场,止损18.5,目标12→10.5,盈亏比1:2.5
❌ 别追多:一天+32%,你冲进去就是庄家的接盘侠
❌ 别急着空:垂死反弹还有余劲,等反抽到位再动手
为啥敢空?看三个硬数据:
1️⃣ 案底太重:从94砸到10.44,跌了89%,一路阴跌没有任何像样的承接——这盘子已经在ICU躺了半年
2️⃣ 持仓量异动:O.I.从12万暴拉到22.9万,直接翻倍——今天冲进来的全是新多单,庄家等的就是这个
3️⃣ OBV垂直起飞但价格没跟上:量全砸在低位反弹这根针上,典型的诱多放量
它接下来怎么走:
剧本和所有死币一样:横尸半年→突然拉一根大阳线上热搜→散户FOMO进场→庄家把手里的低价筹码往你头上倒。反弹不是复活,是清仓大甩卖。
纪律:
• 16~17.5再空,现在追空也是接飞刀
• 止损18.5,真站上去了说明有新故事,认错离场
• 仓位轻,妖币波动大,48%的日振幅能把你来回打脸
一句话: 一年跌89%的盘子突然涨32%,不是起死回生,是回光返照。别人贪婪,我掏小本本——等反抽,挂空单。
(个人观点不构成建议,管好仓位)#BTC
怎么做:
✅ 空单等反抽16~17.5进场,止损18.5,目标12→10.5,盈亏比1:2.5
❌ 别追多:一天+32%,你冲进去就是庄家的接盘侠
❌ 别急着空:垂死反弹还有余劲,等反抽到位再动手
为啥敢空?看三个硬数据:
1️⃣ 案底太重:从94砸到10.44,跌了89%,一路阴跌没有任何像样的承接——这盘子已经在ICU躺了半年
2️⃣ 持仓量异动:O.I.从12万暴拉到22.9万,直接翻倍——今天冲进来的全是新多单,庄家等的就是这个
3️⃣ OBV垂直起飞但价格没跟上:量全砸在低位反弹这根针上,典型的诱多放量
它接下来怎么走:
剧本和所有死币一样:横尸半年→突然拉一根大阳线上热搜→散户FOMO进场→庄家把手里的低价筹码往你头上倒。反弹不是复活,是清仓大甩卖。
纪律:
• 16~17.5再空,现在追空也是接飞刀
• 止损18.5,真站上去了说明有新故事,认错离场
• 仓位轻,妖币波动大,48%的日振幅能把你来回打脸
一句话: 一年跌89%的盘子突然涨32%,不是起死回生,是回光返照。别人贪婪,我掏小本本——等反抽,挂空单。
(个人观点不构成建议,管好仓位)#BTC
2
·
--
$ZEC 🚨Big money hasn’t left. The pullback is a gift-wrapped entry point! 🤑
What you should do:
✅ Buy the pullback at 1130–1160, stop-loss at 1085, targets: 1345 → 1450 → 1600. Risk/reward ratio: 1:3
❌ Don’t chase: jumping in at 1288 leaves you with a distant stop-loss and makes it easy to get shaken out
❌ Don’t short: trying to call the top in a bull market is like stepping in front of a car
Why am I confident about going long? Three solid data points:
1️⃣ Buyers step in on pullbacks: In October, the price dropped to around 1150 and was bought back above 1200 both times. It can’t seem to fall further, suggesting big money hasn’t exited. A real trend isn’t just a one-day pump
2️⃣ Open interest is holding steady at 420,000: After a month of sideways trading, there’s no sign of an exodus. The big players are still in the market
3️⃣ OBV is hugging its moving average and building strength: This doesn’t look like heavy-volume selling—it looks like a breather
What happens next:
After doubling from 788 to 1699, the price has spent a month moving sideways and shaking out weak hands. The previous high at 1699 is a magnet. The longer it consolidates, the more energy it builds to break through that high. The current +12% is just the beginning.
Discipline:
• Wait for another entry at 1130–1160. Those chasing higher prices are just carrying the big players
• If it decisively breaks below 1085, admit you’re wrong and exit—that’s the real signal of a top
In short: The ZEC train hasn’t reached its destination. Don’t chase it mid-journey; wait for it to pull into the station (a pullback), then get on and ride it to 1699.
(Personal opinion, not investment advice. Manage your position size.) #BTC
$ZEC 🚨Big money hasn’t left. The pullback is a gift-wrapped entry point! 🤑
What you should do:
✅ Buy the pullback at 1130–1160, stop-loss at 1085, targets: 1345 → 1450 → 1600. Risk/reward ratio: 1:3
❌ Don’t chase: jumping in at 1288 leaves you with a distant stop-loss and makes it easy to get shaken out
❌ Don’t short: trying to call the top in a bull market is like stepping in front of a car
Why am I confident about going long? Three solid data points:
1️⃣ Buyers step in on pullbacks: In October, the price dropped to around 1150 and was bought back above 1200 both times. It can’t seem to fall further, suggesting big money hasn’t exited. A real trend isn’t just a one-day pump
2️⃣ Open interest is holding steady at 420,000: After a month of sideways trading, there’s no sign of an exodus. The big players are still in the market
3️⃣ OBV is hugging its moving average and building strength: This doesn’t look like heavy-volume selling—it looks like a breather
What happens next:
After doubling from 788 to 1699, the price has spent a month moving sideways and shaking out weak hands. The previous high at 1699 is a magnet. The longer it consolidates, the more energy it builds to break through that high. The current +12% is just the beginning.
Discipline:
• Wait for another entry at 1130–1160. Those chasing higher prices are just carrying the big players
• If it decisively breaks below 1085, admit you’re wrong and exit—that’s the real signal of a top
In short: The ZEC train hasn’t reached its destination. Don’t chase it mid-journey; wait for it to pull into the station (a pullback), then get on and ride it to 1699.
(Personal opinion, not investment advice. Manage your position size.) #BTC
What you should do:
✅ Buy the pullback at 1130–1160, stop-loss at 1085, targets: 1345 → 1450 → 1600. Risk/reward ratio: 1:3
❌ Don’t chase: jumping in at 1288 leaves you with a distant stop-loss and makes it easy to get shaken out
❌ Don’t short: trying to call the top in a bull market is like stepping in front of a car
Why am I confident about going long? Three solid data points:
1️⃣ Buyers step in on pullbacks: In October, the price dropped to around 1150 and was bought back above 1200 both times. It can’t seem to fall further, suggesting big money hasn’t exited. A real trend isn’t just a one-day pump
2️⃣ Open interest is holding steady at 420,000: After a month of sideways trading, there’s no sign of an exodus. The big players are still in the market
3️⃣ OBV is hugging its moving average and building strength: This doesn’t look like heavy-volume selling—it looks like a breather
What happens next:
After doubling from 788 to 1699, the price has spent a month moving sideways and shaking out weak hands. The previous high at 1699 is a magnet. The longer it consolidates, the more energy it builds to break through that high. The current +12% is just the beginning.
Discipline:
• Wait for another entry at 1130–1160. Those chasing higher prices are just carrying the big players
• If it decisively breaks below 1085, admit you’re wrong and exit—that’s the real signal of a top
In short: The ZEC train hasn’t reached its destination. Don’t chase it mid-journey; wait for it to pull into the station (a pullback), then get on and ride it to 1699.
(Personal opinion, not investment advice. Manage your position size.) #BTC
696
·
--
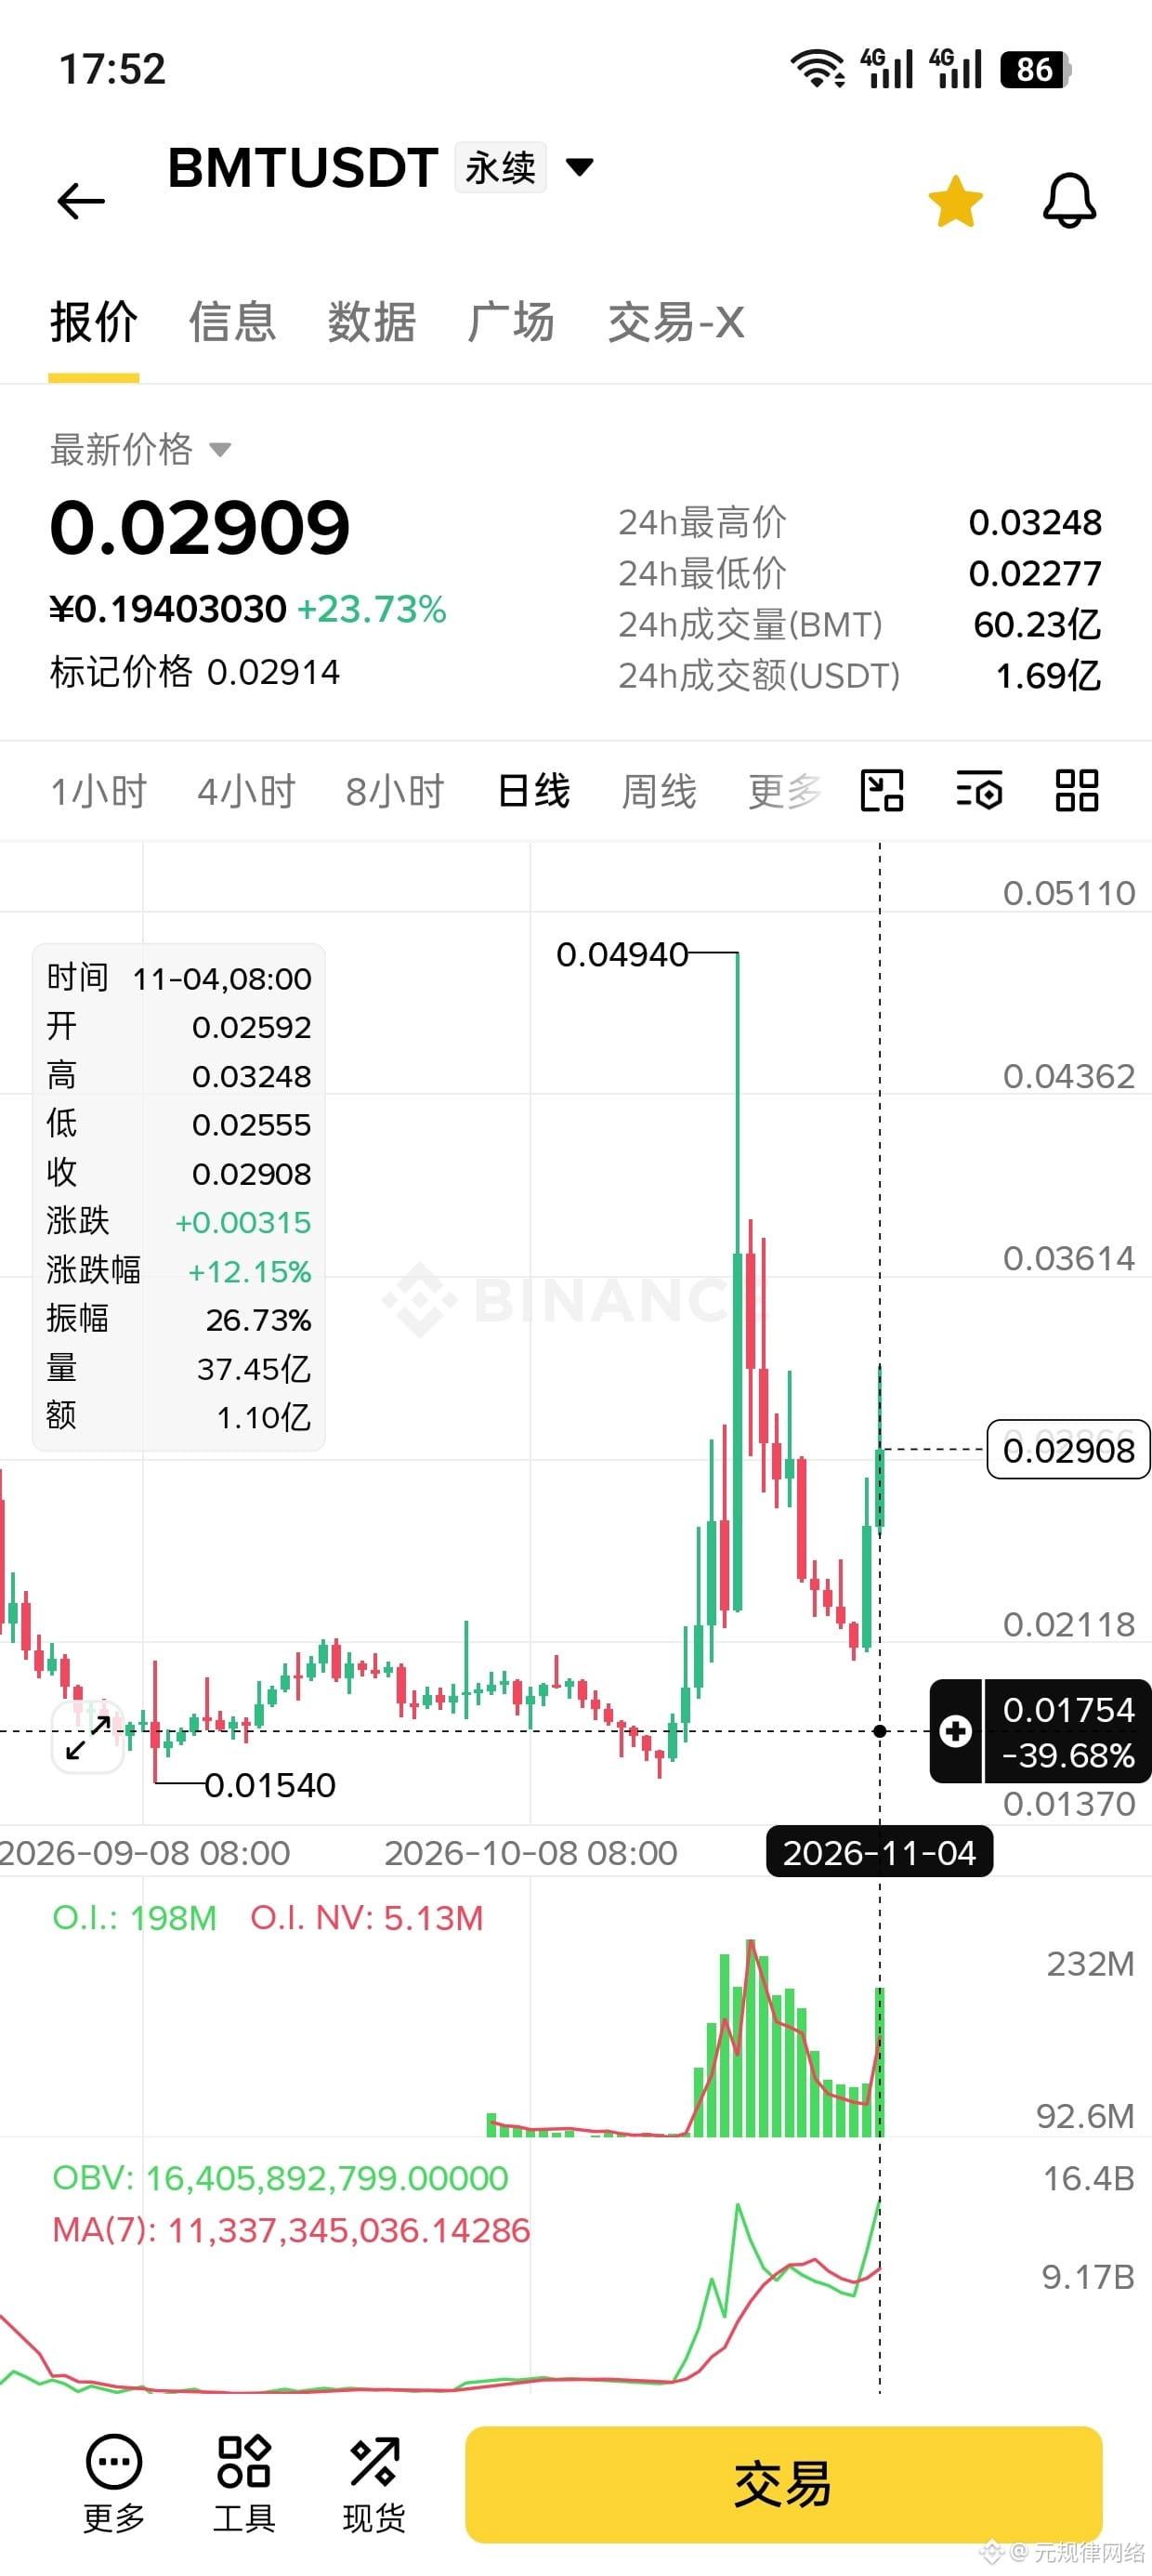
$BMT 🚨BMT’s market makers are hooked on bleeding retail traders dry
What kind of coin is this? An old familiar face: dumped from 0.05 to 0.015, wiping out 70%. The grass on its grave is already two meters tall. Today it bounced back to 0.029, up 24%, while open interest soared from 90 million to 200 million—the fresh retail money is in, and the market makers are grinning from ear to ear.
How are they manipulating it? Same script, second performance. Last time: pump it up → dump 70% → job done. This time: they’ve just printed the first green candle. That candle is bait, meant to hook you as you chase the pump.
What to do:
❌ Go long? Only thinking of jumping in after a 24% pump? The guys left holding the bag at 0.049 last time thought the same thing.
❌ Buy the dip? They haven’t finished digging the bottom yet.
✅ Hold off on shorting: wait for a rebound to 0.031–0.033, then enter. Stop-loss at 0.0365; targets: 0.0255 → 0.021 → 0.015.
If it holds above 0.036, I’ll admit I was wrong—it really is in love.
In a nutshell: Today’s big green candle isn’t the market makers giving you free money; it’s them digging a pit for you. When others are fearful, I’m greedy; when others are greedy—I pull out my little notebook and get ready to short.
$BMT 🚨BMT’s market makers are hooked on bleeding retail traders dry
What kind of coin is this? An old familiar face: dumped from 0.05 to 0.015, wiping out 70%. The grass on its grave is already two meters tall. Today it bounced back to 0.029, up 24%, while open interest soared from 90 million to 200 million—the fresh retail money is in, and the market makers are grinning from ear to ear.
How are they manipulating it? Same script, second performance. Last time: pump it up → dump 70% → job done. This time: they’ve just printed the first green candle. That candle is bait, meant to hook you as you chase the pump.
What to do:
❌ Go long? Only thinking of jumping in after a 24% pump? The guys left holding the bag at 0.049 last time thought the same thing.
❌ Buy the dip? They haven’t finished digging the bottom yet.
✅ Hold off on shorting: wait for a rebound to 0.031–0.033, then enter. Stop-loss at 0.0365; targets: 0.0255 → 0.021 → 0.015.
If it holds above 0.036, I’ll admit I was wrong—it really is in love.
In a nutshell: Today’s big green candle isn’t the market makers giving you free money; it’s them digging a pit for you. When others are fearful, I’m greedy; when others are greedy—I pull out my little notebook and get ready to short.
What kind of coin is this? An old familiar face: dumped from 0.05 to 0.015, wiping out 70%. The grass on its grave is already two meters tall. Today it bounced back to 0.029, up 24%, while open interest soared from 90 million to 200 million—the fresh retail money is in, and the market makers are grinning from ear to ear.
How are they manipulating it? Same script, second performance. Last time: pump it up → dump 70% → job done. This time: they’ve just printed the first green candle. That candle is bait, meant to hook you as you chase the pump.
What to do:
❌ Go long? Only thinking of jumping in after a 24% pump? The guys left holding the bag at 0.049 last time thought the same thing.
❌ Buy the dip? They haven’t finished digging the bottom yet.
✅ Hold off on shorting: wait for a rebound to 0.031–0.033, then enter. Stop-loss at 0.0365; targets: 0.0255 → 0.021 → 0.015.
If it holds above 0.036, I’ll admit I was wrong—it really is in love.
In a nutshell: Today’s big green candle isn’t the market makers giving you free money; it’s them digging a pit for you. When others are fearful, I’m greedy; when others are greedy—I pull out my little notebook and get ready to short.
2
·
--
AIN verdict: #AIN (a notorious scammer)
Five days consolidating near the top doesn't mean strength—it's distribution.
Let's do the math first:
Open interest: 251M; 24h trading volume: only 73.88M. Ratio ≈3.4—a prime harvesting zone, with ammo fully loaded.
What's the story behind this token?
① On September 16, it flash-crashed 86.5% in a single day. The team blamed a “technical error”—they have a track record;
② In October, they announced a 3M U buyback, then pumped it 280% in a week. For a micro-cap worth 25M, a buyback is just a game of moving money from one hand to the other;
③ Since October 13, the team has made no announcements and only changed the code name—operations by way of going AWOL;
④ Two data sites report different circulating supplies (185M vs. 319M)—they can dump as much as they want;
⑤ 24h trading volume is over 3 times market cap—a purely speculative play.
Three charges from the chart:
① A 10x flagpole, from 0.034 to 0.34;
② It moved sideways at the top, between 0.26 and 0.29, for five days, with daily swings of 8–15%. O.I. stayed pinned and didn't fall; OBV flattened—no new money, just existing holders distributing;
③ Rebound highs are already declining: 0.34 → 0.3088 → 0.287.
Let's focus on this “consolidating near the top for several days” part:
The show was already over the day it reached 0.34. Every day it moved sideways afterward, the insiders were selling their tokens bit by bit to people thinking, “It can't fall any further; it should still go up.” The longer it consolidates, the more buyers get trapped—and the harder the dump.
Trade parameters:
Short entry zone: 0.270–0.287 (enter on a bounce; don't chase the current price)
Stop-loss: 0.312
Targets: 0.22 → 0.19 → 0.15
Risk/reward ratio: about 1:2.7—acceptable
Invalidation: if it holds above 0.31 on high volume, the verdict is void
Long side: completely off-limits. A 10x flagpole + a history of flash crashes + a team that's gone AWOL—buying the dip is catching a falling knife by the blade.
Bottom line: It isn't strong because it's moving sideways; it's patiently selling. The flagpole didn't rise—it was hoisted up, waiting to be chopped down.
(Not investment advice. Futures trading carries risks.)
AIN verdict: #AIN (a notorious scammer)
Five days consolidating near the top doesn't mean strength—it's distribution.
Let's do the math first:
Open interest: 251M; 24h trading volume: only 73.88M. Ratio ≈3.4—a prime harvesting zone, with ammo fully loaded.
What's the story behind this token?
① On September 16, it flash-crashed 86.5% in a single day. The team blamed a “technical error”—they have a track record;
② In October, they announced a 3M U buyback, then pumped it 280% in a week. For a micro-cap worth 25M, a buyback is just a game of moving money from one hand to the other;
③ Since October 13, the team has made no announcements and only changed the code name—operations by way of going AWOL;
④ Two data sites report different circulating supplies (185M vs. 319M)—they can dump as much as they want;
⑤ 24h trading volume is over 3 times market cap—a purely speculative play.
Three charges from the chart:
① A 10x flagpole, from 0.034 to 0.34;
② It moved sideways at the top, between 0.26 and 0.29, for five days, with daily swings of 8–15%. O.I. stayed pinned and didn't fall; OBV flattened—no new money, just existing holders distributing;
③ Rebound highs are already declining: 0.34 → 0.3088 → 0.287.
Let's focus on this “consolidating near the top for several days” part:
The show was already over the day it reached 0.34. Every day it moved sideways afterward, the insiders were selling their tokens bit by bit to people thinking, “It can't fall any further; it should still go up.” The longer it consolidates, the more buyers get trapped—and the harder the dump.
Trade parameters:
Short entry zone: 0.270–0.287 (enter on a bounce; don't chase the current price)
Stop-loss: 0.312
Targets: 0.22 → 0.19 → 0.15
Risk/reward ratio: about 1:2.7—acceptable
Invalidation: if it holds above 0.31 on high volume, the verdict is void
Long side: completely off-limits. A 10x flagpole + a history of flash crashes + a team that's gone AWOL—buying the dip is catching a falling knife by the blade.
Bottom line: It isn't strong because it's moving sideways; it's patiently selling. The flagpole didn't rise—it was hoisted up, waiting to be chopped down.
(Not investment advice. Futures trading carries risks.)
Five days consolidating near the top doesn't mean strength—it's distribution.
Let's do the math first:
Open interest: 251M; 24h trading volume: only 73.88M. Ratio ≈3.4—a prime harvesting zone, with ammo fully loaded.
What's the story behind this token?
① On September 16, it flash-crashed 86.5% in a single day. The team blamed a “technical error”—they have a track record;
② In October, they announced a 3M U buyback, then pumped it 280% in a week. For a micro-cap worth 25M, a buyback is just a game of moving money from one hand to the other;
③ Since October 13, the team has made no announcements and only changed the code name—operations by way of going AWOL;
④ Two data sites report different circulating supplies (185M vs. 319M)—they can dump as much as they want;
⑤ 24h trading volume is over 3 times market cap—a purely speculative play.
Three charges from the chart:
① A 10x flagpole, from 0.034 to 0.34;
② It moved sideways at the top, between 0.26 and 0.29, for five days, with daily swings of 8–15%. O.I. stayed pinned and didn't fall; OBV flattened—no new money, just existing holders distributing;
③ Rebound highs are already declining: 0.34 → 0.3088 → 0.287.
Let's focus on this “consolidating near the top for several days” part:
The show was already over the day it reached 0.34. Every day it moved sideways afterward, the insiders were selling their tokens bit by bit to people thinking, “It can't fall any further; it should still go up.” The longer it consolidates, the more buyers get trapped—and the harder the dump.
Trade parameters:
Short entry zone: 0.270–0.287 (enter on a bounce; don't chase the current price)
Stop-loss: 0.312
Targets: 0.22 → 0.19 → 0.15
Risk/reward ratio: about 1:2.7—acceptable
Invalidation: if it holds above 0.31 on high volume, the verdict is void
Long side: completely off-limits. A 10x flagpole + a history of flash crashes + a team that's gone AWOL—buying the dip is catching a falling knife by the blade.
Bottom line: It isn't strong because it's moving sideways; it's patiently selling. The flagpole didn't rise—it was hoisted up, waiting to be chopped down.
(Not investment advice. Futures trading carries risks.)
4
911
·
--
$PIPPIN Is the short seller out of their mind? Trained to have a path dependence on shorting, just enter when lured, the dog owner only needs to control the market, and they can reap rewards until next year!
$PIPPIN Is the short seller out of their mind? Trained to have a path dependence on shorting, just enter when lured, the dog owner only needs to control the market, and they can reap rewards until next year!
3
475
·
--
$PIPPIN tail stage, forced short squeeze rapid explosion, will reverse and plummet, now both long and short are not suitable
$PIPPIN tail stage, forced short squeeze rapid explosion, will reverse and plummet, now both long and short are not suitable
2
435
·
--
$LUNA2 Dog Zhuang really has nothing to fry? Pick up the eternal trash to play with.
$LUNA2 Dog Zhuang really has nothing to fry? Pick up the eternal trash to play with.
1
450
·
--
Bullish
$XNY is considered a ruthless and decisive killer, pippin knelt down to lick the dick
$XNY is considered a ruthless and decisive killer, pippin knelt down to lick the dick
10
·
--
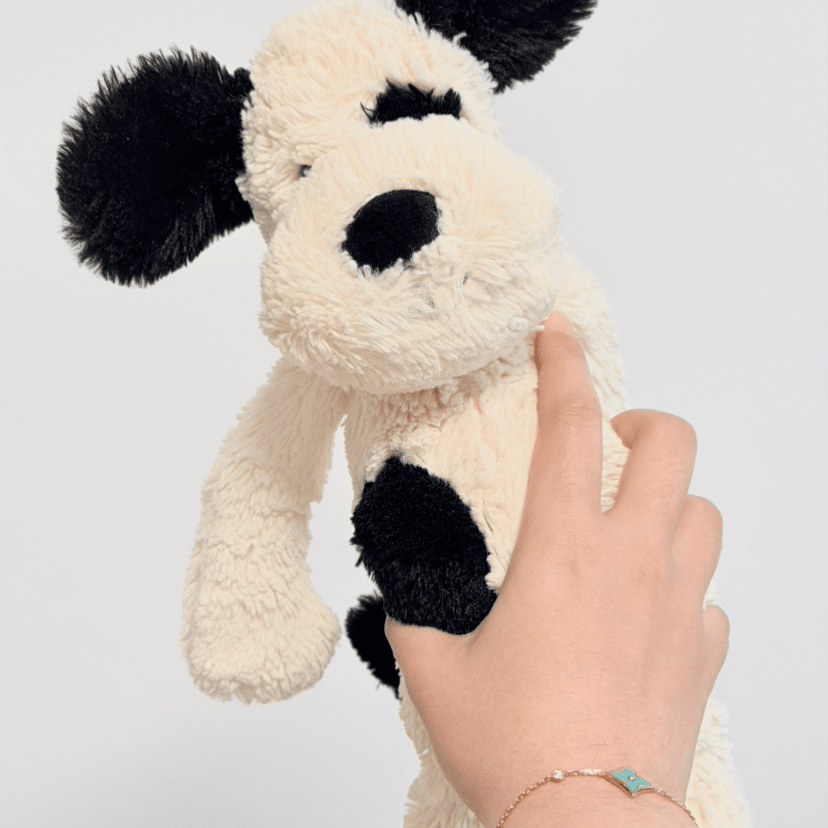
This is the dog pushing online gambling, and there is that loser Yan Chi.
This is the dog pushing online gambling, and there is that loser Yan Chi.
puppy go
·
--
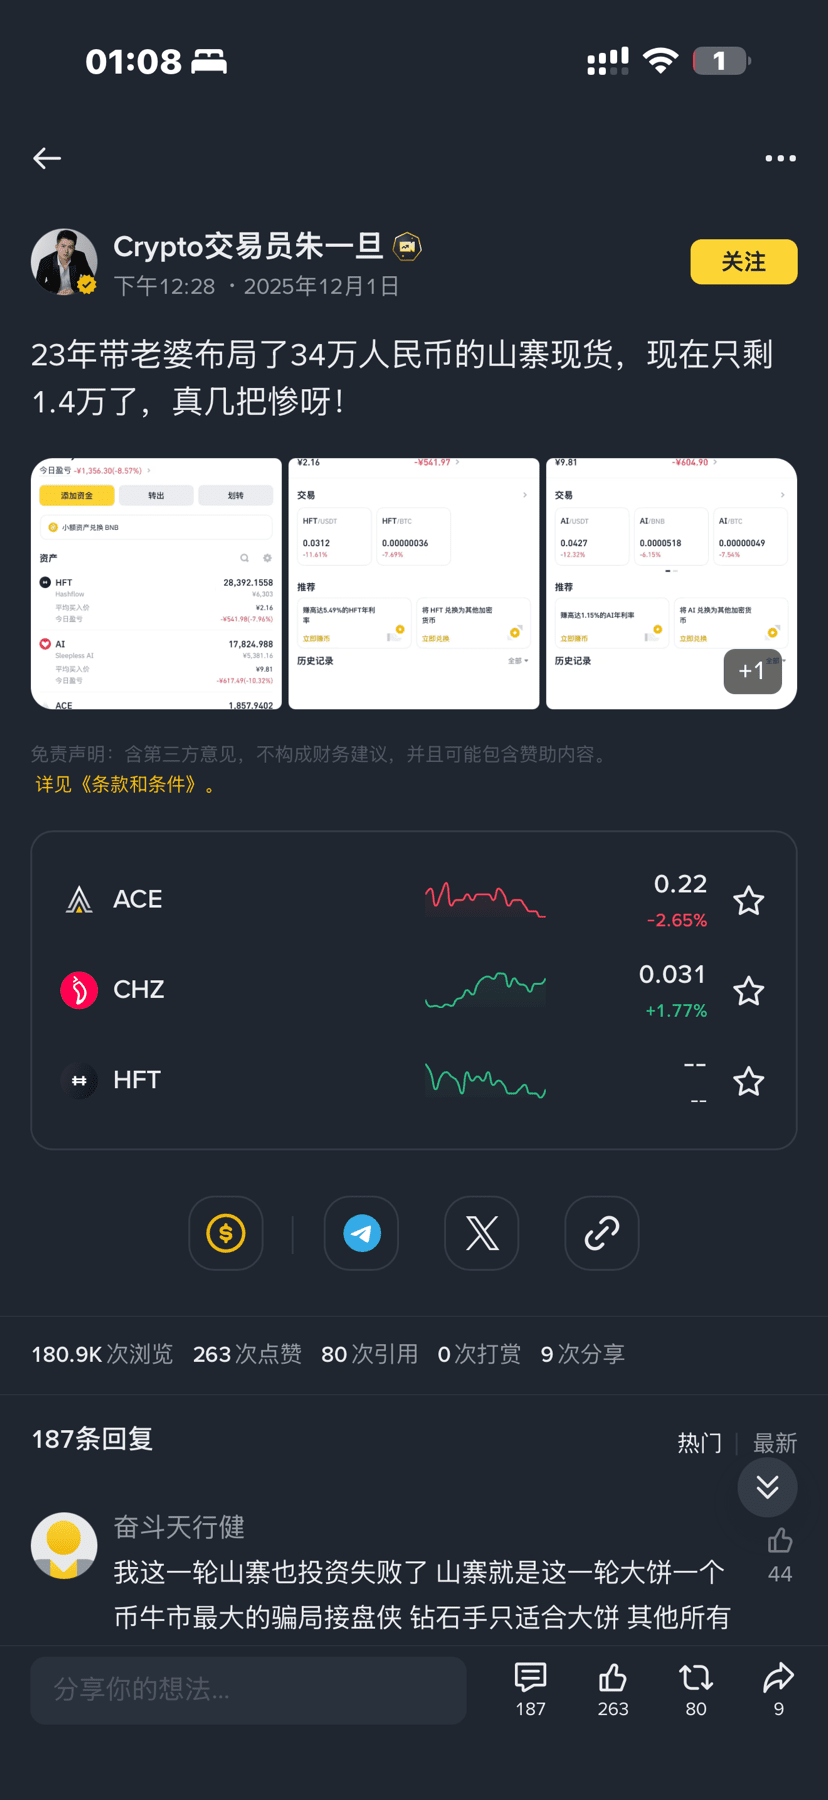
Who can explain! It's been a year and I haven't seen him make any money! Why can someone like this still be a KOL!
2
·
--
$PIPPIN fluctuating downwards, the dog owner will not give the bears a bit of meat to eat; as long as the bears build positions, they will counteract and continue to smash the market after the pull-up.
$PIPPIN fluctuating downwards, the dog owner will not give the bears a bit of meat to eat; as long as the bears build positions, they will counteract and continue to smash the market after the pull-up.
1
1
663
·
--
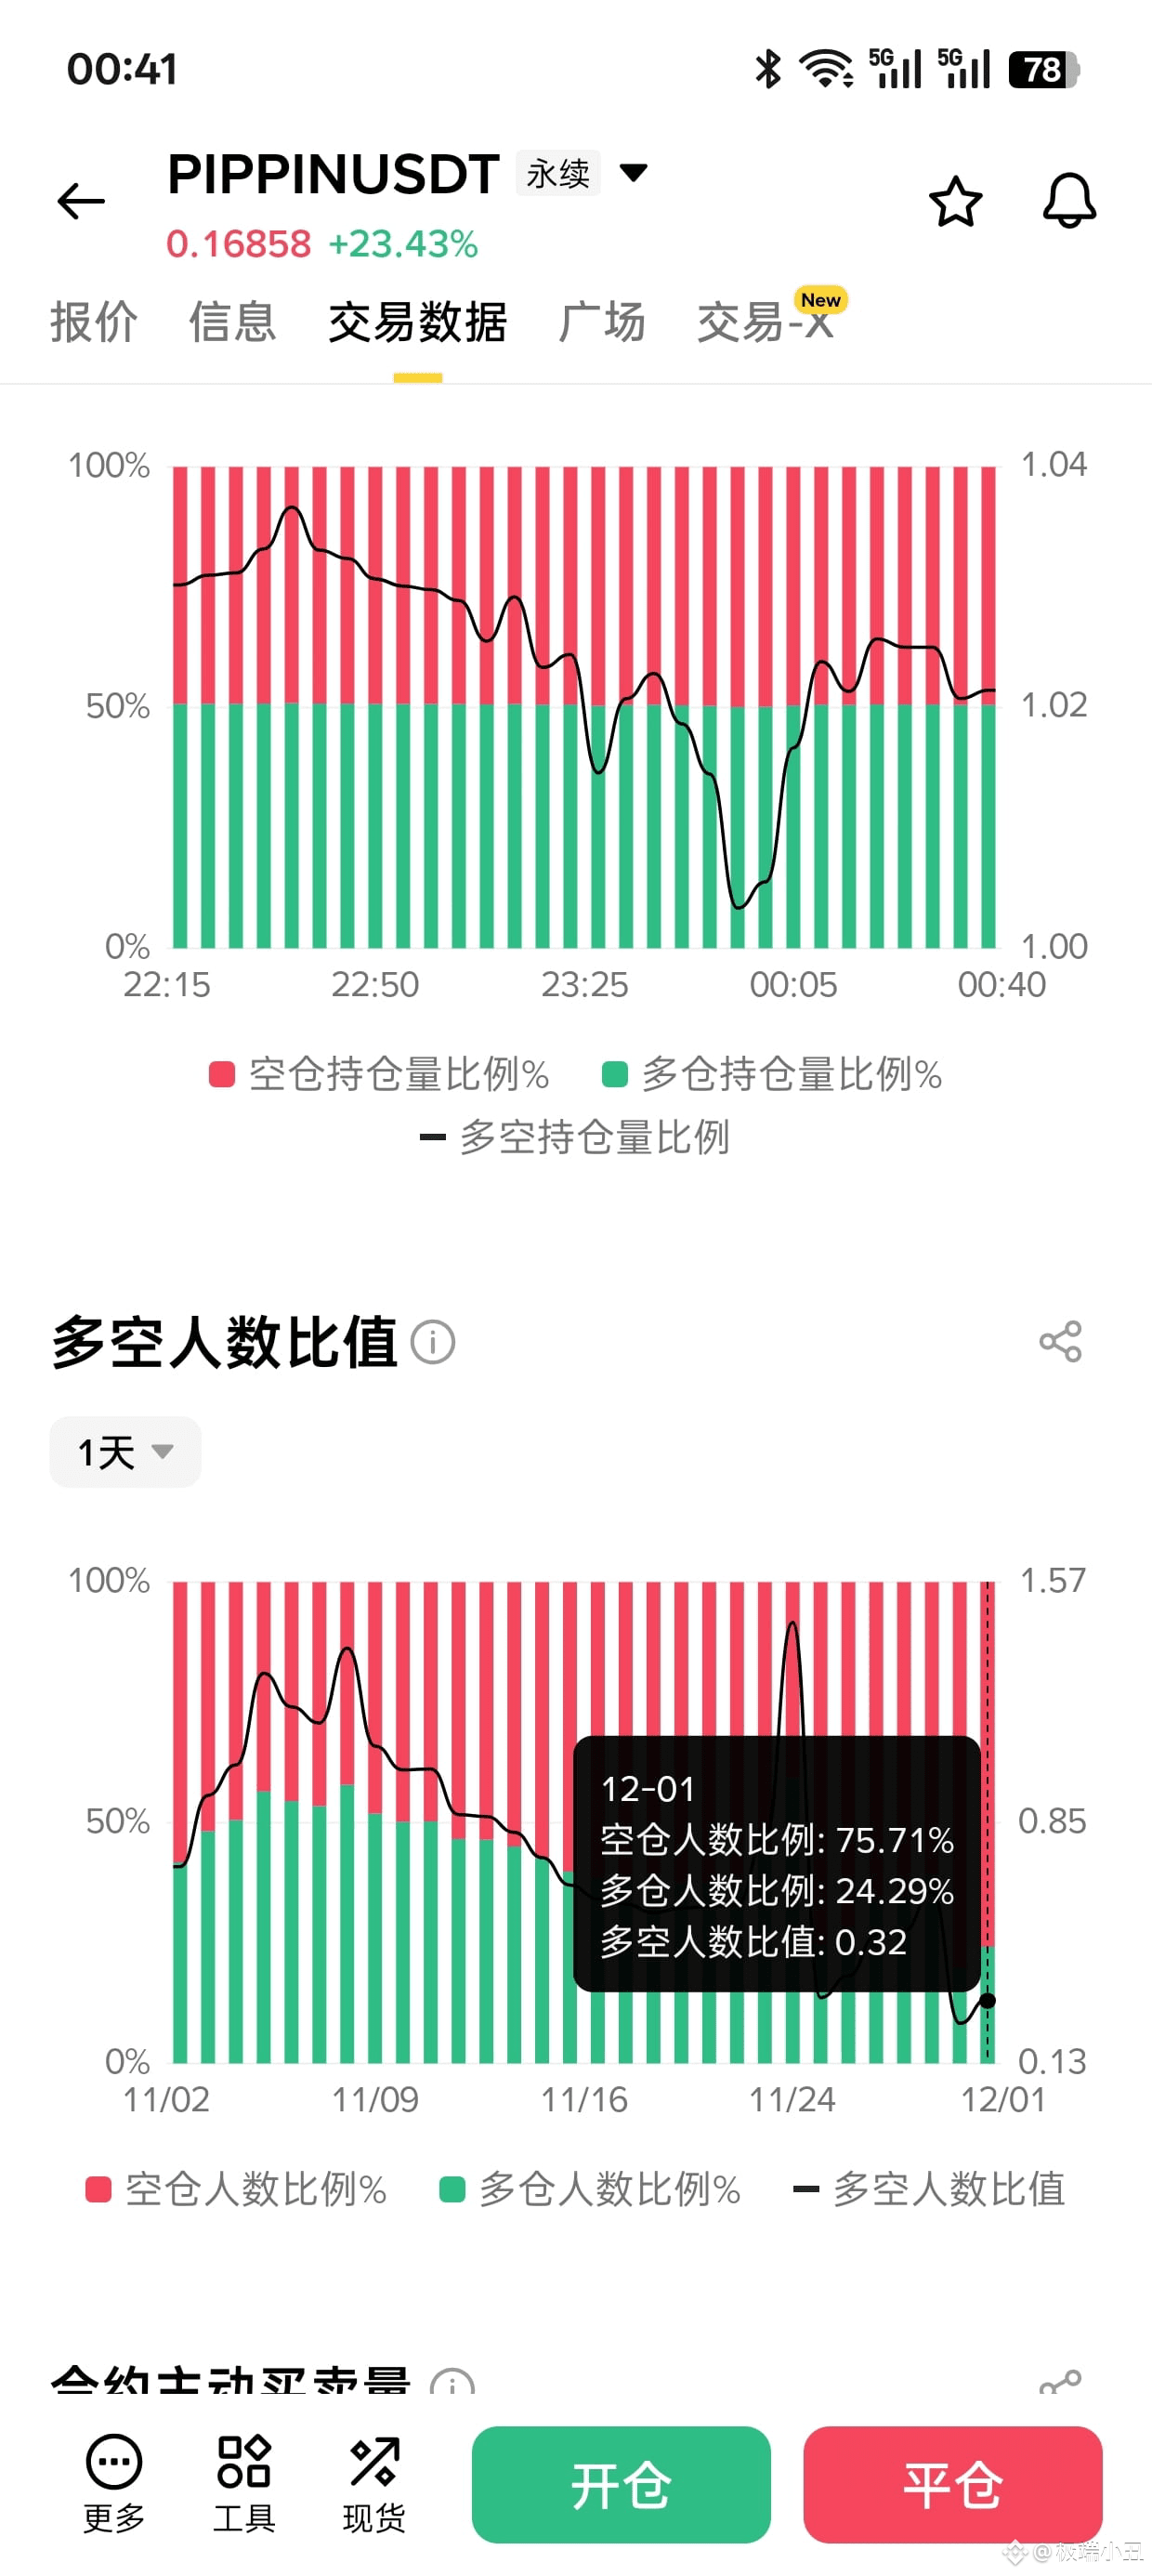
$PIPPIN Long-short ratio, the short accounts are already at 75%, the market makers do not care about the price, only about cutting liquidity. Therefore, all K-line data is fake, the points are the same, and the retail investors' money is gone for real.
$PIPPIN Long-short ratio, the short accounts are already at 75%, the market makers do not care about the price, only about cutting liquidity. Therefore, all K-line data is fake, the points are the same, and the retail investors' money is gone for real.
1
694
Log in to explore more content
Join global crypto users on Binance Square
⚡️ Get latest and useful information about crypto.
💬 Trusted by the world’s largest crypto exchange.
👍 Discover real insights from verified creators.
Email / Phone number
Trending Topics
CircleQ3Revenue865M
0 views
1 Discussing
TradFi News | Circle Q3 Revenue Climbs 17% to $865 Million on ARC Token Presale as Binance Takes $100 Million Stake
Binance News
·1 Likes
·227 views
USMidterms-WhatAreMarketsExpecting?
116,985 views
907 Discussing
USOctoberNFP-AreRateCutsStillPossible
262,692 views
2,035 Discussing