

Shoaib Official
40 Posts

Shoaib Official
Report
Block User
13 Following
52 Followers
74 Liked
Posts
Tokenized stocks are basically traditional stocks turned into blockchain-based digital tokens. Imagine Apple stock normally lives inside the traditional stock market, but now a token representing that stock can exist on a blockchain. This can allow people to trade it through blockchain platforms and, where supported, use it in DeFi applications. The important change is that people are moving beyond simply owning these tokens. They are trading them frequently, putting them into liquidity pools, using them as collateral to borrow money, and even trading them against crypto tokens. The numbers show how quickly this is developing: the active tokenized-stock market grew from around $965 million to $4 billion during 2026, while monthly trading volume exploded from $237 million to $7.9 billion. DeFi value connected to these stocks also jumped from $21.6 million to $289.1 million. So the big idea is simple: blockchain is turning stocks from assets that you mainly buy and hold into assets that can potentially interact with the wider crypto and DeFi ecosystem. This is part of the larger RWA (Real-World Assets) trend, where things from the traditional financial world are brought onto blockchain and given new digital uses.
Tokenized stocks are basically traditional stocks turned into blockchain-based digital tokens. Imagine Apple stock normally lives inside the traditional stock market, but now a token representing that stock can exist on a blockchain. This can allow people to trade it through blockchain platforms and, where supported, use it in DeFi applications. The important change is that people are moving beyond simply owning these tokens. They are trading them frequently, putting them into liquidity pools, using them as collateral to borrow money, and even trading them against crypto tokens. The numbers show how quickly this is developing: the active tokenized-stock market grew from around $965 million to $4 billion during 2026, while monthly trading volume exploded from $237 million to $7.9 billion. DeFi value connected to these stocks also jumped from $21.6 million to $289.1 million. So the big idea is simple: blockchain is turning stocks from assets that you mainly buy and hold into assets that can potentially interact with the wider crypto and DeFi ecosystem. This is part of the larger RWA (Real-World Assets) trend, where things from the traditional financial world are brought onto blockchain and given new digital uses.
1
67
Article
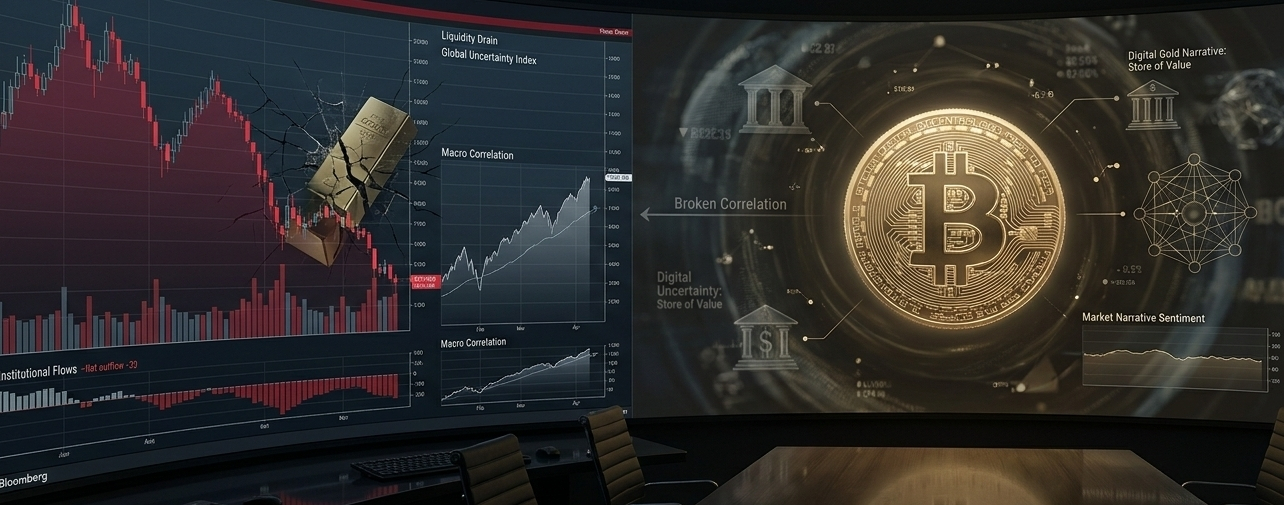
Bitcoin Fell 50 Percent. The Story About Bitcoin Barely Moved.Bitcoin dropped from a peak near $126,000 in October 2025 to the low $60,000s by July 2026, a decline of more than half. Traders had been waiting for altcoin season, the point where capital rotates out of Bitcoin and into smaller tokens once Bitcoin's dominance peaks. It never showed up. Prices fell in step with the rest of risk assets, correlated, not decoupled, not behaving like the safe haven the "digital gold" narrative had promised for years.
And yet almost none of the commentary around the crash questioned the story itself. Analysts explained the drop through macro conditions, liquidity, leverage unwinds, sentiment. All accurate. But the underlying claim, that Bitcoin behaves as an inflation hedge and flight-to-safety asset uncorrelated with equities, went largely unexamined even as the data undercut it. That gap between what happened and what people kept saying about what happened is the entire problem with narratives. They can survive contact with contradicting evidence for a long time, because a good story doesn't need to be true to keep circulating. It just needs to be repeatable.
This is not a crypto-specific problem. It shows up in every market, every industry, every strategy meeting where someone says "the data shows" and means "the story I already believed shows." But crypto makes the mechanism unusually visible, because narratives there move fast enough to test against reality within months instead of years. That makes it a useful place to build a habit that applies far beyond markets: knowing how to tell a fact from a narrative before you build a decision on top of it.
What a fact actually is
A fact is something you can verify independently of who is telling you about it. Bitcoin's price on a given date is a fact. The total value of stablecoins in circulation, which crossed $300 billion in 2026, is a fact. The growth of tokenized real-world assets outside of stablecoins, from roughly $5.4 billion in January 2025 to about $34 billion by July 2026, is a fact, and a fairly remarkable one, because that growth continued through the same drawdown that wiped out half of Bitcoin's price.
A narrative is a story built to explain facts, and it usually gets built before all the facts are in. "Bitcoin is digital gold" is a narrative. "Institutions are finally taking crypto seriously" is a narrative. Narratives are not automatically wrong. Some describe real mechanisms accurately. The RWA growth trend is genuinely tied to a shift in how capital is being allocated, with wealth managers and institutions increasingly evaluating tokens by usage and revenue rather than market cap rank. That is a narrative resting on real fact, which is exactly what makes the distinction hard. The dangerous narratives are not the obviously false ones. They are the ones that were true enough, often enough, that people stopped checking whether they still applied.
The test that actually works
Most people try to separate fact from narrative by asking whether something sounds credible. That is the wrong test, because narratives are optimized to sound credible. The better test is whether the claim survives a condition that should have broken it.
The digital gold narrative should have been tested by a period of macro stress and equity drawdown. It was, in the 2026 correction, and it failed the test. Bitcoin moved with risk assets, not against them. That is not a reason to abandon Bitcoin as an investment thesis. It is a reason to abandon that specific claim about its behavior, and to replace it with a more accurate one.
The RWA tokenization narrative faced its own stress test in the same period. If tokenized real-world assets were purely a byproduct of bull-market enthusiasm, the sector should have contracted alongside everything else once the market turned. It didn't. Growth continued through the downturn, which is the kind of evidence that upgrades a narrative into something closer to a fact-backed thesis.
That is the actual discipline: identify the specific claim inside a story, identify the condition that would disprove it, and then check whether that condition has already occurred. Most people skip this because it requires sitting with uncertainty for a moment, and stories are more comfortable than uncertainty.
Applying the fact-analysis-implication-speculation ladder
Once a claim has been tested, sort it correctly instead of treating it as one undifferentiated blob of "what's happening in the market." A fact is something directly verifiable, like a price, a supply figure, a regulatory deadline. An analysis is a reasonable interpretation built on that fact, such as concluding that stablecoin issuers compliant with the EU's MiCA framework picked up demand after the July 2026 deadline pushed out non-compliant tokens. An implication is what that interpretation suggests going forward, like regulatory clarity becoming a competitive advantage rather than a compliance cost. Speculation is everything beyond that: what might happen if the pattern continues, dependent on assumptions that haven't been tested yet.
Collapsing these categories into each other is how narratives get their power. A speculative claim dressed in the language of fact travels faster and gets believed more easily, precisely because the reader can't tell which category they're actually consuming.
Why this matters beyond markets
The instinct to check whether a claim has survived a real test, rather than just checking whether it sounds right, applies to strategy decisions, hiring narratives, product bets, and every "everyone knows" statement that circulates inside an organization. The market version is just easier to see because the test results show up in a price chart instead of a quarterly review three years later.
The reader who finishes a crash explainer thinking they understand what happened usually understands what people are saying about what happened. Those are different things, and the gap between them is where most bad decisions get made. The discipline is not cynicism about every claim. It's asking, before repeating a story, what fact it's standing on, and whether that fact has actually been tested by conditions that should have broken it.
Bitcoin Fell 50 Percent. The Story About Bitcoin Barely Moved.
Bitcoin dropped from a peak near $126,000 in October 2025 to the low $60,000s by July 2026, a decline of more than half. Traders had been waiting for altcoin season, the point where capital rotates out of Bitcoin and into smaller tokens once Bitcoin's dominance peaks. It never showed up. Prices fell in step with the rest of risk assets, correlated, not decoupled, not behaving like the safe haven the "digital gold" narrative had promised for years.
And yet almost none of the commentary around the crash questioned the story itself. Analysts explained the drop through macro conditions, liquidity, leverage unwinds, sentiment. All accurate. But the underlying claim, that Bitcoin behaves as an inflation hedge and flight-to-safety asset uncorrelated with equities, went largely unexamined even as the data undercut it. That gap between what happened and what people kept saying about what happened is the entire problem with narratives. They can survive contact with contradicting evidence for a long time, because a good story doesn't need to be true to keep circulating. It just needs to be repeatable.
This is not a crypto-specific problem. It shows up in every market, every industry, every strategy meeting where someone says "the data shows" and means "the story I already believed shows." But crypto makes the mechanism unusually visible, because narratives there move fast enough to test against reality within months instead of years. That makes it a useful place to build a habit that applies far beyond markets: knowing how to tell a fact from a narrative before you build a decision on top of it.
What a fact actually is
A fact is something you can verify independently of who is telling you about it. Bitcoin's price on a given date is a fact. The total value of stablecoins in circulation, which crossed $300 billion in 2026, is a fact. The growth of tokenized real-world assets outside of stablecoins, from roughly $5.4 billion in January 2025 to about $34 billion by July 2026, is a fact, and a fairly remarkable one, because that growth continued through the same drawdown that wiped out half of Bitcoin's price.
A narrative is a story built to explain facts, and it usually gets built before all the facts are in. "Bitcoin is digital gold" is a narrative. "Institutions are finally taking crypto seriously" is a narrative. Narratives are not automatically wrong. Some describe real mechanisms accurately. The RWA growth trend is genuinely tied to a shift in how capital is being allocated, with wealth managers and institutions increasingly evaluating tokens by usage and revenue rather than market cap rank. That is a narrative resting on real fact, which is exactly what makes the distinction hard. The dangerous narratives are not the obviously false ones. They are the ones that were true enough, often enough, that people stopped checking whether they still applied.
The test that actually works
Most people try to separate fact from narrative by asking whether something sounds credible. That is the wrong test, because narratives are optimized to sound credible. The better test is whether the claim survives a condition that should have broken it.
The digital gold narrative should have been tested by a period of macro stress and equity drawdown. It was, in the 2026 correction, and it failed the test. Bitcoin moved with risk assets, not against them. That is not a reason to abandon Bitcoin as an investment thesis. It is a reason to abandon that specific claim about its behavior, and to replace it with a more accurate one.
The RWA tokenization narrative faced its own stress test in the same period. If tokenized real-world assets were purely a byproduct of bull-market enthusiasm, the sector should have contracted alongside everything else once the market turned. It didn't. Growth continued through the downturn, which is the kind of evidence that upgrades a narrative into something closer to a fact-backed thesis.
That is the actual discipline: identify the specific claim inside a story, identify the condition that would disprove it, and then check whether that condition has already occurred. Most people skip this because it requires sitting with uncertainty for a moment, and stories are more comfortable than uncertainty.
Applying the fact-analysis-implication-speculation ladder
Once a claim has been tested, sort it correctly instead of treating it as one undifferentiated blob of "what's happening in the market." A fact is something directly verifiable, like a price, a supply figure, a regulatory deadline. An analysis is a reasonable interpretation built on that fact, such as concluding that stablecoin issuers compliant with the EU's MiCA framework picked up demand after the July 2026 deadline pushed out non-compliant tokens. An implication is what that interpretation suggests going forward, like regulatory clarity becoming a competitive advantage rather than a compliance cost. Speculation is everything beyond that: what might happen if the pattern continues, dependent on assumptions that haven't been tested yet.
Collapsing these categories into each other is how narratives get their power. A speculative claim dressed in the language of fact travels faster and gets believed more easily, precisely because the reader can't tell which category they're actually consuming.
Why this matters beyond markets
The instinct to check whether a claim has survived a real test, rather than just checking whether it sounds right, applies to strategy decisions, hiring narratives, product bets, and every "everyone knows" statement that circulates inside an organization. The market version is just easier to see because the test results show up in a price chart instead of a quarterly review three years later.
The reader who finishes a crash explainer thinking they understand what happened usually understands what people are saying about what happened. Those are different things, and the gap between them is where most bad decisions get made. The discipline is not cynicism about every claim. It's asking, before repeating a story, what fact it's standing on, and whether that fact has actually been tested by conditions that should have broken it.
And yet almost none of the commentary around the crash questioned the story itself. Analysts explained the drop through macro conditions, liquidity, leverage unwinds, sentiment. All accurate. But the underlying claim, that Bitcoin behaves as an inflation hedge and flight-to-safety asset uncorrelated with equities, went largely unexamined even as the data undercut it. That gap between what happened and what people kept saying about what happened is the entire problem with narratives. They can survive contact with contradicting evidence for a long time, because a good story doesn't need to be true to keep circulating. It just needs to be repeatable.
This is not a crypto-specific problem. It shows up in every market, every industry, every strategy meeting where someone says "the data shows" and means "the story I already believed shows." But crypto makes the mechanism unusually visible, because narratives there move fast enough to test against reality within months instead of years. That makes it a useful place to build a habit that applies far beyond markets: knowing how to tell a fact from a narrative before you build a decision on top of it.
What a fact actually is
A fact is something you can verify independently of who is telling you about it. Bitcoin's price on a given date is a fact. The total value of stablecoins in circulation, which crossed $300 billion in 2026, is a fact. The growth of tokenized real-world assets outside of stablecoins, from roughly $5.4 billion in January 2025 to about $34 billion by July 2026, is a fact, and a fairly remarkable one, because that growth continued through the same drawdown that wiped out half of Bitcoin's price.
A narrative is a story built to explain facts, and it usually gets built before all the facts are in. "Bitcoin is digital gold" is a narrative. "Institutions are finally taking crypto seriously" is a narrative. Narratives are not automatically wrong. Some describe real mechanisms accurately. The RWA growth trend is genuinely tied to a shift in how capital is being allocated, with wealth managers and institutions increasingly evaluating tokens by usage and revenue rather than market cap rank. That is a narrative resting on real fact, which is exactly what makes the distinction hard. The dangerous narratives are not the obviously false ones. They are the ones that were true enough, often enough, that people stopped checking whether they still applied.
The test that actually works
Most people try to separate fact from narrative by asking whether something sounds credible. That is the wrong test, because narratives are optimized to sound credible. The better test is whether the claim survives a condition that should have broken it.
The digital gold narrative should have been tested by a period of macro stress and equity drawdown. It was, in the 2026 correction, and it failed the test. Bitcoin moved with risk assets, not against them. That is not a reason to abandon Bitcoin as an investment thesis. It is a reason to abandon that specific claim about its behavior, and to replace it with a more accurate one.
The RWA tokenization narrative faced its own stress test in the same period. If tokenized real-world assets were purely a byproduct of bull-market enthusiasm, the sector should have contracted alongside everything else once the market turned. It didn't. Growth continued through the downturn, which is the kind of evidence that upgrades a narrative into something closer to a fact-backed thesis.
That is the actual discipline: identify the specific claim inside a story, identify the condition that would disprove it, and then check whether that condition has already occurred. Most people skip this because it requires sitting with uncertainty for a moment, and stories are more comfortable than uncertainty.
Applying the fact-analysis-implication-speculation ladder
Once a claim has been tested, sort it correctly instead of treating it as one undifferentiated blob of "what's happening in the market." A fact is something directly verifiable, like a price, a supply figure, a regulatory deadline. An analysis is a reasonable interpretation built on that fact, such as concluding that stablecoin issuers compliant with the EU's MiCA framework picked up demand after the July 2026 deadline pushed out non-compliant tokens. An implication is what that interpretation suggests going forward, like regulatory clarity becoming a competitive advantage rather than a compliance cost. Speculation is everything beyond that: what might happen if the pattern continues, dependent on assumptions that haven't been tested yet.
Collapsing these categories into each other is how narratives get their power. A speculative claim dressed in the language of fact travels faster and gets believed more easily, precisely because the reader can't tell which category they're actually consuming.
Why this matters beyond markets
The instinct to check whether a claim has survived a real test, rather than just checking whether it sounds right, applies to strategy decisions, hiring narratives, product bets, and every "everyone knows" statement that circulates inside an organization. The market version is just easier to see because the test results show up in a price chart instead of a quarterly review three years later.
The reader who finishes a crash explainer thinking they understand what happened usually understands what people are saying about what happened. Those are different things, and the gap between them is where most bad decisions get made. The discipline is not cynicism about every claim. It's asking, before repeating a story, what fact it's standing on, and whether that fact has actually been tested by conditions that should have broken it.
1
96
📅 Crypto Market Data Next Week 🚨
🔥 Monday — June 9, 2026
📊 No major US data
💡 Market may move slowly before big inflation reports.
━━━━━━━━━━━━━━
📅 Wednesday — June 11, 2026
⏰ 5:30 PM (Pakistan Time) 🇵🇰
📈 US CPI Inflation Data
🚀 Lower inflation = Bullish for BTC & Altcoins
📉 Higher inflation = Bearish pressure on crypto
👀 This is the most important event of the week.
━━━━━━━━━━━━━━
📅 Thursday — June 12, 2026
⏰ 5:30 PM (Pakistan Time) 🇵🇰
📊 US PPI Data
This shows producer inflation.
High numbers can create volatility in Bitcoin and Ethereum.
━━━━━━━━━━━━━━
📅 Thursday — June 12, 2026
⏰ 5:30 PM (Pakistan Time) 🇵🇰
💼 US Jobless Claims
📈 Higher unemployment claims may help crypto market pump because traders expect lower interest rates.
━━━━━━━━━━━━━━
👀 Coins To Watch:
🟠 Bitcoin (BTC)
🔵 Ethereum (ETH)
🟣 Solana (SOL)
🤖 AI Coins
🐸 Meme Coins
⚠️ Expect high volatility during US data release times.
#cryptodata #TrendingHot
BitcoinEtherSpotETF$4.4BOutflows
📅 Crypto Market Data Next Week 🚨
🔥 Monday — June 9, 2026
📊 No major US data
💡 Market may move slowly before big inflation reports.
━━━━━━━━━━━━━━
📅 Wednesday — June 11, 2026
⏰ 5:30 PM (Pakistan Time) 🇵🇰
📈 US CPI Inflation Data
🚀 Lower inflation = Bullish for BTC & Altcoins
📉 Higher inflation = Bearish pressure on crypto
👀 This is the most important event of the week.
━━━━━━━━━━━━━━
📅 Thursday — June 12, 2026
⏰ 5:30 PM (Pakistan Time) 🇵🇰
📊 US PPI Data
This shows producer inflation.
High numbers can create volatility in Bitcoin and Ethereum.
━━━━━━━━━━━━━━
📅 Thursday — June 12, 2026
⏰ 5:30 PM (Pakistan Time) 🇵🇰
💼 US Jobless Claims
📈 Higher unemployment claims may help crypto market pump because traders expect lower interest rates.
━━━━━━━━━━━━━━
👀 Coins To Watch:
🟠 Bitcoin (BTC)
🔵 Ethereum (ETH)
🟣 Solana (SOL)
🤖 AI Coins
🐸 Meme Coins
⚠️ Expect high volatility during US data release times.
#cryptodata #TrendingHot
BitcoinEtherSpotETF$4.4BOutflows
🔥 Monday — June 9, 2026
📊 No major US data
💡 Market may move slowly before big inflation reports.
━━━━━━━━━━━━━━
📅 Wednesday — June 11, 2026
⏰ 5:30 PM (Pakistan Time) 🇵🇰
📈 US CPI Inflation Data
🚀 Lower inflation = Bullish for BTC & Altcoins
📉 Higher inflation = Bearish pressure on crypto
👀 This is the most important event of the week.
━━━━━━━━━━━━━━
📅 Thursday — June 12, 2026
⏰ 5:30 PM (Pakistan Time) 🇵🇰
📊 US PPI Data
This shows producer inflation.
High numbers can create volatility in Bitcoin and Ethereum.
━━━━━━━━━━━━━━
📅 Thursday — June 12, 2026
⏰ 5:30 PM (Pakistan Time) 🇵🇰
💼 US Jobless Claims
📈 Higher unemployment claims may help crypto market pump because traders expect lower interest rates.
━━━━━━━━━━━━━━
👀 Coins To Watch:
🟠 Bitcoin (BTC)
🔵 Ethereum (ETH)
🟣 Solana (SOL)
🤖 AI Coins
🐸 Meme Coins
⚠️ Expect high volatility during US data release times.
#cryptodata #TrendingHot
BitcoinEtherSpotETF$4.4BOutflows
1
124
The 2021 Playbook Is Dead.Here's What Smart Money Is Actually Doing Right Now.
Bitcoin is down over 14% year to date. Ethereum is down 30%. The altcoin season index is sitting at 37 out of 100, and you need 75 just to call it a season. If your portfolio is bleeding and your timeline is full of people swearing they're done with crypto, you're not alone.
But here's what that same market isn't telling you.
Hyperliquid is up over 130% year to date. Zcash is up more than 50% in the last 30 days. Bitcoin exchange reserves just hit a 7-year low. And whale wallets holding 1,000 BTC or more accumulated roughly 270,000 coins in a single 30-day window, described as the largest such accumulation event since 2013.
The market isn't dead. It's just gotten a lot more selective.
Why the 2021 Strategy No Longer Works
In 2021, you could buy 40 random tokens and the rising tide of retail liquidity carried almost everything. That mechanism is gone. The capital structure of crypto has completely rewired itself around three forces that barely existed back then.
The first is ETF concentration. Spot Bitcoin ETFs now hold roughly $99 to $102 billion in assets under management, with cumulative inflows around $58 billion. They collectively hold approximately 7% of total BTC supply. Every dollar flowing into IBIT is a dollar that's not trickling down into the long tail of altcoins anymore.
The second is token unlock overhang. Roughly $97 billion in tokens hit the market through vesting schedules in 2025 alone, with weekly unlocks frequently clearing $650 to $770 million in fresh supply. That kind of consistent sell pressure doesn't care about your thesis.
The third is oversaturation. Over 11.6 million tokens failed outright in 2025. Active wallets on Pump.fun collapsed from 5.2 million in May 2025 to just 1.8 million by December. The meme casino is closing.
Bitcoin dominance is now holding around 59%. At the peak of the 2021 altcoin rotation, it fell to roughly 40%. That 20-point gap explains almost everything. 18 out of 20 tokens in the CoinDesk 20 index are in the red. The ETH/BTC ratio is down nearly 20% year to date. Even Ethereum, the asset that historically leads alt rotations, is down over 30%.
The rising tide model is broken because the tide is no longer rising for the long tail. It's rising for a very specific, very narrow set of assets. Ones with actual revenue.
Two Assets Smart Money Is Watching Right Now
Hyperliquid recently set a new high above $64 with a market cap around $13 billion. The price action alone would get attention. But the real story is what's underneath.
Hyperliquid generated approximately $11 million in protocol fees in a single week in May 2026. That's roughly 43% of all blockchain fee revenue generated across the entire crypto market in that window. In all of 2025, the protocol cleared $2.6 trillion in notional trading volume, more than Coinbase did in the same period. Its open interest now sits at roughly 92% of Coinbase's entire perpetuals book.
What makes this structurally different is where the fees go. 97 cents of every dollar flows into an automated, block-by-block buyback of HYPE from the open market. This isn't a team promise or a discretionary decision. It's hardcoded at the protocol level through what Hyperliquid calls the Assistance Fund. It cannot be paused. It cannot be modified by a multisig. It scales mechanically with volume. To date, that mechanism has deployed over $1.2 billion in cumulative revenue into open market purchases.
Bitwise CIO Matt Hougan has called HYPE one of the most mispriced assets in crypto, arguing the market is valuing it as a leverage platform when it's actually competing with CME and Robinhood.
Zcash is a different story, but equally interesting. ZEC is up over 50% in 30 days while Litecoin, Bitcoin Cash, and most 2017-era survivors are still bleeding. Three things changed.
The SEC recently closed its investigation into the Zcash Foundation with no enforcement action. That removed a major institutional barrier that had been suppressing price for years. Second, roughly 30% of all circulating ZEC supply is now locked in shielded privacy pools, the highest level in Zcash's history. The Orchard pool alone grew from 1.92 million to 4.55 million ZEC in 12 months. That's supply leaving exchanges and entering vaults quietly.
Third, the privacy narrative reframed itself. After the Tornado Cash prosecutions, the market learned something. Privacy via smart contract mixer is a regulatory target. Privacy baked into the base layer with optional viewing keys for compliance is a completely different legal position. That's what Zcash is.
Grayscale has filed to convert its Zcash trust into a spot ETF. Cypherpunk Holdings, backed by Winklevoss Capital, has accumulated over 294,000 ZEC, about 1.8% of circulating supply, with a stated goal of reaching 5% of total supply. After the November 2024 halving, ZEC's annual inflation rate is now just 2%.
This isn't just a narrative pump. The shielded pool has been growing steadily for over a year. The SEC overhang is gone. The institutional plumbing is being built. The fundamentals are real.
Bitcoin Is the Anchor. Don't Forget That.
While everyone stares at the flat price chart, the onchain data tells a very different story. Exchange reserves have collapsed to roughly 5.88% of supply, a 7-year low. SpaceX disclosed it holds 18,712 BTC and didn't sell a single coin throughout 2025. Strategy accumulated approximately 89,600 BTC in Q1 2026 alone.
This is what real accumulation looks like. It happens quietly, under a price chart that looks like nothing is moving.
The Framework That Actually Makes Sense Right Now
The 10-year Treasury yield sitting at 4.5% matters more than most retail investors realize. In 2021, cash yielded basically nothing. Any random speculative token could beat it. In 2026, the risk-free rate is 4.5%. That means every speculative position now competes against a guaranteed return. This is the mechanism behind the flight to fundamentals, and it explains why HYPE is pumping while most altcoins bleed, why ZEC is rallying while Litecoin stagnates, and why Bitcoin is seeing massive accumulation even with a boring chart.
The portfolio structure that makes sense now is a barbell. Bitcoin as the core monetary anchor, then three to five high-conviction satellite positions with real revenue, real users, and a defensible token sink mechanism. Holding 30 different bags doesn't give you diversification. It just dilutes your returns, assuming you get any at all.
Learn to read protocol revenue properly. On DeFi Llama, go to the fees tab, sort by revenue rather than gross fees, and divide annualized revenue by circulating market cap. That's your crypto price-to-sales ratio. It's the single most useful screening metric in this market right now.
Watch the unlock calendar. If a project has nine-figure vesting cliffs ahead and no revenue-funded buyback to absorb them, that is structural sell pressure you cannot trade against. Track developer activity. The teams shipping during this lull are the ones who will deliver in the next bull market. The 2018 to 2019 winter built Chainlink, Aave, and Uniswap. The 2022 to 2023 winter built Hyperliquid and Pendle. The next set of winners is being built right now while almost no one is paying attention.
Monitor institutional signals too. ETF applications, custody integrations, whale wallet movements on Nansen and Glassnode. Smart money is leaving fingerprints everywhere. Most retail investors are just too bored to read them.
Where This Goes From Here
Tokenized real-world assets on Ethereum just hit $8 billion, doubling in six months. Stablecoin payment volumes doubled to $400 billion in 2025. The underlying use case for crypto is stronger than it's ever been. The market is just too bored to notice.
That boredom is the setup.
The people who built positions in 2018 and 2019 didn't do it because the market was exciting. They did it because they understood what was being built underneath a price chart that looked dead. The next bull market won't look like 2021. Most retail will miss the early part of it entirely because they're still waiting for the spray-and-pray era to return.
It won't. But something better is taking its shape.
If you found this useful, follow for more analysis. The next few months will separate the investors doing the work from the ones waiting for someone else to tell them what to buy.
#BitcoinDropsBelow$60KWorstWeekSinceJuly2024 #ZcashShieldedPoolExploitDisclosed
The 2021 Playbook Is Dead.
Here's What Smart Money Is Actually Doing Right Now.
Bitcoin is down over 14% year to date. Ethereum is down 30%. The altcoin season index is sitting at 37 out of 100, and you need 75 just to call it a season. If your portfolio is bleeding and your timeline is full of people swearing they're done with crypto, you're not alone.
But here's what that same market isn't telling you.
Hyperliquid is up over 130% year to date. Zcash is up more than 50% in the last 30 days. Bitcoin exchange reserves just hit a 7-year low. And whale wallets holding 1,000 BTC or more accumulated roughly 270,000 coins in a single 30-day window, described as the largest such accumulation event since 2013.
The market isn't dead. It's just gotten a lot more selective.
Why the 2021 Strategy No Longer Works
In 2021, you could buy 40 random tokens and the rising tide of retail liquidity carried almost everything. That mechanism is gone. The capital structure of crypto has completely rewired itself around three forces that barely existed back then.
The first is ETF concentration. Spot Bitcoin ETFs now hold roughly $99 to $102 billion in assets under management, with cumulative inflows around $58 billion. They collectively hold approximately 7% of total BTC supply. Every dollar flowing into IBIT is a dollar that's not trickling down into the long tail of altcoins anymore.
The second is token unlock overhang. Roughly $97 billion in tokens hit the market through vesting schedules in 2025 alone, with weekly unlocks frequently clearing $650 to $770 million in fresh supply. That kind of consistent sell pressure doesn't care about your thesis.
The third is oversaturation. Over 11.6 million tokens failed outright in 2025. Active wallets on Pump.fun collapsed from 5.2 million in May 2025 to just 1.8 million by December. The meme casino is closing.
Bitcoin dominance is now holding around 59%. At the peak of the 2021 altcoin rotation, it fell to roughly 40%. That 20-point gap explains almost everything. 18 out of 20 tokens in the CoinDesk 20 index are in the red. The ETH/BTC ratio is down nearly 20% year to date. Even Ethereum, the asset that historically leads alt rotations, is down over 30%.
The rising tide model is broken because the tide is no longer rising for the long tail. It's rising for a very specific, very narrow set of assets. Ones with actual revenue.
Two Assets Smart Money Is Watching Right Now
Hyperliquid recently set a new high above $64 with a market cap around $13 billion. The price action alone would get attention. But the real story is what's underneath.
Hyperliquid generated approximately $11 million in protocol fees in a single week in May 2026. That's roughly 43% of all blockchain fee revenue generated across the entire crypto market in that window. In all of 2025, the protocol cleared $2.6 trillion in notional trading volume, more than Coinbase did in the same period. Its open interest now sits at roughly 92% of Coinbase's entire perpetuals book.
What makes this structurally different is where the fees go. 97 cents of every dollar flows into an automated, block-by-block buyback of HYPE from the open market. This isn't a team promise or a discretionary decision. It's hardcoded at the protocol level through what Hyperliquid calls the Assistance Fund. It cannot be paused. It cannot be modified by a multisig. It scales mechanically with volume. To date, that mechanism has deployed over $1.2 billion in cumulative revenue into open market purchases.
Bitwise CIO Matt Hougan has called HYPE one of the most mispriced assets in crypto, arguing the market is valuing it as a leverage platform when it's actually competing with CME and Robinhood.
Zcash is a different story, but equally interesting. ZEC is up over 50% in 30 days while Litecoin, Bitcoin Cash, and most 2017-era survivors are still bleeding. Three things changed.
The SEC recently closed its investigation into the Zcash Foundation with no enforcement action. That removed a major institutional barrier that had been suppressing price for years. Second, roughly 30% of all circulating ZEC supply is now locked in shielded privacy pools, the highest level in Zcash's history. The Orchard pool alone grew from 1.92 million to 4.55 million ZEC in 12 months. That's supply leaving exchanges and entering vaults quietly.
Third, the privacy narrative reframed itself. After the Tornado Cash prosecutions, the market learned something. Privacy via smart contract mixer is a regulatory target. Privacy baked into the base layer with optional viewing keys for compliance is a completely different legal position. That's what Zcash is.
Grayscale has filed to convert its Zcash trust into a spot ETF. Cypherpunk Holdings, backed by Winklevoss Capital, has accumulated over 294,000 ZEC, about 1.8% of circulating supply, with a stated goal of reaching 5% of total supply. After the November 2024 halving, ZEC's annual inflation rate is now just 2%.
This isn't just a narrative pump. The shielded pool has been growing steadily for over a year. The SEC overhang is gone. The institutional plumbing is being built. The fundamentals are real.
Bitcoin Is the Anchor. Don't Forget That.
While everyone stares at the flat price chart, the onchain data tells a very different story. Exchange reserves have collapsed to roughly 5.88% of supply, a 7-year low. SpaceX disclosed it holds 18,712 BTC and didn't sell a single coin throughout 2025. Strategy accumulated approximately 89,600 BTC in Q1 2026 alone.
This is what real accumulation looks like. It happens quietly, under a price chart that looks like nothing is moving.
The Framework That Actually Makes Sense Right Now
The 10-year Treasury yield sitting at 4.5% matters more than most retail investors realize. In 2021, cash yielded basically nothing. Any random speculative token could beat it. In 2026, the risk-free rate is 4.5%. That means every speculative position now competes against a guaranteed return. This is the mechanism behind the flight to fundamentals, and it explains why HYPE is pumping while most altcoins bleed, why ZEC is rallying while Litecoin stagnates, and why Bitcoin is seeing massive accumulation even with a boring chart.
The portfolio structure that makes sense now is a barbell. Bitcoin as the core monetary anchor, then three to five high-conviction satellite positions with real revenue, real users, and a defensible token sink mechanism. Holding 30 different bags doesn't give you diversification. It just dilutes your returns, assuming you get any at all.
Learn to read protocol revenue properly. On DeFi Llama, go to the fees tab, sort by revenue rather than gross fees, and divide annualized revenue by circulating market cap. That's your crypto price-to-sales ratio. It's the single most useful screening metric in this market right now.
Watch the unlock calendar. If a project has nine-figure vesting cliffs ahead and no revenue-funded buyback to absorb them, that is structural sell pressure you cannot trade against. Track developer activity. The teams shipping during this lull are the ones who will deliver in the next bull market. The 2018 to 2019 winter built Chainlink, Aave, and Uniswap. The 2022 to 2023 winter built Hyperliquid and Pendle. The next set of winners is being built right now while almost no one is paying attention.
Monitor institutional signals too. ETF applications, custody integrations, whale wallet movements on Nansen and Glassnode. Smart money is leaving fingerprints everywhere. Most retail investors are just too bored to read them.
Where This Goes From Here
Tokenized real-world assets on Ethereum just hit $8 billion, doubling in six months. Stablecoin payment volumes doubled to $400 billion in 2025. The underlying use case for crypto is stronger than it's ever been. The market is just too bored to notice.
That boredom is the setup.
The people who built positions in 2018 and 2019 didn't do it because the market was exciting. They did it because they understood what was being built underneath a price chart that looked dead. The next bull market won't look like 2021. Most retail will miss the early part of it entirely because they're still waiting for the spray-and-pray era to return.
It won't. But something better is taking its shape.
If you found this useful, follow for more analysis. The next few months will separate the investors doing the work from the ones waiting for someone else to tell them what to buy.
#BitcoinDropsBelow$60KWorstWeekSinceJuly2024 #ZcashShieldedPoolExploitDisclosed
Bitcoin is down over 14% year to date. Ethereum is down 30%. The altcoin season index is sitting at 37 out of 100, and you need 75 just to call it a season. If your portfolio is bleeding and your timeline is full of people swearing they're done with crypto, you're not alone.
But here's what that same market isn't telling you.
Hyperliquid is up over 130% year to date. Zcash is up more than 50% in the last 30 days. Bitcoin exchange reserves just hit a 7-year low. And whale wallets holding 1,000 BTC or more accumulated roughly 270,000 coins in a single 30-day window, described as the largest such accumulation event since 2013.
The market isn't dead. It's just gotten a lot more selective.
Why the 2021 Strategy No Longer Works
In 2021, you could buy 40 random tokens and the rising tide of retail liquidity carried almost everything. That mechanism is gone. The capital structure of crypto has completely rewired itself around three forces that barely existed back then.
The first is ETF concentration. Spot Bitcoin ETFs now hold roughly $99 to $102 billion in assets under management, with cumulative inflows around $58 billion. They collectively hold approximately 7% of total BTC supply. Every dollar flowing into IBIT is a dollar that's not trickling down into the long tail of altcoins anymore.
The second is token unlock overhang. Roughly $97 billion in tokens hit the market through vesting schedules in 2025 alone, with weekly unlocks frequently clearing $650 to $770 million in fresh supply. That kind of consistent sell pressure doesn't care about your thesis.
The third is oversaturation. Over 11.6 million tokens failed outright in 2025. Active wallets on Pump.fun collapsed from 5.2 million in May 2025 to just 1.8 million by December. The meme casino is closing.
Bitcoin dominance is now holding around 59%. At the peak of the 2021 altcoin rotation, it fell to roughly 40%. That 20-point gap explains almost everything. 18 out of 20 tokens in the CoinDesk 20 index are in the red. The ETH/BTC ratio is down nearly 20% year to date. Even Ethereum, the asset that historically leads alt rotations, is down over 30%.
The rising tide model is broken because the tide is no longer rising for the long tail. It's rising for a very specific, very narrow set of assets. Ones with actual revenue.
Two Assets Smart Money Is Watching Right Now
Hyperliquid recently set a new high above $64 with a market cap around $13 billion. The price action alone would get attention. But the real story is what's underneath.
Hyperliquid generated approximately $11 million in protocol fees in a single week in May 2026. That's roughly 43% of all blockchain fee revenue generated across the entire crypto market in that window. In all of 2025, the protocol cleared $2.6 trillion in notional trading volume, more than Coinbase did in the same period. Its open interest now sits at roughly 92% of Coinbase's entire perpetuals book.
What makes this structurally different is where the fees go. 97 cents of every dollar flows into an automated, block-by-block buyback of HYPE from the open market. This isn't a team promise or a discretionary decision. It's hardcoded at the protocol level through what Hyperliquid calls the Assistance Fund. It cannot be paused. It cannot be modified by a multisig. It scales mechanically with volume. To date, that mechanism has deployed over $1.2 billion in cumulative revenue into open market purchases.
Bitwise CIO Matt Hougan has called HYPE one of the most mispriced assets in crypto, arguing the market is valuing it as a leverage platform when it's actually competing with CME and Robinhood.
Zcash is a different story, but equally interesting. ZEC is up over 50% in 30 days while Litecoin, Bitcoin Cash, and most 2017-era survivors are still bleeding. Three things changed.
The SEC recently closed its investigation into the Zcash Foundation with no enforcement action. That removed a major institutional barrier that had been suppressing price for years. Second, roughly 30% of all circulating ZEC supply is now locked in shielded privacy pools, the highest level in Zcash's history. The Orchard pool alone grew from 1.92 million to 4.55 million ZEC in 12 months. That's supply leaving exchanges and entering vaults quietly.
Third, the privacy narrative reframed itself. After the Tornado Cash prosecutions, the market learned something. Privacy via smart contract mixer is a regulatory target. Privacy baked into the base layer with optional viewing keys for compliance is a completely different legal position. That's what Zcash is.
Grayscale has filed to convert its Zcash trust into a spot ETF. Cypherpunk Holdings, backed by Winklevoss Capital, has accumulated over 294,000 ZEC, about 1.8% of circulating supply, with a stated goal of reaching 5% of total supply. After the November 2024 halving, ZEC's annual inflation rate is now just 2%.
This isn't just a narrative pump. The shielded pool has been growing steadily for over a year. The SEC overhang is gone. The institutional plumbing is being built. The fundamentals are real.
Bitcoin Is the Anchor. Don't Forget That.
While everyone stares at the flat price chart, the onchain data tells a very different story. Exchange reserves have collapsed to roughly 5.88% of supply, a 7-year low. SpaceX disclosed it holds 18,712 BTC and didn't sell a single coin throughout 2025. Strategy accumulated approximately 89,600 BTC in Q1 2026 alone.
This is what real accumulation looks like. It happens quietly, under a price chart that looks like nothing is moving.
The Framework That Actually Makes Sense Right Now
The 10-year Treasury yield sitting at 4.5% matters more than most retail investors realize. In 2021, cash yielded basically nothing. Any random speculative token could beat it. In 2026, the risk-free rate is 4.5%. That means every speculative position now competes against a guaranteed return. This is the mechanism behind the flight to fundamentals, and it explains why HYPE is pumping while most altcoins bleed, why ZEC is rallying while Litecoin stagnates, and why Bitcoin is seeing massive accumulation even with a boring chart.
The portfolio structure that makes sense now is a barbell. Bitcoin as the core monetary anchor, then three to five high-conviction satellite positions with real revenue, real users, and a defensible token sink mechanism. Holding 30 different bags doesn't give you diversification. It just dilutes your returns, assuming you get any at all.
Learn to read protocol revenue properly. On DeFi Llama, go to the fees tab, sort by revenue rather than gross fees, and divide annualized revenue by circulating market cap. That's your crypto price-to-sales ratio. It's the single most useful screening metric in this market right now.
Watch the unlock calendar. If a project has nine-figure vesting cliffs ahead and no revenue-funded buyback to absorb them, that is structural sell pressure you cannot trade against. Track developer activity. The teams shipping during this lull are the ones who will deliver in the next bull market. The 2018 to 2019 winter built Chainlink, Aave, and Uniswap. The 2022 to 2023 winter built Hyperliquid and Pendle. The next set of winners is being built right now while almost no one is paying attention.
Monitor institutional signals too. ETF applications, custody integrations, whale wallet movements on Nansen and Glassnode. Smart money is leaving fingerprints everywhere. Most retail investors are just too bored to read them.
Where This Goes From Here
Tokenized real-world assets on Ethereum just hit $8 billion, doubling in six months. Stablecoin payment volumes doubled to $400 billion in 2025. The underlying use case for crypto is stronger than it's ever been. The market is just too bored to notice.
That boredom is the setup.
The people who built positions in 2018 and 2019 didn't do it because the market was exciting. They did it because they understood what was being built underneath a price chart that looked dead. The next bull market won't look like 2021. Most retail will miss the early part of it entirely because they're still waiting for the spray-and-pray era to return.
It won't. But something better is taking its shape.
If you found this useful, follow for more analysis. The next few months will separate the investors doing the work from the ones waiting for someone else to tell them what to buy.
#BitcoinDropsBelow$60KWorstWeekSinceJuly2024 #ZcashShieldedPoolExploitDisclosed
1
418
🗓️ This Week's Crypto Events & Catalysts
Tue, May 19
- ADP Weekly Employment Change at 5:15 pm
- CTK — Network Upgrade
Wed, May 20
- Pyth: 36.96% of M.Cap unlock (cliff unlock)
- Zro: 9.78% of M.Cap unlock
- Kaito, 10.74% of M.Cap unlock
Thu, May 21
- Unemployment Claims at 5:30 pm
- Flash Manufacturing PMI at 6:45 pm
Fri, May 22
- Revised UoM Consumer Sentiment at 7:00 pm
- BTC — PIZZA DAY
- Hyperlane, 7.71% of M.Cap unlock
Sat, May 23
- None
Sun, May 24
- None
🗓️ This Week's Crypto Events & Catalysts
Tue, May 19
- ADP Weekly Employment Change at 5:15 pm
- CTK — Network Upgrade
Wed, May 20
- Pyth: 36.96% of M.Cap unlock (cliff unlock)
- Zro: 9.78% of M.Cap unlock
- Kaito, 10.74% of M.Cap unlock
Thu, May 21
- Unemployment Claims at 5:30 pm
- Flash Manufacturing PMI at 6:45 pm
Fri, May 22
- Revised UoM Consumer Sentiment at 7:00 pm
- BTC — PIZZA DAY
- Hyperlane, 7.71% of M.Cap unlock
Sat, May 23
- None
Sun, May 24
- None
Tue, May 19
- ADP Weekly Employment Change at 5:15 pm
- CTK — Network Upgrade
Wed, May 20
- Pyth: 36.96% of M.Cap unlock (cliff unlock)
- Zro: 9.78% of M.Cap unlock
- Kaito, 10.74% of M.Cap unlock
Thu, May 21
- Unemployment Claims at 5:30 pm
- Flash Manufacturing PMI at 6:45 pm
Fri, May 22
- Revised UoM Consumer Sentiment at 7:00 pm
- BTC — PIZZA DAY
- Hyperlane, 7.71% of M.Cap unlock
Sat, May 23
- None
Sun, May 24
- None
75
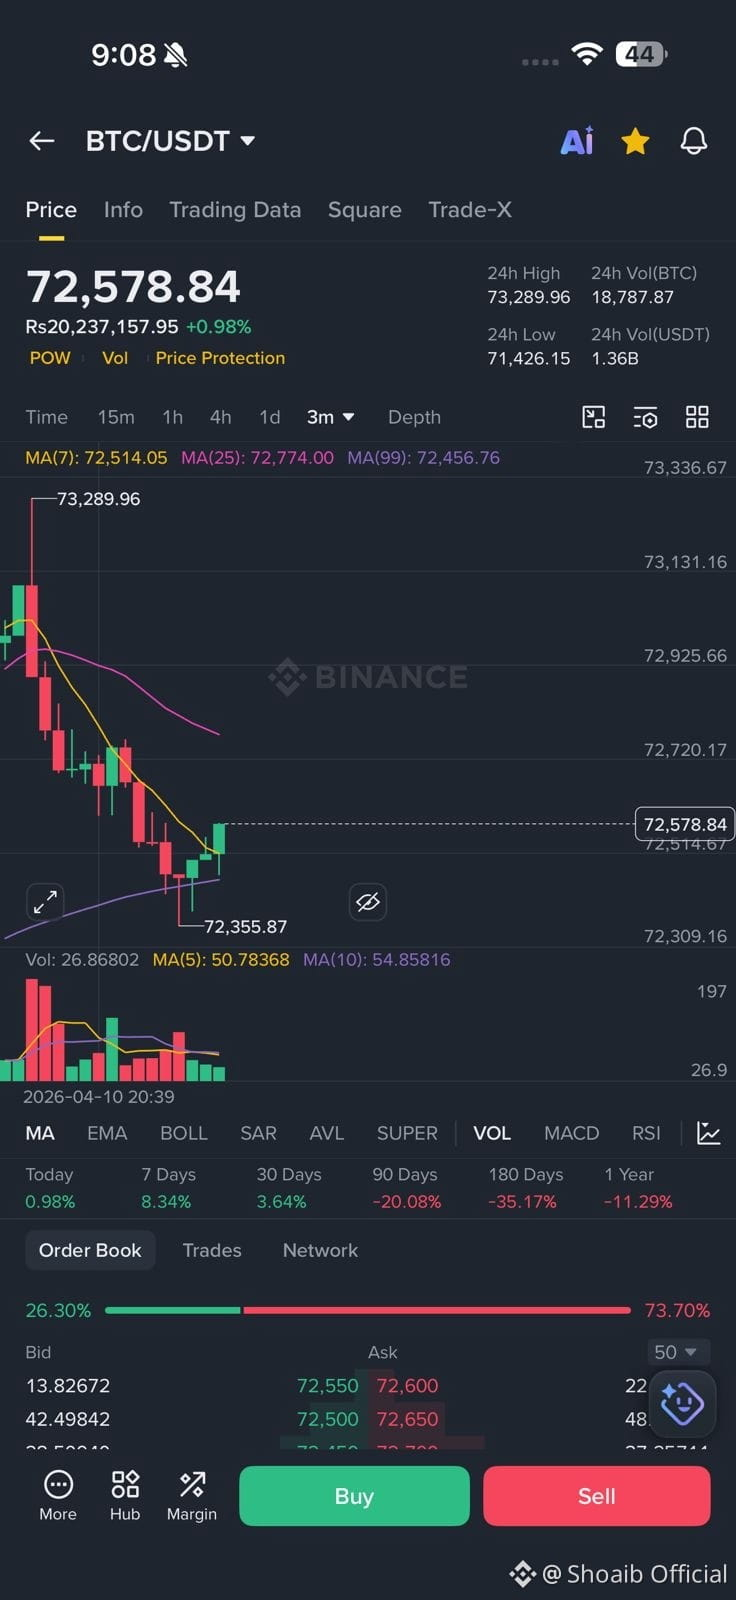
BTC/USDT SELL (SHORT)
Leverage : Cross 3 to 5X
Entry : 73000 - 74000
Take Profits:
TP1 : 72500
TP2 : 72000
TP3 : 71500
TP4 : 71000
👏 Stoploss : 75000
Use only 3% - 5% amount of your portfolio
BTC/USDT SELL (SHORT)
Leverage : Cross 3 to 5X
Entry : 73000 - 74000
Take Profits:
TP1 : 72500
TP2 : 72000
TP3 : 71500
TP4 : 71000
👏 Stoploss : 75000
Use only 3% - 5% amount of your portfolio
Leverage : Cross 3 to 5X
Entry : 73000 - 74000
Take Profits:
TP1 : 72500
TP2 : 72000
TP3 : 71500
TP4 : 71000
👏 Stoploss : 75000
Use only 3% - 5% amount of your portfolio
8
📊 Today — April 10, 2026Bitcoin (BTC)
BTC is currently trading around $71,255, up roughly 0.04% in the past 24 hours, with a market cap of ~$1.43 trillion and 24h volume of ~$37.8 billion.
Ethereum (ETH)
ETH has been trading around the $2,100–$2,133 range. A major positive development was the Ethereum Foundation staking ~69,500 ETH worth ~$143M, reducing sell-side pressure and boosting long-term confidence.
Total Market Cap
The total crypto market cap is around $2.33–$2.44 trillion, with ongoing volatility driven by geopolitical tensions and macro uncertainty.
Market Sentiment
The Fear & Greed Index is sitting at an extremely low 9/100 — "Extreme Fear", as the US-Iran conflict, rising fuel prices, and cost-of-living pressures keep retail investors on the sidelines.
Key Event Today
The March US CPI inflation report releases today (April 10). A soft print could spark a rebound toward $2,150 for ETH, while a hot reading risks a drop toward $2,000 support — and the same macro logic applies to BTC.
🔮 Outlook for the Next 3 Days (April 11–13)
Bullish Case:
Bitcoin is showing early signs of a technical breakout. If the move is confirmed, the next test sits around the $75,000–$76,000 range, with potential to open the door toward $80,000–$85,000 near-term. Historically, crowded bearish positioning tends to trigger moves in the opposite direction.
Bearish Risk:
BTC has been forming a head-and-shoulders pattern, with a neckline between $64,781–$63,868. A confirmed close below this neckline could activate a 14% measured move projecting toward the $55,000 zone.
Tax Selling Pressure:
Tax-season selling ahead of the April 15 deadline is adding downward pressure, as many investors are liquidating crypto holdings to cover tax bills from 2024–2025 gains.
Key Catalyst to Watch:
The CLARITY Act markup in late April is a major regulatory catalyst. If BTC holds above $70,000 through the tax window and geopolitical tensions ease, Bitcoin has a real shot at a positive April — historically its 69% win-rate month.
Macro Driver:
Oil prices are showing signs of weakness below recent highs, and Bitcoin's breakout case may depend less on crypto-specific catalysts and more on whether oil continues to decline. If geopolitical tensions stabilize, crypto could extend gains; if oil spikes again, the rally could stall.
⚠️ Disclaimer: Crypto price forecasts are speculative. This is not financial advice — always do your own research before making investment decisions.
📊 Today — April 10, 2026
Bitcoin (BTC)
BTC is currently trading around $71,255, up roughly 0.04% in the past 24 hours, with a market cap of ~$1.43 trillion and 24h volume of ~$37.8 billion.
Ethereum (ETH)
ETH has been trading around the $2,100–$2,133 range. A major positive development was the Ethereum Foundation staking ~69,500 ETH worth ~$143M, reducing sell-side pressure and boosting long-term confidence.
Total Market Cap
The total crypto market cap is around $2.33–$2.44 trillion, with ongoing volatility driven by geopolitical tensions and macro uncertainty.
Market Sentiment
The Fear & Greed Index is sitting at an extremely low 9/100 — "Extreme Fear", as the US-Iran conflict, rising fuel prices, and cost-of-living pressures keep retail investors on the sidelines.
Key Event Today
The March US CPI inflation report releases today (April 10). A soft print could spark a rebound toward $2,150 for ETH, while a hot reading risks a drop toward $2,000 support — and the same macro logic applies to BTC.
🔮 Outlook for the Next 3 Days (April 11–13)
Bullish Case:
Bitcoin is showing early signs of a technical breakout. If the move is confirmed, the next test sits around the $75,000–$76,000 range, with potential to open the door toward $80,000–$85,000 near-term. Historically, crowded bearish positioning tends to trigger moves in the opposite direction.
Bearish Risk:
BTC has been forming a head-and-shoulders pattern, with a neckline between $64,781–$63,868. A confirmed close below this neckline could activate a 14% measured move projecting toward the $55,000 zone.
Tax Selling Pressure:
Tax-season selling ahead of the April 15 deadline is adding downward pressure, as many investors are liquidating crypto holdings to cover tax bills from 2024–2025 gains.
Key Catalyst to Watch:
The CLARITY Act markup in late April is a major regulatory catalyst. If BTC holds above $70,000 through the tax window and geopolitical tensions ease, Bitcoin has a real shot at a positive April — historically its 69% win-rate month.
Macro Driver:
Oil prices are showing signs of weakness below recent highs, and Bitcoin's breakout case may depend less on crypto-specific catalysts and more on whether oil continues to decline. If geopolitical tensions stabilize, crypto could extend gains; if oil spikes again, the rally could stall.
⚠️ Disclaimer: Crypto price forecasts are speculative. This is not financial advice — always do your own research before making investment decisions.
BTC is currently trading around $71,255, up roughly 0.04% in the past 24 hours, with a market cap of ~$1.43 trillion and 24h volume of ~$37.8 billion.
Ethereum (ETH)
ETH has been trading around the $2,100–$2,133 range. A major positive development was the Ethereum Foundation staking ~69,500 ETH worth ~$143M, reducing sell-side pressure and boosting long-term confidence.
Total Market Cap
The total crypto market cap is around $2.33–$2.44 trillion, with ongoing volatility driven by geopolitical tensions and macro uncertainty.
Market Sentiment
The Fear & Greed Index is sitting at an extremely low 9/100 — "Extreme Fear", as the US-Iran conflict, rising fuel prices, and cost-of-living pressures keep retail investors on the sidelines.
Key Event Today
The March US CPI inflation report releases today (April 10). A soft print could spark a rebound toward $2,150 for ETH, while a hot reading risks a drop toward $2,000 support — and the same macro logic applies to BTC.
🔮 Outlook for the Next 3 Days (April 11–13)
Bullish Case:
Bitcoin is showing early signs of a technical breakout. If the move is confirmed, the next test sits around the $75,000–$76,000 range, with potential to open the door toward $80,000–$85,000 near-term. Historically, crowded bearish positioning tends to trigger moves in the opposite direction.
Bearish Risk:
BTC has been forming a head-and-shoulders pattern, with a neckline between $64,781–$63,868. A confirmed close below this neckline could activate a 14% measured move projecting toward the $55,000 zone.
Tax Selling Pressure:
Tax-season selling ahead of the April 15 deadline is adding downward pressure, as many investors are liquidating crypto holdings to cover tax bills from 2024–2025 gains.
Key Catalyst to Watch:
The CLARITY Act markup in late April is a major regulatory catalyst. If BTC holds above $70,000 through the tax window and geopolitical tensions ease, Bitcoin has a real shot at a positive April — historically its 69% win-rate month.
Macro Driver:
Oil prices are showing signs of weakness below recent highs, and Bitcoin's breakout case may depend less on crypto-specific catalysts and more on whether oil continues to decline. If geopolitical tensions stabilize, crypto could extend gains; if oil spikes again, the rally could stall.
⚠️ Disclaimer: Crypto price forecasts are speculative. This is not financial advice — always do your own research before making investment decisions.
13
🚨 Iran made 10 demands — but the US may only accept 2–3. Here’s the simple breakdown:
1️⃣ 🤝 No more attacks
The US may agree — but only if Iran also stops attacking first.
2️⃣ 🌊 Control of the Strait of Hormuz
Iran already borders part of it, so it already has some control.
3️⃣ ⚛️ Uranium enrichment
The US may allow low levels (for energy), but not high levels for weapons.
4️⃣ 💰 Remove all sanctions
This could happen slowly in steps — not all at once.
5️⃣ 🌍 End secondary sanctions
Other countries are affected, so there’s pressure on the US to ease them.
6️⃣ 🏛️ End UN resolutions
The US can push, but countries like the UK and France must agree too.
7️⃣ 🔍 Stop nuclear inspections (IAEA)
Unlikely — the US wants inspectors to keep monitoring Iran.
8️⃣ 💸 US pays for war damage
Very unlikely. The US has strongly opposed giving money to Iran before.
9️⃣ 🪖 US troops leave the Middle East
Maybe a small pullback, but a full exit is not realistic.
🔟 🔥 Stop all wars (including Hezbollah)
The US can stop its own actions, but can’t control others like Israel.
⏳ Big moment coming — the next 2 days could decide everything.
🚨 Iran made 10 demands — but the US may only accept 2–3. Here’s the simple breakdown:
1️⃣ 🤝 No more attacks
The US may agree — but only if Iran also stops attacking first.
2️⃣ 🌊 Control of the Strait of Hormuz
Iran already borders part of it, so it already has some control.
3️⃣ ⚛️ Uranium enrichment
The US may allow low levels (for energy), but not high levels for weapons.
4️⃣ 💰 Remove all sanctions
This could happen slowly in steps — not all at once.
5️⃣ 🌍 End secondary sanctions
Other countries are affected, so there’s pressure on the US to ease them.
6️⃣ 🏛️ End UN resolutions
The US can push, but countries like the UK and France must agree too.
7️⃣ 🔍 Stop nuclear inspections (IAEA)
Unlikely — the US wants inspectors to keep monitoring Iran.
8️⃣ 💸 US pays for war damage
Very unlikely. The US has strongly opposed giving money to Iran before.
9️⃣ 🪖 US troops leave the Middle East
Maybe a small pullback, but a full exit is not realistic.
🔟 🔥 Stop all wars (including Hezbollah)
The US can stop its own actions, but can’t control others like Israel.
⏳ Big moment coming — the next 2 days could decide everything.
1️⃣ 🤝 No more attacks
The US may agree — but only if Iran also stops attacking first.
2️⃣ 🌊 Control of the Strait of Hormuz
Iran already borders part of it, so it already has some control.
3️⃣ ⚛️ Uranium enrichment
The US may allow low levels (for energy), but not high levels for weapons.
4️⃣ 💰 Remove all sanctions
This could happen slowly in steps — not all at once.
5️⃣ 🌍 End secondary sanctions
Other countries are affected, so there’s pressure on the US to ease them.
6️⃣ 🏛️ End UN resolutions
The US can push, but countries like the UK and France must agree too.
7️⃣ 🔍 Stop nuclear inspections (IAEA)
Unlikely — the US wants inspectors to keep monitoring Iran.
8️⃣ 💸 US pays for war damage
Very unlikely. The US has strongly opposed giving money to Iran before.
9️⃣ 🪖 US troops leave the Middle East
Maybe a small pullback, but a full exit is not realistic.
🔟 🔥 Stop all wars (including Hezbollah)
The US can stop its own actions, but can’t control others like Israel.
⏳ Big moment coming — the next 2 days could decide everything.
1
89
A potential US–Iran peace deal could trigger the next major crypto move.
Iran has entered negotiations with the US for the first time, signaling a possible end to the conflict within 24 hours. A constructive proposal is on the table, including reopening the Strait of Hormuz and easing global energy risks.
Markets are already reacting. Lower geopolitical tension pushes capital back into risk assets, and crypto is first in line.
Large players are quietly accumulating, while short positions have stacked up during the uncertainty.
If the deal confirms, expect a sharp squeeze and fast upside across BTC and altcoins.
#TrumpDeadlineOnIran #Irannews
A potential US–Iran peace deal could trigger the next major crypto move.
Iran has entered negotiations with the US for the first time, signaling a possible end to the conflict within 24 hours. A constructive proposal is on the table, including reopening the Strait of Hormuz and easing global energy risks.
Markets are already reacting. Lower geopolitical tension pushes capital back into risk assets, and crypto is first in line.
Large players are quietly accumulating, while short positions have stacked up during the uncertainty.
If the deal confirms, expect a sharp squeeze and fast upside across BTC and altcoins.
#TrumpDeadlineOnIran #Irannews
Iran has entered negotiations with the US for the first time, signaling a possible end to the conflict within 24 hours. A constructive proposal is on the table, including reopening the Strait of Hormuz and easing global energy risks.
Markets are already reacting. Lower geopolitical tension pushes capital back into risk assets, and crypto is first in line.
Large players are quietly accumulating, while short positions have stacked up during the uncertainty.
If the deal confirms, expect a sharp squeeze and fast upside across BTC and altcoins.
#TrumpDeadlineOnIran #Irannews

33
🚨 Next Week in Crypto: What to Watch (April 6–11, 2026)
🗓️ Next week is packed with inflation data, Fed updates, and some important token unlocks. Here’s what you should keep an eye on:
———
🔓 Token Unlocks
💰 HYPE Token
About $11.84M worth of tokens will be unlocked (0.1% of supply).
💰 ENA (Ethena)
Around $13.42M in tokens will be unlocked (2.0% of supply).
👉 Token unlocks can create selling pressure, so watch price movement closely.
———
📊 US Economic Data
🗓 Monday (April 6)
• ISM Services PMI (March)
🗓 Wednesday (April 8)
• FOMC Meeting Minutes
🗓 Thursday (April 9)
• Jobless Claims
• Core PCE (important inflation data)
• Final GDP (Q4 revision)
🗓 Friday (April 10)
• CPI MoM
• Core CPI
• CPI YoY
———
📉 What It Means
🔥 This week is all about inflation and Fed signals.
• If inflation goes down → good for crypto 📈
• If inflation goes up → pressure on crypto 📉
⚠️ Core PCE and CPI are coming very close together, so expect fast and strong market moves.
———
📆 That’s your week ahead. With big data drops and Fed insights, the market may not stay quiet. Stay ready.
🚨 Next Week in Crypto: What to Watch (April 6–11, 2026)
🗓️ Next week is packed with inflation data, Fed updates, and some important token unlocks. Here’s what you should keep an eye on:
———
🔓 Token Unlocks
💰 HYPE Token
About $11.84M worth of tokens will be unlocked (0.1% of supply).
💰 ENA (Ethena)
Around $13.42M in tokens will be unlocked (2.0% of supply).
👉 Token unlocks can create selling pressure, so watch price movement closely.
———
📊 US Economic Data
🗓 Monday (April 6)
• ISM Services PMI (March)
🗓 Wednesday (April 8)
• FOMC Meeting Minutes
🗓 Thursday (April 9)
• Jobless Claims
• Core PCE (important inflation data)
• Final GDP (Q4 revision)
🗓 Friday (April 10)
• CPI MoM
• Core CPI
• CPI YoY
———
📉 What It Means
🔥 This week is all about inflation and Fed signals.
• If inflation goes down → good for crypto 📈
• If inflation goes up → pressure on crypto 📉
⚠️ Core PCE and CPI are coming very close together, so expect fast and strong market moves.
———
📆 That’s your week ahead. With big data drops and Fed insights, the market may not stay quiet. Stay ready.
🗓️ Next week is packed with inflation data, Fed updates, and some important token unlocks. Here’s what you should keep an eye on:
———
🔓 Token Unlocks
💰 HYPE Token
About $11.84M worth of tokens will be unlocked (0.1% of supply).
💰 ENA (Ethena)
Around $13.42M in tokens will be unlocked (2.0% of supply).
👉 Token unlocks can create selling pressure, so watch price movement closely.
———
📊 US Economic Data
🗓 Monday (April 6)
• ISM Services PMI (March)
🗓 Wednesday (April 8)
• FOMC Meeting Minutes
🗓 Thursday (April 9)
• Jobless Claims
• Core PCE (important inflation data)
• Final GDP (Q4 revision)
🗓 Friday (April 10)
• CPI MoM
• Core CPI
• CPI YoY
———
📉 What It Means
🔥 This week is all about inflation and Fed signals.
• If inflation goes down → good for crypto 📈
• If inflation goes up → pressure on crypto 📉
⚠️ Core PCE and CPI are coming very close together, so expect fast and strong market moves.
———
📆 That’s your week ahead. With big data drops and Fed insights, the market may not stay quiet. Stay ready.
1
132
Markets pumped on hype, then flipped the moment reality hit.
Trump’s speech delivered no new direction, only signals that the war could drag for weeks or even months. That instantly shifted sentiment. BTC saw outflows around $170M, ETH weakened, and altcoins started bleeding again. Meanwhile, oil rebounded and macro uncertainty spiked.
On-chain demand is also cooling. Institutions are no longer absorbing supply like before, while miners and large holders are moving BTC to exchanges. Add rising DeFi exploits and global tension, and risk appetite is clearly fading.
Short term looks bearish. Volatility stays high until macro clarity returns. Smart money is positioning, not chasing.
#trumpspeach
Markets pumped on hype, then flipped the moment reality hit.
Trump’s speech delivered no new direction, only signals that the war could drag for weeks or even months. That instantly shifted sentiment. BTC saw outflows around $170M, ETH weakened, and altcoins started bleeding again. Meanwhile, oil rebounded and macro uncertainty spiked.
On-chain demand is also cooling. Institutions are no longer absorbing supply like before, while miners and large holders are moving BTC to exchanges. Add rising DeFi exploits and global tension, and risk appetite is clearly fading.
Short term looks bearish. Volatility stays high until macro clarity returns. Smart money is positioning, not chasing.
#trumpspeach
Trump’s speech delivered no new direction, only signals that the war could drag for weeks or even months. That instantly shifted sentiment. BTC saw outflows around $170M, ETH weakened, and altcoins started bleeding again. Meanwhile, oil rebounded and macro uncertainty spiked.
On-chain demand is also cooling. Institutions are no longer absorbing supply like before, while miners and large holders are moving BTC to exchanges. Add rising DeFi exploits and global tension, and risk appetite is clearly fading.
Short term looks bearish. Volatility stays high until macro clarity returns. Smart money is positioning, not chasing.
#trumpspeach
22
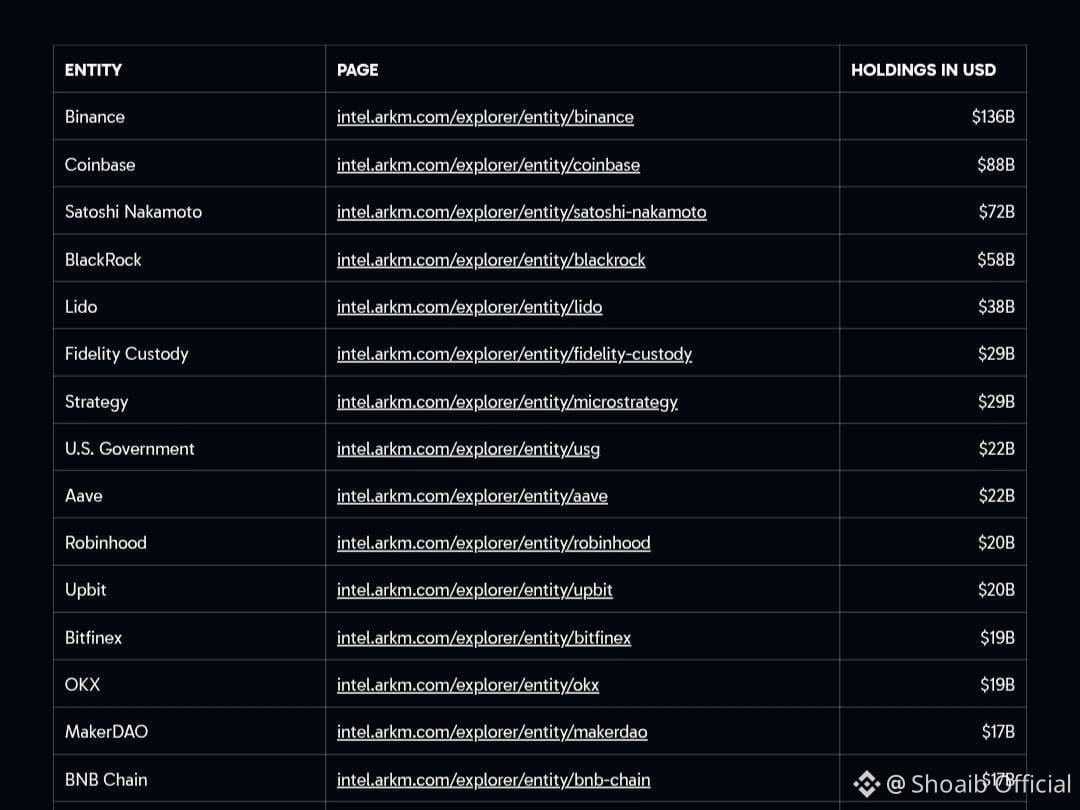
🚨 Binance is leading the crypto world with $136B held on-chain
Here’s how the top holders rank:
🥇 Binance – $136B
🥈 Coinbase – $88B
🥉 Satoshi Nakamoto – $72B
📊 According to Arkham data, Binance holds the most crypto assets on-chain, far ahead of others.
🚨 Binance is leading the crypto world with $136B held on-chain
Here’s how the top holders rank:
🥇 Binance – $136B
🥈 Coinbase – $88B
🥉 Satoshi Nakamoto – $72B
📊 According to Arkham data, Binance holds the most crypto assets on-chain, far ahead of others.
Here’s how the top holders rank:
🥇 Binance – $136B
🥈 Coinbase – $88B
🥉 Satoshi Nakamoto – $72B
📊 According to Arkham data, Binance holds the most crypto assets on-chain, far ahead of others.
134
🚨 BREAKING: Foreign central banks are selling off U.S. government bonds, hitting the lowest level since 2012 because of pressure from the Iran war.
Here’s what’s happening 👇
1️⃣ About $82 billion in U.S. Treasuries has been sold since late February
2️⃣ Central banks are trying to protect their own currencies as they get weaker 💱
3️⃣ To do this, they sell U.S. dollars and also sell U.S. bonds
4️⃣ 🇹🇷 Turkey’s central bank alone has sold around $22 billion in foreign securities
🌍 Overall, central banks around the world are under heavy pressure as the war is shaking currencies and money flow.
🚨 BREAKING: Foreign central banks are selling off U.S. government bonds, hitting the lowest level since 2012 because of pressure from the Iran war.
Here’s what’s happening 👇
1️⃣ About $82 billion in U.S. Treasuries has been sold since late February
2️⃣ Central banks are trying to protect their own currencies as they get weaker 💱
3️⃣ To do this, they sell U.S. dollars and also sell U.S. bonds
4️⃣ 🇹🇷 Turkey’s central bank alone has sold around $22 billion in foreign securities
🌍 Overall, central banks around the world are under heavy pressure as the war is shaking currencies and money flow.
Here’s what’s happening 👇
1️⃣ About $82 billion in U.S. Treasuries has been sold since late February
2️⃣ Central banks are trying to protect their own currencies as they get weaker 💱
3️⃣ To do this, they sell U.S. dollars and also sell U.S. bonds
4️⃣ 🇹🇷 Turkey’s central bank alone has sold around $22 billion in foreign securities
🌍 Overall, central banks around the world are under heavy pressure as the war is shaking currencies and money flow.
1
87
🚨 Q-DAY RISK IS RISING — 10% CHANCE BY 2032
A Bitcoin security researcher, Justin Drake, says there’s now about a 1 in 10 chance that quantum computers could break Bitcoin’s private keys by 2032 ⚠️
He still thinks it’s unlikely before 2030, but says we should start preparing now ⏳
This comes after new research from Google showing Bitcoin might be cracked using around 1,000 quantum bits in just 9 minutes 🤯
🚨 Q-DAY RISK IS RISING — 10% CHANCE BY 2032
A Bitcoin security researcher, Justin Drake, says there’s now about a 1 in 10 chance that quantum computers could break Bitcoin’s private keys by 2032 ⚠️
He still thinks it’s unlikely before 2030, but says we should start preparing now ⏳
This comes after new research from Google showing Bitcoin might be cracked using around 1,000 quantum bits in just 9 minutes 🤯
A Bitcoin security researcher, Justin Drake, says there’s now about a 1 in 10 chance that quantum computers could break Bitcoin’s private keys by 2032 ⚠️
He still thinks it’s unlikely before 2030, but says we should start preparing now ⏳
This comes after new research from Google showing Bitcoin might be cracked using around 1,000 quantum bits in just 9 minutes 🤯
8
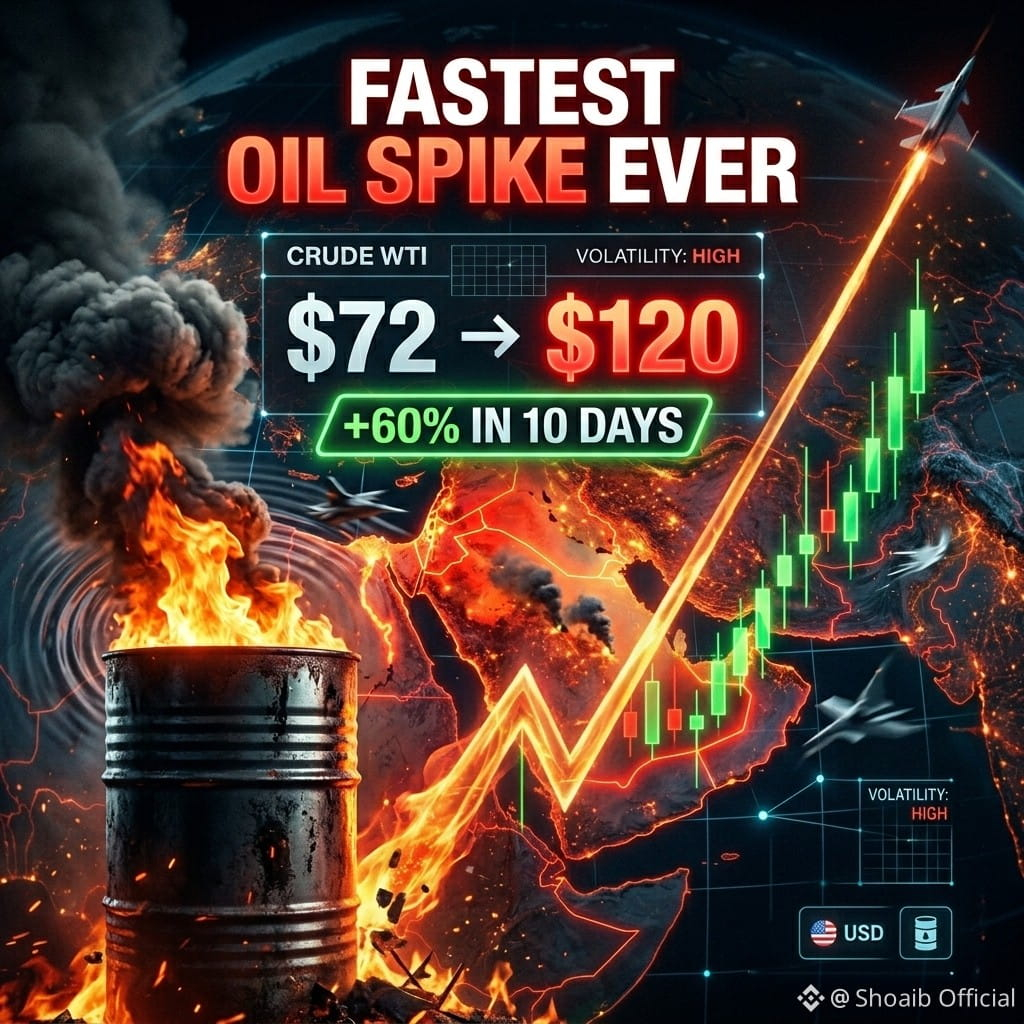
📈 OIL JUST MADE A HUGE JUMP THIS MONTH
Brent oil price went from $72 to almost $120 per barrel since Feb 27 (before the Iran war started).
That’s a 60% increase in just 10 days 😳
And in March alone, it’s up about 50% — one of the biggest monthly jumps ever.
📊 Compared to past oil shocks:
1973 oil crisis: +266% (but took 5 months)
1979 Iran crisis: +167% (over 1 year)
1990 Kuwait war: +135% (over 4 months)
2008 boom: +50% (over 6 months)
2022 Ukraine war: +67% (over ~3 weeks)
⚡ This is the fastest oil price spike in history… and it’s still not over.
📈 OIL JUST MADE A HUGE JUMP THIS MONTH
Brent oil price went from $72 to almost $120 per barrel since Feb 27 (before the Iran war started).
That’s a 60% increase in just 10 days 😳
And in March alone, it’s up about 50% — one of the biggest monthly jumps ever.
📊 Compared to past oil shocks:
1973 oil crisis: +266% (but took 5 months)
1979 Iran crisis: +167% (over 1 year)
1990 Kuwait war: +135% (over 4 months)
2008 boom: +50% (over 6 months)
2022 Ukraine war: +67% (over ~3 weeks)
⚡ This is the fastest oil price spike in history… and it’s still not over.
Brent oil price went from $72 to almost $120 per barrel since Feb 27 (before the Iran war started).
That’s a 60% increase in just 10 days 😳
And in March alone, it’s up about 50% — one of the biggest monthly jumps ever.
📊 Compared to past oil shocks:
1973 oil crisis: +266% (but took 5 months)
1979 Iran crisis: +167% (over 1 year)
1990 Kuwait war: +135% (over 4 months)
2008 boom: +50% (over 6 months)
2022 Ukraine war: +67% (over ~3 weeks)
⚡ This is the fastest oil price spike in history… and it’s still not over.
35
👀 DAY 31 of the Iran War — Latest Updates:
🛢️ Donald Trump said he wants to “take the oil in Iran” and may seize Kharg Island
📜 He also claimed Iran agreed to “most of” a 15-point demand list
❌ Iran denies any direct talks are happening
🤝 Pakistan confirmed it’s mediating indirect talks between United States and Iran
🚢 2,500 marines + 2,500 sailors arrived in the Middle East — total US troops now over 50,000
🪖 Another 2,000 soldiers from the 82nd Airborne are on the way
⚠️ Iran’s parliament speaker warned: “Our forces are ready for US troops on the ground”
🇮🇱 Israel said its soldiers will NOT join if the US launches a ground operation
🎯 Iran threatened strikes on US-affiliated universities in the Gulf
🚀 Iran-backed Houthis launched attacks on Israel and say they won’t stop
⏳ No clear end in sight.
👀 DAY 31 of the Iran War — Latest Updates:
🛢️ Donald Trump said he wants to “take the oil in Iran” and may seize Kharg Island
📜 He also claimed Iran agreed to “most of” a 15-point demand list
❌ Iran denies any direct talks are happening
🤝 Pakistan confirmed it’s mediating indirect talks between United States and Iran
🚢 2,500 marines + 2,500 sailors arrived in the Middle East — total US troops now over 50,000
🪖 Another 2,000 soldiers from the 82nd Airborne are on the way
⚠️ Iran’s parliament speaker warned: “Our forces are ready for US troops on the ground”
🇮🇱 Israel said its soldiers will NOT join if the US launches a ground operation
🎯 Iran threatened strikes on US-affiliated universities in the Gulf
🚀 Iran-backed Houthis launched attacks on Israel and say they won’t stop
⏳ No clear end in sight.
🛢️ Donald Trump said he wants to “take the oil in Iran” and may seize Kharg Island
📜 He also claimed Iran agreed to “most of” a 15-point demand list
❌ Iran denies any direct talks are happening
🤝 Pakistan confirmed it’s mediating indirect talks between United States and Iran
🚢 2,500 marines + 2,500 sailors arrived in the Middle East — total US troops now over 50,000
🪖 Another 2,000 soldiers from the 82nd Airborne are on the way
⚠️ Iran’s parliament speaker warned: “Our forces are ready for US troops on the ground”
🇮🇱 Israel said its soldiers will NOT join if the US launches a ground operation
🎯 Iran threatened strikes on US-affiliated universities in the Gulf
🚀 Iran-backed Houthis launched attacks on Israel and say they won’t stop
⏳ No clear end in sight.

106
🔥 NEW: BLACKROCK CRYPTO JOB
💼 BlackRock is hiring a top person to handle crypto in New York
🪙 They will manage: • Crypto
• Stablecoins
• Tokenization
📊 Simple point: big Wall Street companies are taking crypto seriously now 🚀
🔥 NEW: BLACKROCK CRYPTO JOB
💼 BlackRock is hiring a top person to handle crypto in New York
🪙 They will manage: • Crypto
• Stablecoins
• Tokenization
📊 Simple point: big Wall Street companies are taking crypto seriously now 🚀
💼 BlackRock is hiring a top person to handle crypto in New York
🪙 They will manage: • Crypto
• Stablecoins
• Tokenization
📊 Simple point: big Wall Street companies are taking crypto seriously now 🚀
93
Next Week in Crypto: Key Events to Watch (March 30th–April 4th, 2026) 🗓
—————
Next week is full of important news that can move the crypto market, especially US economic data and some token unlocks.
Here’s what to watch:
🔒 Token Unlocks
🪙 SUI Token Unlock
Around $36.9M worth of tokens (1.1% supply)
🪙 EIGEN Token Unlock
Around $6.2M (5.5% supply)
🪙 KAMINO Token Unlock
Around $3.9M (5.4% supply)
📊 US Economic Data
Tuesday (March 31)
🔴 Consumer Confidence
Wednesday (April 1)
🔴 ADP Jobs Data
🔴 Retail Sales
🔴 ISM + Manufacturing PMI
Thursday (April 2)
🔴 Jobless Claims
Friday (April 3 – Good Friday, market closed)
🔴 Nonfarm Payrolls (very important)
🔴 Unemployment Rate
🌍 Global Data
🇩🇪 Germany Inflation
🇯🇵 Japan Inflation
💸 Eurozone Inflation
🇬🇧 UK GDP
———————-
Simple idea:
The whole week is about jobs and economic strength.
Early data will give hints, but the main move depends on Friday’s jobs report (NFP).
But here’s the twist 👇
Since Friday is a holiday and US stock market is closed, the reaction may be slow at first.
Big moves usually come after the weekend, when full market liquidity returns.
🗓 So don’t expect everything to happen instantly — the real action may come next week.
Next Week in Crypto: Key Events to Watch (March 30th–April 4th, 2026) 🗓
—————
Next week is full of important news that can move the crypto market, especially US economic data and some token unlocks.
Here’s what to watch:
🔒 Token Unlocks
🪙 SUI Token Unlock
Around $36.9M worth of tokens (1.1% supply)
🪙 EIGEN Token Unlock
Around $6.2M (5.5% supply)
🪙 KAMINO Token Unlock
Around $3.9M (5.4% supply)
📊 US Economic Data
Tuesday (March 31)
🔴 Consumer Confidence
Wednesday (April 1)
🔴 ADP Jobs Data
🔴 Retail Sales
🔴 ISM + Manufacturing PMI
Thursday (April 2)
🔴 Jobless Claims
Friday (April 3 – Good Friday, market closed)
🔴 Nonfarm Payrolls (very important)
🔴 Unemployment Rate
🌍 Global Data
🇩🇪 Germany Inflation
🇯🇵 Japan Inflation
💸 Eurozone Inflation
🇬🇧 UK GDP
———————-
Simple idea:
The whole week is about jobs and economic strength.
Early data will give hints, but the main move depends on Friday’s jobs report (NFP).
But here’s the twist 👇
Since Friday is a holiday and US stock market is closed, the reaction may be slow at first.
Big moves usually come after the weekend, when full market liquidity returns.
🗓 So don’t expect everything to happen instantly — the real action may come next week.
—————
Next week is full of important news that can move the crypto market, especially US economic data and some token unlocks.
Here’s what to watch:
🔒 Token Unlocks
🪙 SUI Token Unlock
Around $36.9M worth of tokens (1.1% supply)
🪙 EIGEN Token Unlock
Around $6.2M (5.5% supply)
🪙 KAMINO Token Unlock
Around $3.9M (5.4% supply)
📊 US Economic Data
Tuesday (March 31)
🔴 Consumer Confidence
Wednesday (April 1)
🔴 ADP Jobs Data
🔴 Retail Sales
🔴 ISM + Manufacturing PMI
Thursday (April 2)
🔴 Jobless Claims
Friday (April 3 – Good Friday, market closed)
🔴 Nonfarm Payrolls (very important)
🔴 Unemployment Rate
🌍 Global Data
🇩🇪 Germany Inflation
🇯🇵 Japan Inflation
💸 Eurozone Inflation
🇬🇧 UK GDP
———————-
Simple idea:
The whole week is about jobs and economic strength.
Early data will give hints, but the main move depends on Friday’s jobs report (NFP).
But here’s the twist 👇
Since Friday is a holiday and US stock market is closed, the reaction may be slow at first.
Big moves usually come after the weekend, when full market liquidity returns.
🗓 So don’t expect everything to happen instantly — the real action may come next week.
341
$BTC Bitcoin isn’t done dropping yet.
After already falling around 8–10% from the recent highs near 71.7K, the structure still looks weak. The market is forming a pattern similar to previous cycle tops, with clear bearish pressure building.
Short term, liquidity sits below. A move toward the 60K range looks likely as long positions get trapped and liquidated. Funding rates and positioning show traders are still leaning bullish — and that usually gets punished.
Bigger picture, this could be the early phase of a deeper cycle correction. Any upside from here may just be a fake move before continuation down.
Stay cautious. This is not a market to blindly buy.
#BitcoinPrices #TrumpSaysIranWarHasBeenWon
$BTC Bitcoin isn’t done dropping yet.
After already falling around 8–10% from the recent highs near 71.7K, the structure still looks weak. The market is forming a pattern similar to previous cycle tops, with clear bearish pressure building.
Short term, liquidity sits below. A move toward the 60K range looks likely as long positions get trapped and liquidated. Funding rates and positioning show traders are still leaning bullish — and that usually gets punished.
Bigger picture, this could be the early phase of a deeper cycle correction. Any upside from here may just be a fake move before continuation down.
Stay cautious. This is not a market to blindly buy.
#BitcoinPrices #TrumpSaysIranWarHasBeenWon
After already falling around 8–10% from the recent highs near 71.7K, the structure still looks weak. The market is forming a pattern similar to previous cycle tops, with clear bearish pressure building.
Short term, liquidity sits below. A move toward the 60K range looks likely as long positions get trapped and liquidated. Funding rates and positioning show traders are still leaning bullish — and that usually gets punished.
Bigger picture, this could be the early phase of a deeper cycle correction. Any upside from here may just be a fake move before continuation down.
Stay cautious. This is not a market to blindly buy.
#BitcoinPrices #TrumpSaysIranWarHasBeenWon
1
72
Log in to explore more content
Join global crypto users on Binance Square
⚡️ Get latest and useful information about crypto.
💬 Trusted by the world’s largest crypto exchange.
👍 Discover real insights from verified creators.
Email / Phone number
Trending Topics
BinancePick
2.5M views
138,800 Discussing
Join #EarningsSeason: Predict Earnings on Binance Pick, Share Your Take on Binance Square!
Binance Square Official
·400 Likes
·337.4k views
EarningsSeason
5M views
24,021 Discussing
ElectrumWalletBugLetRogueServersStealFunds
3,254 views
168 Discussing