


HeyElwin
粤A技术分析 专注btc eth. 一周起码3场直播解盘 欢迎交流 •8折手续费邀请码:AL333 • 推@AL333crypto • 你我皆是黑马•
82 Following
15.2K+ Followers
5.2K+ Liked
Posts
All
Quotes
Videos
Live
PINNED
PINNED

·
--
🎙️ Short position in profit, waiting to add

End
01 h 16 m 46 s
259
0
HeyElwin
·
--
BTC
First, the conclusion: I wouldn’t trade the bounce. I’d only wait for a move up to go short.
Objective chart analysis
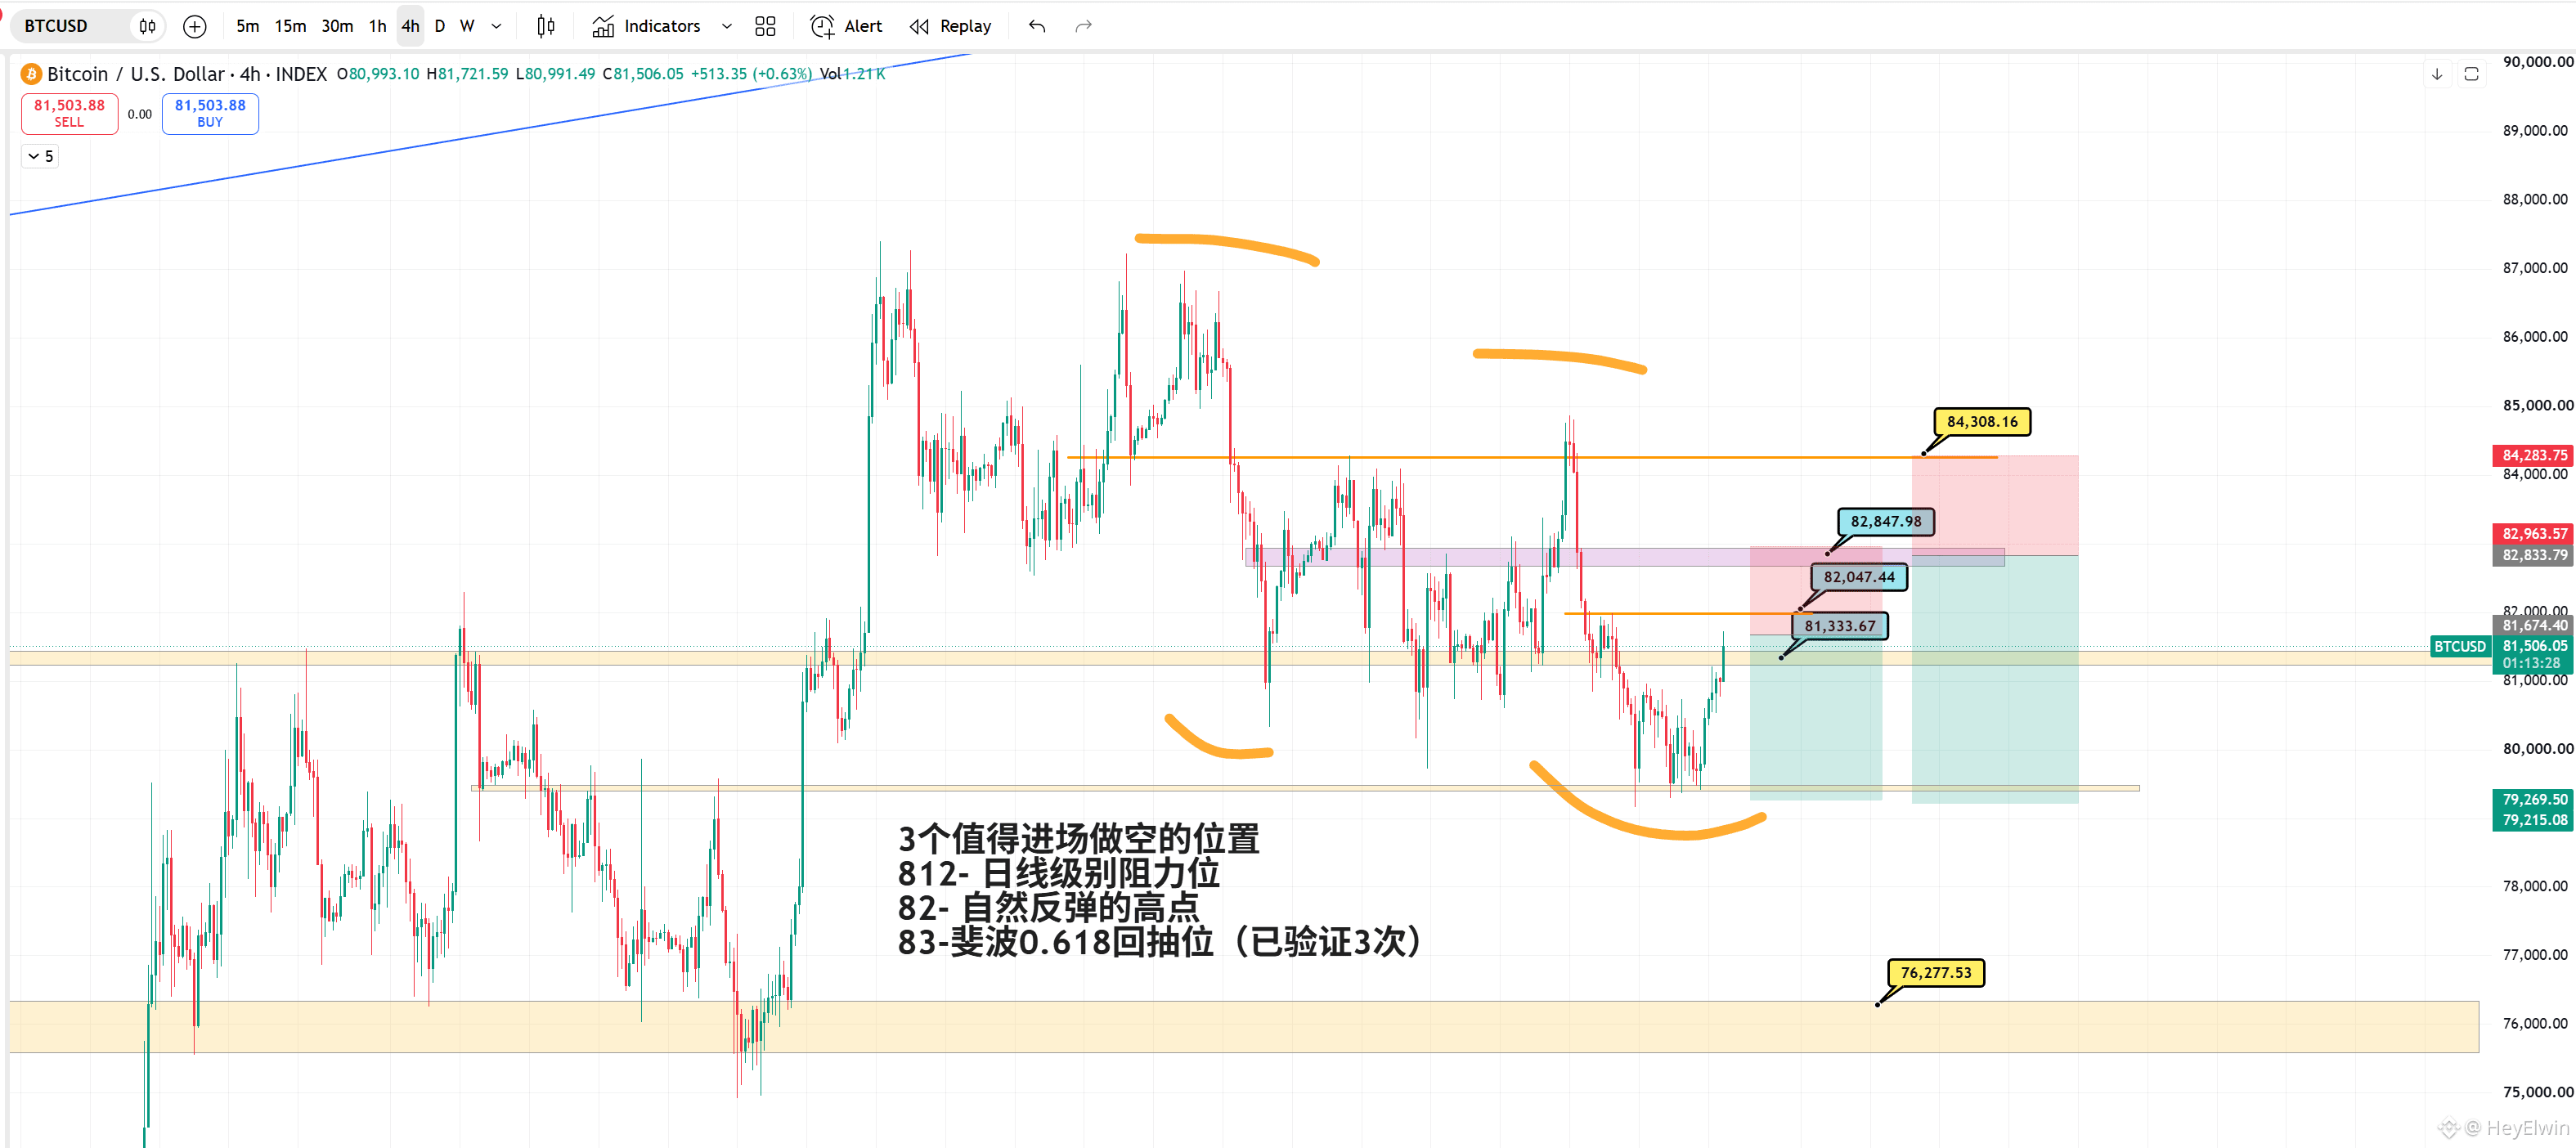
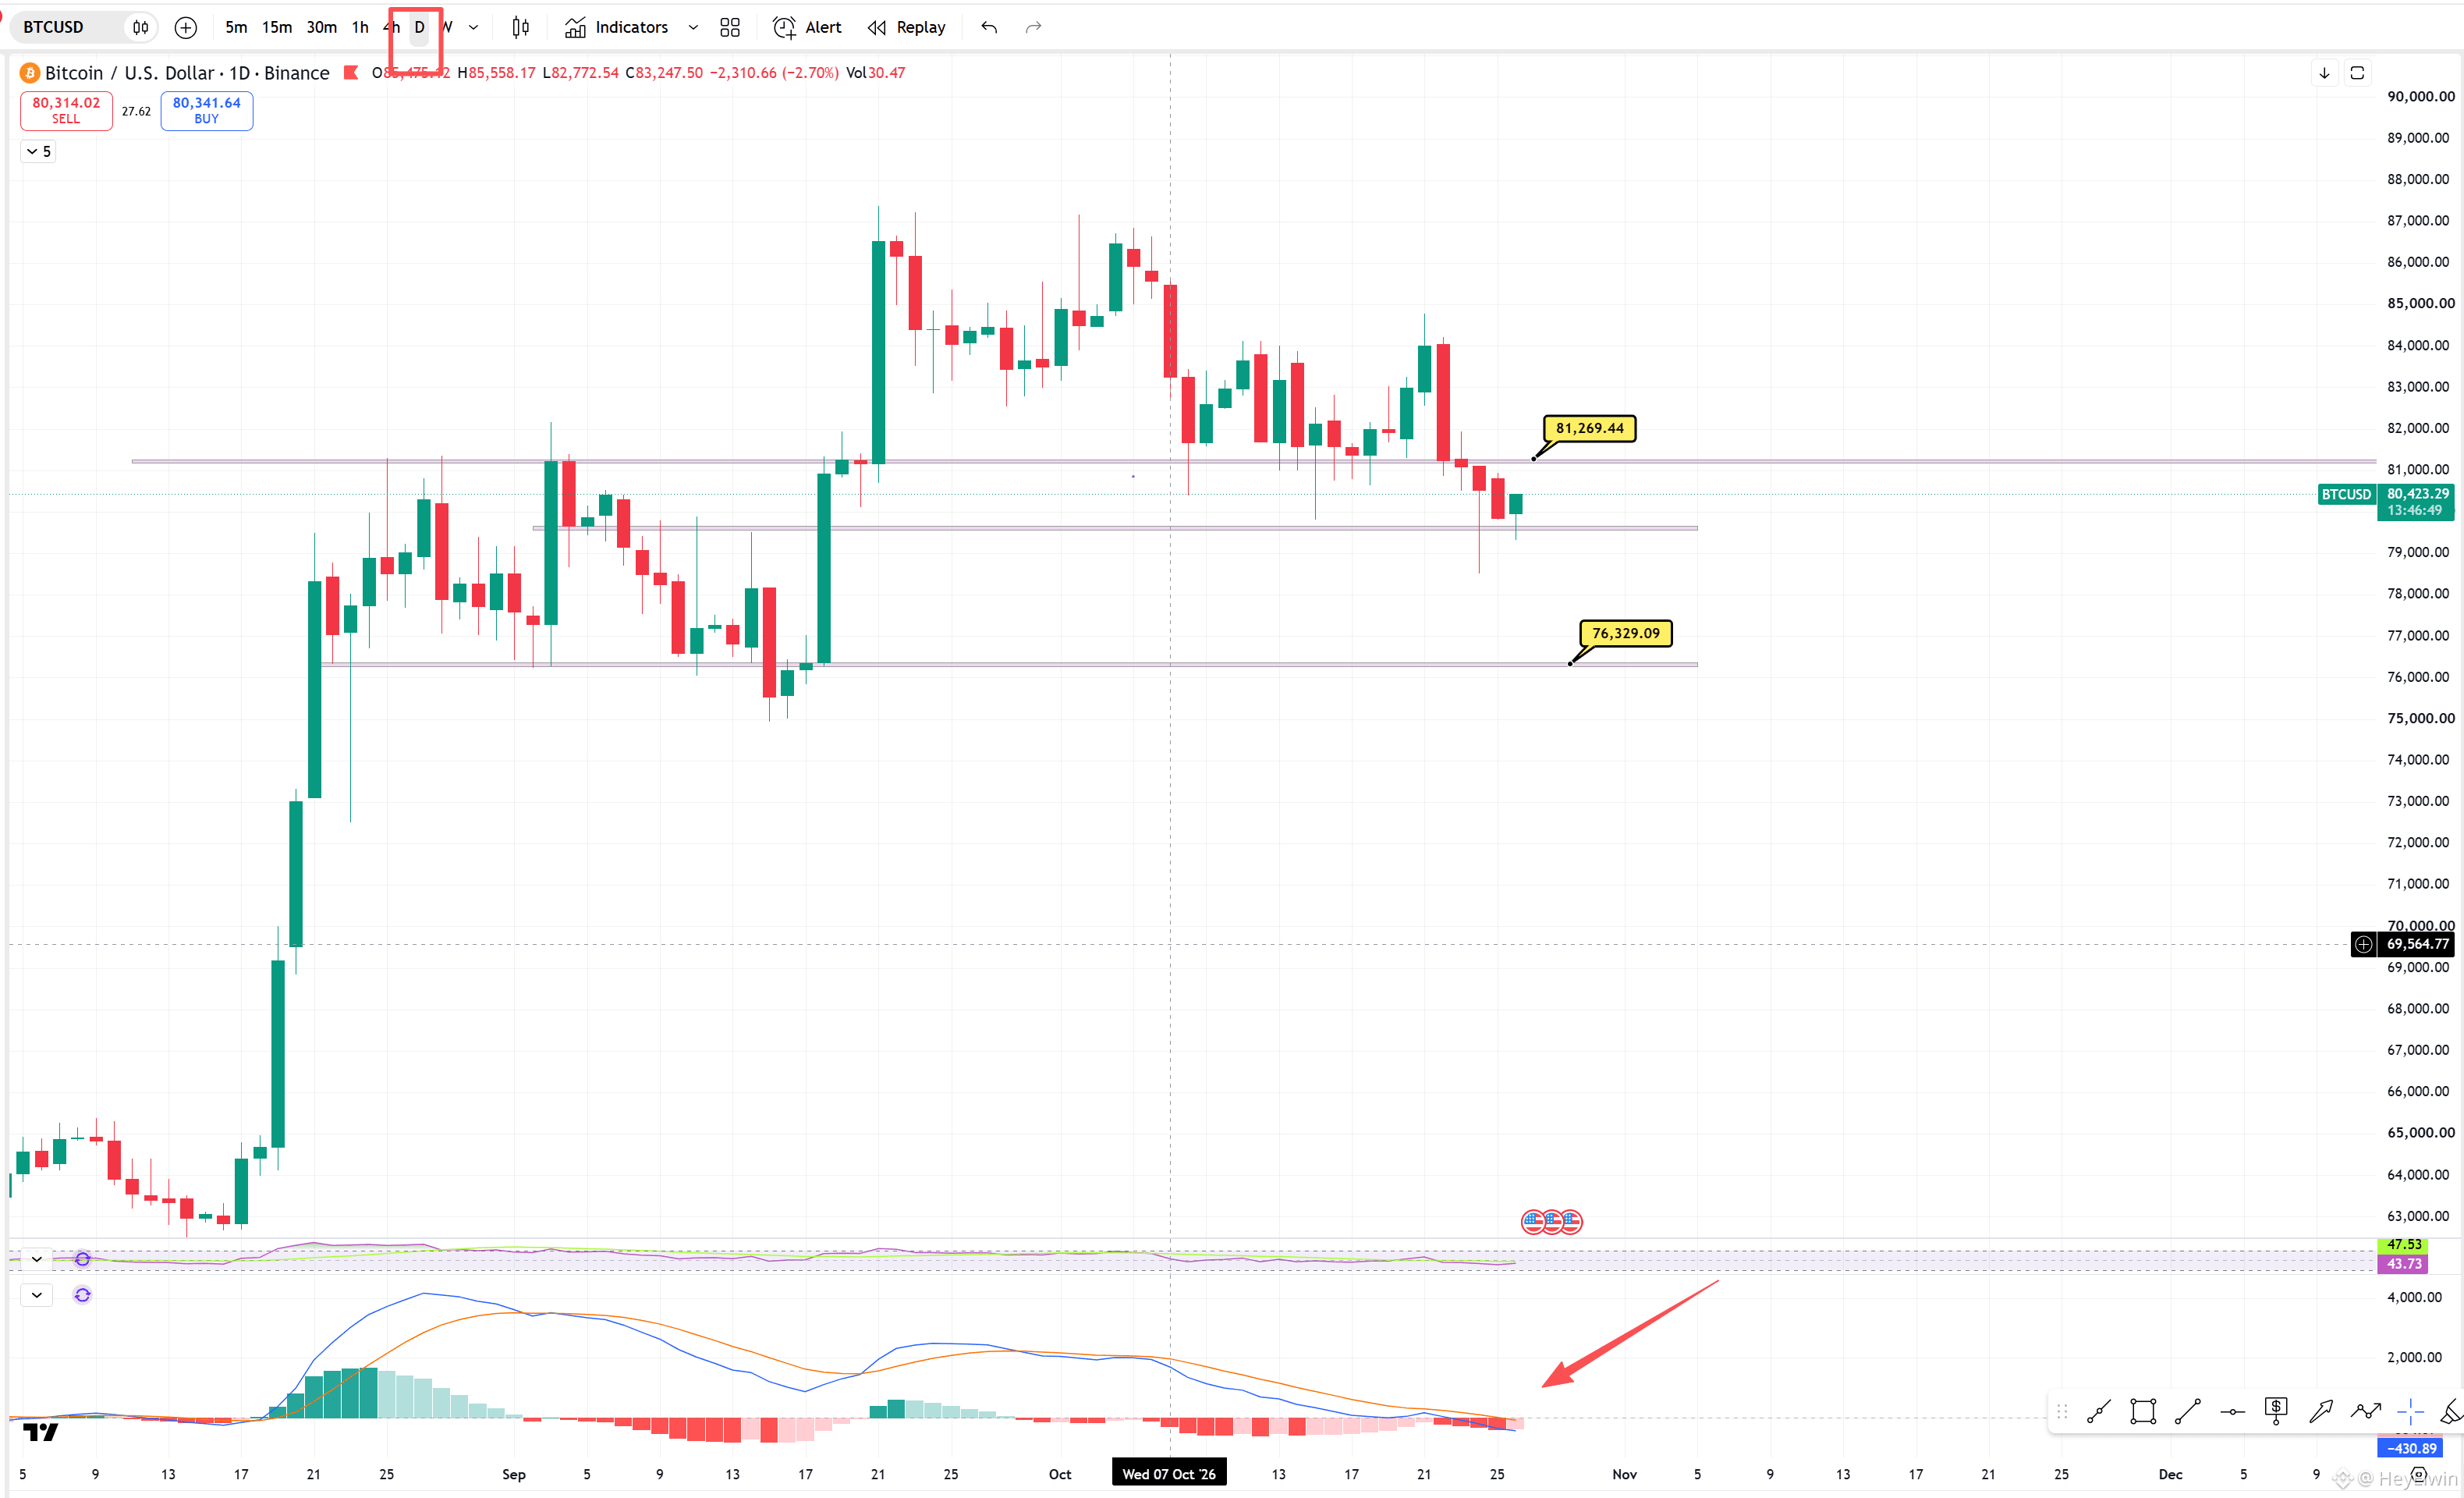
Chart 1. The daily chart has confirmed a breakdown. The zone is 812, not an exact price—check the chart! The turning point where the bearish structure ends is around 8.4.
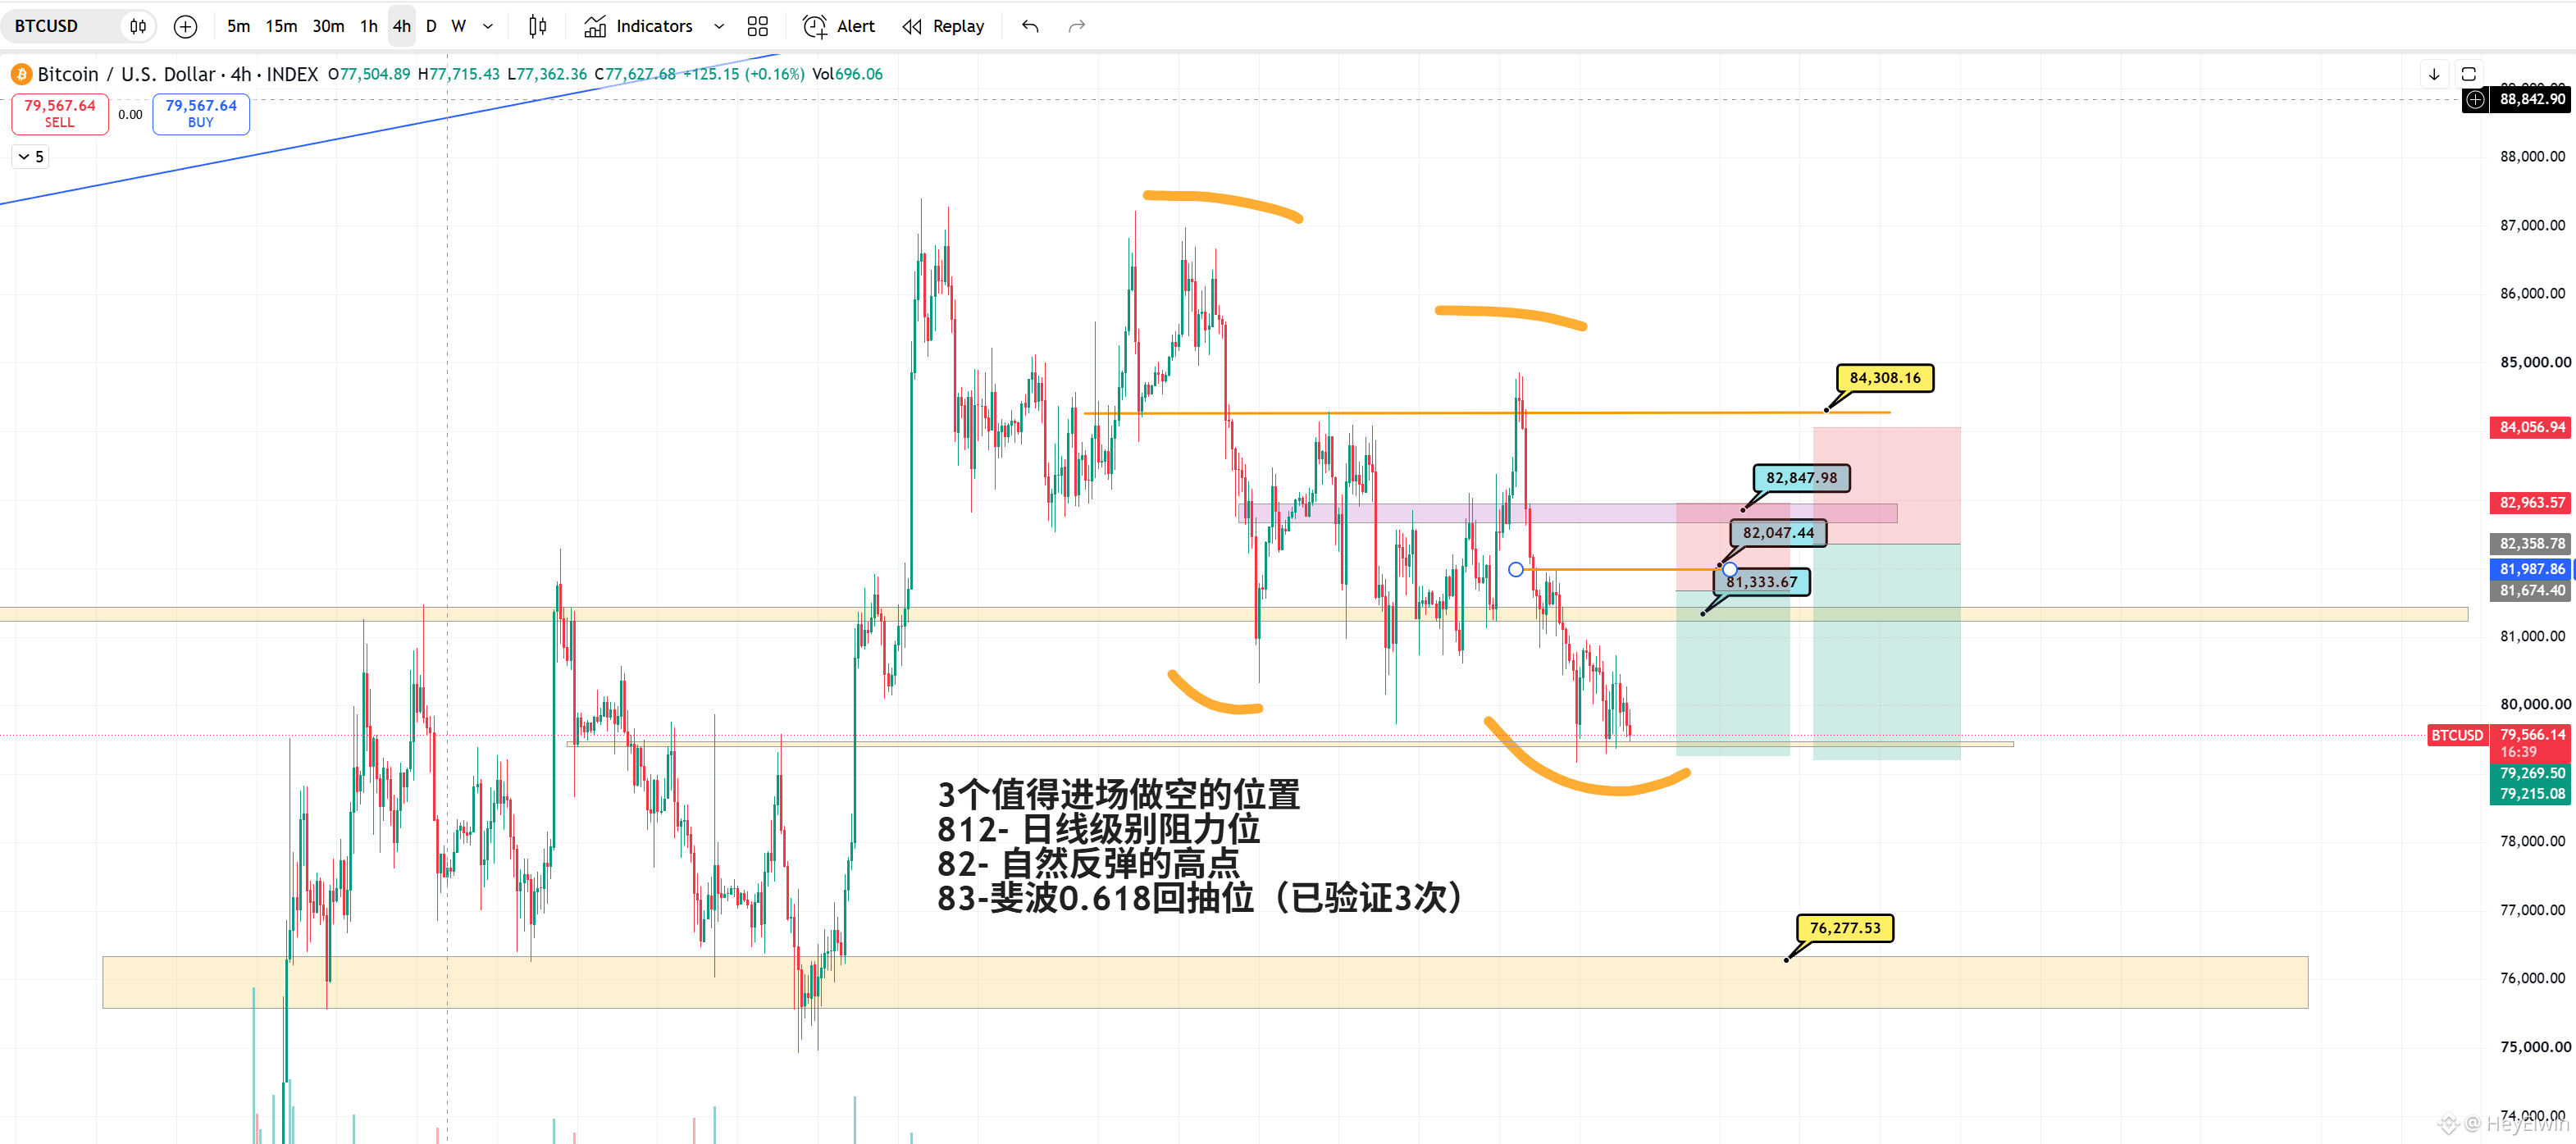
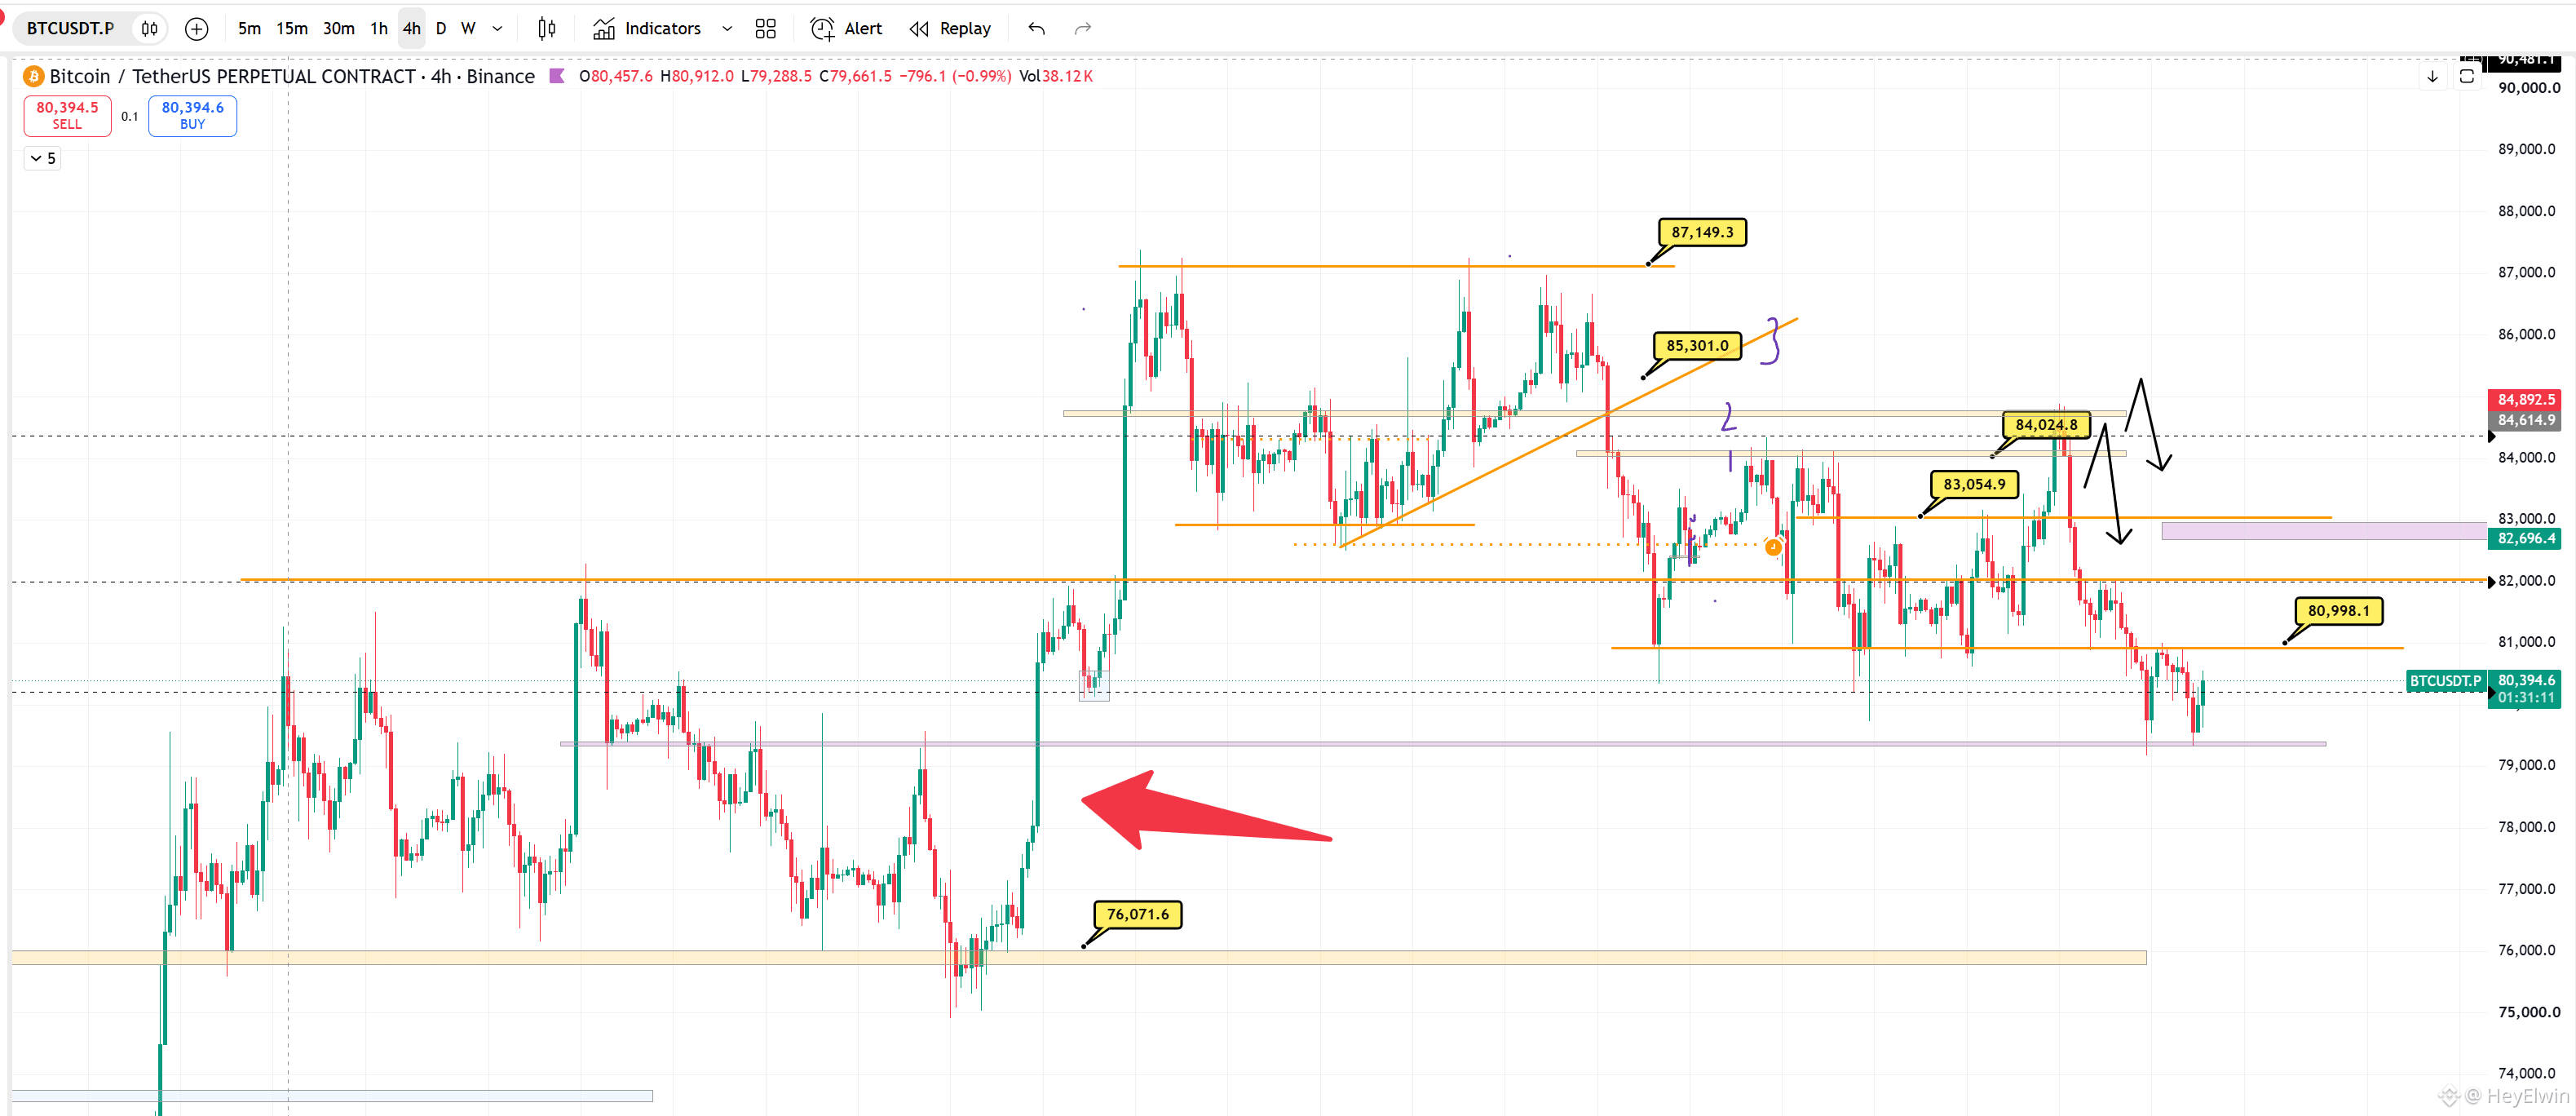
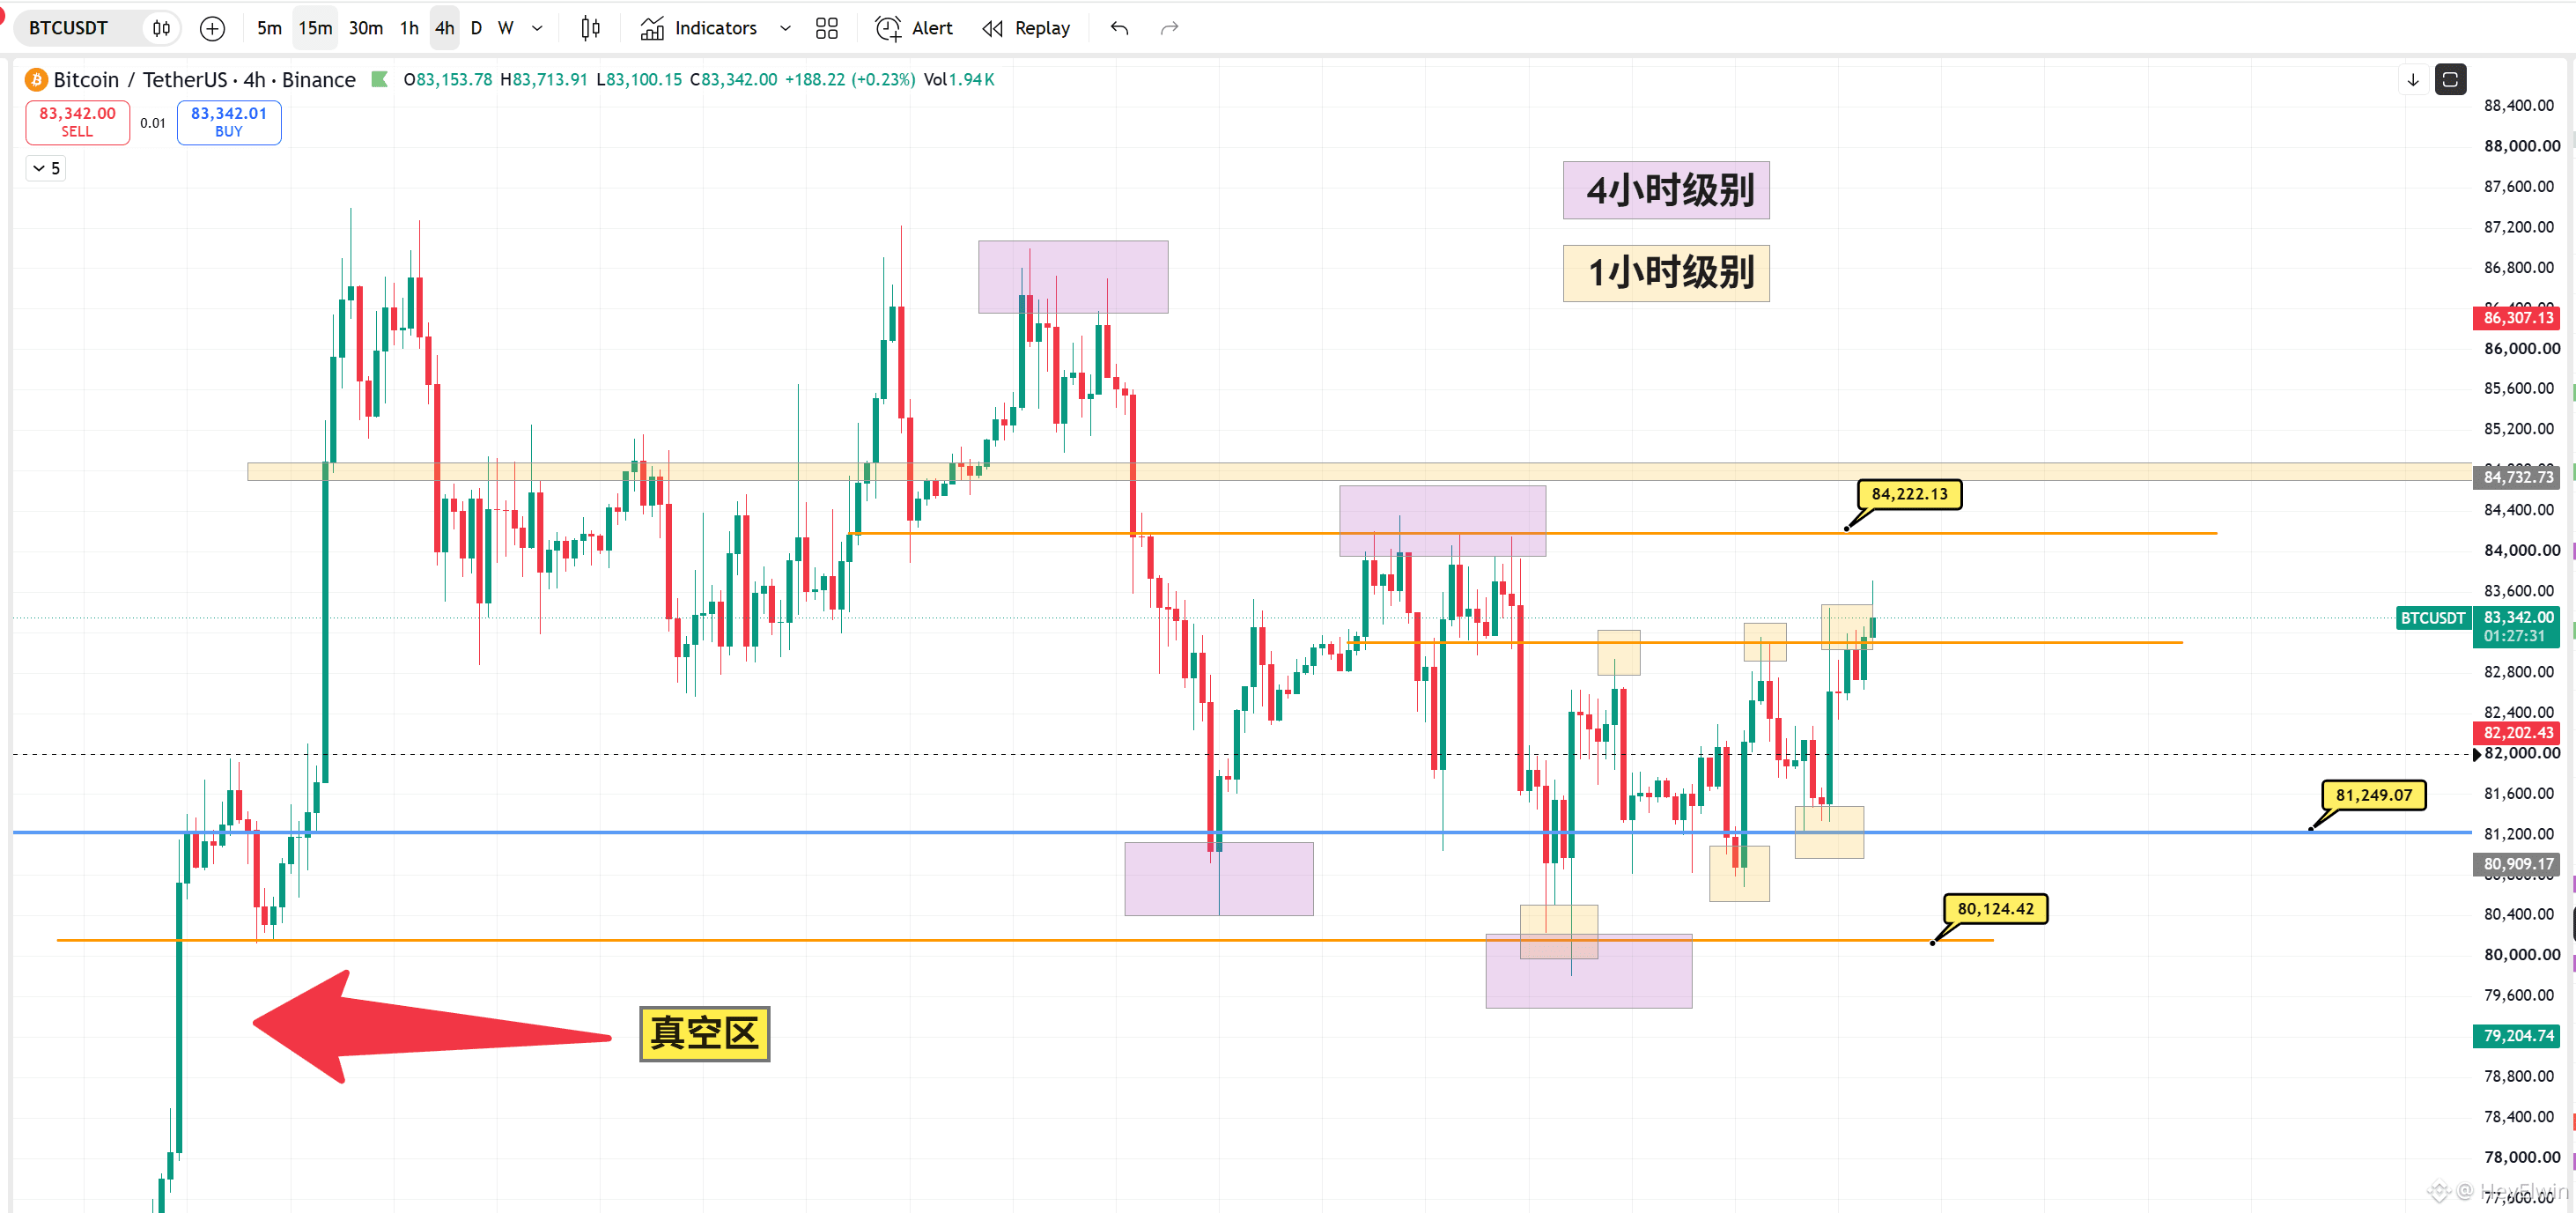
Chart 2. 4-hour timeframe. There’s been a bounce around 7.9. Resistance above is at 8.1/8.21. If the 792 area breaks, there’s still a vacuum zone below.
My view:
With a breakdown like this on the daily chart, unless a massive candle closes back above the breakdown level, the view I’ve held for over a month—that this is not a bull-market recovery—will likely continue. Price may go down to 7.6 to retest support. The daily MACD is now below the zero line too, so there’s nothing wrong with continuing to short the bounces.
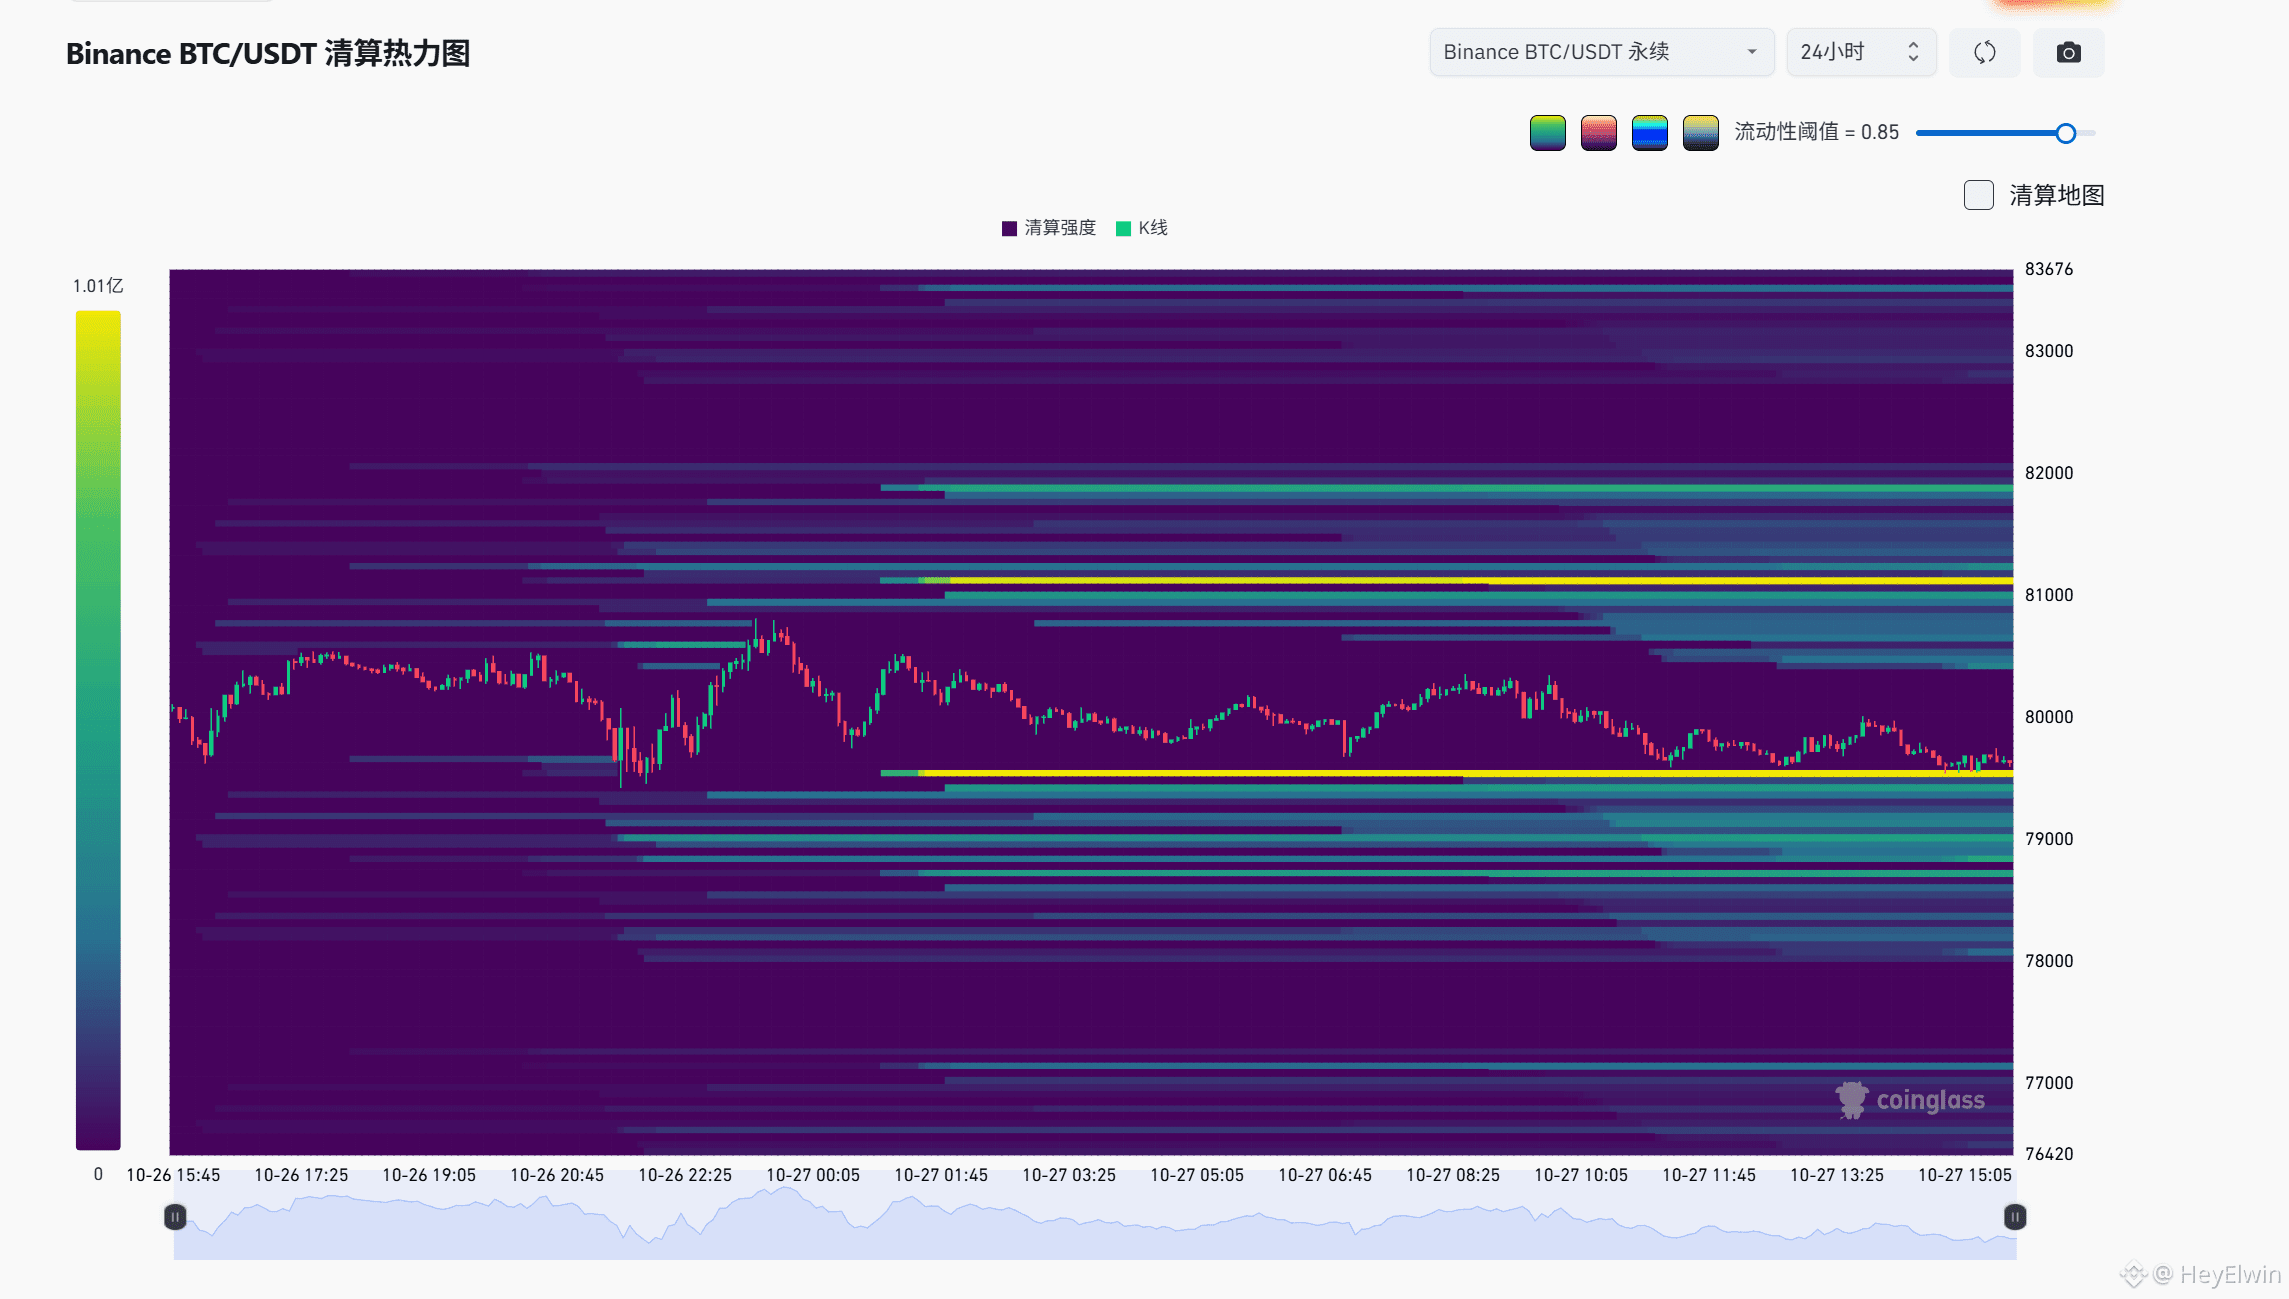
On the 4-hour timeframe, the short-entry levels 1/2/3 I gave over the past two weeks kicked off this selloff after sweep 2. Last Friday’s break below 8.15 ended the bullish structure on the 1-hour timeframe and continued the bearish structure on the 4-hour timeframe. Although there’s been a bounce around 7.9, contract data suggests it’s more likely short positions being closed than new longs entering. Also, during the rebound from the drop that started at 8.7, the 0.618 Fibonacci level has worked multiple times. The current 0.618 level is around 83.
Trading suggestions:
Taking the different timeframes above into account, trade with the trend. I don’t recommend trading any of these bounces.
Short at 827–83; this is the optimal entry zone. Risk level: 8.4.
If the market continues to bounce on low volume today or tomorrow, you could also short near 815. That would be around the 8.3 area.
Of course, you can scale in at 815 and 83, with a stop at 84. Just trade according to your own timeframe. Always use a stop-loss.
I’ll be streaming tonight~ Though I probably won’t get home until after 10. Come by then and let’s chat about the market!~
$BTC
#富兰克林邓普顿申请股息转比特币ETF


币安广场
·
--
The Winners of the Binance Square Original AI Short Video Contest Are In!
💡前情提要 We received 198 creative short videos during the submission period for this event. Thank you to every creator who shared their wild ideas with AI.
In these videos, Binance Square became a futuristic metropolis straight out of a sci-fi blockbuster; a plot twist turned everyday trading into a suspenseful short film; and some creators paired music and visuals so perfectly that the moment the video started, the mood was just right! Every wild idea reflected a fresh vision of Binance Square. These creations gave us a real sense of how much you care about and enjoy the platform.
In these videos, Binance Square became a futuristic metropolis straight out of a sci-fi blockbuster; a plot twist turned everyday trading into a suspenseful short film; and some creators paired music and visuals so perfectly that the moment the video started, the mood was just right! Every wild idea reflected a fresh vision of Binance Square. These creations gave us a real sense of how much you care about and enjoy the platform.
HeyElwin
·
--
BTC
First, the conclusion: I wouldn’t trade the bounce. I’d only wait for a move up to go short.
Objective chart analysis
Chart 1. The daily chart has confirmed a breakdown. The zone is 812, not an exact price—check the chart! The turning point where the bearish structure ends is around 8.4.
Chart 2. 4-hour timeframe. There’s been a bounce around 7.9. Resistance above is at 8.1/8.21. If the 792 area breaks, there’s still a vacuum zone below.
My view:
With a breakdown like this on the daily chart, unless a massive candle closes back above the breakdown level, the view I’ve held for over a month—that this is not a bull-market recovery—will likely continue. Price may go down to 7.6 to retest support. The daily MACD is now below the zero line too, so there’s nothing wrong with continuing to short the bounces.
On the 4-hour timeframe, the short-entry levels 1/2/3 I gave over the past two weeks kicked off this selloff after sweep 2. Last Friday’s break below 8.15 ended the bullish structure on the 1-hour timeframe and continued the bearish structure on the 4-hour timeframe. Although there’s been a bounce around 7.9, contract data suggests it’s more likely short positions being closed than new longs entering. Also, during the rebound from the drop that started at 8.7, the 0.618 Fibonacci level has worked multiple times. The current 0.618 level is around 83.
Trading suggestions:
Taking the different timeframes above into account, trade with the trend. I don’t recommend trading any of these bounces.
Short at 827–83; this is the optimal entry zone. Risk level: 8.4.
If the market continues to bounce on low volume today or tomorrow, you could also short near 815. That would be around the 8.3 area.
Of course, you can scale in at 815 and 83, with a stop at 84. Just trade according to your own timeframe. Always use a stop-loss.
I’ll be streaming tonight~ Though I probably won’t get home until after 10. Come by then and let’s chat about the market!~
$BTC
#富兰克林邓普顿申请股息转比特币ETF
First, the conclusion: I wouldn’t trade the bounce. I’d only wait for a move up to go short.
Objective chart analysis
Chart 1. The daily chart has confirmed a breakdown. The zone is 812, not an exact price—check the chart! The turning point where the bearish structure ends is around 8.4.
Chart 2. 4-hour timeframe. There’s been a bounce around 7.9. Resistance above is at 8.1/8.21. If the 792 area breaks, there’s still a vacuum zone below.
My view:
With a breakdown like this on the daily chart, unless a massive candle closes back above the breakdown level, the view I’ve held for over a month—that this is not a bull-market recovery—will likely continue. Price may go down to 7.6 to retest support. The daily MACD is now below the zero line too, so there’s nothing wrong with continuing to short the bounces.
On the 4-hour timeframe, the short-entry levels 1/2/3 I gave over the past two weeks kicked off this selloff after sweep 2. Last Friday’s break below 8.15 ended the bullish structure on the 1-hour timeframe and continued the bearish structure on the 4-hour timeframe. Although there’s been a bounce around 7.9, contract data suggests it’s more likely short positions being closed than new longs entering. Also, during the rebound from the drop that started at 8.7, the 0.618 Fibonacci level has worked multiple times. The current 0.618 level is around 83.
Trading suggestions:
Taking the different timeframes above into account, trade with the trend. I don’t recommend trading any of these bounces.
Short at 827–83; this is the optimal entry zone. Risk level: 8.4.
If the market continues to bounce on low volume today or tomorrow, you could also short near 815. That would be around the 8.3 area.
Of course, you can scale in at 815 and 83, with a stop at 84. Just trade according to your own timeframe. Always use a stop-loss.
I’ll be streaming tonight~ Though I probably won’t get home until after 10. Come by then and let’s chat about the market!~
$BTC
#富兰克林邓普顿申请股息转比特币ETF
·
--
🎙️ A rebound? Still a chance to short on the way up!

End
01 h 09 m 41 s
256
0
HeyElwin
·
--
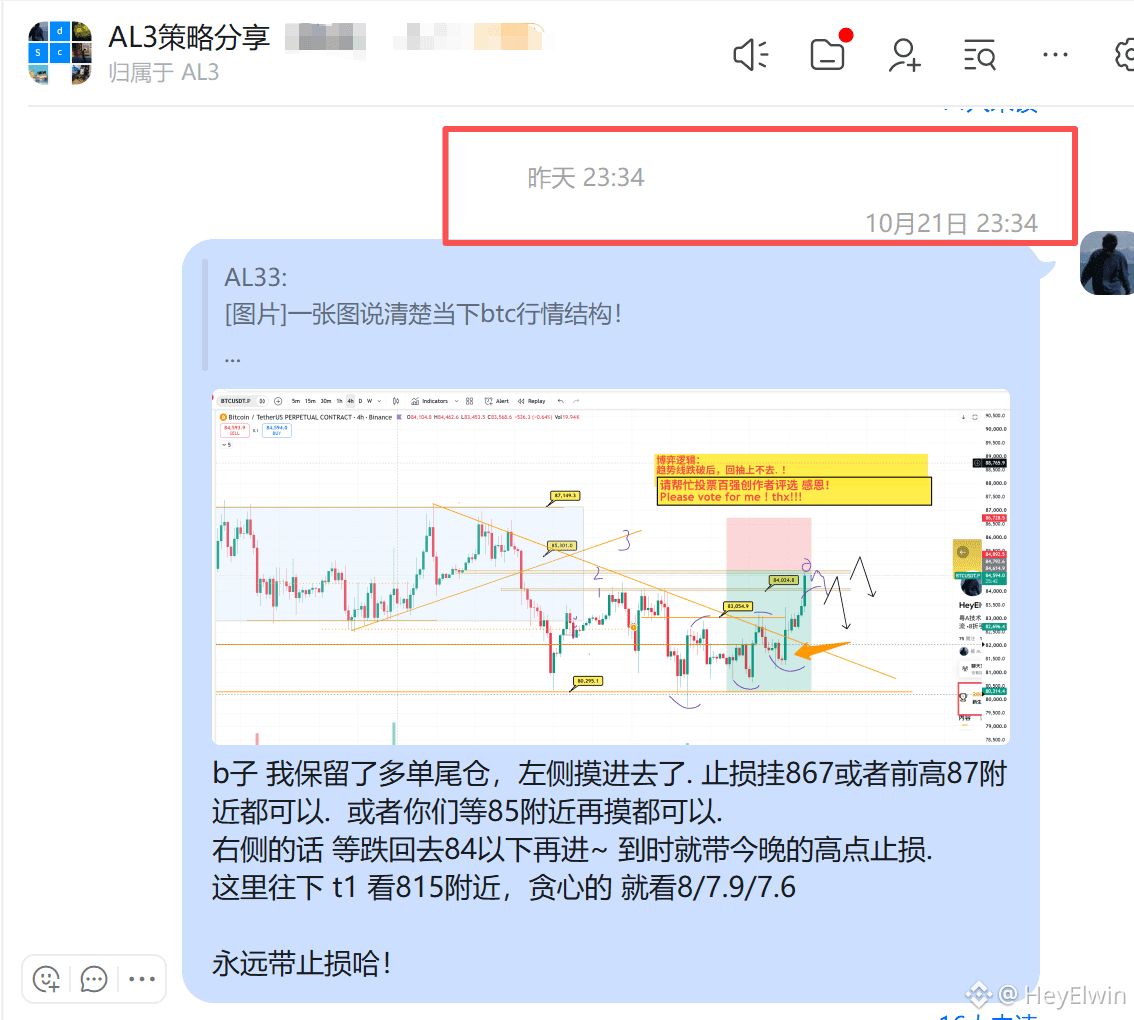
A chart to explain the current BTC market structure! Just read the chart!!!
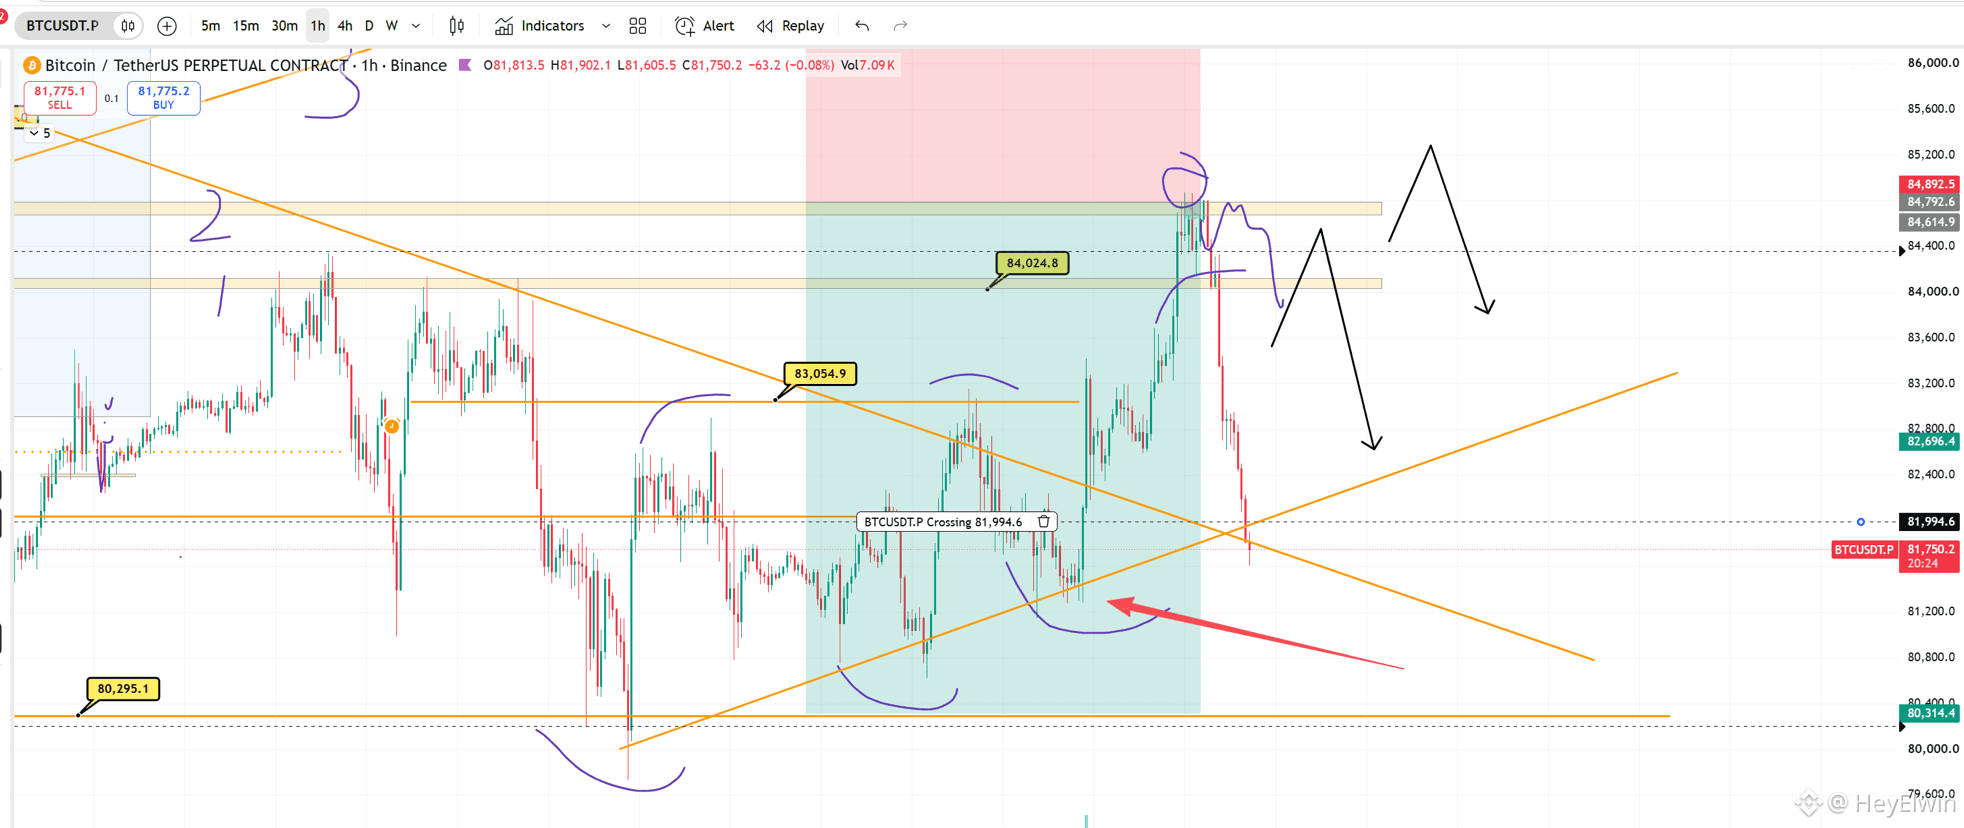
4-hour timeframe: A bearish structure has yet to form; the higher high is at 8.42.
1-hour timeframe: Bullish structure; the lower low is at 8.12.
Right now, the closer price gets to the 4-hour resistance at 8.42, the more you should take profit on long positions and wait for a short opportunity if price consolidates and breaks down.
As long as 8.42 hasn't been broken, if price drops again, you could consider going long once more near 8.12, with a stop-loss at the previous 1-hour low.
The key support below is around 80k; if price falls below it, that's a vacuum zone. So wherever you go long, this is a firm stop-loss level.
Don't overcomplicate trading! And don't worry about whether BTC is going to 90k or dropping to 75k. As long as 8.42 hasn't been broken or 8 hasn't been breached to the downside, just follow the structure corresponding to your trading timeframe.
$BTC #BTC走势分析
·
--
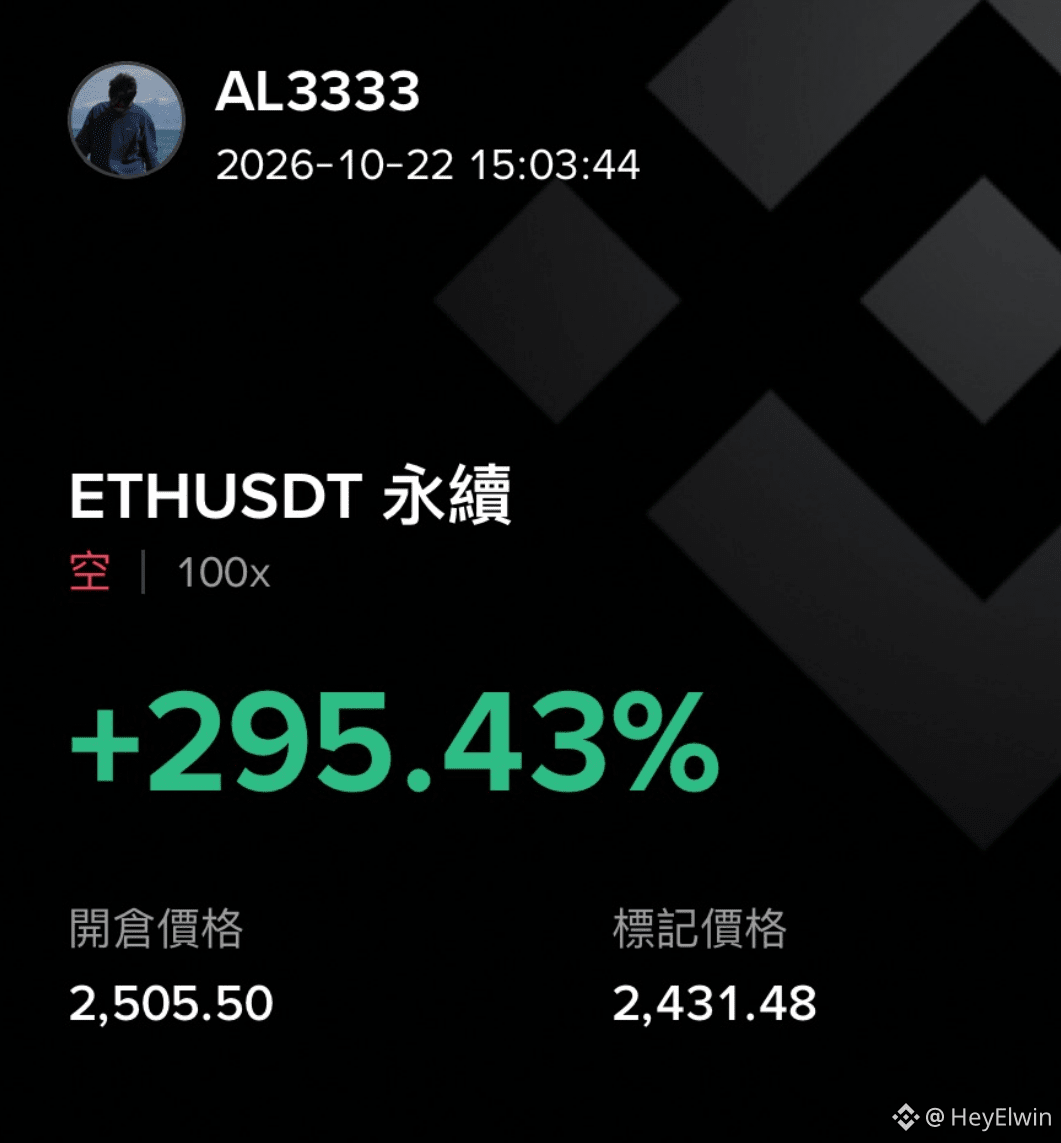
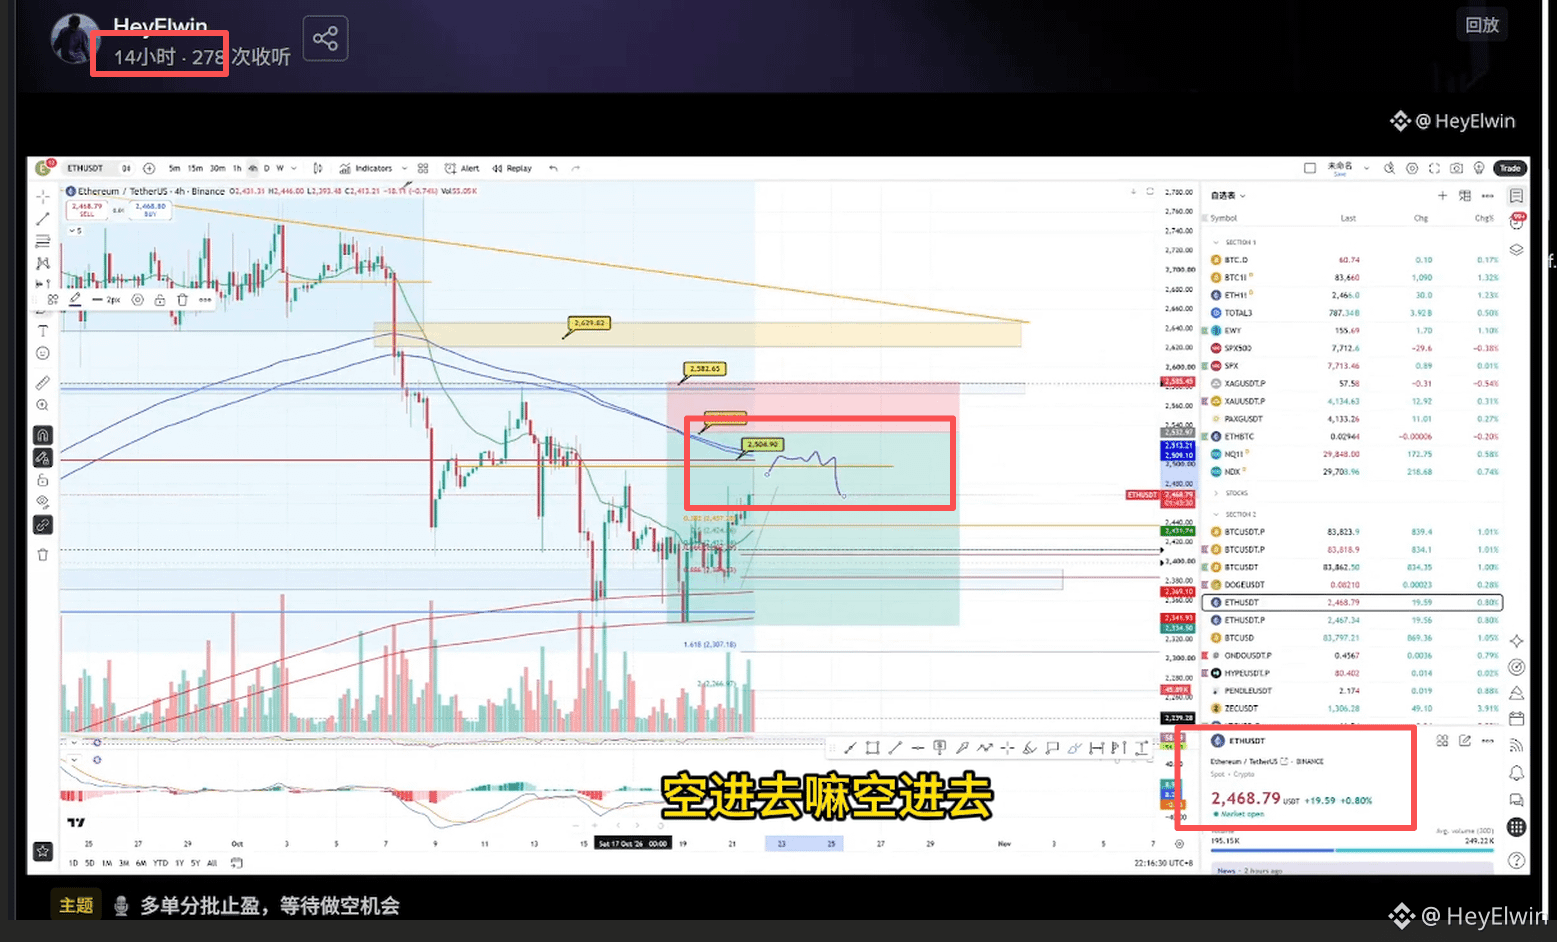
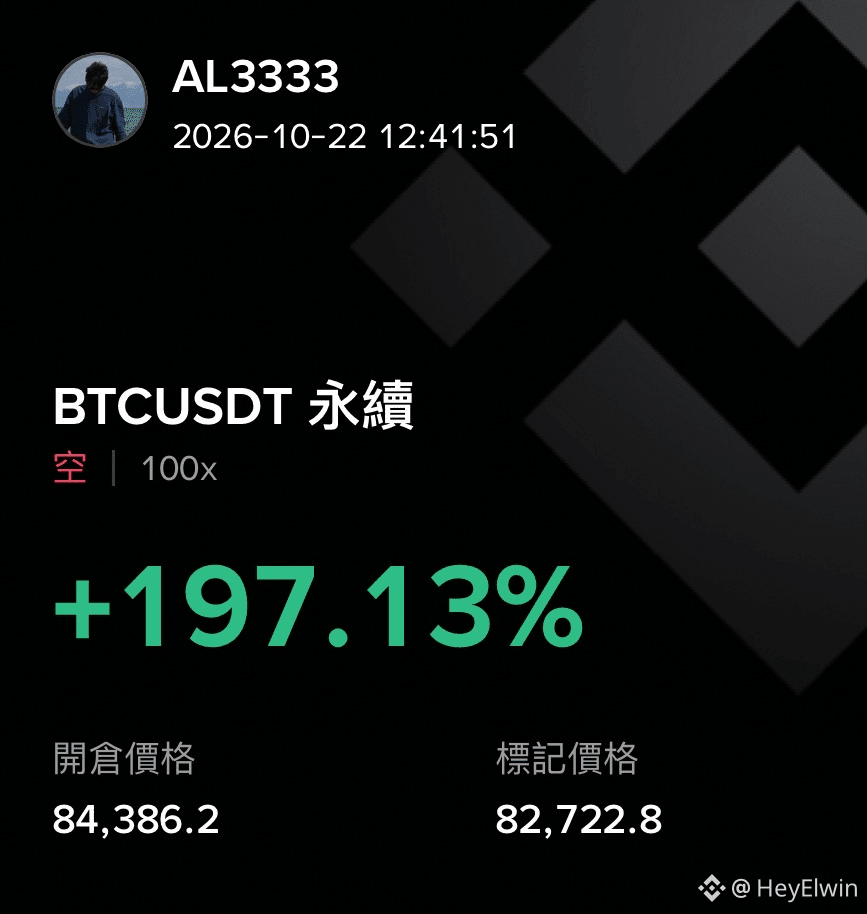
🎙️ Short position: 2,500+ points in profit. Reduce the position and wait for a signal.

End
48 m 24 s
264
0


HeyElwin
·
--
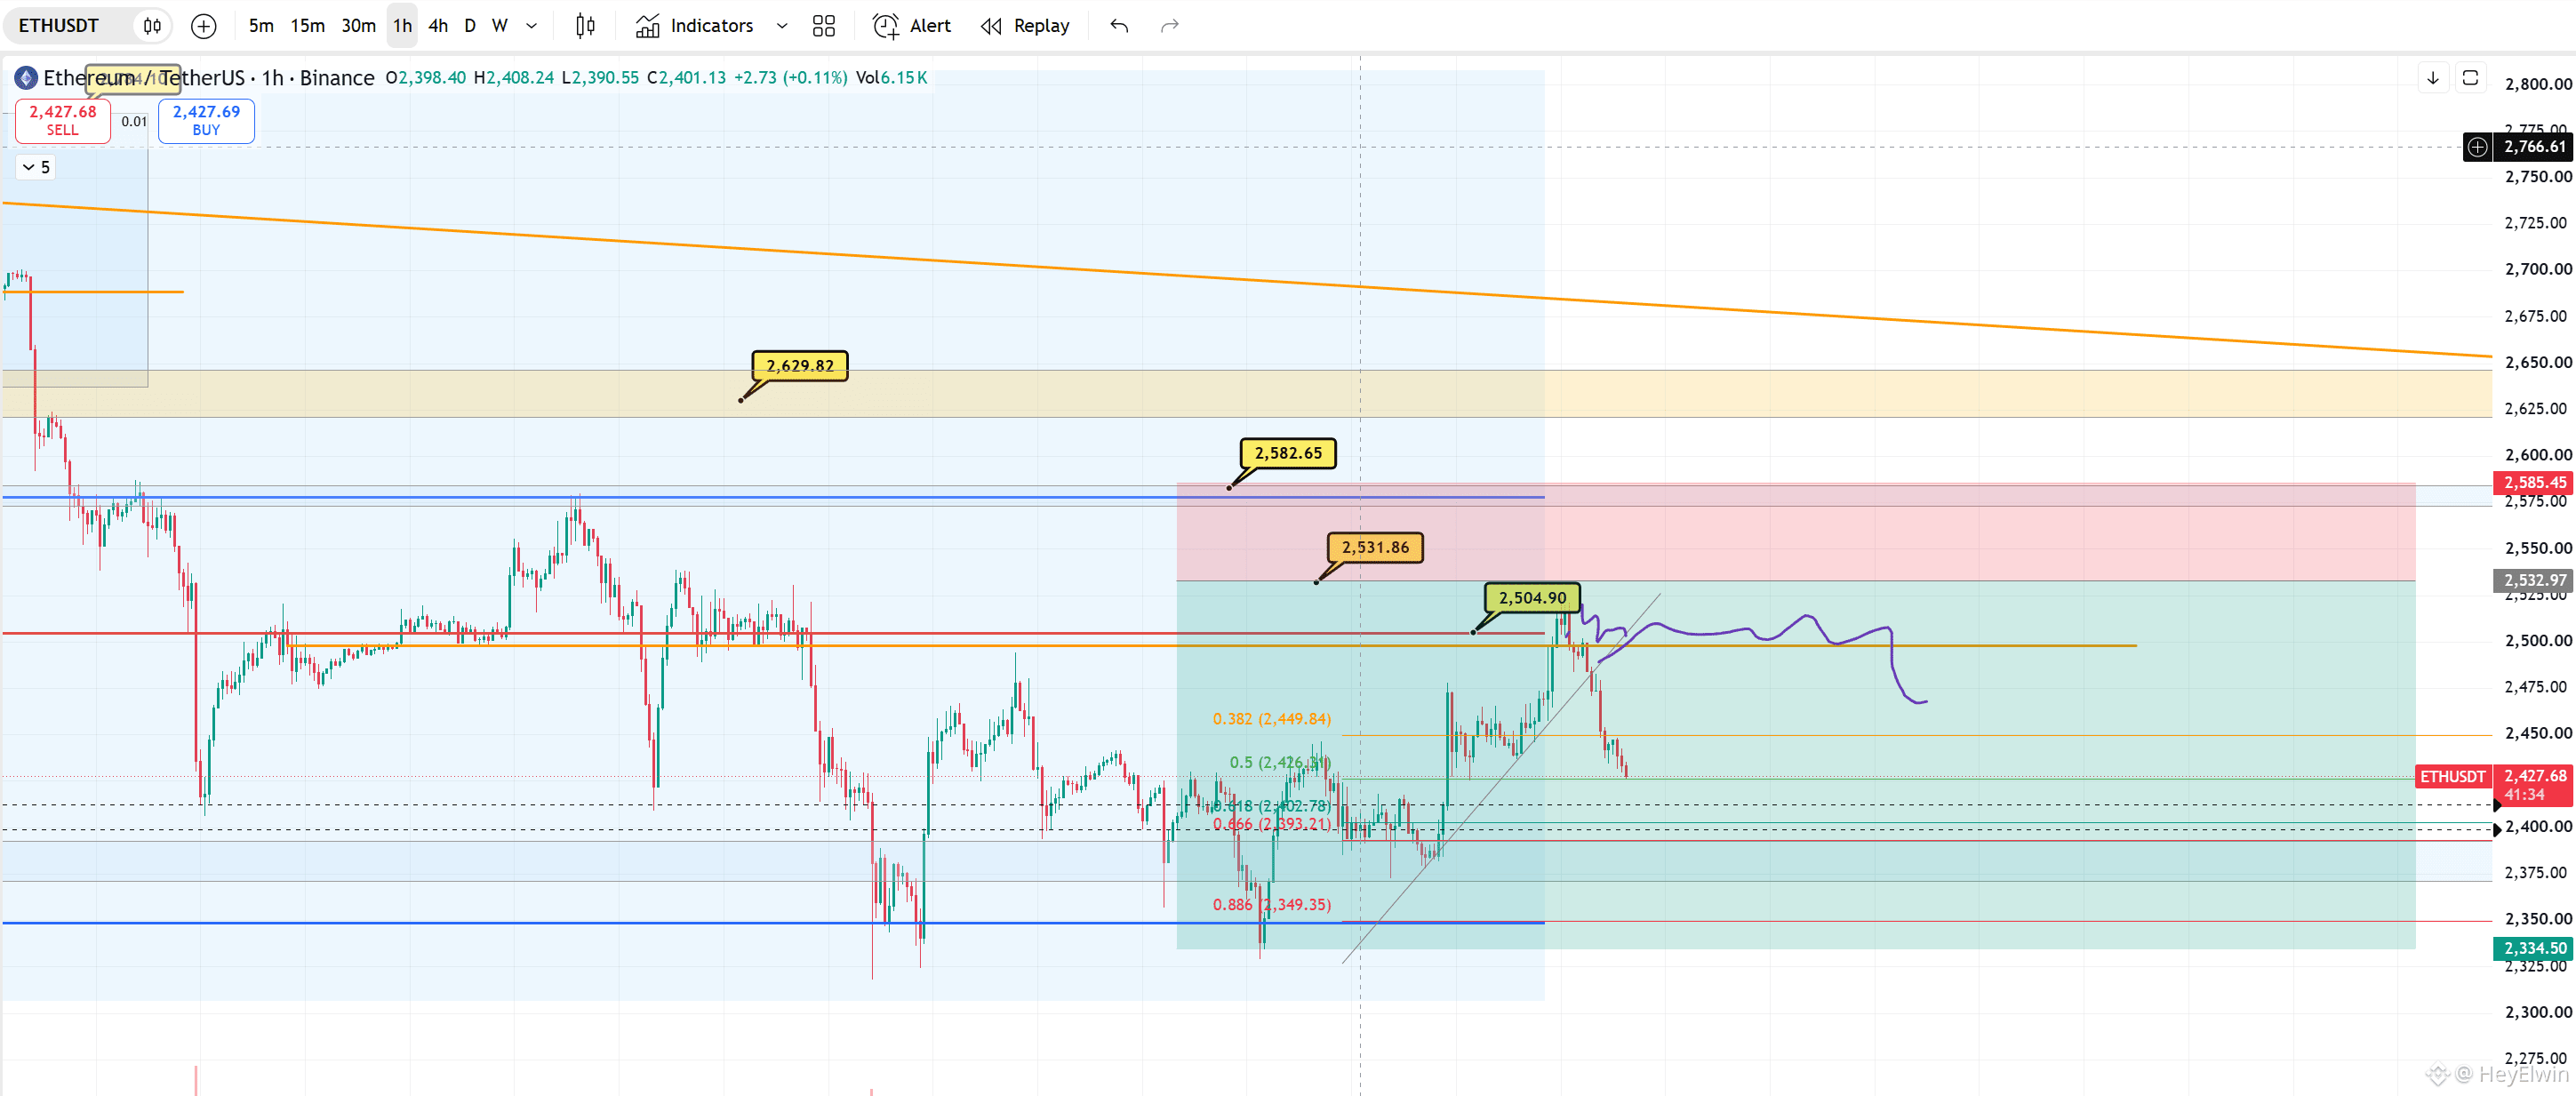
A chart to explain the current BTC market structure! Just read the chart!!!
4-hour timeframe: A bearish structure has yet to form; the higher high is at 8.42.
1-hour timeframe: Bullish structure; the lower low is at 8.12.
Right now, the closer price gets to the 4-hour resistance at 8.42, the more you should take profit on long positions and wait for a short opportunity if price consolidates and breaks down.
As long as 8.42 hasn't been broken, if price drops again, you could consider going long once more near 8.12, with a stop-loss at the previous 1-hour low.
The key support below is around 80k; if price falls below it, that's a vacuum zone. So wherever you go long, this is a firm stop-loss level.
Don't overcomplicate trading! And don't worry about whether BTC is going to 90k or dropping to 75k. As long as 8.42 hasn't been broken or 8 hasn't been breached to the downside, just follow the structure corresponding to your trading timeframe.
$BTC #BTC走势分析
4-hour timeframe: A bearish structure has yet to form; the higher high is at 8.42.
1-hour timeframe: Bullish structure; the lower low is at 8.12.
Right now, the closer price gets to the 4-hour resistance at 8.42, the more you should take profit on long positions and wait for a short opportunity if price consolidates and breaks down.
As long as 8.42 hasn't been broken, if price drops again, you could consider going long once more near 8.12, with a stop-loss at the previous 1-hour low.
The key support below is around 80k; if price falls below it, that's a vacuum zone. So wherever you go long, this is a firm stop-loss level.
Don't overcomplicate trading! And don't worry about whether BTC is going to 90k or dropping to 75k. As long as 8.42 hasn't been broken or 8 hasn't been breached to the downside, just follow the structure corresponding to your trading timeframe.
$BTC #BTC走势分析

HeyElwin
·
--
BTC
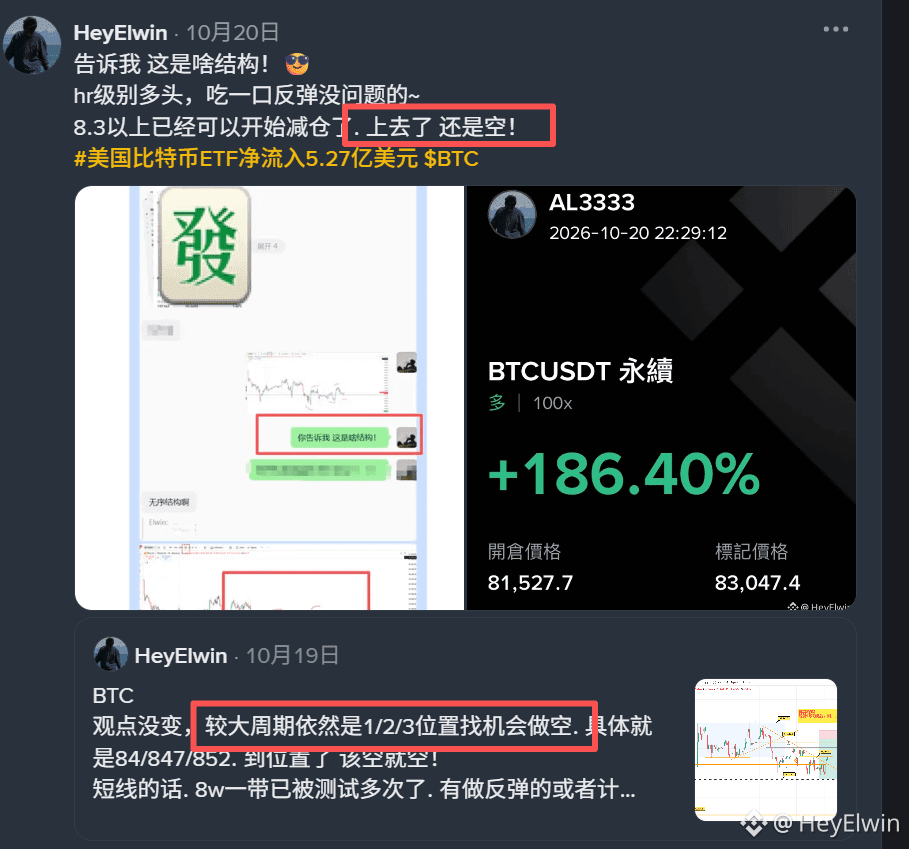
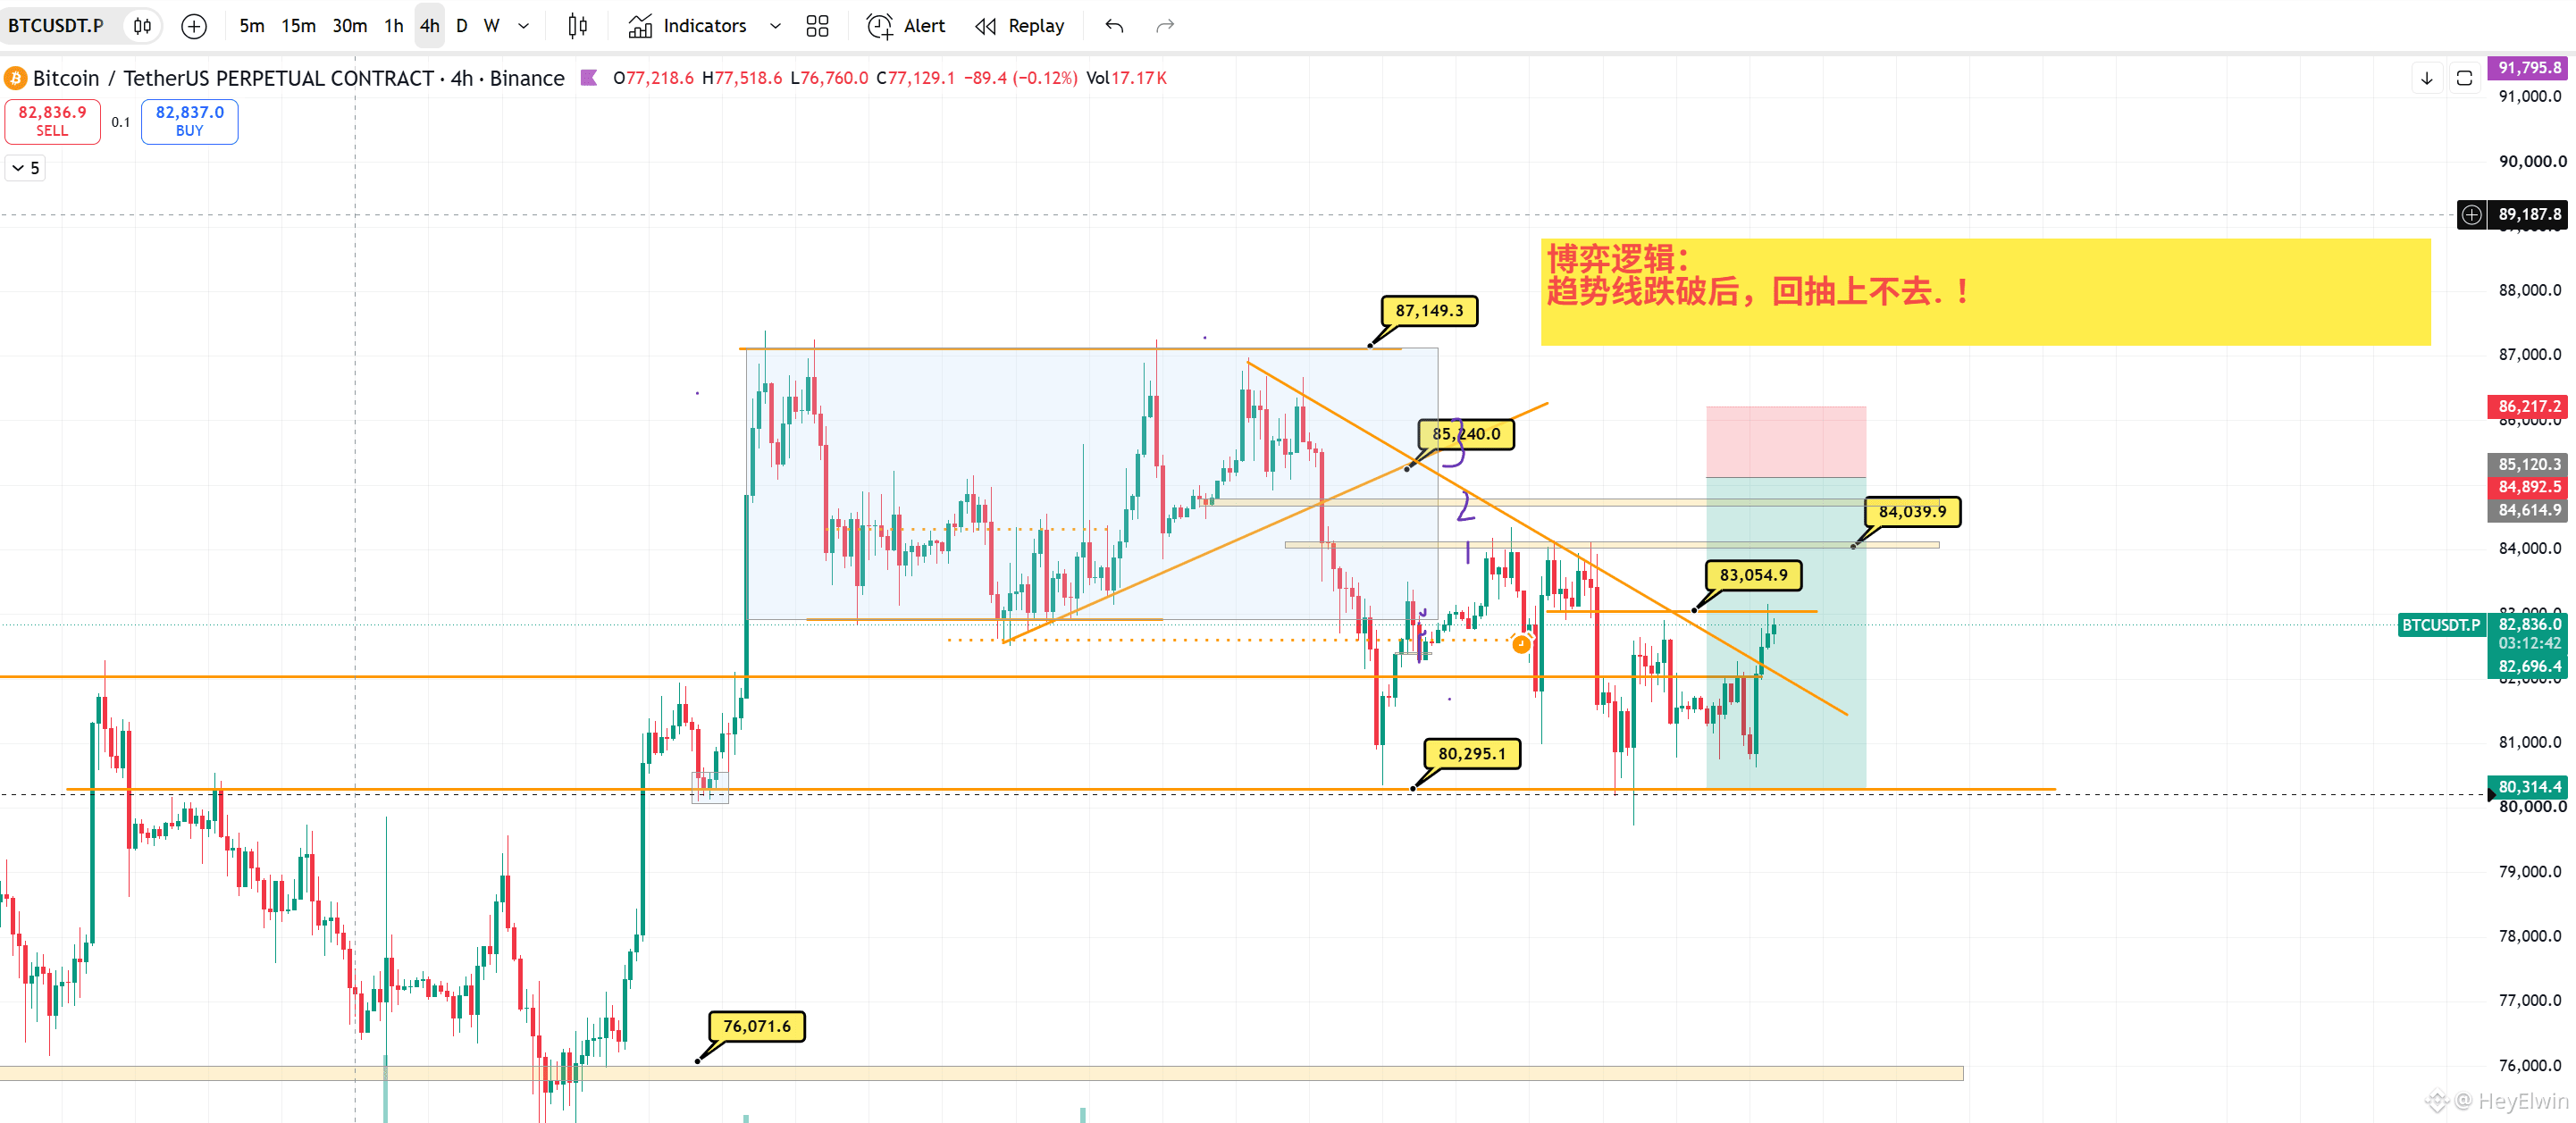
My view hasn’t changed: on the higher timeframes, I’m still looking for short opportunities at the 1/2/3 levels. Specifically, 84/847/852. When price gets there, take the short!
For the short term, the 80k area has been tested multiple times. If you’re playing a bounce or planning to go long on a pullback, this is a hard stop-loss level. There’s relatively little support below, so don’t hold on if it breaks down.
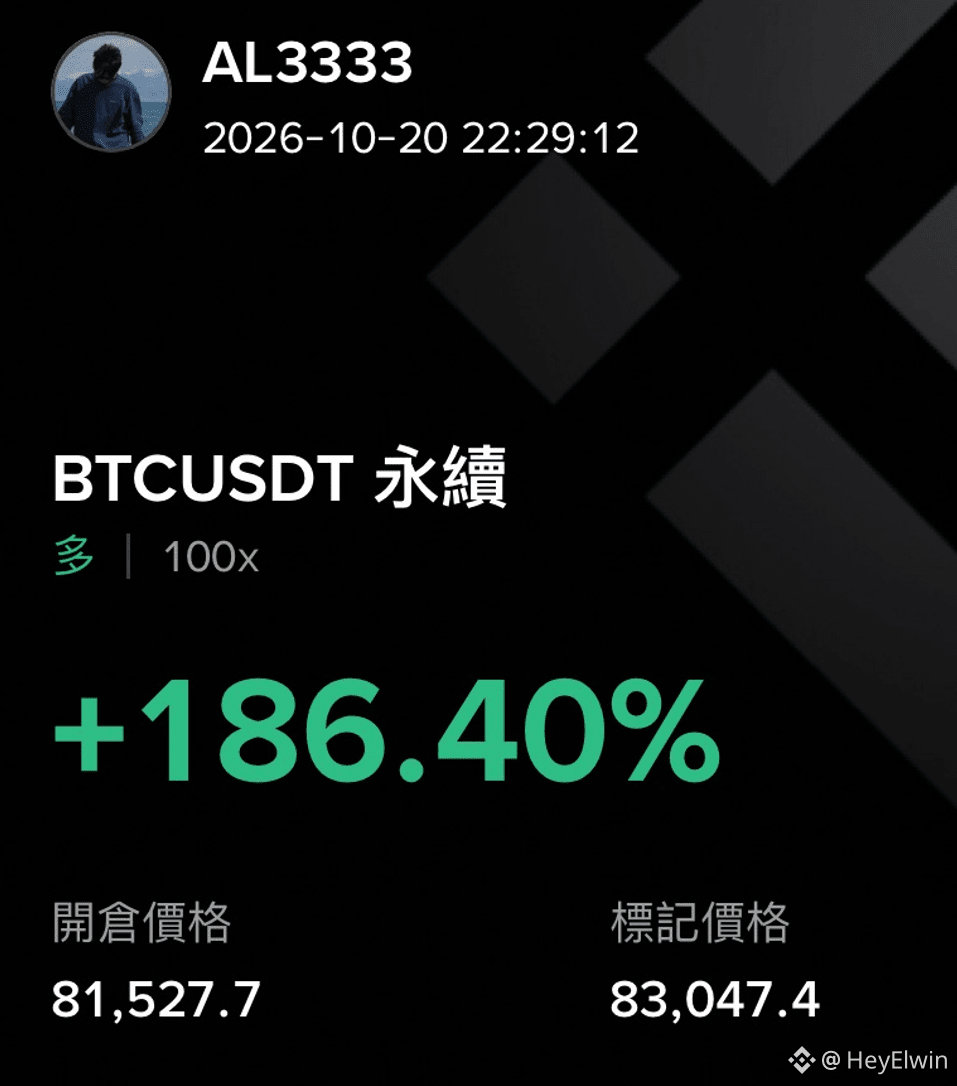
Likewise, if you went long near 80k over the weekend to play a bounce, you can start taking profits in batches around 83 and those levels.
Trade different setups on different timeframes. Always use a stop-loss~
$BTC #比特币突破8.3万美元


HeyElwin
·
--
BearishBTC
Yesterday, price swept and reclaimed the area around 80k. The rebound has now entered a small consolidation.
As mentioned in last night's analysis, the area around 8.32 is where the trendline and horizontal resistance converge. So this is both the line of defense for short-term shorts and an area to watch for long-term short entries. Also, the levels further above at 1/2/3 remain valid.
Support below is still around 8. If it breaks, shorts can take things step by step at 7.9/7.8/7.56~
Overall, a clear bearish structure has emerged on timeframes of 4 hours and above. It simply comes down to traders entering from different levels according to their trading timeframes~
$BTC
#比特币回升至8.2万美元
Log in to explore more content