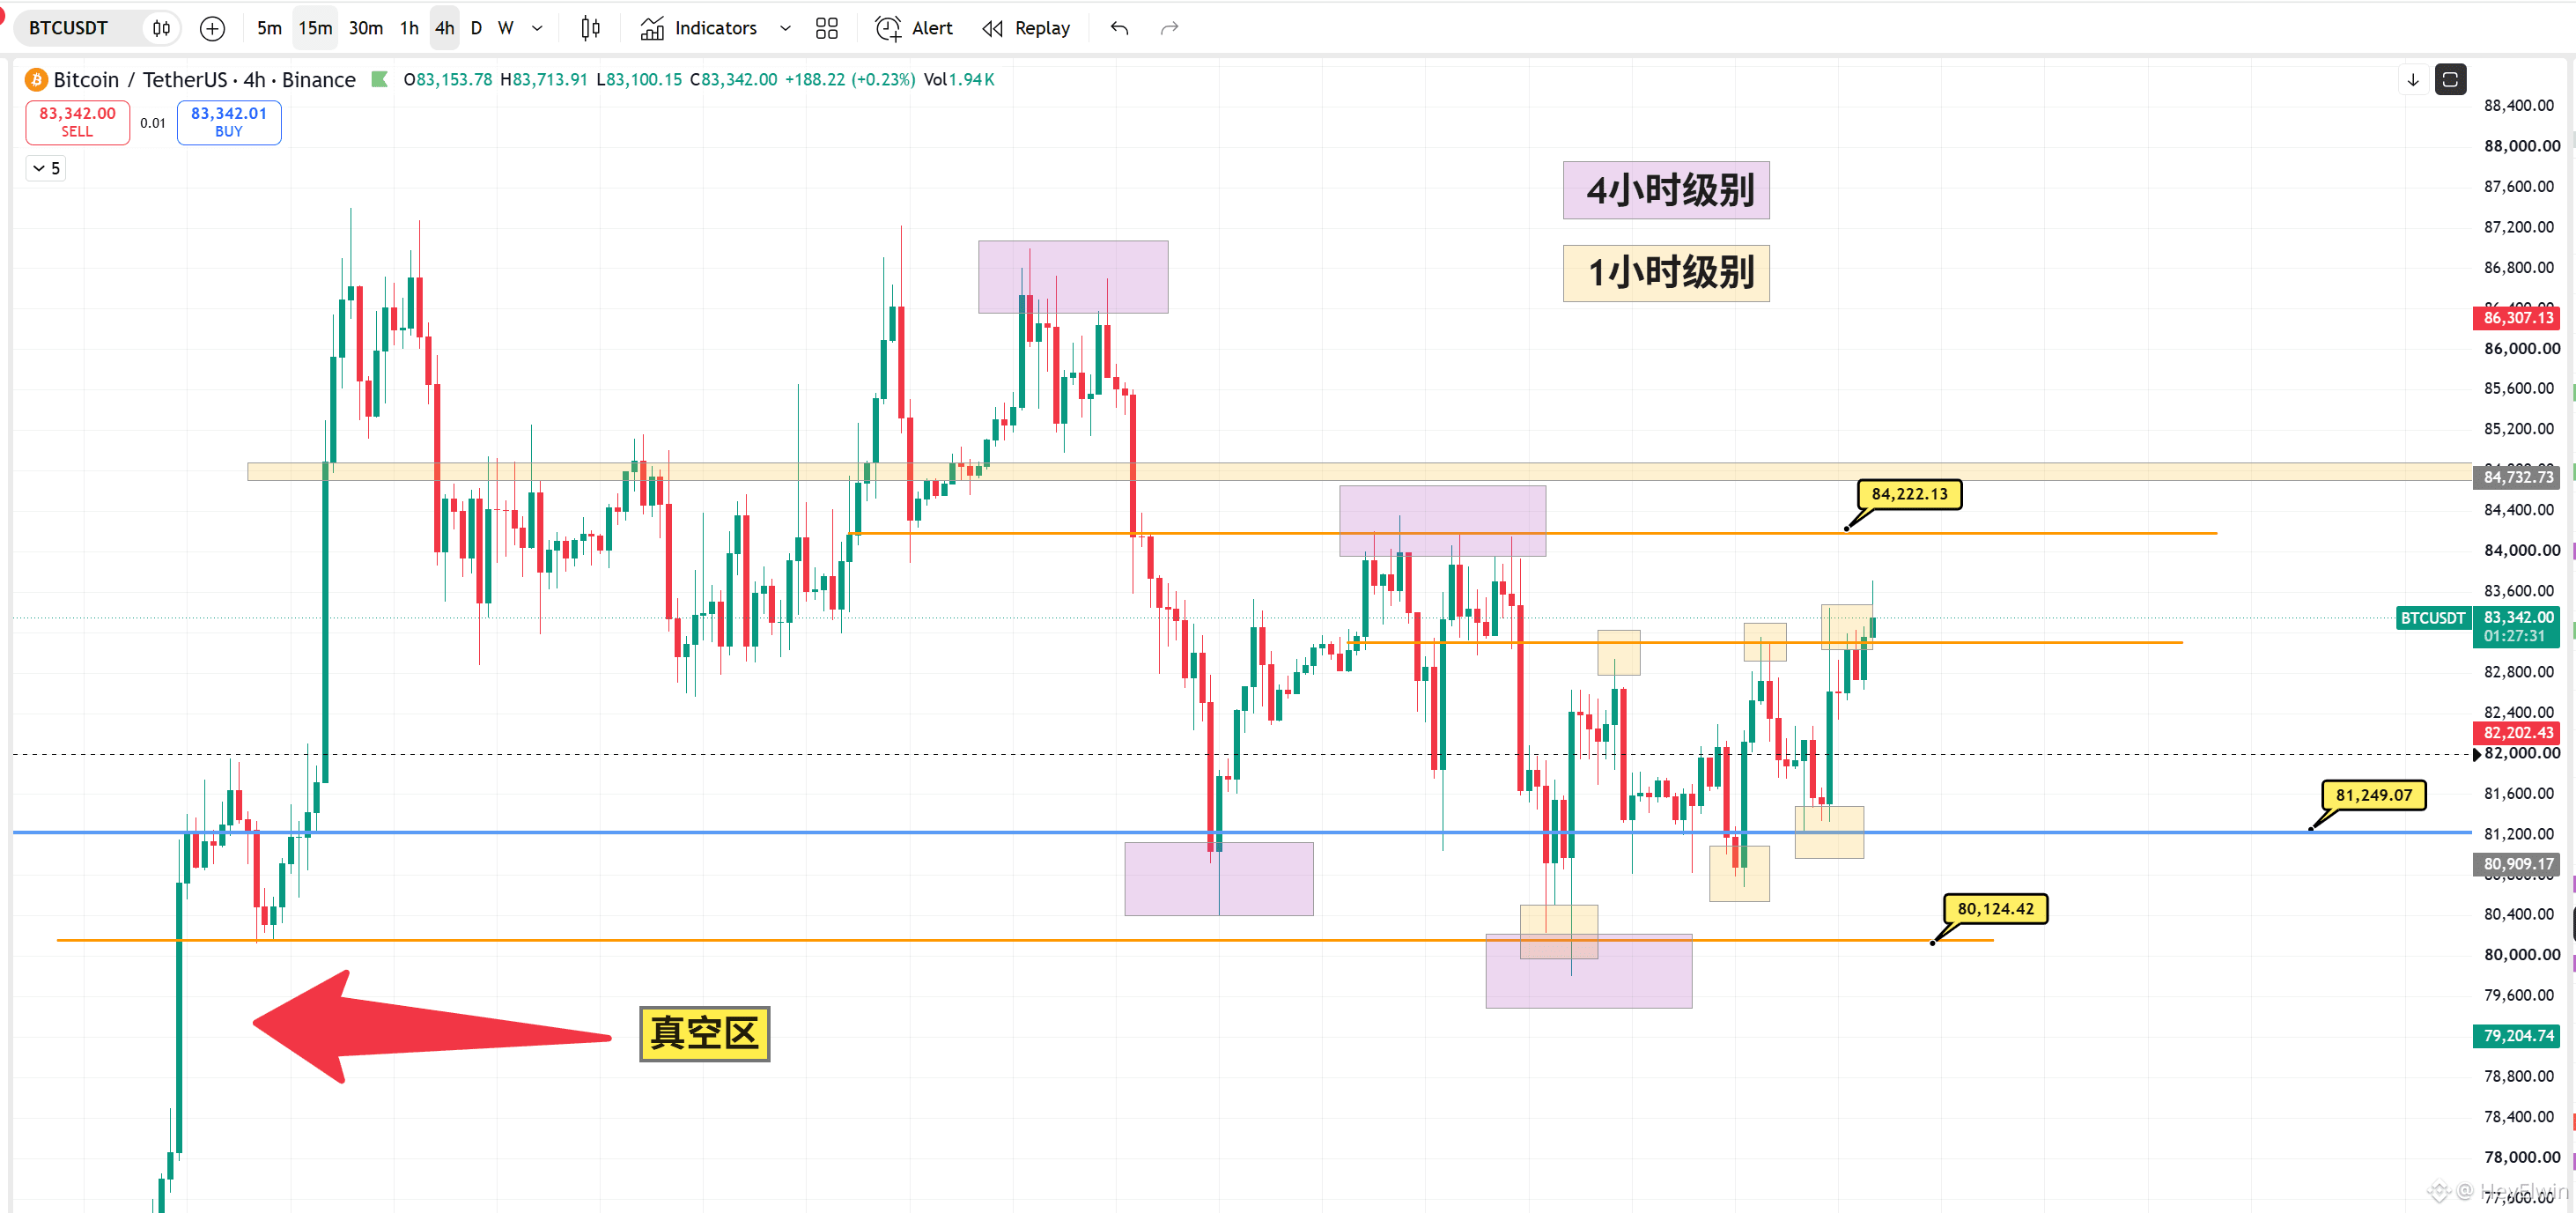
A chart to explain the current BTC market structure! Just read the chart!!!
4-hour timeframe: A bearish structure has yet to form; the higher high is at 8.42.
1-hour timeframe: Bullish structure; the lower low is at 8.12.
Right now, the closer price gets to the 4-hour resistance at 8.42, the more you should take profit on long positions and wait for a short opportunity if price consolidates and breaks down.
As long as 8.42 hasn't been broken, if price drops again, you could consider going long once more near 8.12, with a stop-loss at the previous 1-hour low.
The key support below is around 80k; if price falls below it, that's a vacuum zone. So wherever you go long, this is a firm stop-loss level.
Don't overcomplicate trading! And don't worry about whether BTC is going to 90k or dropping to 75k. As long as 8.42 hasn't been broken or 8 hasn't been breached to the downside, just follow the structure corresponding to your trading timeframe.
$BTC #BTC走势分析