
Wanli一本万莉168
4k Posts

Wanli一本万莉168
 Square Verified+
Report
Block User
最早广场直播建设者,加密圈学习者,活到老学到老,现布局Web3新赛道。北京时间每天15:00直播,欢迎来直播间一起探讨:共建广场、共建社区。喜欢的可加我币安聊天室:wanli168

BNB Holder
Frequent Trader
2.9 Years
653 Following
88.6K+ Followers
90.6K+ Liked
Posts
All
Quotes
Videos
Live
PINNED
·
--
How much money did this netizen's mom actually make?
How much money did this netizen's mom actually make?

152
86
228.1k
PINNED
·
--
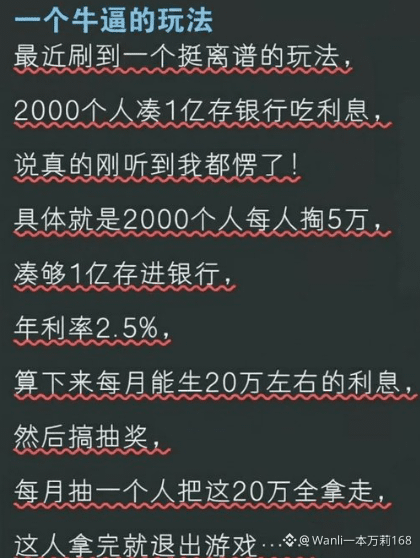
This is seriously awesome!
What genius came up with this way to play?
This is seriously awesome!
What genius came up with this way to play?
What genius came up with this way to play?
101
3
125
269.6k
·
--
ETH at 2,246. Someone is quietly accumulating—and they know exactly what they’re doing.
ETH is now at 2,246, with an intraday low of 2,211. It looks weak on the surface: nearly $300 million in long positions were liquidated over the past 48 hours.
But the spot market tells a completely different story.
Over the past few hours, two addresses bought a combined 18,500 ETH, worth about $42.2 million.
One of them, 0x32c6, spent 19.7 million USDT to buy 8,773.5 ETH at an average price of 2,245. Its holdings have now reached 23,097 ETH, with an estimated cost basis of around 1,909. The last time this wallet bought this aggressively was five months ago.
The other, 0x4AB7, withdrew 9,777 ETH directly from an exchange to its own wallet. Not withdrawing coins is trading; withdrawing them is holding. Those are two completely different things.
There’s an even more aggressive player: a trader who claims to be on a ten-trade winning streak opened a roughly $4.53 billion notional long position on 20,277 ETH using 25x leverage. The position is already up $250,000. Their first 10 trades were all winners, for a cumulative profit of $6.32 million.
Some are calling for a bullish move, but the real risk lies below.
If ETH falls below 2,130, the cumulative long-liquidation exposure across major centralized exchanges is $901 million. That’s a minefield—and once ETH enters it, things could move fast.
My view: ETH is forming a bottom, but it hasn’t bottomed out yet.
What’s the difference? Forming a bottom means testing the level repeatedly; a bottom is a one-time reversal. Clearly, we’re seeing the former.
So scale into your position in layers: 2,200 to 2,250 is the first tranche, and keep a second tranche in reserve above 2,130. If 2,130 breaks, don’t buy the dip—let the market find its own footing.
First, watch 2,420, the previous high. Only a move above it would signal a structural reversal.
ETH at 2,246. Someone is quietly accumulating—and they know exactly what they’re doing.
ETH is now at 2,246, with an intraday low of 2,211. It looks weak on the surface: nearly $300 million in long positions were liquidated over the past 48 hours.
But the spot market tells a completely different story.
Over the past few hours, two addresses bought a combined 18,500 ETH, worth about $42.2 million.
One of them, 0x32c6, spent 19.7 million USDT to buy 8,773.5 ETH at an average price of 2,245. Its holdings have now reached 23,097 ETH, with an estimated cost basis of around 1,909. The last time this wallet bought this aggressively was five months ago.
The other, 0x4AB7, withdrew 9,777 ETH directly from an exchange to its own wallet. Not withdrawing coins is trading; withdrawing them is holding. Those are two completely different things.
There’s an even more aggressive player: a trader who claims to be on a ten-trade winning streak opened a roughly $4.53 billion notional long position on 20,277 ETH using 25x leverage. The position is already up $250,000. Their first 10 trades were all winners, for a cumulative profit of $6.32 million.
Some are calling for a bullish move, but the real risk lies below.
If ETH falls below 2,130, the cumulative long-liquidation exposure across major centralized exchanges is $901 million. That’s a minefield—and once ETH enters it, things could move fast.
My view: ETH is forming a bottom, but it hasn’t bottomed out yet.
What’s the difference? Forming a bottom means testing the level repeatedly; a bottom is a one-time reversal. Clearly, we’re seeing the former.
So scale into your position in layers: 2,200 to 2,250 is the first tranche, and keep a second tranche in reserve above 2,130. If 2,130 breaks, don’t buy the dip—let the market find its own footing.
First, watch 2,420, the previous high. Only a move above it would signal a structural reversal.
ETH is now at 2,246, with an intraday low of 2,211. It looks weak on the surface: nearly $300 million in long positions were liquidated over the past 48 hours.
But the spot market tells a completely different story.
Over the past few hours, two addresses bought a combined 18,500 ETH, worth about $42.2 million.
One of them, 0x32c6, spent 19.7 million USDT to buy 8,773.5 ETH at an average price of 2,245. Its holdings have now reached 23,097 ETH, with an estimated cost basis of around 1,909. The last time this wallet bought this aggressively was five months ago.
The other, 0x4AB7, withdrew 9,777 ETH directly from an exchange to its own wallet. Not withdrawing coins is trading; withdrawing them is holding. Those are two completely different things.
There’s an even more aggressive player: a trader who claims to be on a ten-trade winning streak opened a roughly $4.53 billion notional long position on 20,277 ETH using 25x leverage. The position is already up $250,000. Their first 10 trades were all winners, for a cumulative profit of $6.32 million.
Some are calling for a bullish move, but the real risk lies below.
If ETH falls below 2,130, the cumulative long-liquidation exposure across major centralized exchanges is $901 million. That’s a minefield—and once ETH enters it, things could move fast.
My view: ETH is forming a bottom, but it hasn’t bottomed out yet.
What’s the difference? Forming a bottom means testing the level repeatedly; a bottom is a one-time reversal. Clearly, we’re seeing the former.
So scale into your position in layers: 2,200 to 2,250 is the first tranche, and keep a second tranche in reserve above 2,130. If 2,130 breaks, don’t buy the dip—let the market find its own footing.
First, watch 2,420, the previous high. Only a move above it would signal a structural reversal.
855
·
--
The Sunology trend has made its way into Web2 after all.
The Sunology trend has made its way into Web2 after all.

2
486
·
--
Damn! Everyone else says it’s awesome, but how come I still can’t understand it after staring at it for ages?
Damn! Everyone else says it’s awesome, but how come I still can’t understand it after staring at it for ages?

1
583

·
--
Bitcoin at 77,658: Is the bull market over? Here are some hard truths
On October 6 last year, BTC hit an all-time high of 126,080. Today, it's at 77,658—a 38% pullback.
Yesterday, U.S. spot Bitcoin ETFs saw $643 million in net outflows. More than $430 million in long positions were liquidated over the past week, yet open interest is rising. What does that mean? Leverage hasn't gone away; it's just a new batch of people carrying it.
But here's what I want to say: this downturn didn't start in crypto.
On October 30, the Nasdaq 100 fell 3.2%, and Intel plunged 29.6% in a single day after its earnings bombed. Google, Amazon, and Intel all reported results below expectations. For the first time, the AI trade faced serious scrutiny. That same day, oil rose on Middle East tensions while gold fell. That's a classic "liquidity squeeze" combination, not a "narrative collapse."
So don't use the halving cycle to explain everything. BTC in 2026 is already a macro asset. Its correlation with the Nasdaq is much stronger than with the "four-year cycle."
Three numbers to watch on the charts: 76,000—that's the support level tested repeatedly on October 30. 74,800—if it breaks below this level, the next target is the 70,000 round number. 81,915—BTC needs to get back above this level for the structure to count as repaired.
And don't forget this date: November 6, the U.S. jobs report. This data will directly determine whether rates get cut again in December. The market right now isn't afraid of hackers; it's afraid that "money is getting more expensive."
My position strategy is simple: between 75,000 and 82,000, I won't guess the direction—I'll just trade the range. If it breaks below 74,000, I'll reduce my position, not add to it. If it really gets back above 85,000, then the trend is back, and we can talk about going on the attack.
Is the bull market over? I don't know. But I do know that at these levels, it's not about conviction—it's about position management.
Bitcoin at 77,658: Is the bull market over? Here are some hard truths
On October 6 last year, BTC hit an all-time high of 126,080. Today, it's at 77,658—a 38% pullback.
Yesterday, U.S. spot Bitcoin ETFs saw $643 million in net outflows. More than $430 million in long positions were liquidated over the past week, yet open interest is rising. What does that mean? Leverage hasn't gone away; it's just a new batch of people carrying it.
But here's what I want to say: this downturn didn't start in crypto.
On October 30, the Nasdaq 100 fell 3.2%, and Intel plunged 29.6% in a single day after its earnings bombed. Google, Amazon, and Intel all reported results below expectations. For the first time, the AI trade faced serious scrutiny. That same day, oil rose on Middle East tensions while gold fell. That's a classic "liquidity squeeze" combination, not a "narrative collapse."
So don't use the halving cycle to explain everything. BTC in 2026 is already a macro asset. Its correlation with the Nasdaq is much stronger than with the "four-year cycle."
Three numbers to watch on the charts: 76,000—that's the support level tested repeatedly on October 30. 74,800—if it breaks below this level, the next target is the 70,000 round number. 81,915—BTC needs to get back above this level for the structure to count as repaired.
And don't forget this date: November 6, the U.S. jobs report. This data will directly determine whether rates get cut again in December. The market right now isn't afraid of hackers; it's afraid that "money is getting more expensive."
My position strategy is simple: between 75,000 and 82,000, I won't guess the direction—I'll just trade the range. If it breaks below 74,000, I'll reduce my position, not add to it. If it really gets back above 85,000, then the trend is back, and we can talk about going on the attack.
Is the bull market over? I don't know. But I do know that at these levels, it's not about conviction—it's about position management.
On October 6 last year, BTC hit an all-time high of 126,080. Today, it's at 77,658—a 38% pullback.
Yesterday, U.S. spot Bitcoin ETFs saw $643 million in net outflows. More than $430 million in long positions were liquidated over the past week, yet open interest is rising. What does that mean? Leverage hasn't gone away; it's just a new batch of people carrying it.
But here's what I want to say: this downturn didn't start in crypto.
On October 30, the Nasdaq 100 fell 3.2%, and Intel plunged 29.6% in a single day after its earnings bombed. Google, Amazon, and Intel all reported results below expectations. For the first time, the AI trade faced serious scrutiny. That same day, oil rose on Middle East tensions while gold fell. That's a classic "liquidity squeeze" combination, not a "narrative collapse."
So don't use the halving cycle to explain everything. BTC in 2026 is already a macro asset. Its correlation with the Nasdaq is much stronger than with the "four-year cycle."
Three numbers to watch on the charts: 76,000—that's the support level tested repeatedly on October 30. 74,800—if it breaks below this level, the next target is the 70,000 round number. 81,915—BTC needs to get back above this level for the structure to count as repaired.
And don't forget this date: November 6, the U.S. jobs report. This data will directly determine whether rates get cut again in December. The market right now isn't afraid of hackers; it's afraid that "money is getting more expensive."
My position strategy is simple: between 75,000 and 82,000, I won't guess the direction—I'll just trade the range. If it breaks below 74,000, I'll reduce my position, not add to it. If it really gets back above 85,000, then the trend is back, and we can talk about going on the attack.
Is the bull market over? I don't know. But I do know that at these levels, it's not about conviction—it's about position management.
3
319
·
--
You can get posted on the campus page just for offering a girl your seat, because she thought you were a narcissistic guy trying to hit on her?
So who’s the narcissist here?
Also, isn’t there any moderation on this page? How can they just let people incite online harassment and hostility like this?!
You can get posted on the campus page just for offering a girl your seat, because she thought you were a narcissistic guy trying to hit on her?
So who’s the narcissist here?
Also, isn’t there any moderation on this page? How can they just let people incite online harassment and hostility like this?!
So who’s the narcissist here?
Also, isn’t there any moderation on this page? How can they just let people incite online harassment and hostility like this?!

2
625
·
--
So freaking lifelike!
Who drew this? It's freaking lifelike!
So freaking lifelike!
Who drew this? It's freaking lifelike!
Who drew this? It's freaking lifelike!

4
1
720
·
--
Ethereum just had its worst October in 8 years. Someone is quietly accumulating
$ETH is currently at 2,303, down 2.2% over the past 24 hours, 53% below its peak of 4,946, and down 13% for the month—its worst October in eight years.
There’s not much to sugarcoat in the technicals: the uptrend channel has broken. 2,250 is the first support; if it breaks, the next levels are 1,900 to 2,000. Over the past 24 hours, $44 million worth of ETH longs were liquidated, while Ethereum ETFs saw $16 million in outflows.
That’s where the textbook answer ends: get out.
But there’s a contrarian on-chain signal. Tom Lee’s Bitmine bought another 10,452 ETH, bringing its holdings to 6.05 million ETH, worth about $14 billion at current prices. At the same time, it bought back 2.04 million of its own shares for $45.8 million.
A company that treats ETH as a reserve asset is buying both ETH and its own stock on the way down. Put simply: “I think it’s cheap.”
Of course, don’t treat institutions as infallible. They caught falling knives in 2021 too. Bitmine’s entire model is built on the assumption that “ETH is a digital bond.” If that assumption is wrong, it doesn’t matter how much they buy—it’s still a bad bet.
My take: at 2,303, short positions aren’t crowded. The long/short ratio is 0.985, and the funding rate is 0.0022%—stone cold. It wouldn’t take much selling pressure to push the price lower, but there’s no rush to buy on the way up either. So don’t count on a V-shaped recovery. If 2,250 breaks, look to 1,850–1,900. That’s where the real battle lines are.
Ethereum just had its worst October in 8 years. Someone is quietly accumulating
$ETH is currently at 2,303, down 2.2% over the past 24 hours, 53% below its peak of 4,946, and down 13% for the month—its worst October in eight years.
There’s not much to sugarcoat in the technicals: the uptrend channel has broken. 2,250 is the first support; if it breaks, the next levels are 1,900 to 2,000. Over the past 24 hours, $44 million worth of ETH longs were liquidated, while Ethereum ETFs saw $16 million in outflows.
That’s where the textbook answer ends: get out.
But there’s a contrarian on-chain signal. Tom Lee’s Bitmine bought another 10,452 ETH, bringing its holdings to 6.05 million ETH, worth about $14 billion at current prices. At the same time, it bought back 2.04 million of its own shares for $45.8 million.
A company that treats ETH as a reserve asset is buying both ETH and its own stock on the way down. Put simply: “I think it’s cheap.”
Of course, don’t treat institutions as infallible. They caught falling knives in 2021 too. Bitmine’s entire model is built on the assumption that “ETH is a digital bond.” If that assumption is wrong, it doesn’t matter how much they buy—it’s still a bad bet.
My take: at 2,303, short positions aren’t crowded. The long/short ratio is 0.985, and the funding rate is 0.0022%—stone cold. It wouldn’t take much selling pressure to push the price lower, but there’s no rush to buy on the way up either. So don’t count on a V-shaped recovery. If 2,250 breaks, look to 1,850–1,900. That’s where the real battle lines are.
$ETH is currently at 2,303, down 2.2% over the past 24 hours, 53% below its peak of 4,946, and down 13% for the month—its worst October in eight years.
There’s not much to sugarcoat in the technicals: the uptrend channel has broken. 2,250 is the first support; if it breaks, the next levels are 1,900 to 2,000. Over the past 24 hours, $44 million worth of ETH longs were liquidated, while Ethereum ETFs saw $16 million in outflows.
That’s where the textbook answer ends: get out.
But there’s a contrarian on-chain signal. Tom Lee’s Bitmine bought another 10,452 ETH, bringing its holdings to 6.05 million ETH, worth about $14 billion at current prices. At the same time, it bought back 2.04 million of its own shares for $45.8 million.
A company that treats ETH as a reserve asset is buying both ETH and its own stock on the way down. Put simply: “I think it’s cheap.”
Of course, don’t treat institutions as infallible. They caught falling knives in 2021 too. Bitmine’s entire model is built on the assumption that “ETH is a digital bond.” If that assumption is wrong, it doesn’t matter how much they buy—it’s still a bad bet.
My take: at 2,303, short positions aren’t crowded. The long/short ratio is 0.985, and the funding rate is 0.0022%—stone cold. It wouldn’t take much selling pressure to push the price lower, but there’s no rush to buy on the way up either. So don’t count on a V-shaped recovery. If 2,250 breaks, look to 1,850–1,900. That’s where the real battle lines are.
2
979
·
--
When I opened the charts this morning, BTC was at 80,862, with a 24-hour low of 79,416 and a range of less than 2.2%.
Three months ago, nobody would have believed this. At the end of July, it was still at 62,470, then climbed all the way to 87,158. Now it’s back around 80K, moving sideways.
So let’s call it what it is: high-level consolidation, not a breakdown in the trend.
The real weight overhead is another number: 126,080.
That was last October’s all-time high. BTC is still 36% below it. Anyone looking to buy the dip can see that number looming overhead. That’s the real psychological burden.
Sentiment, though, has already thrown in the towel.
The Fear and Greed Index is at 50 today—neutral. On October 22, it was still at 67—greed.
In six trading days, sentiment has gone from greed back to neutral, while the price has only fallen 4%. Sentiment has been washed out more thoroughly than the chart. That kind of divergence is usually a good sign.
The money flows are even more interesting.
Spot ETFs saw $636 million in outflows on October 22, followed by another $138 million on the 23rd. It looked like a rout.
Then $110 million flowed back in on the 26th, followed by another $24.5 million on the 27th.
The money hasn’t left. It’s just outside the door, smoking and waiting for news.
Leverage looks similar.
The 8-hour funding rate for BTC perpetuals is 0.0087% to 0.01%, or 8.7% to 11% annualized. Longs are still paying, which means nobody is truly panicking—but nobody’s gone crazy either. Above 0.05% is when things get crazy.
In the previous sharp drop, $196 million in positions were liquidated across the market in 24 hours, mostly longs. The washout has done its job.
The levels are clear. 79,400 below is today’s low and a key structural level. If it breaks, the next level to watch is 78,000.
78,000 isn’t a number pulled out of thin air. It’s a high-volume area since August, and also a support level identified by institutions.
Above, 83,500 is the gap. It needs to be filled for the market to count as repaired.
Three things are weighing on the market this week: the FOMC, big tech earnings, and the November midterm elections.
The options market is already placing bets. Someone spent $68 million in a single trade on calls with a 90K strike. That doesn’t mean BTC will reach 90K; it just means someone’s willing to pay for upside-tail exposure.
No predictions on direction. Keep 30% as a core position, and wait to see how the market reacts at 78,000 with the rest. If it breaks and can’t reclaim that level, that’s a different playbook.
When I opened the charts this morning, BTC was at 80,862, with a 24-hour low of 79,416 and a range of less than 2.2%.
Three months ago, nobody would have believed this. At the end of July, it was still at 62,470, then climbed all the way to 87,158. Now it’s back around 80K, moving sideways.
So let’s call it what it is: high-level consolidation, not a breakdown in the trend.
The real weight overhead is another number: 126,080.
That was last October’s all-time high. BTC is still 36% below it. Anyone looking to buy the dip can see that number looming overhead. That’s the real psychological burden.
Sentiment, though, has already thrown in the towel.
The Fear and Greed Index is at 50 today—neutral. On October 22, it was still at 67—greed.
In six trading days, sentiment has gone from greed back to neutral, while the price has only fallen 4%. Sentiment has been washed out more thoroughly than the chart. That kind of divergence is usually a good sign.
The money flows are even more interesting.
Spot ETFs saw $636 million in outflows on October 22, followed by another $138 million on the 23rd. It looked like a rout.
Then $110 million flowed back in on the 26th, followed by another $24.5 million on the 27th.
The money hasn’t left. It’s just outside the door, smoking and waiting for news.
Leverage looks similar.
The 8-hour funding rate for BTC perpetuals is 0.0087% to 0.01%, or 8.7% to 11% annualized. Longs are still paying, which means nobody is truly panicking—but nobody’s gone crazy either. Above 0.05% is when things get crazy.
In the previous sharp drop, $196 million in positions were liquidated across the market in 24 hours, mostly longs. The washout has done its job.
The levels are clear. 79,400 below is today’s low and a key structural level. If it breaks, the next level to watch is 78,000.
78,000 isn’t a number pulled out of thin air. It’s a high-volume area since August, and also a support level identified by institutions.
Above, 83,500 is the gap. It needs to be filled for the market to count as repaired.
Three things are weighing on the market this week: the FOMC, big tech earnings, and the November midterm elections.
The options market is already placing bets. Someone spent $68 million in a single trade on calls with a 90K strike. That doesn’t mean BTC will reach 90K; it just means someone’s willing to pay for upside-tail exposure.
No predictions on direction. Keep 30% as a core position, and wait to see how the market reacts at 78,000 with the rest. If it breaks and can’t reclaim that level, that’s a different playbook.
Three months ago, nobody would have believed this. At the end of July, it was still at 62,470, then climbed all the way to 87,158. Now it’s back around 80K, moving sideways.
So let’s call it what it is: high-level consolidation, not a breakdown in the trend.
The real weight overhead is another number: 126,080.
That was last October’s all-time high. BTC is still 36% below it. Anyone looking to buy the dip can see that number looming overhead. That’s the real psychological burden.
Sentiment, though, has already thrown in the towel.
The Fear and Greed Index is at 50 today—neutral. On October 22, it was still at 67—greed.
In six trading days, sentiment has gone from greed back to neutral, while the price has only fallen 4%. Sentiment has been washed out more thoroughly than the chart. That kind of divergence is usually a good sign.
The money flows are even more interesting.
Spot ETFs saw $636 million in outflows on October 22, followed by another $138 million on the 23rd. It looked like a rout.
Then $110 million flowed back in on the 26th, followed by another $24.5 million on the 27th.
The money hasn’t left. It’s just outside the door, smoking and waiting for news.
Leverage looks similar.
The 8-hour funding rate for BTC perpetuals is 0.0087% to 0.01%, or 8.7% to 11% annualized. Longs are still paying, which means nobody is truly panicking—but nobody’s gone crazy either. Above 0.05% is when things get crazy.
In the previous sharp drop, $196 million in positions were liquidated across the market in 24 hours, mostly longs. The washout has done its job.
The levels are clear. 79,400 below is today’s low and a key structural level. If it breaks, the next level to watch is 78,000.
78,000 isn’t a number pulled out of thin air. It’s a high-volume area since August, and also a support level identified by institutions.
Above, 83,500 is the gap. It needs to be filled for the market to count as repaired.
Three things are weighing on the market this week: the FOMC, big tech earnings, and the November midterm elections.
The options market is already placing bets. Someone spent $68 million in a single trade on calls with a 90K strike. That doesn’t mean BTC will reach 90K; it just means someone’s willing to pay for upside-tail exposure.
No predictions on direction. Keep 30% as a core position, and wait to see how the market reacts at 78,000 with the rest. If it breaks and can’t reclaim that level, that’s a different playbook.
2
528

·
--
I can't figure out what Lin Chi-ling sees in him.
I can't figure out what Lin Chi-ling sees in him.

9
4
5.8k
·
--
I’ll hold off on commenting on the taste for now.
The owner is pretty honest, though.
I’ll hold off on commenting on the taste for now.
The owner is pretty honest, though.
The owner is pretty honest, though.

6
9
3.3k
·
--
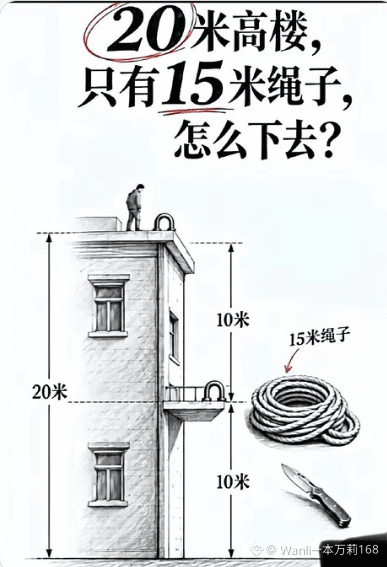
Few are willing to sit down and think calmly.
Actually, this question is very simple.
Have you figured it out?
Few are willing to sit down and think calmly.
Actually, this question is very simple.
Have you figured it out?
Actually, this question is very simple.
Have you figured it out?
19
9
22.4k
·
--
Different choices lead to different outcomes.
Different choices lead to different outcomes.

8
1
12
18.2k
·
--
Holy crap! The sky is falling!!!
Even people in Japan over 65 are still working like crazy
Look at what our elderly are doing!
They’re either square dancing here or checking out pretty women over there
Holy crap! The sky is falling!!!
Even people in Japan over 65 are still working like crazy
Look at what our elderly are doing!
They’re either square dancing here or checking out pretty women over there
Even people in Japan over 65 are still working like crazy
Look at what our elderly are doing!
They’re either square dancing here or checking out pretty women over there

1
7
1.8k
·
--
Bullish
Bitcoin climbs back above $83,000, and the market is getting greedy—but don’t rush to chase the rally this time
Today, Bitcoin returned to around $83,000, and Ethereum rebounded as well. The broader market is finally showing a welcome hint of strength.
The sentiment index is now back at 64, putting it in the greed zone.
A lot of people might see this and wonder: Is the bull market back?
But I want to offer a reminder:
A price rebound and a trend reversal are not the same thing.
The biggest change in this rally is that market sentiment has shifted from cautious to positive again. Investors are willing to return and go long, and altcoins are starting to take turns leading the way.
The problem, though, is that the market hasn’t yet reached broad-based confirmation.
When Bitcoin rises, most of the money is still concentrated in major assets.
Some altcoins have posted big gains, but trading activity hasn’t been consistent.
That tells us investors are more willing to take risks, but we’re not at the stage where it makes sense to chase every price spike.
From a technical perspective, $83,000 is an important level to watch.
If Bitcoin can hold above this zone for several consecutive sessions and trading volume continues to grow, there may be room for further gains.
But if it surges and then quickly falls back, that would suggest this rebound is driven more by short covering than by fresh money entering the market to fuel a new trend.
The biggest danger right now isn’t missing out on opportunities.
It’s having just come through a pullback, then fearing you’ll miss out as soon as the market rebounds.
One of the worst things you can do in trading is go all-in just as sentiment begins to improve.
A more sensible approach is:
Watch the trend for major coins.
Watch trading activity for altcoins.
Watch whether momentum lasts for trending coins.
If Bitcoin can hold steady while Ethereum and Solana continue to see rising volume, that would signal the market is moving from a rebound toward recovery.
It’s reasonable to be optimistic for now,
but don’t get carried away.
Greed can push the market higher,
but excessive greed can also lead many people to buy at short-term highs.
Bitcoin climbs back above $83,000, and the market is getting greedy—but don’t rush to chase the rally this time
Today, Bitcoin returned to around $83,000, and Ethereum rebounded as well. The broader market is finally showing a welcome hint of strength.
The sentiment index is now back at 64, putting it in the greed zone.
A lot of people might see this and wonder: Is the bull market back?
But I want to offer a reminder:
A price rebound and a trend reversal are not the same thing.
The biggest change in this rally is that market sentiment has shifted from cautious to positive again. Investors are willing to return and go long, and altcoins are starting to take turns leading the way.
The problem, though, is that the market hasn’t yet reached broad-based confirmation.
When Bitcoin rises, most of the money is still concentrated in major assets.
Some altcoins have posted big gains, but trading activity hasn’t been consistent.
That tells us investors are more willing to take risks, but we’re not at the stage where it makes sense to chase every price spike.
From a technical perspective, $83,000 is an important level to watch.
If Bitcoin can hold above this zone for several consecutive sessions and trading volume continues to grow, there may be room for further gains.
But if it surges and then quickly falls back, that would suggest this rebound is driven more by short covering than by fresh money entering the market to fuel a new trend.
The biggest danger right now isn’t missing out on opportunities.
It’s having just come through a pullback, then fearing you’ll miss out as soon as the market rebounds.
One of the worst things you can do in trading is go all-in just as sentiment begins to improve.
A more sensible approach is:
Watch the trend for major coins.
Watch trading activity for altcoins.
Watch whether momentum lasts for trending coins.
If Bitcoin can hold steady while Ethereum and Solana continue to see rising volume, that would signal the market is moving from a rebound toward recovery.
It’s reasonable to be optimistic for now,
but don’t get carried away.
Greed can push the market higher,
but excessive greed can also lead many people to buy at short-term highs.
Today, Bitcoin returned to around $83,000, and Ethereum rebounded as well. The broader market is finally showing a welcome hint of strength.
The sentiment index is now back at 64, putting it in the greed zone.
A lot of people might see this and wonder: Is the bull market back?
But I want to offer a reminder:
A price rebound and a trend reversal are not the same thing.
The biggest change in this rally is that market sentiment has shifted from cautious to positive again. Investors are willing to return and go long, and altcoins are starting to take turns leading the way.
The problem, though, is that the market hasn’t yet reached broad-based confirmation.
When Bitcoin rises, most of the money is still concentrated in major assets.
Some altcoins have posted big gains, but trading activity hasn’t been consistent.
That tells us investors are more willing to take risks, but we’re not at the stage where it makes sense to chase every price spike.
From a technical perspective, $83,000 is an important level to watch.
If Bitcoin can hold above this zone for several consecutive sessions and trading volume continues to grow, there may be room for further gains.
But if it surges and then quickly falls back, that would suggest this rebound is driven more by short covering than by fresh money entering the market to fuel a new trend.
The biggest danger right now isn’t missing out on opportunities.
It’s having just come through a pullback, then fearing you’ll miss out as soon as the market rebounds.
One of the worst things you can do in trading is go all-in just as sentiment begins to improve.
A more sensible approach is:
Watch the trend for major coins.
Watch trading activity for altcoins.
Watch whether momentum lasts for trending coins.
If Bitcoin can hold steady while Ethereum and Solana continue to see rising volume, that would signal the market is moving from a rebound toward recovery.
It’s reasonable to be optimistic for now,
but don’t get carried away.
Greed can push the market higher,
but excessive greed can also lead many people to buy at short-term highs.
9
968
·
--
Bullish
When Agents Start Making Money on Their Own, the Real Machine Economy Is Just Getting Started
When we’ve talked about artificial intelligence in the past, the focus has usually been on how powerful models are, how quickly they respond, and whether they can replace certain jobs.
But a more practical question may soon confront us:
If Agents don’t just help us complete tasks, but can also take on jobs, call services, and make payments on their own, could they become a new kind of economic actor?
This isn’t science fiction.
A travel Agent could automatically compare flights, book hotels, and buy insurance. A trading Agent could call data APIs, analyze market trends, and execute strategies. An enterprise Agent could even automatically procure computing power, data, and software services based on business needs.
The problem is that traditional internet payment systems weren’t designed for frequent, low-value, automated transactions between machines. Bank card payments require human confirmation, account permissions are difficult to control precisely, and cross-platform settlement isn’t flexible enough. When transactions shift from “person to person” to “Agent to Agent,” payment is no longer just about paying—it becomes part of the entire task workflow.
Kite’s value lies in its effort to bring identity, permissions, payments, and task delivery together in a single infrastructure. Agents can have their own identities and budgets, and make automatic payments according to service agreements. Once a task is completed, funds are released; if the service doesn’t meet the agreed standard, the settlement can be adjusted.
This means an Agent may no longer be just a tool behind a chat window, but could become a “digital worker” capable of participating independently in the market.
Of course, the Agent economy won’t mature overnight just because a protocol exists. The real challenges are: Who verifies that a task has been completed? Who limits the risks Agents pose? Who handles erroneous transactions? Who distributes the revenue?
That’s why @GoKiteAI is worth paying attention to. It isn’t just about discussing artificial intelligence; it’s an attempt to answer a more fundamental question:
When machines start working, how should they establish trust and settle payments with one another?
The internet of the future may no longer be just a place where people use platforms to access services. Instead, countless Agents may automatically find resources, complete tasks, and create value.
And KITE is helping build the payment and collaboration infrastructure for this new economy.
#KiteBBW $KITE
When Agents Start Making Money on Their Own, the Real Machine Economy Is Just Getting Started
When we’ve talked about artificial intelligence in the past, the focus has usually been on how powerful models are, how quickly they respond, and whether they can replace certain jobs.
But a more practical question may soon confront us:
If Agents don’t just help us complete tasks, but can also take on jobs, call services, and make payments on their own, could they become a new kind of economic actor?
This isn’t science fiction.
A travel Agent could automatically compare flights, book hotels, and buy insurance. A trading Agent could call data APIs, analyze market trends, and execute strategies. An enterprise Agent could even automatically procure computing power, data, and software services based on business needs.
The problem is that traditional internet payment systems weren’t designed for frequent, low-value, automated transactions between machines. Bank card payments require human confirmation, account permissions are difficult to control precisely, and cross-platform settlement isn’t flexible enough. When transactions shift from “person to person” to “Agent to Agent,” payment is no longer just about paying—it becomes part of the entire task workflow.
Kite’s value lies in its effort to bring identity, permissions, payments, and task delivery together in a single infrastructure. Agents can have their own identities and budgets, and make automatic payments according to service agreements. Once a task is completed, funds are released; if the service doesn’t meet the agreed standard, the settlement can be adjusted.
This means an Agent may no longer be just a tool behind a chat window, but could become a “digital worker” capable of participating independently in the market.
Of course, the Agent economy won’t mature overnight just because a protocol exists. The real challenges are: Who verifies that a task has been completed? Who limits the risks Agents pose? Who handles erroneous transactions? Who distributes the revenue?
That’s why @KITE AI 中文 is worth paying attention to. It isn’t just about discussing artificial intelligence; it’s an attempt to answer a more fundamental question:
When machines start working, how should they establish trust and settle payments with one another?
The internet of the future may no longer be just a place where people use platforms to access services. Instead, countless Agents may automatically find resources, complete tasks, and create value.
And KITE is helping build the payment and collaboration infrastructure for this new economy.
#KiteBBW $KITE
When we’ve talked about artificial intelligence in the past, the focus has usually been on how powerful models are, how quickly they respond, and whether they can replace certain jobs.
But a more practical question may soon confront us:
If Agents don’t just help us complete tasks, but can also take on jobs, call services, and make payments on their own, could they become a new kind of economic actor?
This isn’t science fiction.
A travel Agent could automatically compare flights, book hotels, and buy insurance. A trading Agent could call data APIs, analyze market trends, and execute strategies. An enterprise Agent could even automatically procure computing power, data, and software services based on business needs.
The problem is that traditional internet payment systems weren’t designed for frequent, low-value, automated transactions between machines. Bank card payments require human confirmation, account permissions are difficult to control precisely, and cross-platform settlement isn’t flexible enough. When transactions shift from “person to person” to “Agent to Agent,” payment is no longer just about paying—it becomes part of the entire task workflow.
Kite’s value lies in its effort to bring identity, permissions, payments, and task delivery together in a single infrastructure. Agents can have their own identities and budgets, and make automatic payments according to service agreements. Once a task is completed, funds are released; if the service doesn’t meet the agreed standard, the settlement can be adjusted.
This means an Agent may no longer be just a tool behind a chat window, but could become a “digital worker” capable of participating independently in the market.
Of course, the Agent economy won’t mature overnight just because a protocol exists. The real challenges are: Who verifies that a task has been completed? Who limits the risks Agents pose? Who handles erroneous transactions? Who distributes the revenue?
That’s why @KITE AI 中文 is worth paying attention to. It isn’t just about discussing artificial intelligence; it’s an attempt to answer a more fundamental question:
When machines start working, how should they establish trust and settle payments with one another?
The internet of the future may no longer be just a place where people use platforms to access services. Instead, countless Agents may automatically find resources, complete tasks, and create value.
And KITE is helping build the payment and collaboration infrastructure for this new economy.
#KiteBBW $KITE

9
693
·
--
Ethereum has fallen to around $2,400. The real issue isn’t the price, but how investors feel.
Today, Ethereum is trading around $2,405, down about 0.7% over the past 24 hours.
That decline isn’t significant on its own. But compared with Bitcoin’s near-flat performance, Ethereum’s weakness stands out.
Put simply, Bitcoin is holding steady, but investors aren’t showing much interest in chasing Ethereum higher.
Futures data shows that Ethereum’s open interest is around $30.2 billion, the long-short ratio is near 0.90, and the funding rate is about 0.003%.
A long-short ratio below 1 means there are slightly more short positions than long positions. Positioning isn’t particularly crowded, which could point to two things:
First, the market genuinely lacks confidence in Ethereum’s short-term performance.
Second, if Ethereum suddenly rebounds, short covering could help push it higher.
So it’s too soon to simply say ETH is weak, or to claim that a reversal is imminent.
The key is whether investment flows return to the Ethereum ecosystem.
Recently, the market has favored high-volatility themes. Ethereum still has a strong foundation, but its price needs a new catalyst. The old narratives alone are no longer enough to keep investors excited.
If ETH can reclaim $2,450 and trading volume rises at the same time, market sentiment could improve significantly.
But if it repeatedly fails to hold $2,400, while money continues flowing into Bitcoin and a handful of popular sectors, Ethereum could remain under pressure in the short term.
ETH still has opportunities, but patience is needed.
Mature trading isn’t about jumping in because others are calling for a reversal. It’s about waiting for price action and trading volume to prove that the market is truly getting stronger.
Ethereum has fallen to around $2,400. The real issue isn’t the price, but how investors feel.
Today, Ethereum is trading around $2,405, down about 0.7% over the past 24 hours.
That decline isn’t significant on its own. But compared with Bitcoin’s near-flat performance, Ethereum’s weakness stands out.
Put simply, Bitcoin is holding steady, but investors aren’t showing much interest in chasing Ethereum higher.
Futures data shows that Ethereum’s open interest is around $30.2 billion, the long-short ratio is near 0.90, and the funding rate is about 0.003%.
A long-short ratio below 1 means there are slightly more short positions than long positions. Positioning isn’t particularly crowded, which could point to two things:
First, the market genuinely lacks confidence in Ethereum’s short-term performance.
Second, if Ethereum suddenly rebounds, short covering could help push it higher.
So it’s too soon to simply say ETH is weak, or to claim that a reversal is imminent.
The key is whether investment flows return to the Ethereum ecosystem.
Recently, the market has favored high-volatility themes. Ethereum still has a strong foundation, but its price needs a new catalyst. The old narratives alone are no longer enough to keep investors excited.
If ETH can reclaim $2,450 and trading volume rises at the same time, market sentiment could improve significantly.
But if it repeatedly fails to hold $2,400, while money continues flowing into Bitcoin and a handful of popular sectors, Ethereum could remain under pressure in the short term.
ETH still has opportunities, but patience is needed.
Mature trading isn’t about jumping in because others are calling for a reversal. It’s about waiting for price action and trading volume to prove that the market is truly getting stronger.
Today, Ethereum is trading around $2,405, down about 0.7% over the past 24 hours.
That decline isn’t significant on its own. But compared with Bitcoin’s near-flat performance, Ethereum’s weakness stands out.
Put simply, Bitcoin is holding steady, but investors aren’t showing much interest in chasing Ethereum higher.
Futures data shows that Ethereum’s open interest is around $30.2 billion, the long-short ratio is near 0.90, and the funding rate is about 0.003%.
A long-short ratio below 1 means there are slightly more short positions than long positions. Positioning isn’t particularly crowded, which could point to two things:
First, the market genuinely lacks confidence in Ethereum’s short-term performance.
Second, if Ethereum suddenly rebounds, short covering could help push it higher.
So it’s too soon to simply say ETH is weak, or to claim that a reversal is imminent.
The key is whether investment flows return to the Ethereum ecosystem.
Recently, the market has favored high-volatility themes. Ethereum still has a strong foundation, but its price needs a new catalyst. The old narratives alone are no longer enough to keep investors excited.
If ETH can reclaim $2,450 and trading volume rises at the same time, market sentiment could improve significantly.
But if it repeatedly fails to hold $2,400, while money continues flowing into Bitcoin and a handful of popular sectors, Ethereum could remain under pressure in the short term.
ETH still has opportunities, but patience is needed.
Mature trading isn’t about jumping in because others are calling for a reversal. It’s about waiting for price action and trading volume to prove that the market is truly getting stronger.
4
847
Log in to explore more content
Join global crypto users on Binance Square
⚡️ Get latest and useful information about crypto.
💬 Trusted by the world’s largest crypto exchange.
👍 Discover real insights from verified creators.
Email / Phone number