

BTC Freeman
18 Posts

BTC Freeman
Report
Block User
Bitcoin Technical Analysis Only . Pure Bitcoin chart analysis & market structure. Levels, Trends & Price Action . Not financial advice
0 Following
28 Followers
44 Liked
Posts
All
Quotes
·
--
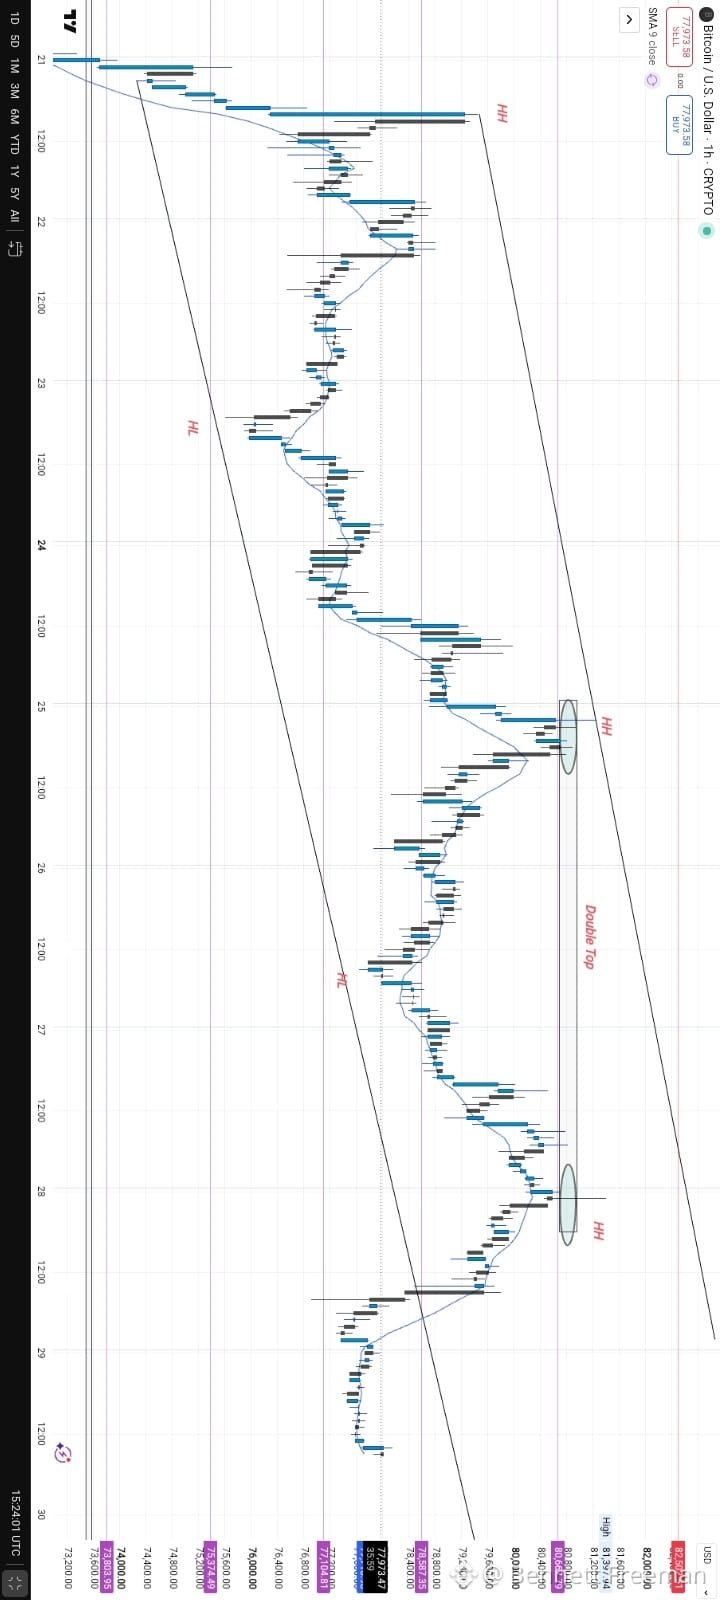
BTCUSDT. Patience Before the Next Move
Bitcoin is still respecting the broader upward structure, but price is currently sitting around a key resistance area.
We’ve seen higher highs and higher lows, but the recent rejection reminds us that the market doesn’t move in a straight line.
Break the resistance , bullish continuation.
Lose key support , deeper correction.
For now, I’m watching the structure and waiting for confirmation rather than chasing the move.
Trade the chart, not your emotions. 🧠📈
#Bitcoin #BTC #Crypto #BTCUSDT. #trading
BTCUSDT. Patience Before the Next Move
Bitcoin is still respecting the broader upward structure, but price is currently sitting around a key resistance area.
We’ve seen higher highs and higher lows, but the recent rejection reminds us that the market doesn’t move in a straight line.
Break the resistance , bullish continuation.
Lose key support , deeper correction.
For now, I’m watching the structure and waiting for confirmation rather than chasing the move.
Trade the chart, not your emotions. 🧠📈
#Bitcoin #BTC #Crypto #BTCUSDT. #trading
Bitcoin is still respecting the broader upward structure, but price is currently sitting around a key resistance area.
We’ve seen higher highs and higher lows, but the recent rejection reminds us that the market doesn’t move in a straight line.
Break the resistance , bullish continuation.
Lose key support , deeper correction.
For now, I’m watching the structure and waiting for confirmation rather than chasing the move.
Trade the chart, not your emotions. 🧠📈
#Bitcoin #BTC #Crypto #BTCUSDT. #trading
1
142
·
--
Don’t you think BTC is really going to the moon? Could the bull rally toward $150K have already started? 👀
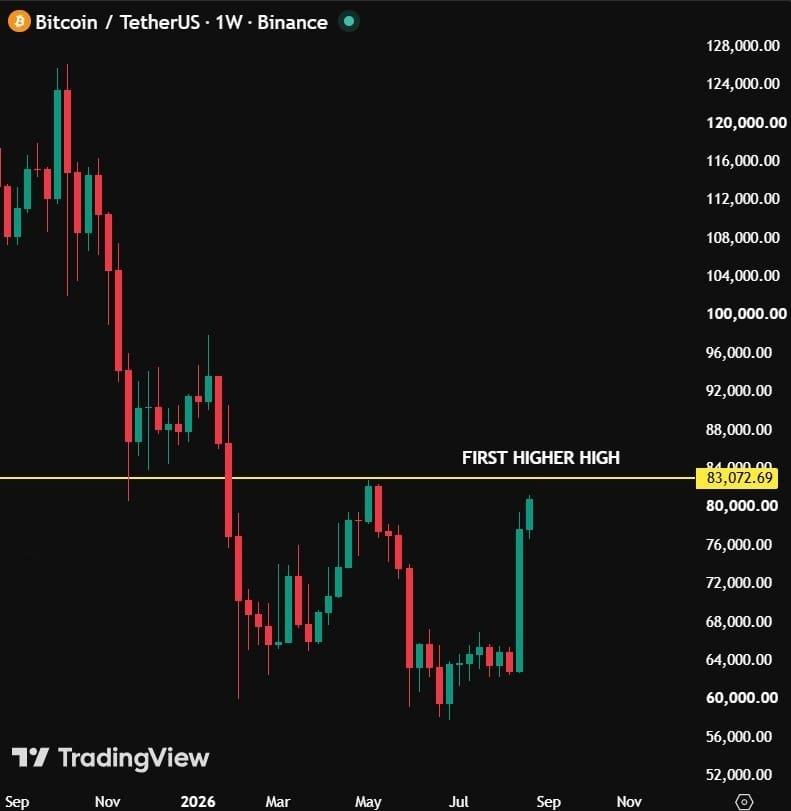
We can’t confirm the move yet, but a key level to watch is the recent high at $82,852.96. If BTC breaks and holds above this level, it could signal a change in market structure from a bear market to a bull market.
What are your thoughts?
Do you think BTC is on its way to $150K, or is it too early to call?
Share your analysis with me! 👇
#Bitcoin❗
Don’t you think BTC is really going to the moon? Could the bull rally toward $150K have already started? 👀
We can’t confirm the move yet, but a key level to watch is the recent high at $82,852.96. If BTC breaks and holds above this level, it could signal a change in market structure from a bear market to a bull market.
What are your thoughts?
Do you think BTC is on its way to $150K, or is it too early to call?
Share your analysis with me! 👇
#Bitcoin❗
We can’t confirm the move yet, but a key level to watch is the recent high at $82,852.96. If BTC breaks and holds above this level, it could signal a change in market structure from a bear market to a bull market.
What are your thoughts?
Do you think BTC is on its way to $150K, or is it too early to call?
Share your analysis with me! 👇
#Bitcoin❗
1
103
·
--
🤝
🤝

Ade_Krypt
·
--
$BTC is now just $2,200 away from confirming its first major higher high, and a breakout could significantly reshape the current market structure.
If Bitcoin clears this key resistance and confirms the structural shift, the odds of seeing it trade below $60,000 again could fall sharply. That level may evolve from temporary support into a major macro floor for the cycle.
Bears are losing momentum, and one strong wave of volume could ignite the next major leg higher. Those waiting for deeper dips may soon find themselves chasing the market.
We could be approaching a major momentum shift. Stay prepared.
#OilHoldsLosses #KazakhstanCutsOilOutputForecastTo96MTons
If Bitcoin clears this key resistance and confirms the structural shift, the odds of seeing it trade below $60,000 again could fall sharply. That level may evolve from temporary support into a major macro floor for the cycle.
Bears are losing momentum, and one strong wave of volume could ignite the next major leg higher. Those waiting for deeper dips may soon find themselves chasing the market.
We could be approaching a major momentum shift. Stay prepared.
#OilHoldsLosses #KazakhstanCutsOilOutputForecastTo96MTons
1
11
·
--
BTCUSDT: Is Bitcoin Building an Inverse Head & Shoulders? 👀
Let’s make this very simple.
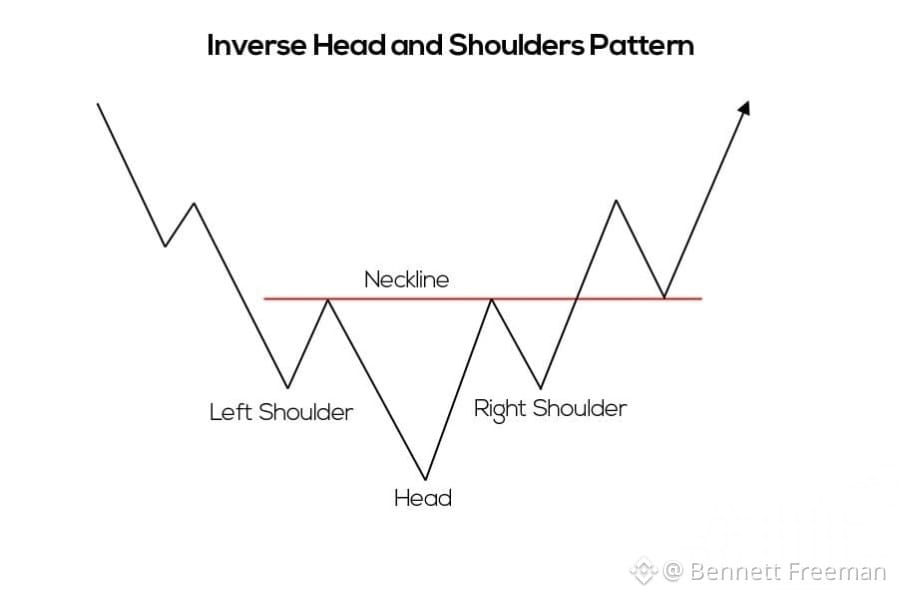
The first image shows what an Inverse Head & Shoulders pattern looks like.
Imagine a person standing upside down:
🟢 Left Shoulder
🔻 Head
🟢 Right Shoulder
The head is the deepest drop, while the two shoulders are higher and relatively similar.
The red line is called the neckline. Think of it as a ceiling that price needs to break.
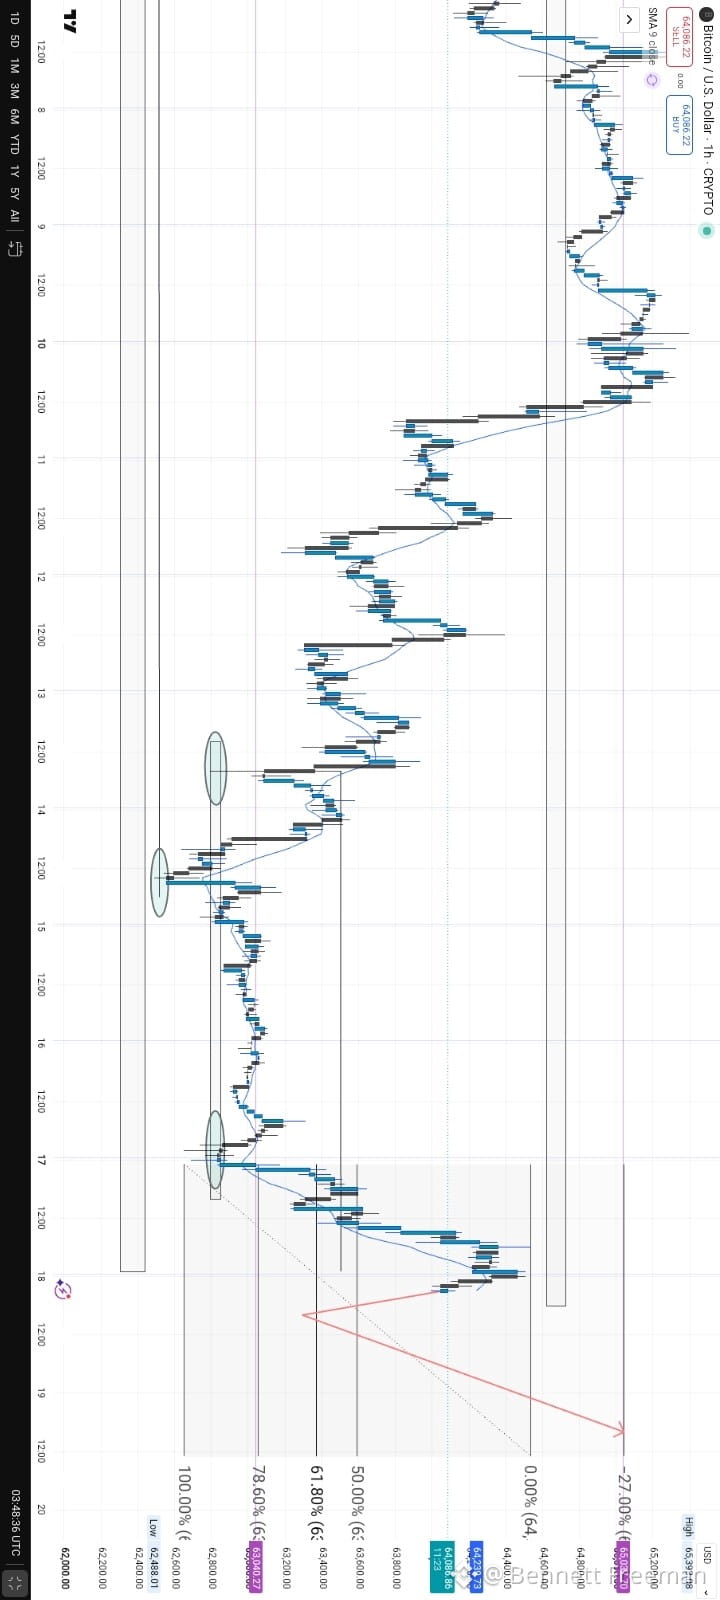
Now look at the second image — my BTC 1H chart.
I’ve marked three areas around the $62K–$62.5K region that resemble:
➡️ Left Shoulder
➡️ Head
➡️ Right Shoulder
After forming this structure, BTC pushed strongly upward.
I’m also watching the Fibonacci levels around 50%, 61.8% and 78.6% as possible areas where price could react.
My bullish scenario is:
Pullback → Support → Continuation → Possible move toward the previous high area around $65K+
But remember:
⚠️ A pattern is NOT a guarantee.
The important confirmation would be whether BTC can successfully break and hold above the relevant resistance/neckline area.
If that confirmation fails, the bullish idea becomes weaker.
So for me, the big question is:
Is BTC completing an inverse head & shoulders, or is this simply another temporary bounce? 🤔
What do you see on the chart? 👇
#BTC #bitcoin #BTCUSDT #Crypto #TechnicalAnalysis
BTCUSDT: Is Bitcoin Building an Inverse Head & Shoulders? 👀
Let’s make this very simple.
The first image shows what an Inverse Head & Shoulders pattern looks like.
Imagine a person standing upside down:
🟢 Left Shoulder
🔻 Head
🟢 Right Shoulder
The head is the deepest drop, while the two shoulders are higher and relatively similar.
The red line is called the neckline. Think of it as a ceiling that price needs to break.
Now look at the second image — my BTC 1H chart.
I’ve marked three areas around the $62K–$62.5K region that resemble:
➡️ Left Shoulder
➡️ Head
➡️ Right Shoulder
After forming this structure, BTC pushed strongly upward.
I’m also watching the Fibonacci levels around 50%, 61.8% and 78.6% as possible areas where price could react.
My bullish scenario is:
Pullback → Support → Continuation → Possible move toward the previous high area around $65K+
But remember:
⚠️ A pattern is NOT a guarantee.
The important confirmation would be whether BTC can successfully break and hold above the relevant resistance/neckline area.
If that confirmation fails, the bullish idea becomes weaker.
So for me, the big question is:
Is BTC completing an inverse head & shoulders, or is this simply another temporary bounce? 🤔
What do you see on the chart? 👇
#BTC #bitcoin #BTCUSDT #Crypto #TechnicalAnalysis
Let’s make this very simple.
The first image shows what an Inverse Head & Shoulders pattern looks like.
Imagine a person standing upside down:
🟢 Left Shoulder
🔻 Head
🟢 Right Shoulder
The head is the deepest drop, while the two shoulders are higher and relatively similar.
The red line is called the neckline. Think of it as a ceiling that price needs to break.
Now look at the second image — my BTC 1H chart.
I’ve marked three areas around the $62K–$62.5K region that resemble:
➡️ Left Shoulder
➡️ Head
➡️ Right Shoulder
After forming this structure, BTC pushed strongly upward.
I’m also watching the Fibonacci levels around 50%, 61.8% and 78.6% as possible areas where price could react.
My bullish scenario is:
Pullback → Support → Continuation → Possible move toward the previous high area around $65K+
But remember:
⚠️ A pattern is NOT a guarantee.
The important confirmation would be whether BTC can successfully break and hold above the relevant resistance/neckline area.
If that confirmation fails, the bullish idea becomes weaker.
So for me, the big question is:
Is BTC completing an inverse head & shoulders, or is this simply another temporary bounce? 🤔
What do you see on the chart? 👇
#BTC #bitcoin #BTCUSDT #Crypto #TechnicalAnalysis
1
96
·
--
BTC WEEKLY OUTLOOK 📊
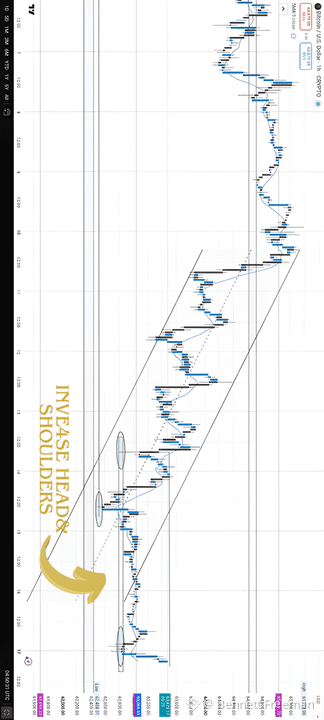
Despite BTC being in a corrective and ranging phase within a broader downtrend, this week has started with an interesting development: an Inverse Head & Shoulders pattern.
Think of it like BTC falling three times, but the middle fall goes deepest, while the third fall is weaker. This can be a sign that sellers are losing strength and buyers may be stepping in.
If BTC breaks and holds above the neckline, we could see a stronger bullish move this week. But if the breakout fails, BTC may continue ranging or move lower.
My bias: cautiously bullish, but confirmation is key. 🚀
#USToPressNationsToPickUSOrChinaAICoalition
#SP500EarningsBeatExpectations
#bitcoin
BTC WEEKLY OUTLOOK 📊
Despite BTC being in a corrective and ranging phase within a broader downtrend, this week has started with an interesting development: an Inverse Head & Shoulders pattern.
Think of it like BTC falling three times, but the middle fall goes deepest, while the third fall is weaker. This can be a sign that sellers are losing strength and buyers may be stepping in.
If BTC breaks and holds above the neckline, we could see a stronger bullish move this week. But if the breakout fails, BTC may continue ranging or move lower.
My bias: cautiously bullish, but confirmation is key. 🚀
#USToPressNationsToPickUSOrChinaAICoalition
#SP500EarningsBeatExpectations
#bitcoin
Despite BTC being in a corrective and ranging phase within a broader downtrend, this week has started with an interesting development: an Inverse Head & Shoulders pattern.
Think of it like BTC falling three times, but the middle fall goes deepest, while the third fall is weaker. This can be a sign that sellers are losing strength and buyers may be stepping in.
If BTC breaks and holds above the neckline, we could see a stronger bullish move this week. But if the breakout fails, BTC may continue ranging or move lower.
My bias: cautiously bullish, but confirmation is key. 🚀
#USToPressNationsToPickUSOrChinaAICoalition
#SP500EarningsBeatExpectations
#bitcoin
1
82
·
--
BTC . Let’s Make This Chart Easy to Understand
(DAY TRADING SETUP)
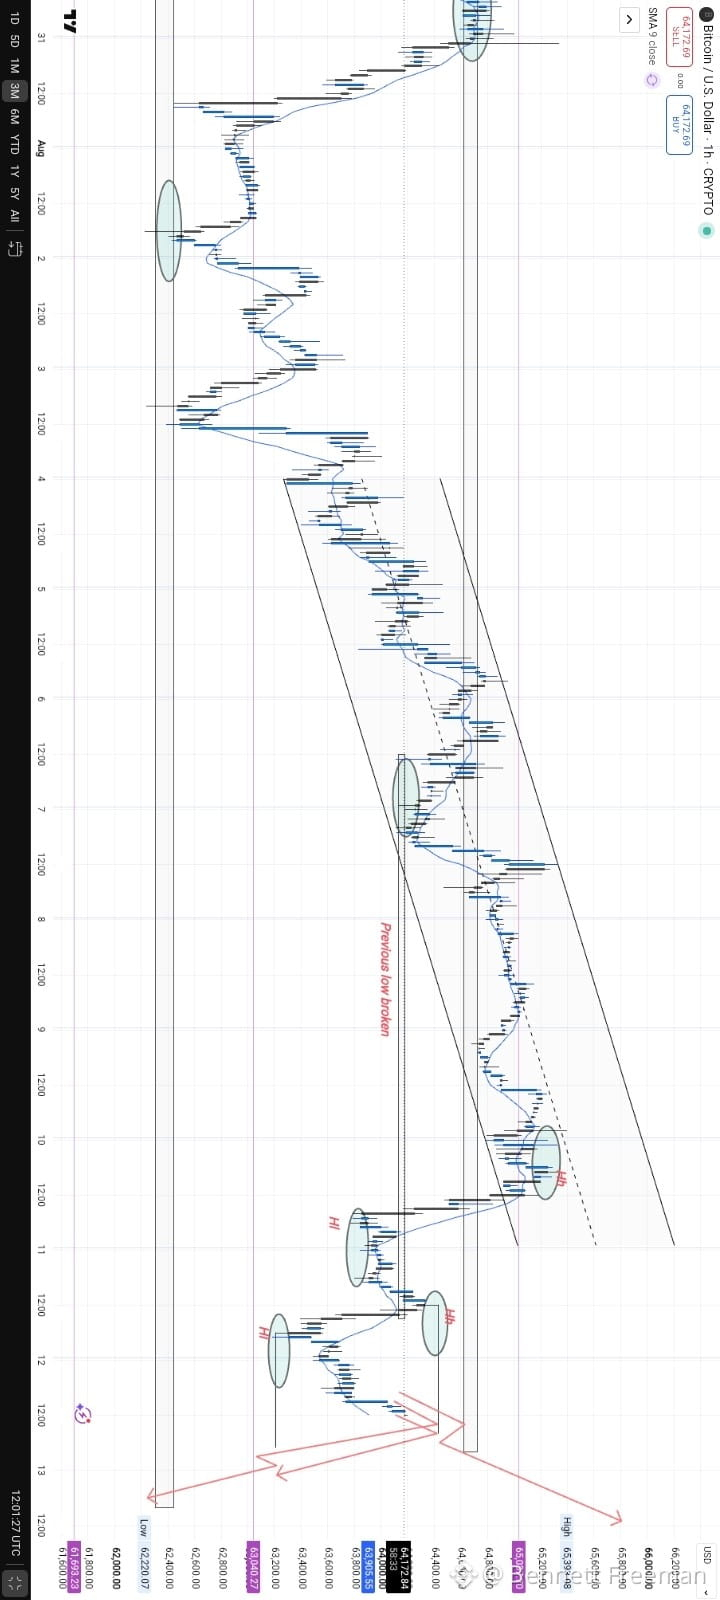
Think of the market like a staircase. BTC was climbing step by step inside an uptrend channel. We had higher highs and higher lows.
Then something important happened: the previous low was broken. ⛓️💥
That told us the staircase was starting to break.
After the breakdown, BTC started creating a new structure:
Lower High - Lower Low - Lower High - Lower Low
Right now, price is trying to move back up toward the 64,300–64,500 area.
🟢 If BTC breaks and holds above that resistance, the next important area could be around 65,000–65,400, with the possibility of pushing higher.
🔴 But if price gets rejected around 64,300–64,500, the bearish structure could continue, with 63,400 → 63,000 → 62,200 becoming important downside areas.
The simple lesson:
Don't focus only on whether price is going up or down. Watch the HIGHs and LOWs.
Higher High + Higher Low = buyers gaining control 📈
Lower High + Lower Low = sellers gaining control 📉
This is how I’m reading the setup for now. Always wait for confirmation before making a trade.
#bitcoin #MoneyGramExpandsCashCryptoServiceToSolana
#TechnicalAnalysiss
#TechnicalAnalysisCrypto
BTC . Let’s Make This Chart Easy to Understand
(DAY TRADING SETUP)
Think of the market like a staircase. BTC was climbing step by step inside an uptrend channel. We had higher highs and higher lows.
Then something important happened: the previous low was broken. ⛓️💥
That told us the staircase was starting to break.
After the breakdown, BTC started creating a new structure:
Lower High - Lower Low - Lower High - Lower Low
Right now, price is trying to move back up toward the 64,300–64,500 area.
🟢 If BTC breaks and holds above that resistance, the next important area could be around 65,000–65,400, with the possibility of pushing higher.
🔴 But if price gets rejected around 64,300–64,500, the bearish structure could continue, with 63,400 → 63,000 → 62,200 becoming important downside areas.
The simple lesson:
Don't focus only on whether price is going up or down. Watch the HIGHs and LOWs.
Higher High + Higher Low = buyers gaining control 📈
Lower High + Lower Low = sellers gaining control 📉
This is how I’m reading the setup for now. Always wait for confirmation before making a trade.
#bitcoin #MoneyGramExpandsCashCryptoServiceToSolana
#TechnicalAnalysiss
#TechnicalAnalysisCrypto
(DAY TRADING SETUP)
Think of the market like a staircase. BTC was climbing step by step inside an uptrend channel. We had higher highs and higher lows.
Then something important happened: the previous low was broken. ⛓️💥
That told us the staircase was starting to break.
After the breakdown, BTC started creating a new structure:
Lower High - Lower Low - Lower High - Lower Low
Right now, price is trying to move back up toward the 64,300–64,500 area.
🟢 If BTC breaks and holds above that resistance, the next important area could be around 65,000–65,400, with the possibility of pushing higher.
🔴 But if price gets rejected around 64,300–64,500, the bearish structure could continue, with 63,400 → 63,000 → 62,200 becoming important downside areas.
The simple lesson:
Don't focus only on whether price is going up or down. Watch the HIGHs and LOWs.
Higher High + Higher Low = buyers gaining control 📈
Lower High + Lower Low = sellers gaining control 📉
This is how I’m reading the setup for now. Always wait for confirmation before making a trade.
#bitcoin #MoneyGramExpandsCashCryptoServiceToSolana
#TechnicalAnalysiss
#TechnicalAnalysisCrypto
1
116
·
--
BTC $150K SETUP BUT THERE MAY BE ONE MORE DROP 👀
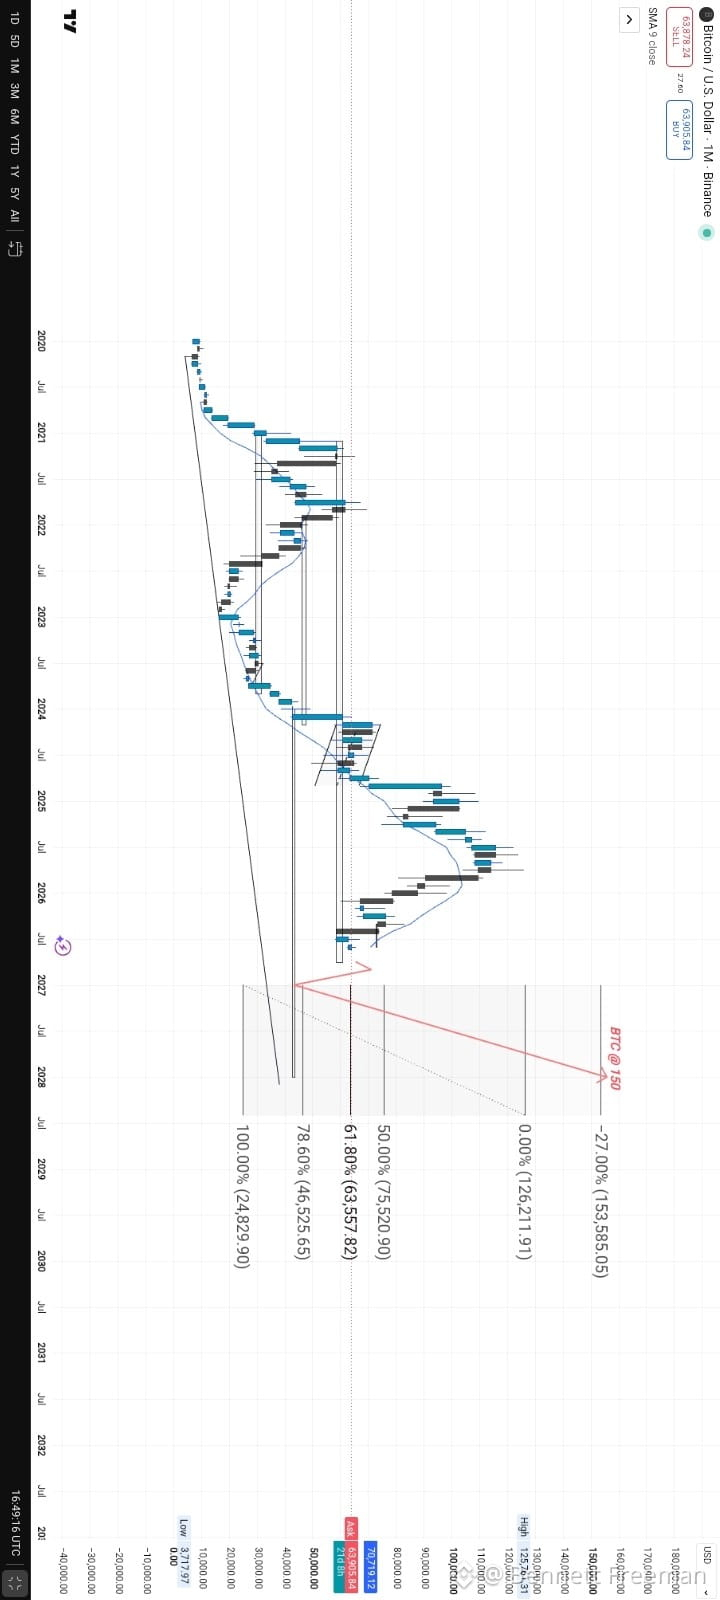
Let me explain my chart in the simplest way possible 😂.Bitcoin is currently around the $70K area, but I don't think the road to $150K will necessarily be straight up. Looking at the monthly chart, this is how I see it:
1️⃣ First, I'm watching the $63.5K area
This is an important level for me.
Think of it like a floor. If BTC comes down here, I want to see whether buyers step in and defend it.
2️⃣ But what if we go even lower?
My chart shows a possible deeper correction toward around $46.5K.
That's around the 78.6% Fibonacci level.
Basically, Bitcoin could take a big step backward before making another big move forward.It doesn't mean BTC MUST go to $46.5K. It's simply one scenario I'm watching.
3️⃣ Then comes the big target 🚀
If the market completes the correction and starts building bullish structure again, my long-term target is around: $150K+
The Fibonacci projection on my chart reaches roughly $153.6K.
So the roadmap I'm watching is:
$70K - $63.5K - possible $46.5K - recovery - $126K - $150K+
That's the setup I'm looking at.
What about the blue line?
That's the 9 month moving average (SMA 9).
Don't overthink it 😂
It's basically a line that helps me see the broader monthly price direction without all the noise.
And the black line?
That's the long-term trendline.
For me, it shows that even if BTC experiences a major correction, the bigger trend could still remain bullish.
👀 The main thing I'm watching
I don't want to predict every single candle.
I just want to see how BTC reacts around these major areas:
$63.5K -$46.5K - $126K - $150K
If the lower levels hold and Bitcoin starts showing strong bullish structure again, then the $150K target becomes very interesting.
But if the structure changes, I'll change my view too.
That's trading. You don't marry your prediction 😂.
What do you think?
Do we see $150K BTC, or does Bitcoin surprise everyone again? 👀
⚠️ Note this is not a financial advice. Always remember to do ur own research (DYOR) before making any investment or trading
BTC $150K SETUP BUT THERE MAY BE ONE MORE DROP 👀
Let me explain my chart in the simplest way possible 😂.Bitcoin is currently around the $70K area, but I don't think the road to $150K will necessarily be straight up. Looking at the monthly chart, this is how I see it:
1️⃣ First, I'm watching the $63.5K area
This is an important level for me.
Think of it like a floor. If BTC comes down here, I want to see whether buyers step in and defend it.
2️⃣ But what if we go even lower?
My chart shows a possible deeper correction toward around $46.5K.
That's around the 78.6% Fibonacci level.
Basically, Bitcoin could take a big step backward before making another big move forward.It doesn't mean BTC MUST go to $46.5K. It's simply one scenario I'm watching.
3️⃣ Then comes the big target 🚀
If the market completes the correction and starts building bullish structure again, my long-term target is around: $150K+
The Fibonacci projection on my chart reaches roughly $153.6K.
So the roadmap I'm watching is:
$70K - $63.5K - possible $46.5K - recovery - $126K - $150K+
That's the setup I'm looking at.
What about the blue line?
That's the 9 month moving average (SMA 9).
Don't overthink it 😂
It's basically a line that helps me see the broader monthly price direction without all the noise.
And the black line?
That's the long-term trendline.
For me, it shows that even if BTC experiences a major correction, the bigger trend could still remain bullish.
👀 The main thing I'm watching
I don't want to predict every single candle.
I just want to see how BTC reacts around these major areas:
$63.5K -$46.5K - $126K - $150K
If the lower levels hold and Bitcoin starts showing strong bullish structure again, then the $150K target becomes very interesting.
But if the structure changes, I'll change my view too.
That's trading. You don't marry your prediction 😂.
What do you think?
Do we see $150K BTC, or does Bitcoin surprise everyone again? 👀
⚠️ Note this is not a financial advice. Always remember to do ur own research (DYOR) before making any investment or trading
Let me explain my chart in the simplest way possible 😂.Bitcoin is currently around the $70K area, but I don't think the road to $150K will necessarily be straight up. Looking at the monthly chart, this is how I see it:
1️⃣ First, I'm watching the $63.5K area
This is an important level for me.
Think of it like a floor. If BTC comes down here, I want to see whether buyers step in and defend it.
2️⃣ But what if we go even lower?
My chart shows a possible deeper correction toward around $46.5K.
That's around the 78.6% Fibonacci level.
Basically, Bitcoin could take a big step backward before making another big move forward.It doesn't mean BTC MUST go to $46.5K. It's simply one scenario I'm watching.
3️⃣ Then comes the big target 🚀
If the market completes the correction and starts building bullish structure again, my long-term target is around: $150K+
The Fibonacci projection on my chart reaches roughly $153.6K.
So the roadmap I'm watching is:
$70K - $63.5K - possible $46.5K - recovery - $126K - $150K+
That's the setup I'm looking at.
What about the blue line?
That's the 9 month moving average (SMA 9).
Don't overthink it 😂
It's basically a line that helps me see the broader monthly price direction without all the noise.
And the black line?
That's the long-term trendline.
For me, it shows that even if BTC experiences a major correction, the bigger trend could still remain bullish.
👀 The main thing I'm watching
I don't want to predict every single candle.
I just want to see how BTC reacts around these major areas:
$63.5K -$46.5K - $126K - $150K
If the lower levels hold and Bitcoin starts showing strong bullish structure again, then the $150K target becomes very interesting.
But if the structure changes, I'll change my view too.
That's trading. You don't marry your prediction 😂.
What do you think?
Do we see $150K BTC, or does Bitcoin surprise everyone again? 👀
⚠️ Note this is not a financial advice. Always remember to do ur own research (DYOR) before making any investment or trading
1
113
·
--
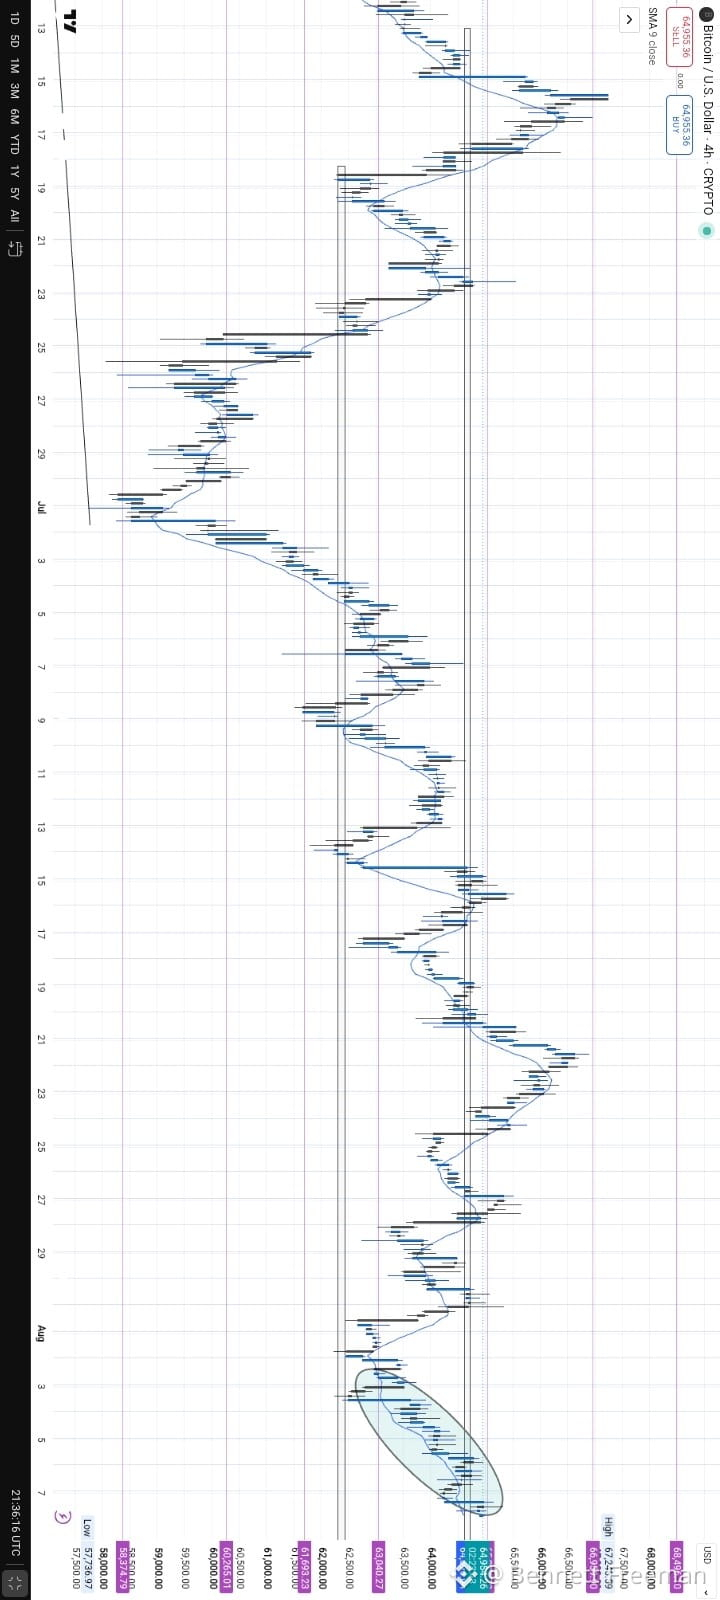
This is how BTC traded this week the path I highlighted in blue 💙📈
Honestly, anything currently going on with BTC may not make much sense if you’re expecting a clean trend. The market is still in a corrective phase, and this is where patience becomes everything.
If you’re not patient enough, you can easily overtrade, force entries, and blow several accounts before the right setup finally plays out.
Sometimes the best trade is simply waiting for the correction to finish and letting the market show its hand. 🧘♂️
Don’t chase BTC. Don’t force the setup. Let the market come to you.
Patience is part of the strategy. 💙
#BTC #cryptotrading #priceaction #bitcoin
This is how BTC traded this week the path I highlighted in blue 💙📈
Honestly, anything currently going on with BTC may not make much sense if you’re expecting a clean trend. The market is still in a corrective phase, and this is where patience becomes everything.
If you’re not patient enough, you can easily overtrade, force entries, and blow several accounts before the right setup finally plays out.
Sometimes the best trade is simply waiting for the correction to finish and letting the market show its hand. 🧘♂️
Don’t chase BTC. Don’t force the setup. Let the market come to you.
Patience is part of the strategy. 💙
#BTC #cryptotrading #priceaction #bitcoin
Honestly, anything currently going on with BTC may not make much sense if you’re expecting a clean trend. The market is still in a corrective phase, and this is where patience becomes everything.
If you’re not patient enough, you can easily overtrade, force entries, and blow several accounts before the right setup finally plays out.
Sometimes the best trade is simply waiting for the correction to finish and letting the market show its hand. 🧘♂️
Don’t chase BTC. Don’t force the setup. Let the market come to you.
Patience is part of the strategy. 💙
#BTC #cryptotrading #priceaction #bitcoin
1
128
·
--
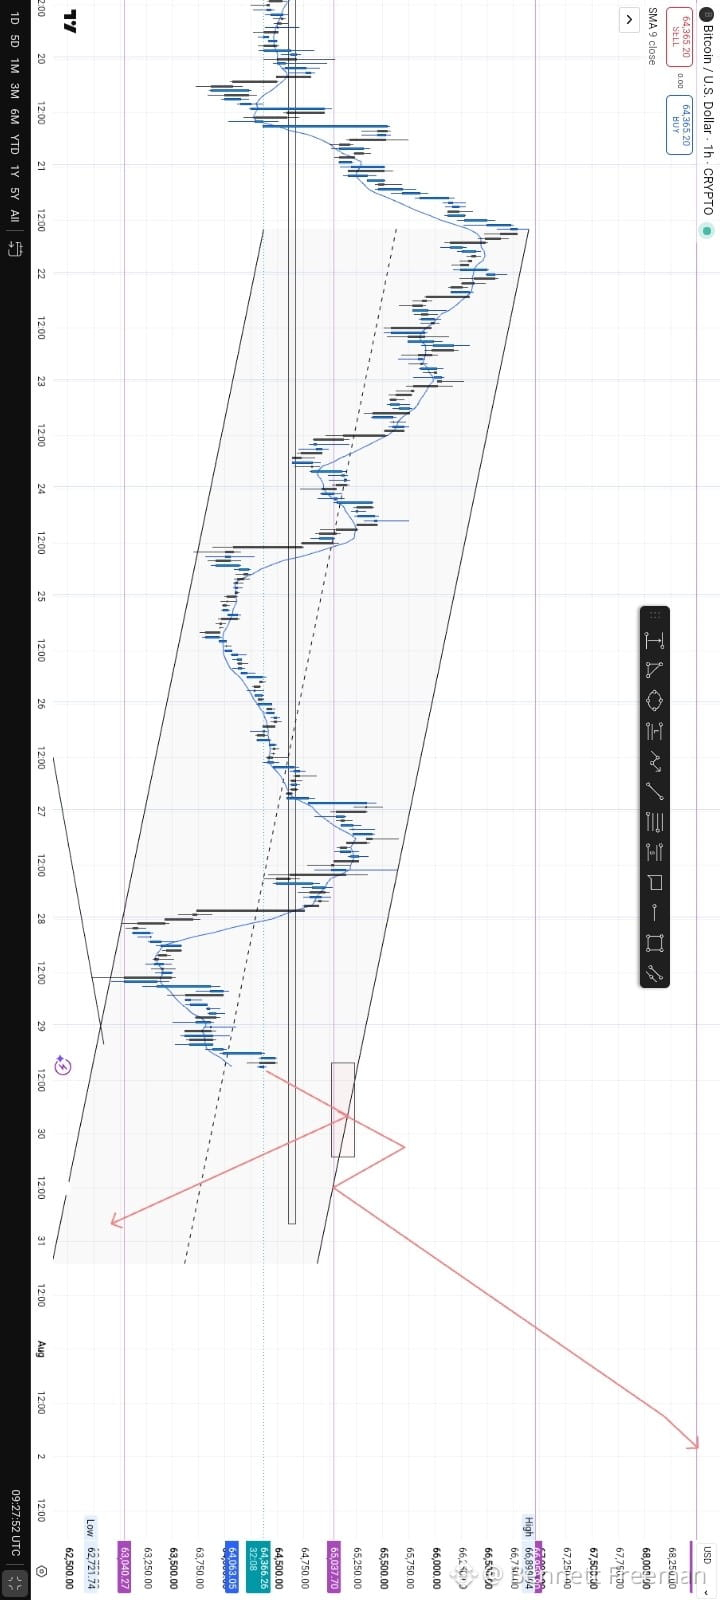
BTC ANALYSIS
Bitcoin is currently trading inside a descending channel, and price has climbed back into a key resistance area. The highlighted zone is where I'm expecting the market to make its next decision.
From what I'm seeing:
Price is approaching the upper boundary of the channel, which has acted as dynamic resistance before.
The grey box marks a reaction zone. If sellers step in here, we could see a rejection back toward the middle and eventually the lower boundary of the channel.
However, if buyers manage to break above this zone with strong momentum and hold it as support, the bearish structure would weaken, opening the door for a stronger bullish continuation.
My bias: I'm leaning slightly bearish unless BTC confirms a clean breakout above the highlighted resistance.
Key scenarios: 🟥 Bearish: Rejection from the resistance zone → move back toward the channel's lower trendline. 🟩 Bullish: Break and close above the channel → retest → continuation toward new highs.
Patience is key. Let the market confirm the direction instead of chasing the move.
This is just my technical view based on price action, not financial advice.
#BTC #bitcoin #crypto #trading #PriceAction
BTC ANALYSIS
Bitcoin is currently trading inside a descending channel, and price has climbed back into a key resistance area. The highlighted zone is where I'm expecting the market to make its next decision.
From what I'm seeing:
Price is approaching the upper boundary of the channel, which has acted as dynamic resistance before.
The grey box marks a reaction zone. If sellers step in here, we could see a rejection back toward the middle and eventually the lower boundary of the channel.
However, if buyers manage to break above this zone with strong momentum and hold it as support, the bearish structure would weaken, opening the door for a stronger bullish continuation.
My bias: I'm leaning slightly bearish unless BTC confirms a clean breakout above the highlighted resistance.
Key scenarios: 🟥 Bearish: Rejection from the resistance zone → move back toward the channel's lower trendline. 🟩 Bullish: Break and close above the channel → retest → continuation toward new highs.
Patience is key. Let the market confirm the direction instead of chasing the move.
This is just my technical view based on price action, not financial advice.
#BTC #bitcoin #crypto #trading #PriceAction
Bitcoin is currently trading inside a descending channel, and price has climbed back into a key resistance area. The highlighted zone is where I'm expecting the market to make its next decision.
From what I'm seeing:
Price is approaching the upper boundary of the channel, which has acted as dynamic resistance before.
The grey box marks a reaction zone. If sellers step in here, we could see a rejection back toward the middle and eventually the lower boundary of the channel.
However, if buyers manage to break above this zone with strong momentum and hold it as support, the bearish structure would weaken, opening the door for a stronger bullish continuation.
My bias: I'm leaning slightly bearish unless BTC confirms a clean breakout above the highlighted resistance.
Key scenarios: 🟥 Bearish: Rejection from the resistance zone → move back toward the channel's lower trendline. 🟩 Bullish: Break and close above the channel → retest → continuation toward new highs.
Patience is key. Let the market confirm the direction instead of chasing the move.
This is just my technical view based on price action, not financial advice.
#BTC #bitcoin #crypto #trading #PriceAction
1
69
·
--
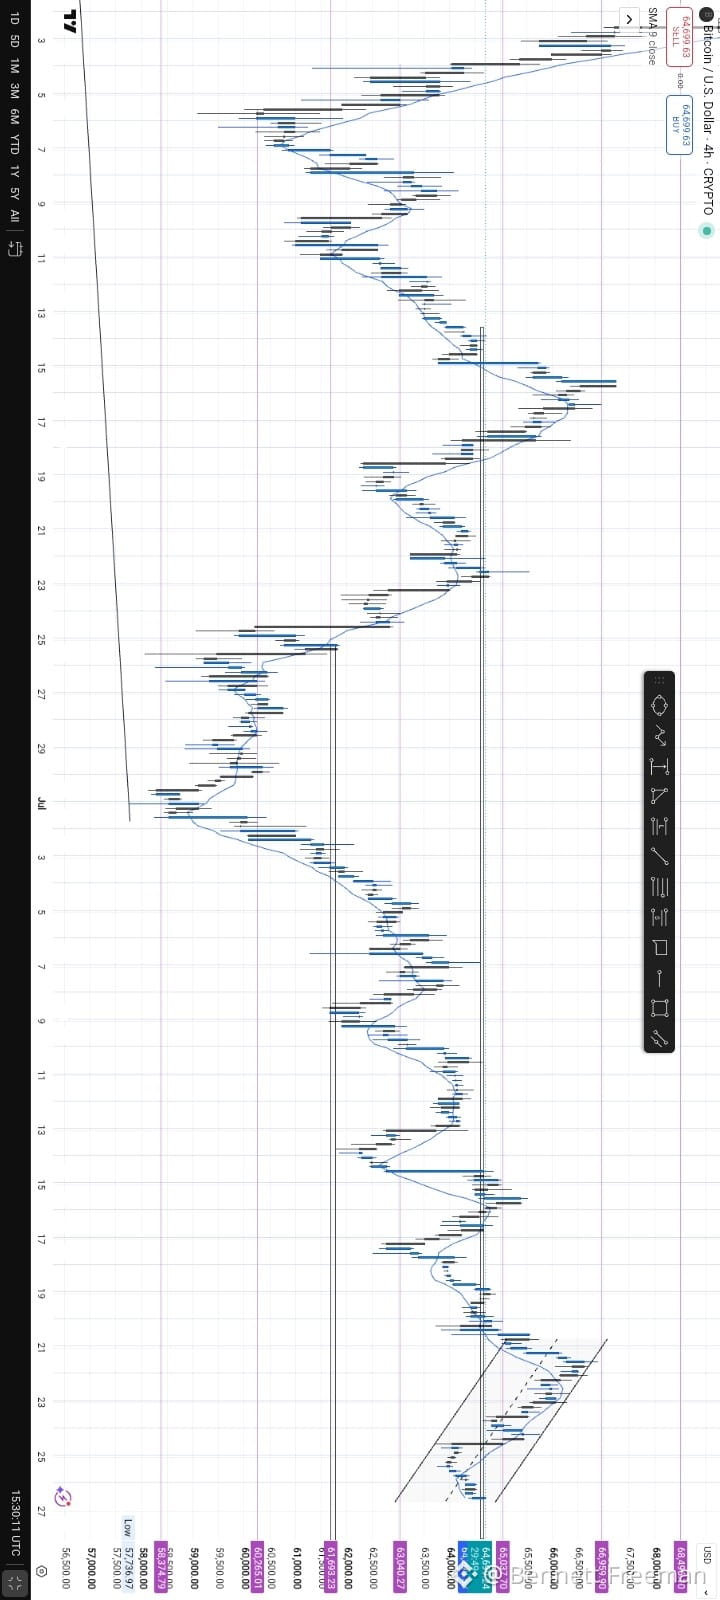
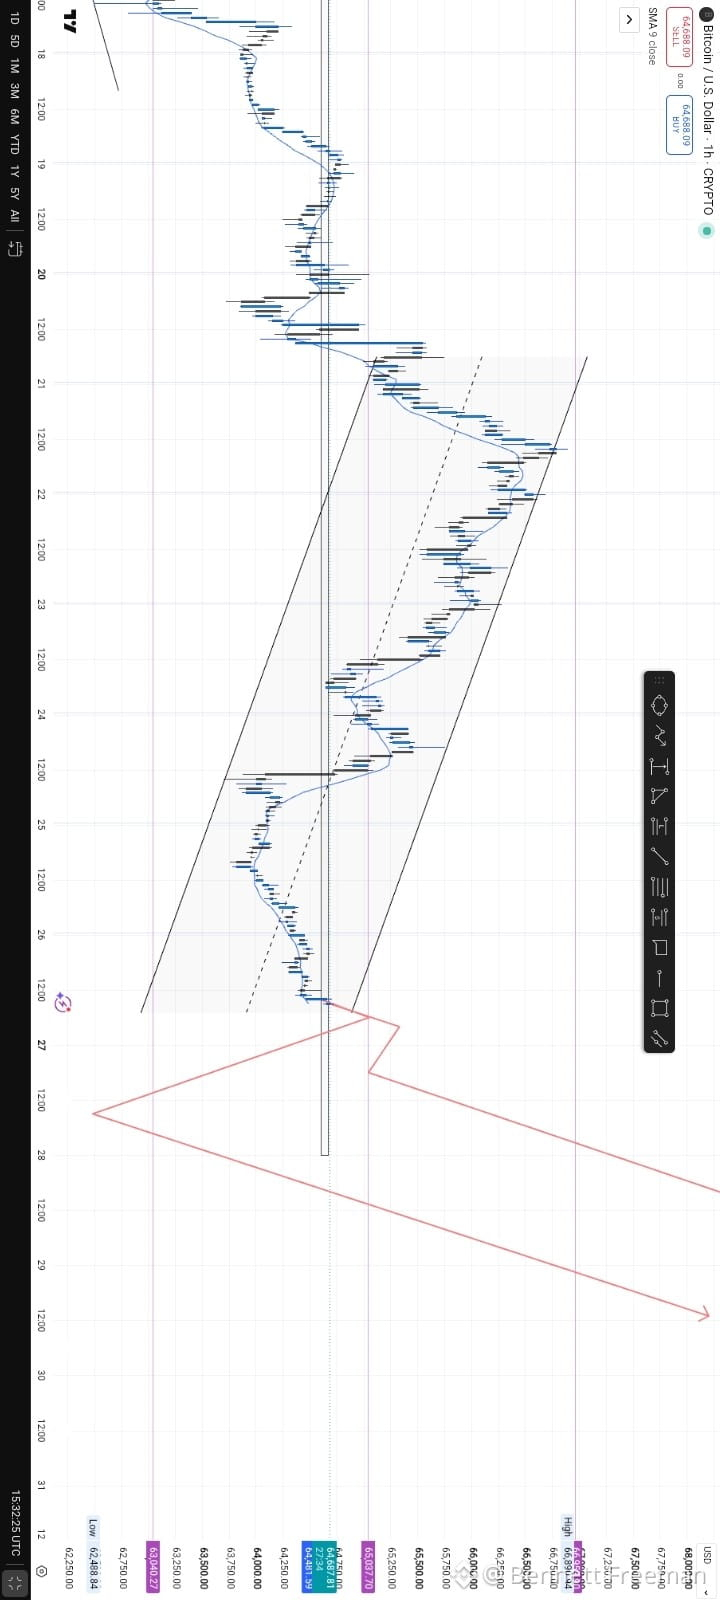
📊 BITCOIN OUTLOOK: CORRECTION BEFORE THE NEXT MAJOR BULL RUN?🚀
Based on my technical analysis, Bitcoin is currently in a corrective phase, with price trapped inside a well-defined support and resistance range, making short-term direction uncertain.
My chart suggests that BTC could continue its corrective move toward the $72,876 region, which aligns with the 61.8% Fibonacci Golden Ratio. This is a key area where I expect strong selling pressure to emerge.
If that rejection plays out, Bitcoin could experience a sharp decline, potentially breaking below the $60,000 support and extending toward the $49,965 demand zone.
I believe that $49,965 could mark the end of the correction and become the launchpad for the next major bullish leg. From there, Bitcoin may regain momentum, break above its previous all-time high, and target the $125,000–$150,000 range.
📌 KEY LEVELS TO WATCH:
🎯 Fibonacci 61.8%: $72,876
🛑 Major Support: $60,000
💎 Potential Reversal Zone: $49,965
🚀 Bull Run Target: $125,000–$150,000
This is my personal technical outlook, not financial advice. As always, risk management is more important than being right.
What's your view? Do you see Bitcoin revisiting $50K before the next explosive rally, or will the bulls take
#Bitcoin #BTC #Crypto #TechnicalAnalysis
#BinanceSquare
📊 BITCOIN OUTLOOK: CORRECTION BEFORE THE NEXT MAJOR BULL RUN?🚀
Based on my technical analysis, Bitcoin is currently in a corrective phase, with price trapped inside a well-defined support and resistance range, making short-term direction uncertain.
My chart suggests that BTC could continue its corrective move toward the $72,876 region, which aligns with the 61.8% Fibonacci Golden Ratio. This is a key area where I expect strong selling pressure to emerge.
If that rejection plays out, Bitcoin could experience a sharp decline, potentially breaking below the $60,000 support and extending toward the $49,965 demand zone.
I believe that $49,965 could mark the end of the correction and become the launchpad for the next major bullish leg. From there, Bitcoin may regain momentum, break above its previous all-time high, and target the $125,000–$150,000 range.
📌 KEY LEVELS TO WATCH:
🎯 Fibonacci 61.8%: $72,876
🛑 Major Support: $60,000
💎 Potential Reversal Zone: $49,965
🚀 Bull Run Target: $125,000–$150,000
This is my personal technical outlook, not financial advice. As always, risk management is more important than being right.
What's your view? Do you see Bitcoin revisiting $50K before the next explosive rally, or will the bulls take
#Bitcoin #BTC #Crypto #TechnicalAnalysis
#BinanceSquare
Based on my technical analysis, Bitcoin is currently in a corrective phase, with price trapped inside a well-defined support and resistance range, making short-term direction uncertain.
My chart suggests that BTC could continue its corrective move toward the $72,876 region, which aligns with the 61.8% Fibonacci Golden Ratio. This is a key area where I expect strong selling pressure to emerge.
If that rejection plays out, Bitcoin could experience a sharp decline, potentially breaking below the $60,000 support and extending toward the $49,965 demand zone.
I believe that $49,965 could mark the end of the correction and become the launchpad for the next major bullish leg. From there, Bitcoin may regain momentum, break above its previous all-time high, and target the $125,000–$150,000 range.
📌 KEY LEVELS TO WATCH:
🎯 Fibonacci 61.8%: $72,876
🛑 Major Support: $60,000
💎 Potential Reversal Zone: $49,965
🚀 Bull Run Target: $125,000–$150,000
This is my personal technical outlook, not financial advice. As always, risk management is more important than being right.
What's your view? Do you see Bitcoin revisiting $50K before the next explosive rally, or will the bulls take
#Bitcoin #BTC #Crypto #TechnicalAnalysis
#BinanceSquare
1
216
·
--
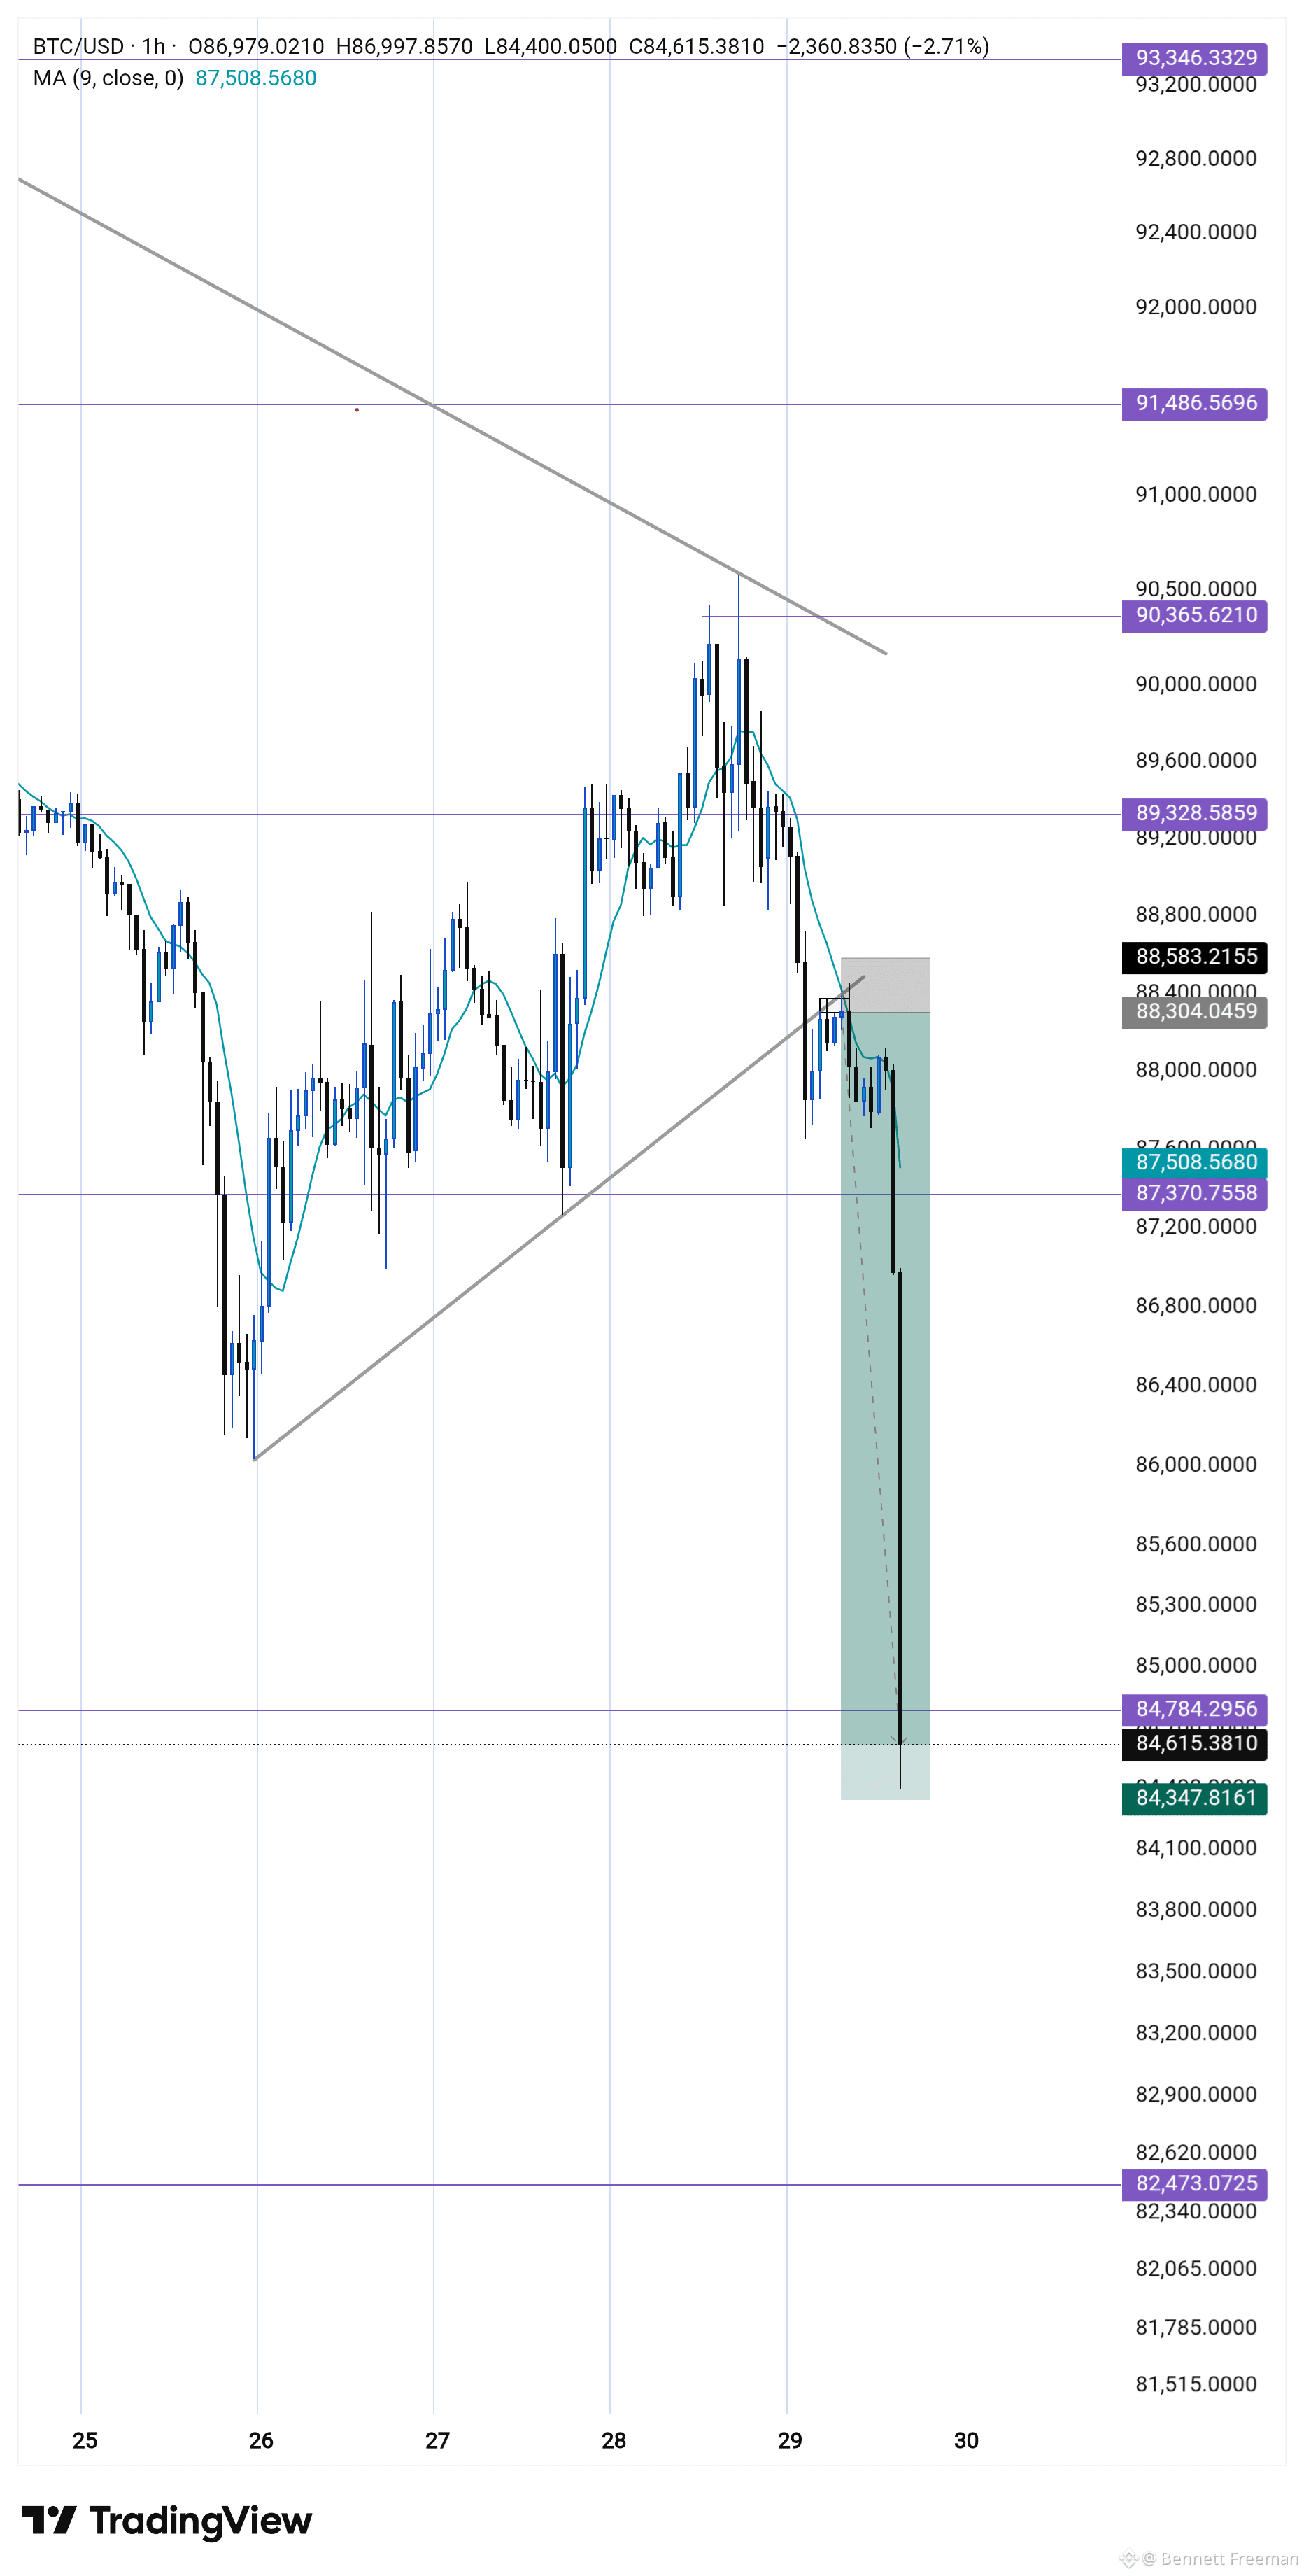
After $BTC printed a series of higher highs and higher lows, price pushed into the 61% Fibonacci golden zone, where a double-top structure formed.
Entering at that level would have required a wide stop-loss, so I stayed patient and waited for confirmation. Price then broke the ascending trendline and later retested it, signaling a potential shift in market structure.
My initial entry was slightly early and got stopped out, but I remained disciplined. I waited for a 4-hour candle close, which printed a clear bearish engulfing pattern at the retest.
That confirmation provided a high-probability setup, and I entered a short position targeting the 84k region, aligning with the next key support zone.
#StrategyBTCPurchase
#GoldOnTheRise
After $BTC printed a series of higher highs and higher lows, price pushed into the 61% Fibonacci golden zone, where a double-top structure formed.
Entering at that level would have required a wide stop-loss, so I stayed patient and waited for confirmation. Price then broke the ascending trendline and later retested it, signaling a potential shift in market structure.
My initial entry was slightly early and got stopped out, but I remained disciplined. I waited for a 4-hour candle close, which printed a clear bearish engulfing pattern at the retest.
That confirmation provided a high-probability setup, and I entered a short position targeting the 84k region, aligning with the next key support zone.
#StrategyBTCPurchase
#GoldOnTheRise
Entering at that level would have required a wide stop-loss, so I stayed patient and waited for confirmation. Price then broke the ascending trendline and later retested it, signaling a potential shift in market structure.
My initial entry was slightly early and got stopped out, but I remained disciplined. I waited for a 4-hour candle close, which printed a clear bearish engulfing pattern at the retest.
That confirmation provided a high-probability setup, and I entered a short position targeting the 84k region, aligning with the next key support zone.
#StrategyBTCPurchase
#GoldOnTheRise
40
·
--
$BTC /USD MARKET STRUCTURE ANALYSIS 📊
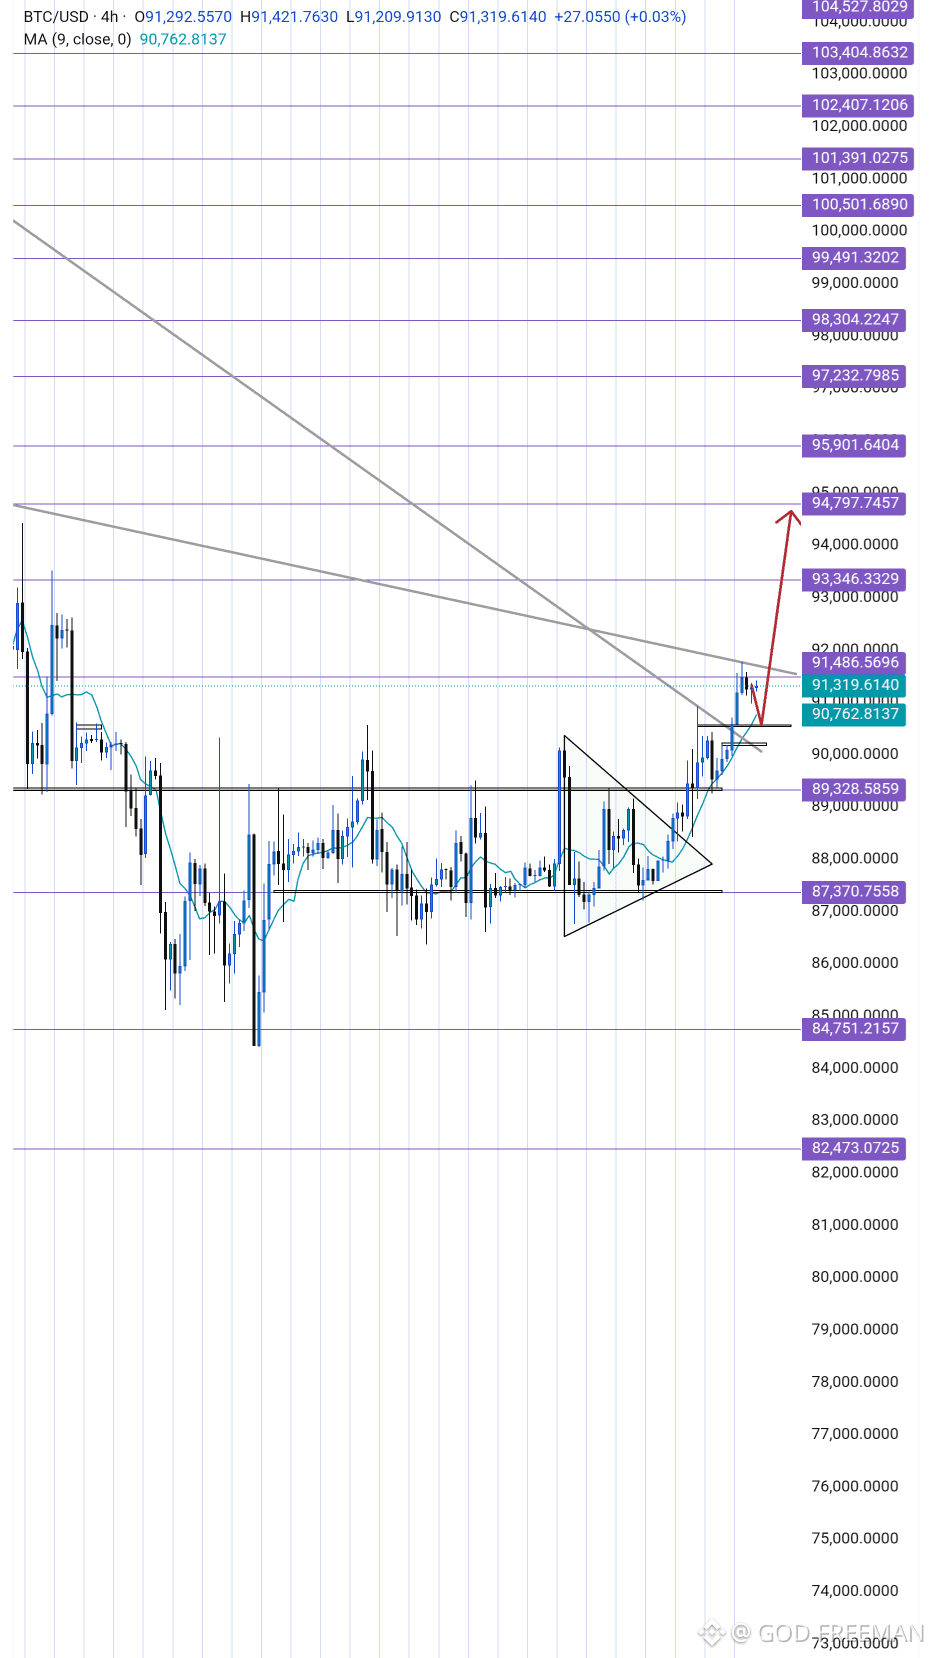
Bitcoin continues to respect the 90,000 support zone, which remains the backbone of the current bullish trend. Price has broken out of consolidation and is now maintaining strength above key structure levels.
As long as $BTC retests 90,000 and holds without a decisive breakdown, the bullish bias remains valid. This level acts as a critical demand zone, supporting further upside expansion.
📈 Bullish Scenario:
°Strong structural support at 90K
°Higher lows confirmed
°Momentum favors continuation
°Sustained strength increases the probability of a move toward the 126K all-time high
⚠️ Risk Note:
A confirmed break and close below 90K would invalidate this bullish outlook.
What are your thoughts?👇👇👇🤔🤔
🚫 Not financial advice. DYOR.
#FOMCWatch
#BinanceHODLerMorpho
#CPIWatch✨
#WriteToEarnUpgradel
#BTCVSGOLD
$BTC /USD MARKET STRUCTURE ANALYSIS 📊
Bitcoin continues to respect the 90,000 support zone, which remains the backbone of the current bullish trend. Price has broken out of consolidation and is now maintaining strength above key structure levels.
As long as $BTC retests 90,000 and holds without a decisive breakdown, the bullish bias remains valid. This level acts as a critical demand zone, supporting further upside expansion.
📈 Bullish Scenario:
°Strong structural support at 90K
°Higher lows confirmed
°Momentum favors continuation
°Sustained strength increases the probability of a move toward the 126K all-time high
⚠️ Risk Note:
A confirmed break and close below 90K would invalidate this bullish outlook.
What are your thoughts?👇👇👇🤔🤔
🚫 Not financial advice. DYOR.
#FOMCWatch
#BinanceHODLerMorpho
#CPIWatch✨
#WriteToEarnUpgradel
#BTCVSGOLD
Bitcoin continues to respect the 90,000 support zone, which remains the backbone of the current bullish trend. Price has broken out of consolidation and is now maintaining strength above key structure levels.
As long as $BTC retests 90,000 and holds without a decisive breakdown, the bullish bias remains valid. This level acts as a critical demand zone, supporting further upside expansion.
📈 Bullish Scenario:
°Strong structural support at 90K
°Higher lows confirmed
°Momentum favors continuation
°Sustained strength increases the probability of a move toward the 126K all-time high
⚠️ Risk Note:
A confirmed break and close below 90K would invalidate this bullish outlook.
What are your thoughts?👇👇👇🤔🤔
🚫 Not financial advice. DYOR.
#FOMCWatch
#BinanceHODLerMorpho
#CPIWatch✨
#WriteToEarnUpgradel
#BTCVSGOLD
9
124
·
--
🧐 BTC/USD: Testing Critical Resistance on the 4H Chart
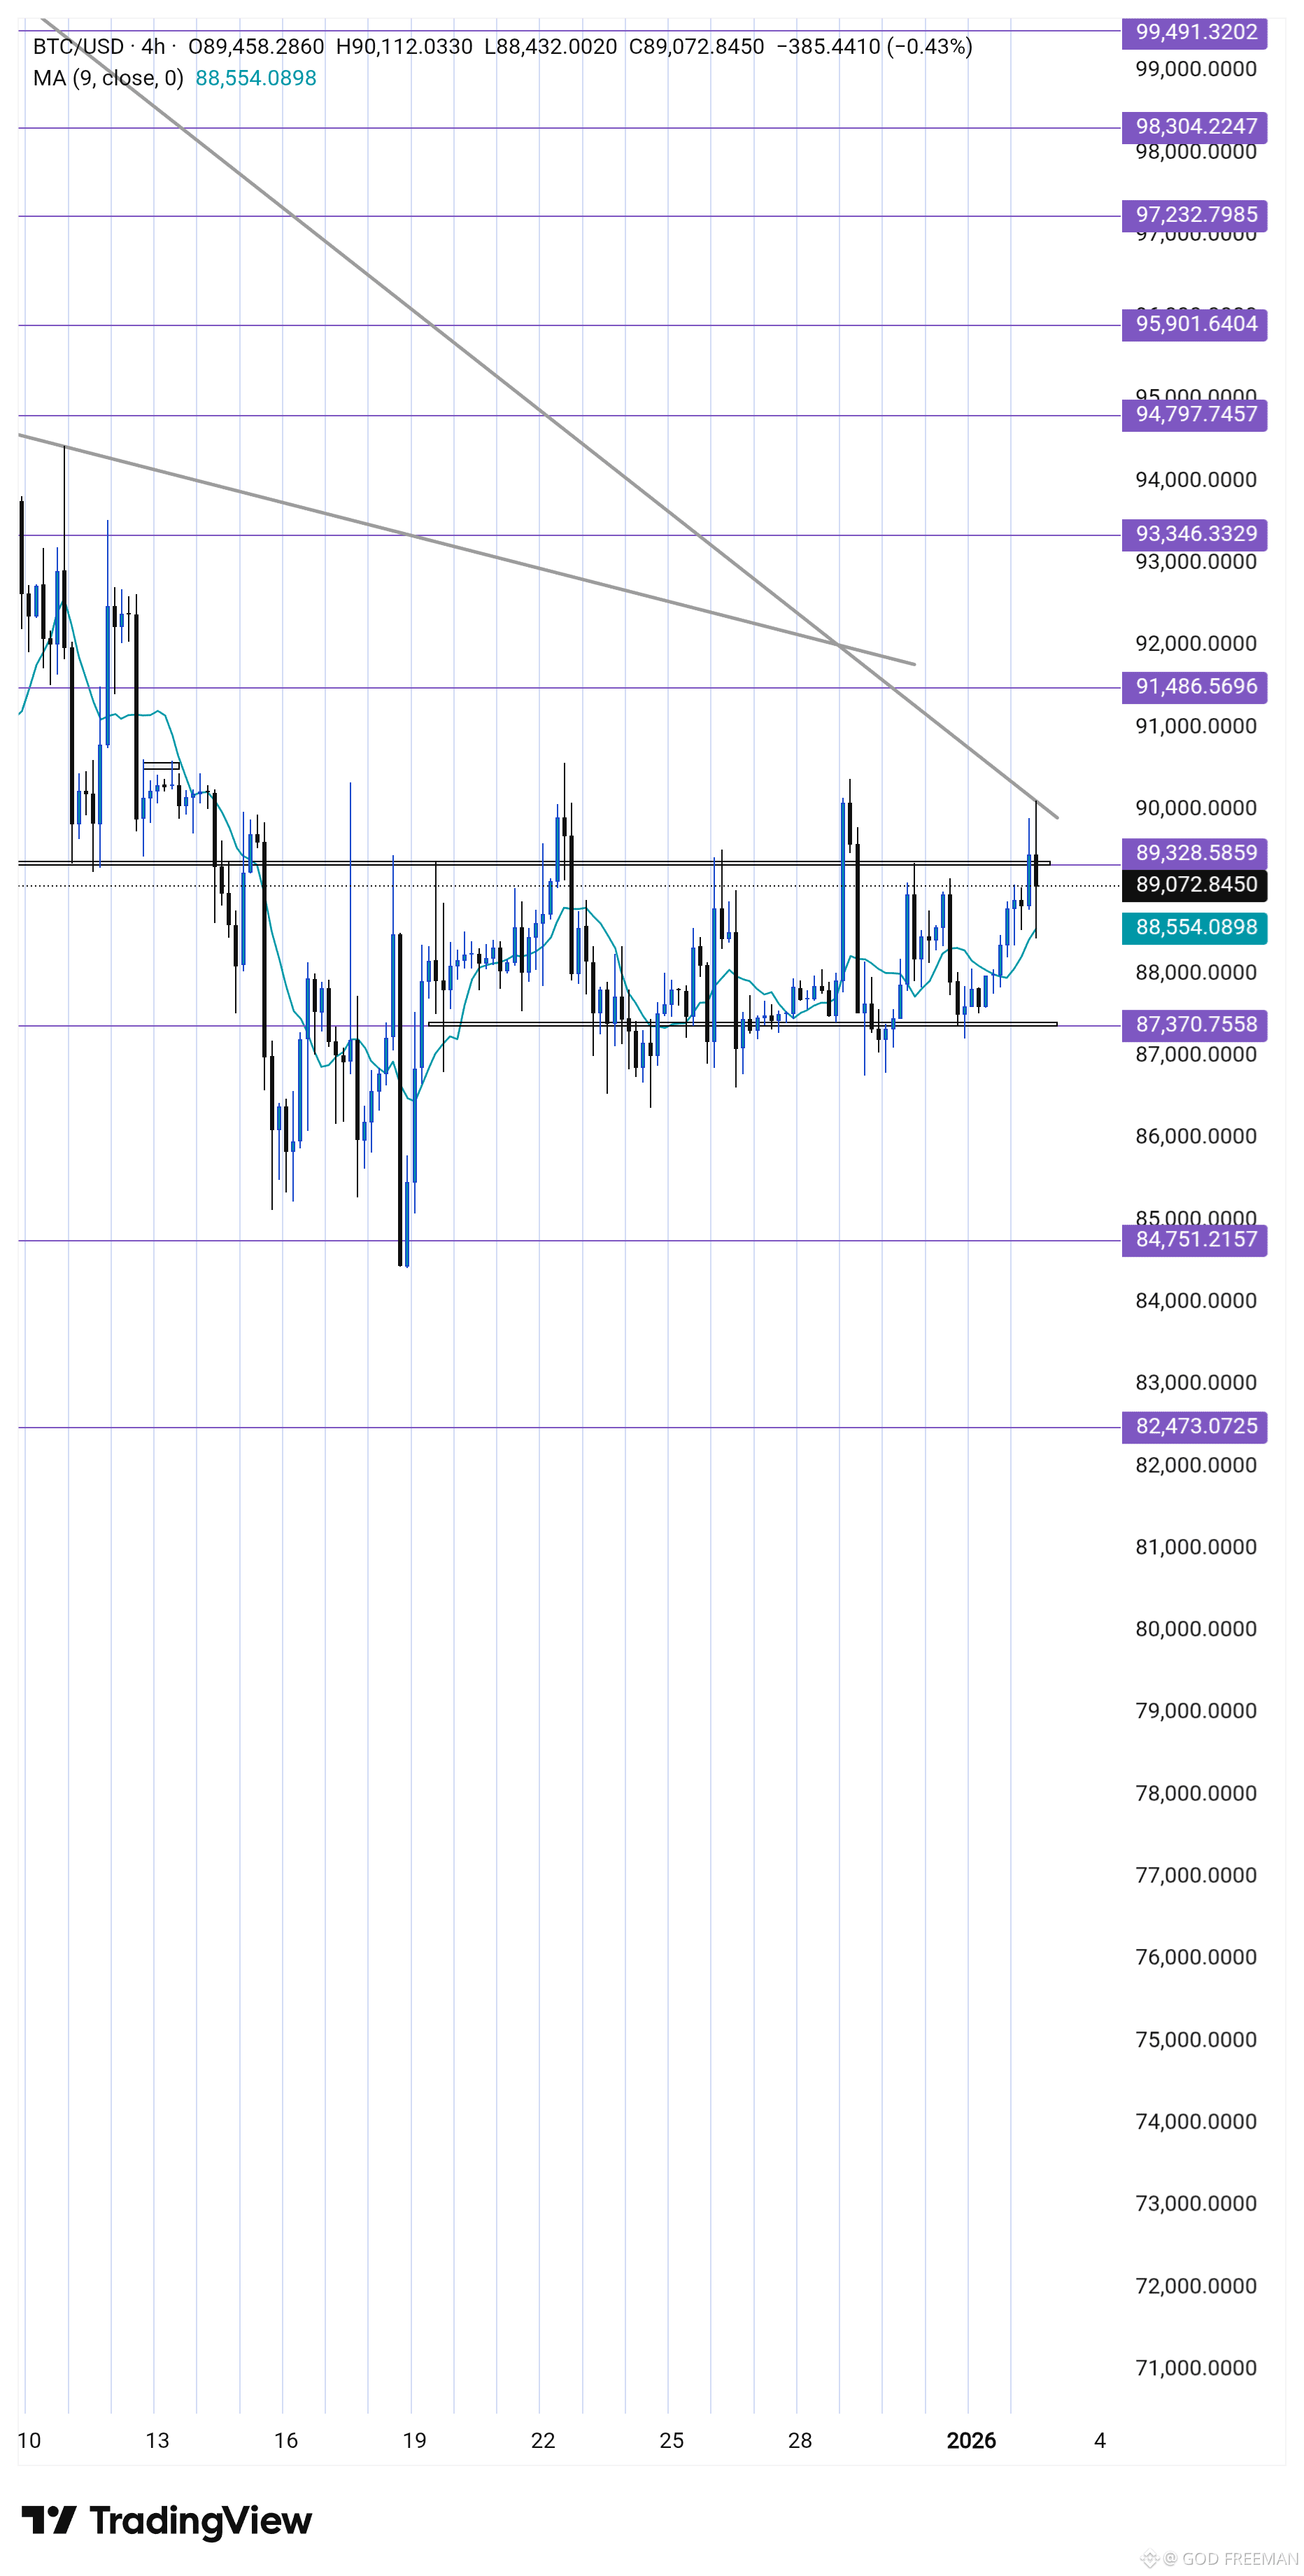
Bitcoin is currently grappling with a major resistance zone, marked by the descending trendline (the upper gray line).
Current Price: Approximately $$$89,672.
Key Resistance Test: Price is right at the intersection of the descending resistance trendline and the psychological $$$90,000 level.
Crucial Support: Immediate support is near the $$$87,000 horizontal line, and the 9-period Moving Average (MA) is currently at $$$88,554, providing dynamic support just below the current price.
📈 What to Watch:
Breakout Confirmation: A decisive break and close above the trendline and $$$90,000 would be a very bullish signal, potentially opening the door for a move toward $$$93,000 and $$$95,000.
Rejection Risk: If the resistance holds, we could see a rejection back toward the $$$87,000 support level.
What are your thoughts? Bullish breakout or bearish rejection? 👇
#BTC90kChristmas
#StrategyBTCPurchase
#USJobsData
#FOMCWatch
#USChinaDeal
🧐 BTC/USD: Testing Critical Resistance on the 4H Chart
Bitcoin is currently grappling with a major resistance zone, marked by the descending trendline (the upper gray line).
Current Price: Approximately $$$89,672.
Key Resistance Test: Price is right at the intersection of the descending resistance trendline and the psychological $$$90,000 level.
Crucial Support: Immediate support is near the $$$87,000 horizontal line, and the 9-period Moving Average (MA) is currently at $$$88,554, providing dynamic support just below the current price.
📈 What to Watch:
Breakout Confirmation: A decisive break and close above the trendline and $$$90,000 would be a very bullish signal, potentially opening the door for a move toward $$$93,000 and $$$95,000.
Rejection Risk: If the resistance holds, we could see a rejection back toward the $$$87,000 support level.
What are your thoughts? Bullish breakout or bearish rejection? 👇
#BTC90kChristmas
#StrategyBTCPurchase
#USJobsData
#FOMCWatch
#USChinaDeal
Bitcoin is currently grappling with a major resistance zone, marked by the descending trendline (the upper gray line).
Current Price: Approximately $$$89,672.
Key Resistance Test: Price is right at the intersection of the descending resistance trendline and the psychological $$$90,000 level.
Crucial Support: Immediate support is near the $$$87,000 horizontal line, and the 9-period Moving Average (MA) is currently at $$$88,554, providing dynamic support just below the current price.
📈 What to Watch:
Breakout Confirmation: A decisive break and close above the trendline and $$$90,000 would be a very bullish signal, potentially opening the door for a move toward $$$93,000 and $$$95,000.
Rejection Risk: If the resistance holds, we could see a rejection back toward the $$$87,000 support level.
What are your thoughts? Bullish breakout or bearish rejection? 👇
#BTC90kChristmas
#StrategyBTCPurchase
#USJobsData
#FOMCWatch
#USChinaDeal
2
1
12
171
Log in to explore more content
Join global crypto users on Binance Square
⚡️ Get latest and useful information about crypto.
💬 Trusted by the world’s largest crypto exchange.
👍 Discover real insights from verified creators.
Email / Phone number
Trending Topics
CircleMints500MUSDCOnSolana
36,385 views
979 Discussing
💵 Solana just received another $500M of USDC. But don't make the mistake everyone else is making...
#circlemints500musdconsolana
Circle's USDC Treasury recorded two 250M USDC mints on Solana, creating $500M of fresh supply through its authorized infrastructure.
Circle now reports $75.2B USDC in circulation globally.
But:
A mint is not the same as $500M of fresh market demand.
It tells us Circle created the inventory.
It does not tell us that $500M has already entered Solana DeFi, exchanges, payments or trading.
That's where the interesting signal begins.
Solana's stablecoin economy is already operating at enormous scale, with recent reporting putting network stablecoin volume above $5T in 2026.
So this isn't really a “USDC mint = SOL bullish” story.
It's an inventory → deployment story.
Watch the wallets.
Where does that $500M move next?
If it gets deployed into exchanges, lending, payments or liquidity pools, the market has something much more meaningful than a treasury print.
The mint confirms creation of USDC, not the eventual destination or economic use of the funds.
$SOL $RARE $USDC
#CircleMints500MUSDCOnSolana #solana #BlackRockBuildsTokenizedPortfoliosForOndo #defi
Stink meaner
·6 Likes
·4.5k views
PolymarketBankFailureBetsDrawFDICConcern
49,790 views
1,101 Discussing
BlackRockBuildsTokenizedPortfoliosForOndo
40,834 views
745 Discussing