
Giannis Andreou
1.3k Posts

Giannis Andreou
Report
Block User
Crypto analyst. 2000 Video content on YouTube - Giannis Andreou | Bitmern Mining Founder & CEO | Author
1.4K+ Following
29.3K+ Followers
19.8K+ Liked
Posts
All
Quotes
Videos
Live
PINNED
🔥 Throwback to One of My Most Insightful Crypto Conversations! 🔥
Two years ago, I had the chance to sit down with CZ for a deep dive into the future of Web3, the challenges of global adoption, and the mindset behind building in a fast-moving crypto world.
From discussing Bitcoin’s resilience 🟧, to the rise of BNB 🚀, to exploring how stablecoins would reshape global finance 💴 → it was one of those conversations that sticks with you long after the cameras stop rolling.
If you missed it back then, now’s the perfect time to revisit it— the insights are still gold. ✨
$BTC $ETH $BNB
🔥 Throwback to One of My Most Insightful Crypto Conversations! 🔥
Two years ago, I had the chance to sit down with CZ for a deep dive into the future of Web3, the challenges of global adoption, and the mindset behind building in a fast-moving crypto world.
From discussing Bitcoin’s resilience 🟧, to the rise of BNB 🚀, to exploring how stablecoins would reshape global finance 💴 → it was one of those conversations that sticks with you long after the cameras stop rolling.
If you missed it back then, now’s the perfect time to revisit it— the insights are still gold. ✨
$BTC $ETH $BNB
Two years ago, I had the chance to sit down with CZ for a deep dive into the future of Web3, the challenges of global adoption, and the mindset behind building in a fast-moving crypto world.
From discussing Bitcoin’s resilience 🟧, to the rise of BNB 🚀, to exploring how stablecoins would reshape global finance 💴 → it was one of those conversations that sticks with you long after the cameras stop rolling.
If you missed it back then, now’s the perfect time to revisit it— the insights are still gold. ✨
$BTC $ETH $BNB
26
18
159
51.5k
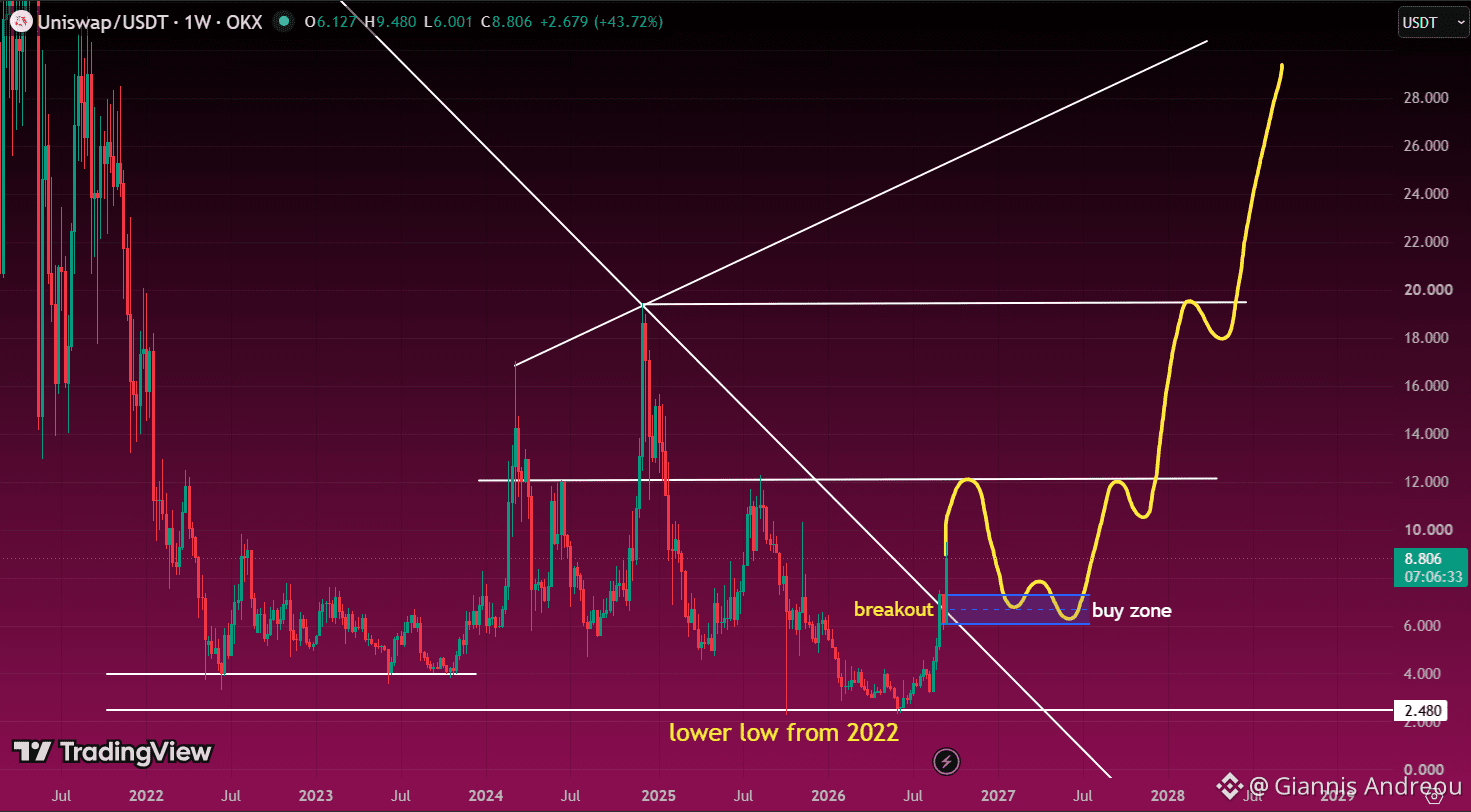
🦄 $UNI FINALLY BROKE THE LONG-TERM DOWNTREND
$UNI has now broken above the major descending trendline that has controlled price for years.
That is the first real positive change in structure.
But the macro chart is still not perfect.
$UNI already made a lower low below the 2022 bottom, so I still want to stay careful with the bigger picture.
For me, the most interesting area is the $6–$7 zone.
If price comes back, retests that breakout area, and holds it as support, that could become a very interesting buy zone.
And be careful tomorrow during the U.S. session.
With the current volatility, I would not be surprised if $UNI moves straight into that buy zone before giving us any clean setup.
From there, the first major target is around $12.
If $UNI reclaims that level, the next bigger resistance sits around $19–$20.
And if the structure keeps improving after that, the chart could eventually open toward the $30 area.
So the roadmap is simple.
Breakout happened.
Now I want the retest to hold.
Then $12 becomes the first real test, followed by $19–$20.
Nothing is guaranteed. This is simply the higher-probability scenario I see from the technical setup, not a recommendation to buy $UNI. Always do your own research.
🦄 $UNI FINALLY BROKE THE LONG-TERM DOWNTREND
$UNI has now broken above the major descending trendline that has controlled price for years.
That is the first real positive change in structure.
But the macro chart is still not perfect.
$UNI already made a lower low below the 2022 bottom, so I still want to stay careful with the bigger picture.
For me, the most interesting area is the $6–$7 zone.
If price comes back, retests that breakout area, and holds it as support, that could become a very interesting buy zone.
And be careful tomorrow during the U.S. session.
With the current volatility, I would not be surprised if $UNI moves straight into that buy zone before giving us any clean setup.
From there, the first major target is around $12.
If $UNI reclaims that level, the next bigger resistance sits around $19–$20.
And if the structure keeps improving after that, the chart could eventually open toward the $30 area.
So the roadmap is simple.
Breakout happened.
Now I want the retest to hold.
Then $12 becomes the first real test, followed by $19–$20.
Nothing is guaranteed. This is simply the higher-probability scenario I see from the technical setup, not a recommendation to buy $UNI. Always do your own research.
$UNI has now broken above the major descending trendline that has controlled price for years.
That is the first real positive change in structure.
But the macro chart is still not perfect.
$UNI already made a lower low below the 2022 bottom, so I still want to stay careful with the bigger picture.
For me, the most interesting area is the $6–$7 zone.
If price comes back, retests that breakout area, and holds it as support, that could become a very interesting buy zone.
And be careful tomorrow during the U.S. session.
With the current volatility, I would not be surprised if $UNI moves straight into that buy zone before giving us any clean setup.
From there, the first major target is around $12.
If $UNI reclaims that level, the next bigger resistance sits around $19–$20.
And if the structure keeps improving after that, the chart could eventually open toward the $30 area.
So the roadmap is simple.
Breakout happened.
Now I want the retest to hold.
Then $12 becomes the first real test, followed by $19–$20.
Nothing is guaranteed. This is simply the higher-probability scenario I see from the technical setup, not a recommendation to buy $UNI. Always do your own research.
1
426
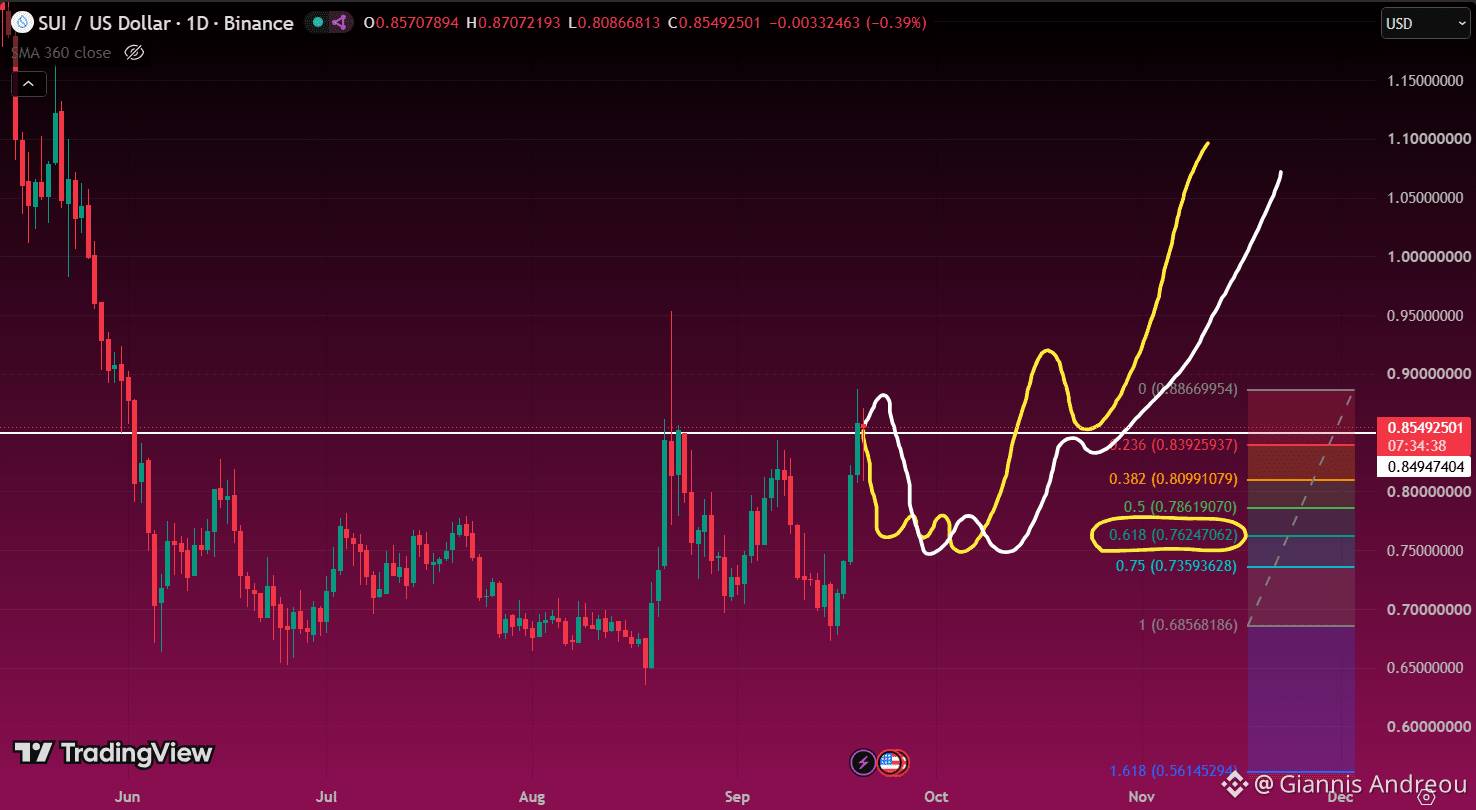
⚠️ $SUI COULD GET VERY VOLATILE DURING THE U.S. SESSION
Tomorrow, I would be very careful with $SUI around the U.S. open.
One scenario I’m watching is a sharp move higher first, potentially squeezing shorts and taking liquidity above the recent highs.
But that does not automatically mean continuation.
If that move gets rejected, $SUI could quickly retrace back into the range.
The main downside level I’m watching is the 0.618 Fib around $0.762.
A move into that area would not necessarily destroy the bullish structure.
If $SUI holds the 0.618, consolidates there, and starts building strength again, it could become a very interesting base for the next move higher.
The bullish alternative is that price holds the current area, pushes through the recent high around $0.887, and starts expanding without the deeper retrace.
So tomorrow, I’m not trying to predict the first move.
I want to let the U.S. session show its hand first.
Sharp pump, rejection, then retrace is possible.
Clean breakout and hold is possible too.
The 0.618 Fib remains the main level of interest for me if price moves lower.
Nothing is guaranteed. This is simply the higher-probability setup I see from the technical picture, not a recommendation to buy or short $SUI. Always do your own research.
⚠️ $SUI COULD GET VERY VOLATILE DURING THE U.S. SESSION
Tomorrow, I would be very careful with $SUI around the U.S. open.
One scenario I’m watching is a sharp move higher first, potentially squeezing shorts and taking liquidity above the recent highs.
But that does not automatically mean continuation.
If that move gets rejected, $SUI could quickly retrace back into the range.
The main downside level I’m watching is the 0.618 Fib around $0.762.
A move into that area would not necessarily destroy the bullish structure.
If $SUI holds the 0.618, consolidates there, and starts building strength again, it could become a very interesting base for the next move higher.
The bullish alternative is that price holds the current area, pushes through the recent high around $0.887, and starts expanding without the deeper retrace.
So tomorrow, I’m not trying to predict the first move.
I want to let the U.S. session show its hand first.
Sharp pump, rejection, then retrace is possible.
Clean breakout and hold is possible too.
The 0.618 Fib remains the main level of interest for me if price moves lower.
Nothing is guaranteed. This is simply the higher-probability setup I see from the technical picture, not a recommendation to buy or short $SUI. Always do your own research.
Tomorrow, I would be very careful with $SUI around the U.S. open.
One scenario I’m watching is a sharp move higher first, potentially squeezing shorts and taking liquidity above the recent highs.
But that does not automatically mean continuation.
If that move gets rejected, $SUI could quickly retrace back into the range.
The main downside level I’m watching is the 0.618 Fib around $0.762.
A move into that area would not necessarily destroy the bullish structure.
If $SUI holds the 0.618, consolidates there, and starts building strength again, it could become a very interesting base for the next move higher.
The bullish alternative is that price holds the current area, pushes through the recent high around $0.887, and starts expanding without the deeper retrace.
So tomorrow, I’m not trying to predict the first move.
I want to let the U.S. session show its hand first.
Sharp pump, rejection, then retrace is possible.
Clean breakout and hold is possible too.
The 0.618 Fib remains the main level of interest for me if price moves lower.
Nothing is guaranteed. This is simply the higher-probability setup I see from the technical picture, not a recommendation to buy or short $SUI. Always do your own research.
1
1.4k
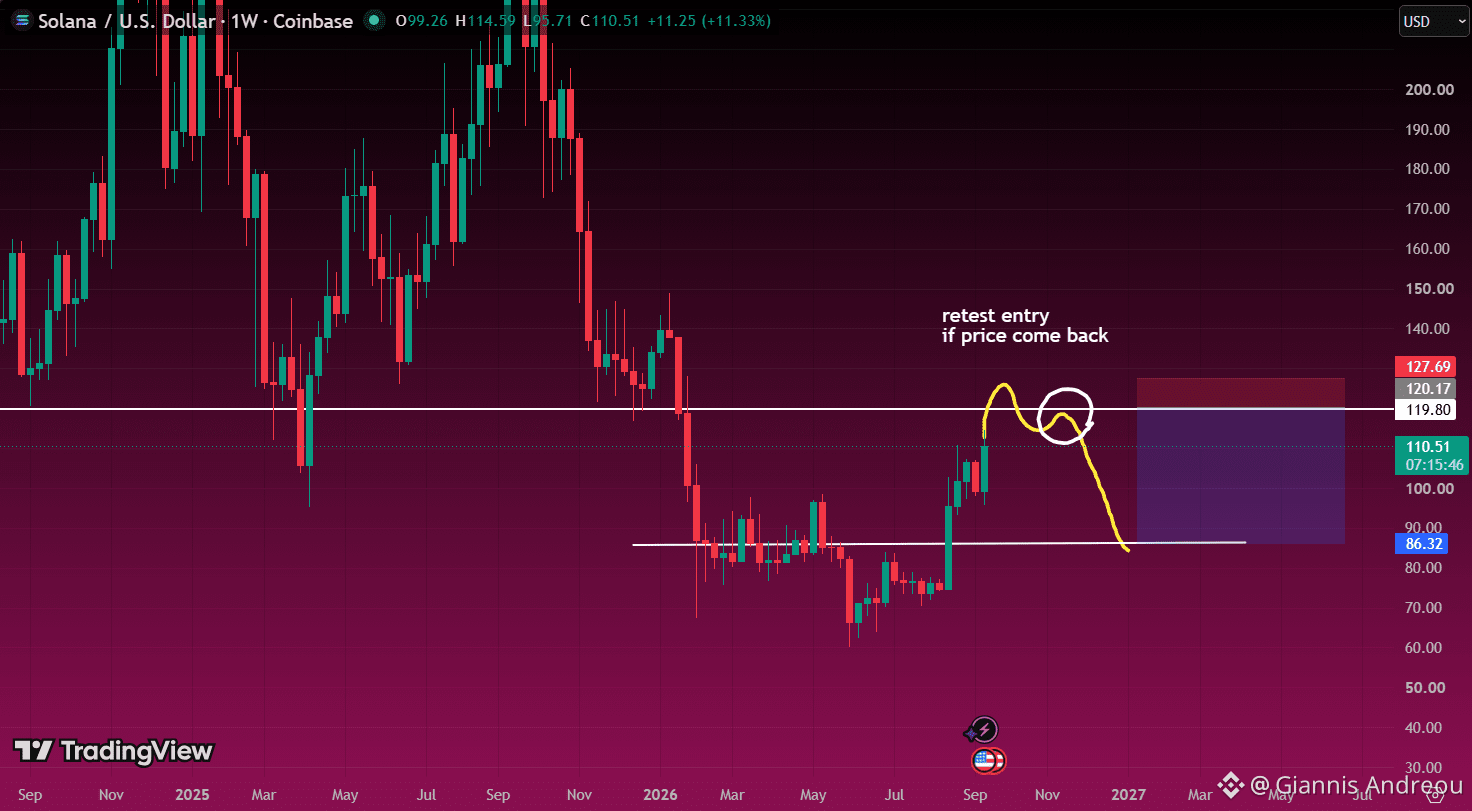
🎯 $SOL SHORT SETUP I’M WATCHING FOR THE U.S. OPEN
Tomorrow, I’m watching the $119–$120 resistance very closely.
One scenario I want to see is $SOL pushing above that level first and taking liquidity.
Then comes the important part.
If price fails to hold the breakout, moves back below resistance, and then retests the level from underneath, that is where I would consider the short.
The stop would sit slightly above the wick created by the liquidity sweep.
My main downside target would be the previous major support area around $86.
The macro backdrop still looks fragile, so I don’t want to chase this move higher blindly.
But I also wouldn’t short before confirmation.
First the breakout.
Then the failure.
Then the retest.
That is the setup.
Nothing is guaranteed. This is simply the trading scenario I’m watching based on the technical picture, not a recommendation to short $SOL. Always do your own research.
🎯 $SOL SHORT SETUP I’M WATCHING FOR THE U.S. OPEN
Tomorrow, I’m watching the $119–$120 resistance very closely.
One scenario I want to see is $SOL pushing above that level first and taking liquidity.
Then comes the important part.
If price fails to hold the breakout, moves back below resistance, and then retests the level from underneath, that is where I would consider the short.
The stop would sit slightly above the wick created by the liquidity sweep.
My main downside target would be the previous major support area around $86.
The macro backdrop still looks fragile, so I don’t want to chase this move higher blindly.
But I also wouldn’t short before confirmation.
First the breakout.
Then the failure.
Then the retest.
That is the setup.
Nothing is guaranteed. This is simply the trading scenario I’m watching based on the technical picture, not a recommendation to short $SOL. Always do your own research.
Tomorrow, I’m watching the $119–$120 resistance very closely.
One scenario I want to see is $SOL pushing above that level first and taking liquidity.
Then comes the important part.
If price fails to hold the breakout, moves back below resistance, and then retests the level from underneath, that is where I would consider the short.
The stop would sit slightly above the wick created by the liquidity sweep.
My main downside target would be the previous major support area around $86.
The macro backdrop still looks fragile, so I don’t want to chase this move higher blindly.
But I also wouldn’t short before confirmation.
First the breakout.
Then the failure.
Then the retest.
That is the setup.
Nothing is guaranteed. This is simply the trading scenario I’m watching based on the technical picture, not a recommendation to short $SOL. Always do your own research.
1
760
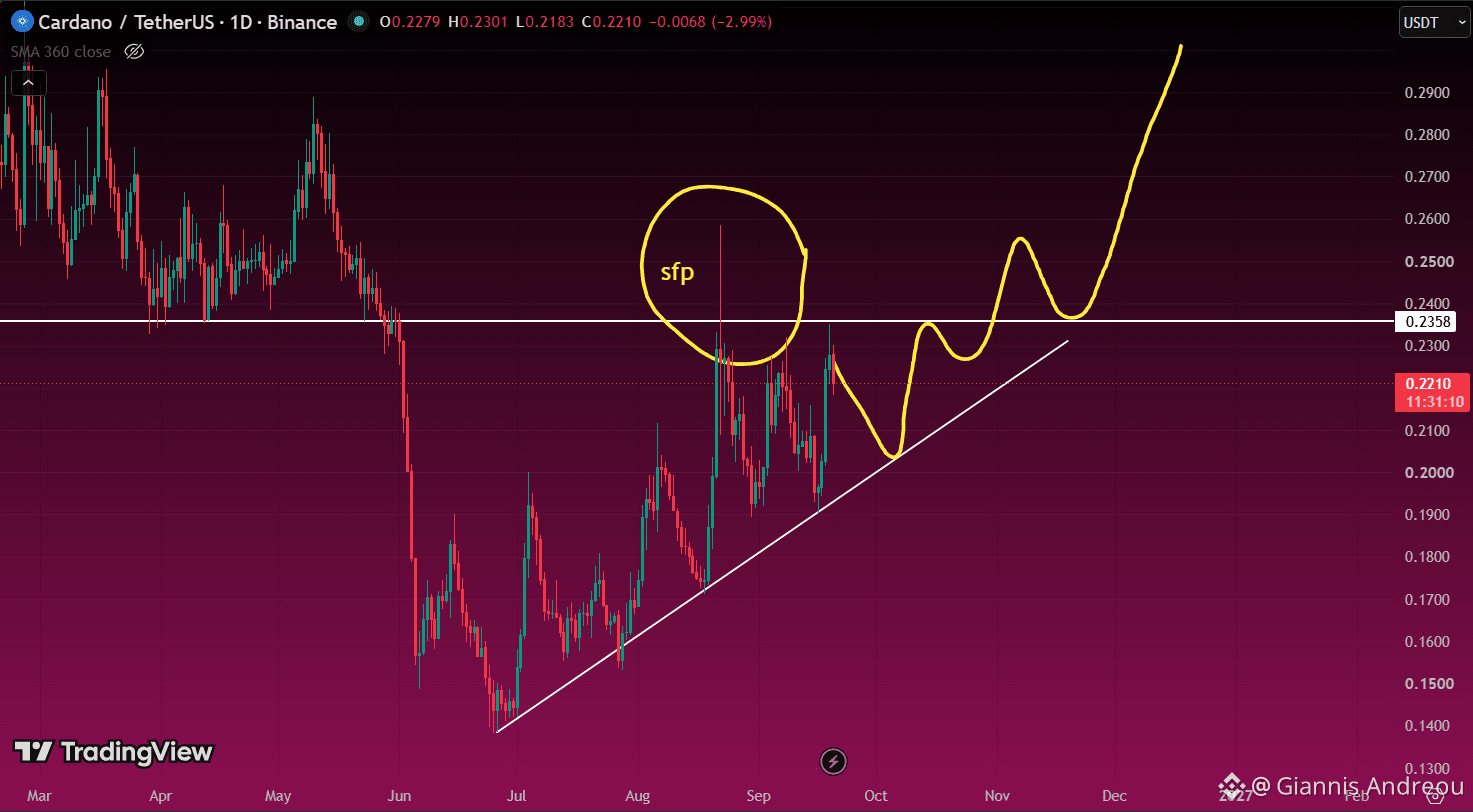
🔵 $ADA STILL NEEDS A REAL BREAKOUT
$ADA has been in an uptrend since the bottom.
So the structure is clearly better than it was a few months ago.
But so far, price tried to break the big resistance and failed.
What we got instead was an SFP.
That matters.
Because until resistance is actually broken, resistance is still resistance.
For me, the real confirmation comes only if $ADA closes a candle above that level.
After that, I want to see the retest.
And I want to see it hold.
If that happens, then I think higher prices become much more likely.
Until then, this is still just an attempt.
And we also should not forget one important thing.
This project made a lower low compared to 2022.
So even if the short term structure looks better, I’d still approach it with caution.
Constructive from the bottom, yes.
Confirmed breakout, not yet.
Not a recommendation to buy or sell $ADA.
Always do your own research.
🔵 $ADA STILL NEEDS A REAL BREAKOUT
$ADA has been in an uptrend since the bottom.
So the structure is clearly better than it was a few months ago.
But so far, price tried to break the big resistance and failed.
What we got instead was an SFP.
That matters.
Because until resistance is actually broken, resistance is still resistance.
For me, the real confirmation comes only if $ADA closes a candle above that level.
After that, I want to see the retest.
And I want to see it hold.
If that happens, then I think higher prices become much more likely.
Until then, this is still just an attempt.
And we also should not forget one important thing.
This project made a lower low compared to 2022.
So even if the short term structure looks better, I’d still approach it with caution.
Constructive from the bottom, yes.
Confirmed breakout, not yet.
Not a recommendation to buy or sell $ADA.
Always do your own research.
$ADA has been in an uptrend since the bottom.
So the structure is clearly better than it was a few months ago.
But so far, price tried to break the big resistance and failed.
What we got instead was an SFP.
That matters.
Because until resistance is actually broken, resistance is still resistance.
For me, the real confirmation comes only if $ADA closes a candle above that level.
After that, I want to see the retest.
And I want to see it hold.
If that happens, then I think higher prices become much more likely.
Until then, this is still just an attempt.
And we also should not forget one important thing.
This project made a lower low compared to 2022.
So even if the short term structure looks better, I’d still approach it with caution.
Constructive from the bottom, yes.
Confirmed breakout, not yet.
Not a recommendation to buy or sell $ADA.
Always do your own research.
1
845
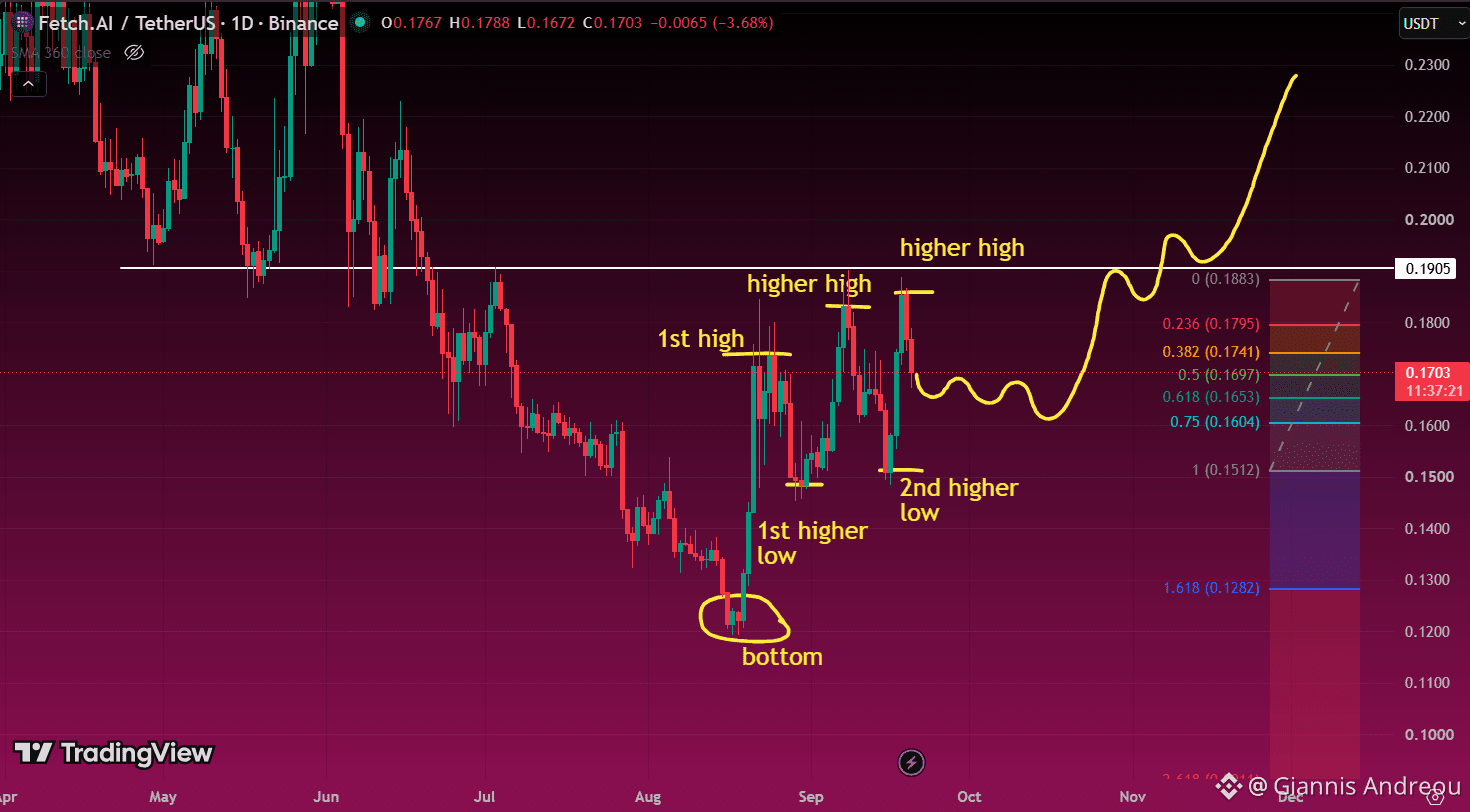
🤖 $FET STILL LOOKS CONSTRUCTIVE
A lot of people are looking at the daily and calling this a head and shoulders.
I’m not.
What I see since the bottom is a change in structure.
We already got higher highs after the low.
And more importantly, we also got higher lows.
That is not what I want to see from a chart that is supposedly about to completely roll over.
For me, a pullback from here would be normal.
The level I’m watching is the 0.618 fib around $0.165.
If $FET pulls back there, holds it, and starts consolidating, that would still look healthy.
In that case, I’d expect price to try attacking the big resistance again around $0.19.
So yes, short term we may see a correction.
But as long as the 0.618 holds, I still think the structure stays constructive.
The real invalidation for this bullish idea is if the pullback comes and price loses that zone cleanly.
Until then, I’m not treating this as a bearish disaster.
I’m treating it as a chart trying to build before another resistance test.
Not a recommendation to buy or sell $FET.
Always do your own research.
🤖 $FET STILL LOOKS CONSTRUCTIVE
A lot of people are looking at the daily and calling this a head and shoulders.
I’m not.
What I see since the bottom is a change in structure.
We already got higher highs after the low.
And more importantly, we also got higher lows.
That is not what I want to see from a chart that is supposedly about to completely roll over.
For me, a pullback from here would be normal.
The level I’m watching is the 0.618 fib around $0.165.
If $FET pulls back there, holds it, and starts consolidating, that would still look healthy.
In that case, I’d expect price to try attacking the big resistance again around $0.19.
So yes, short term we may see a correction.
But as long as the 0.618 holds, I still think the structure stays constructive.
The real invalidation for this bullish idea is if the pullback comes and price loses that zone cleanly.
Until then, I’m not treating this as a bearish disaster.
I’m treating it as a chart trying to build before another resistance test.
Not a recommendation to buy or sell $FET.
Always do your own research.
A lot of people are looking at the daily and calling this a head and shoulders.
I’m not.
What I see since the bottom is a change in structure.
We already got higher highs after the low.
And more importantly, we also got higher lows.
That is not what I want to see from a chart that is supposedly about to completely roll over.
For me, a pullback from here would be normal.
The level I’m watching is the 0.618 fib around $0.165.
If $FET pulls back there, holds it, and starts consolidating, that would still look healthy.
In that case, I’d expect price to try attacking the big resistance again around $0.19.
So yes, short term we may see a correction.
But as long as the 0.618 holds, I still think the structure stays constructive.
The real invalidation for this bullish idea is if the pullback comes and price loses that zone cleanly.
Until then, I’m not treating this as a bearish disaster.
I’m treating it as a chart trying to build before another resistance test.
Not a recommendation to buy or sell $FET.
Always do your own research.
1.1k
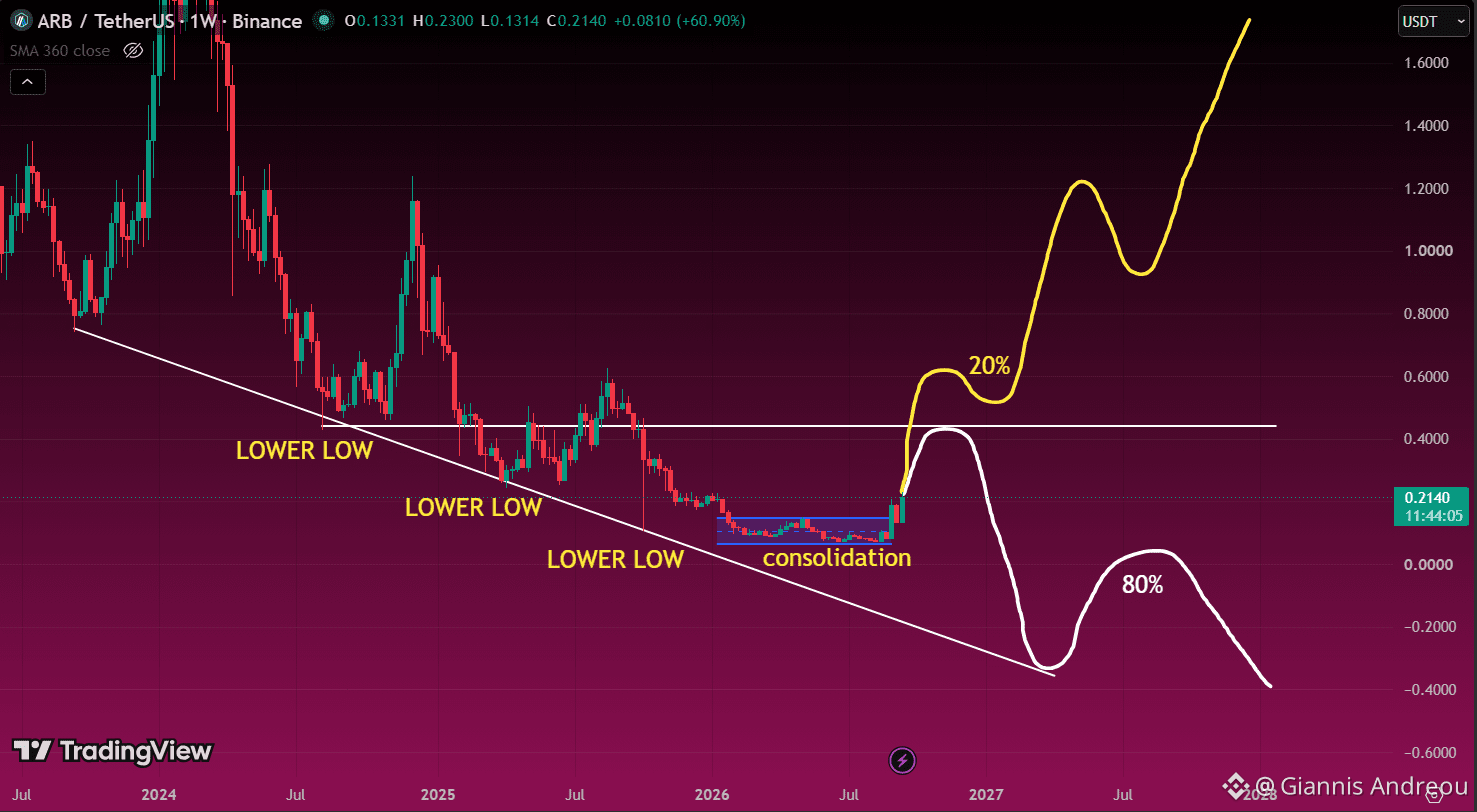
👑 $ARB: THE KING OF LOWER LOWS
$ARB has spent the entire macro trend printing lower low after lower low.
That is still the main story on this chart.
Price did finally break out of the recent consolidation range, which is the first positive sign we have seen in a while.
But one breakout does not repair years of weakness.
In my view, there are 2 scenarios from here.
Bullish scenario, around 20%: $ARB keeps holding above the breakout, reclaims the major resistance around $0.45, and starts building a real higher-high structure.
If that happens, the chart could eventually open toward $1.20 and higher.
Bearish scenario, around 80%: this move becomes another temporary bounce, price fails around the major resistance zones, and the macro downtrend eventually continues with another lower low.
For me, the key is simple.
Until $ARB stops printing lower lows and starts building higher lows, I stay cautious.
Nothing is guaranteed. This is simply the higher-probability scenario I see from the technical setup, not a recommendation to buy or short $ARB. Always do your own research.
👑 $ARB: THE KING OF LOWER LOWS
$ARB has spent the entire macro trend printing lower low after lower low.
That is still the main story on this chart.
Price did finally break out of the recent consolidation range, which is the first positive sign we have seen in a while.
But one breakout does not repair years of weakness.
In my view, there are 2 scenarios from here.
Bullish scenario, around 20%: $ARB keeps holding above the breakout, reclaims the major resistance around $0.45, and starts building a real higher-high structure.
If that happens, the chart could eventually open toward $1.20 and higher.
Bearish scenario, around 80%: this move becomes another temporary bounce, price fails around the major resistance zones, and the macro downtrend eventually continues with another lower low.
For me, the key is simple.
Until $ARB stops printing lower lows and starts building higher lows, I stay cautious.
Nothing is guaranteed. This is simply the higher-probability scenario I see from the technical setup, not a recommendation to buy or short $ARB. Always do your own research.
$ARB has spent the entire macro trend printing lower low after lower low.
That is still the main story on this chart.
Price did finally break out of the recent consolidation range, which is the first positive sign we have seen in a while.
But one breakout does not repair years of weakness.
In my view, there are 2 scenarios from here.
Bullish scenario, around 20%: $ARB keeps holding above the breakout, reclaims the major resistance around $0.45, and starts building a real higher-high structure.
If that happens, the chart could eventually open toward $1.20 and higher.
Bearish scenario, around 80%: this move becomes another temporary bounce, price fails around the major resistance zones, and the macro downtrend eventually continues with another lower low.
For me, the key is simple.
Until $ARB stops printing lower lows and starts building higher lows, I stay cautious.
Nothing is guaranteed. This is simply the higher-probability scenario I see from the technical setup, not a recommendation to buy or short $ARB. Always do your own research.
1
2.3k
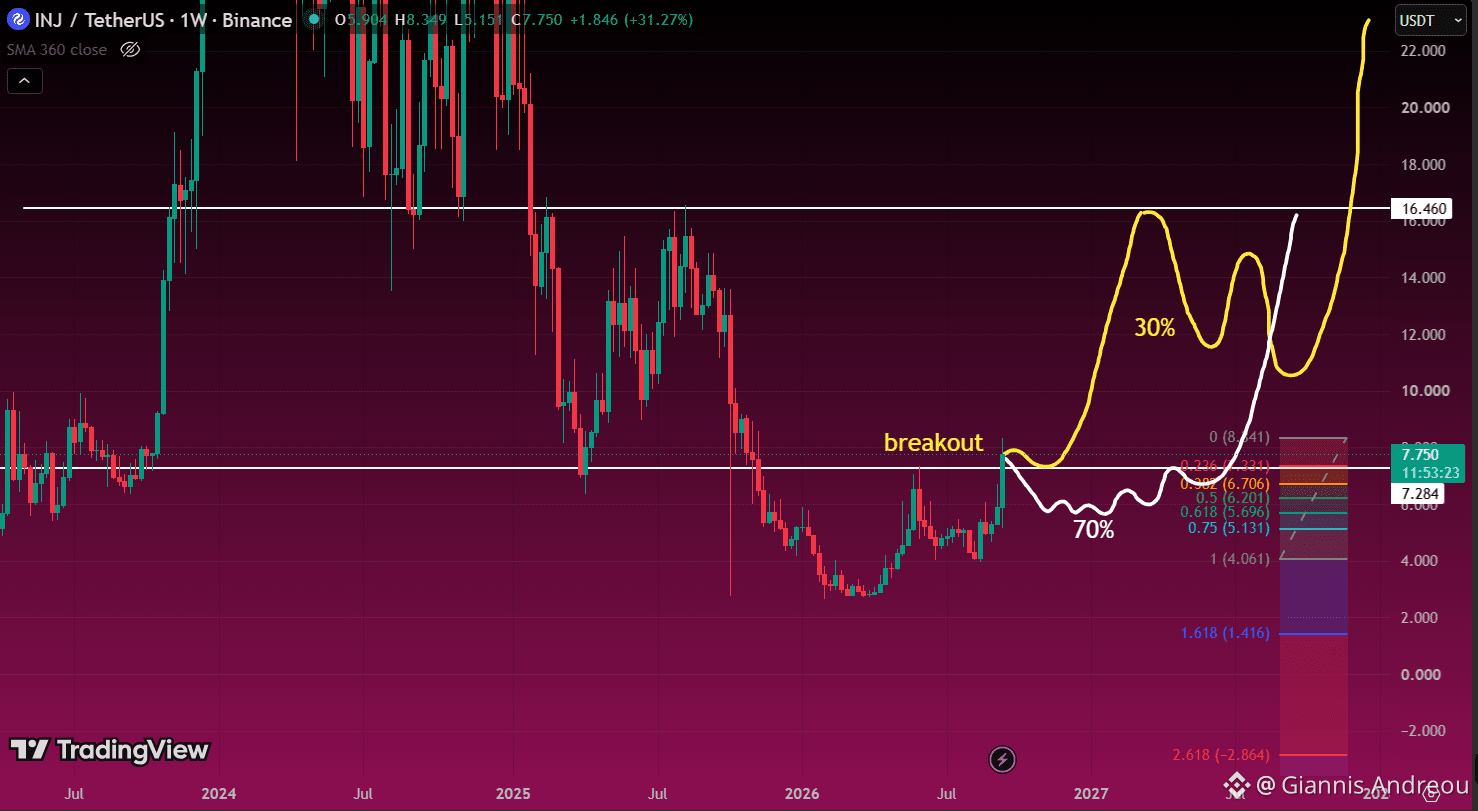
🚀 $INJ IS TRYING TO CONFIRM A MAJOR WEEKLY BREAKOUT
$INJ has finally pushed above the big weekly resistance around $7.28.
Now the important part is the weekly close.
If price closes and holds above this level, the breakout becomes much stronger and the bullish scenario stays alive.
But if this turns into an SFP and $INJ closes back below resistance, I’d expect a deeper reset first.
The main area I’m watching is the 0.618 Fib around $5.70.
A pullback into that zone, followed by consolidation, would be completely healthy in my view.
From there, $INJ could build a stronger base before trying to move higher again.
So for me, the roadmap is simple.
Weekly close above resistance = continuation scenario.
SFP back below = likely retrace toward $5.70 first, then reassess.
Nothing is guaranteed. This is simply the higher-probability scenario I see from the technical setup, not a recommendation to buy or short $INJ. Always do your own research.
🚀 $INJ IS TRYING TO CONFIRM A MAJOR WEEKLY BREAKOUT
$INJ has finally pushed above the big weekly resistance around $7.28.
Now the important part is the weekly close.
If price closes and holds above this level, the breakout becomes much stronger and the bullish scenario stays alive.
But if this turns into an SFP and $INJ closes back below resistance, I’d expect a deeper reset first.
The main area I’m watching is the 0.618 Fib around $5.70.
A pullback into that zone, followed by consolidation, would be completely healthy in my view.
From there, $INJ could build a stronger base before trying to move higher again.
So for me, the roadmap is simple.
Weekly close above resistance = continuation scenario.
SFP back below = likely retrace toward $5.70 first, then reassess.
Nothing is guaranteed. This is simply the higher-probability scenario I see from the technical setup, not a recommendation to buy or short $INJ. Always do your own research.
$INJ has finally pushed above the big weekly resistance around $7.28.
Now the important part is the weekly close.
If price closes and holds above this level, the breakout becomes much stronger and the bullish scenario stays alive.
But if this turns into an SFP and $INJ closes back below resistance, I’d expect a deeper reset first.
The main area I’m watching is the 0.618 Fib around $5.70.
A pullback into that zone, followed by consolidation, would be completely healthy in my view.
From there, $INJ could build a stronger base before trying to move higher again.
So for me, the roadmap is simple.
Weekly close above resistance = continuation scenario.
SFP back below = likely retrace toward $5.70 first, then reassess.
Nothing is guaranteed. This is simply the higher-probability scenario I see from the technical setup, not a recommendation to buy or short $INJ. Always do your own research.
2
6
1.5k
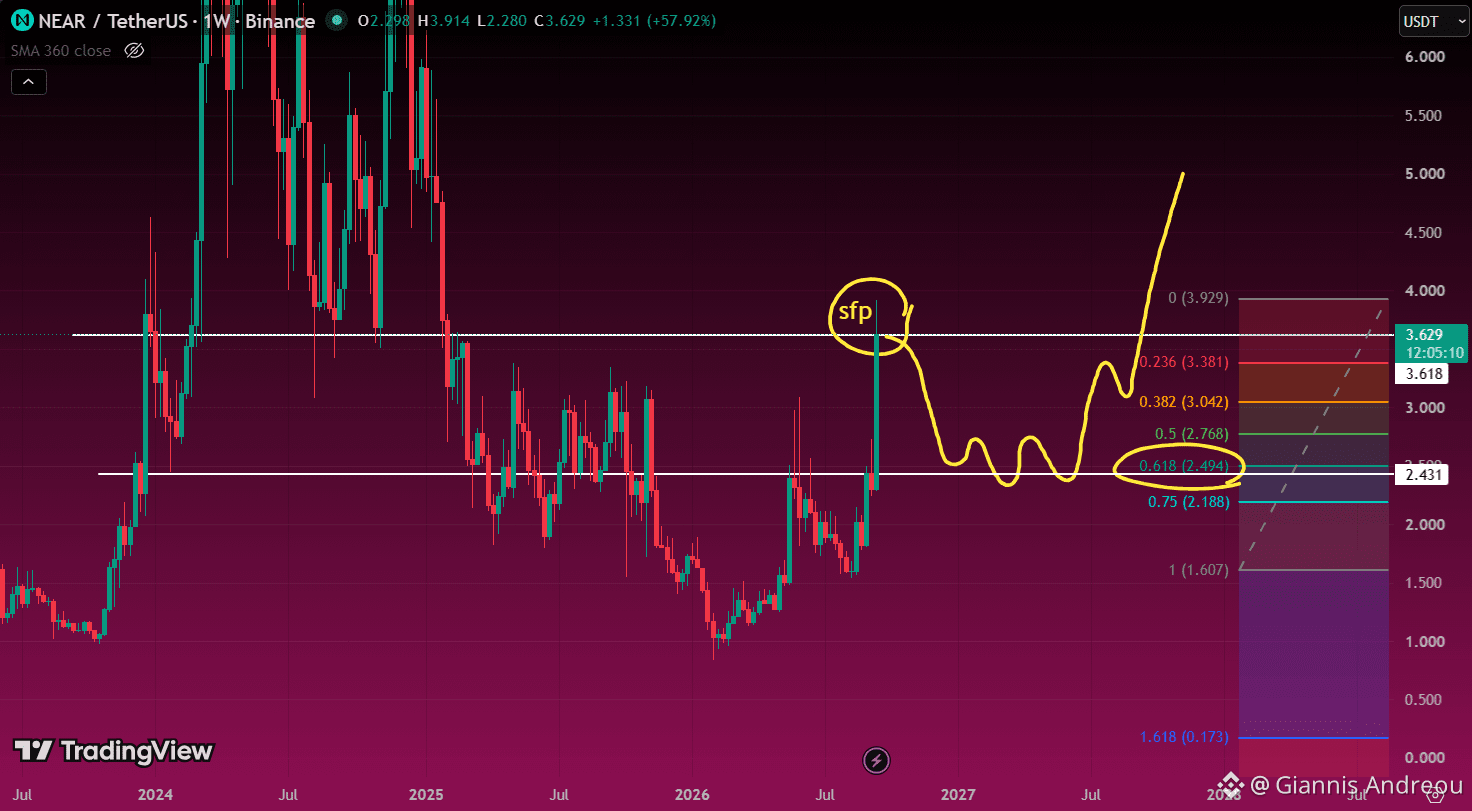
🟢 $NEAR JUST PRINTED AN SFP AT MAJOR RESISTANCE
$NEAR pushed above the big $3.65 resistance
but got sold back down fast.
So for now, this looks more like an SFP
than a clean breakout.
That matters.
If the weekly candle does not close above that level,
then resistance is still resistance.
And honestly,
a pullback from here would be healthy.
The level I’m watching is the 0.618 fib around $2.49.
If price pulls back there,
holds it,
and starts consolidating,
that could build the base for the next move.
Then the goal becomes simple:
make a higher high
and come back to break $3.65 properly.
So short term,
rejection.
But medium term,
still constructive if $NEAR can reset correctly.
Not a recommendation to buy or sell $NEAR. Always do your own research.
🟢 $NEAR JUST PRINTED AN SFP AT MAJOR RESISTANCE
$NEAR pushed above the big $3.65 resistance
but got sold back down fast.
So for now, this looks more like an SFP
than a clean breakout.
That matters.
If the weekly candle does not close above that level,
then resistance is still resistance.
And honestly,
a pullback from here would be healthy.
The level I’m watching is the 0.618 fib around $2.49.
If price pulls back there,
holds it,
and starts consolidating,
that could build the base for the next move.
Then the goal becomes simple:
make a higher high
and come back to break $3.65 properly.
So short term,
rejection.
But medium term,
still constructive if $NEAR can reset correctly.
Not a recommendation to buy or sell $NEAR. Always do your own research.
$NEAR pushed above the big $3.65 resistance
but got sold back down fast.
So for now, this looks more like an SFP
than a clean breakout.
That matters.
If the weekly candle does not close above that level,
then resistance is still resistance.
And honestly,
a pullback from here would be healthy.
The level I’m watching is the 0.618 fib around $2.49.
If price pulls back there,
holds it,
and starts consolidating,
that could build the base for the next move.
Then the goal becomes simple:
make a higher high
and come back to break $3.65 properly.
So short term,
rejection.
But medium term,
still constructive if $NEAR can reset correctly.
Not a recommendation to buy or sell $NEAR. Always do your own research.
1.6k
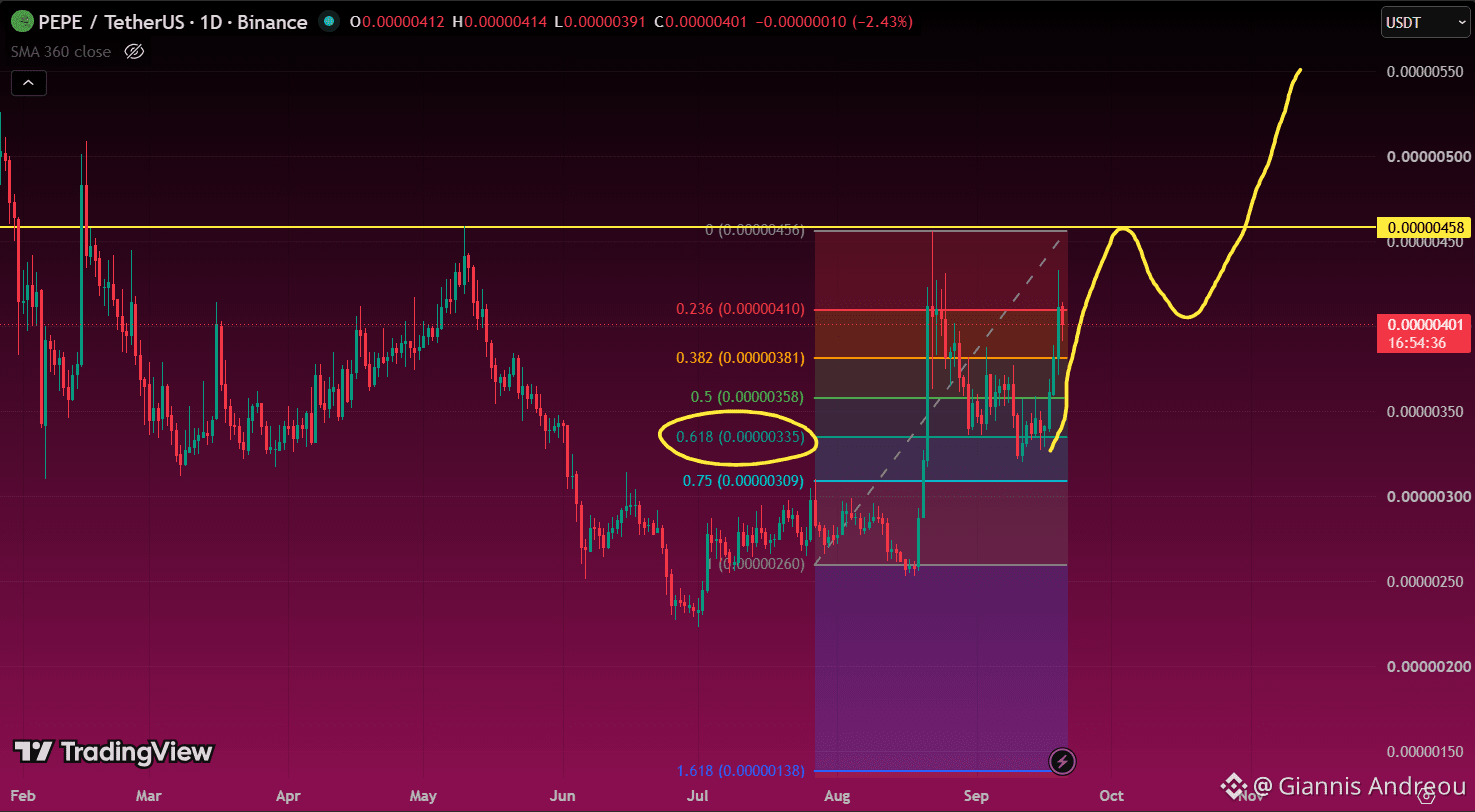
🐸 $PEPE DID EXACTLY WHAT WE WANTED
Yesterday, the key level was the 0.618 Fib around $0.00000335.
$PEPE pulled back into that zone.
Held it.
And now price is pushing higher again.
That matters.
The next level I’m watching is around $0.00000410.
If $PEPE breaks that cleanly, the bigger resistance sits near $0.00000458.
So far the structure is simple:
Strong move.
Healthy 0.618 retrace.
Continuation higher.
If the Fib support keeps holding, I think the probability of another expansion increases.
Nothing is guaranteed. This is simply the higher-probability scenario I see from the technical setup, not a recommendation to buy $PEPE. Always do your own research.
🐸 $PEPE DID EXACTLY WHAT WE WANTED
Yesterday, the key level was the 0.618 Fib around $0.00000335.
$PEPE pulled back into that zone.
Held it.
And now price is pushing higher again.
That matters.
The next level I’m watching is around $0.00000410.
If $PEPE breaks that cleanly, the bigger resistance sits near $0.00000458.
So far the structure is simple:
Strong move.
Healthy 0.618 retrace.
Continuation higher.
If the Fib support keeps holding, I think the probability of another expansion increases.
Nothing is guaranteed. This is simply the higher-probability scenario I see from the technical setup, not a recommendation to buy $PEPE. Always do your own research.
Yesterday, the key level was the 0.618 Fib around $0.00000335.
$PEPE pulled back into that zone.
Held it.
And now price is pushing higher again.
That matters.
The next level I’m watching is around $0.00000410.
If $PEPE breaks that cleanly, the bigger resistance sits near $0.00000458.
So far the structure is simple:
Strong move.
Healthy 0.618 retrace.
Continuation higher.
If the Fib support keeps holding, I think the probability of another expansion increases.
Nothing is guaranteed. This is simply the higher-probability scenario I see from the technical setup, not a recommendation to buy $PEPE. Always do your own research.
2
1.1k
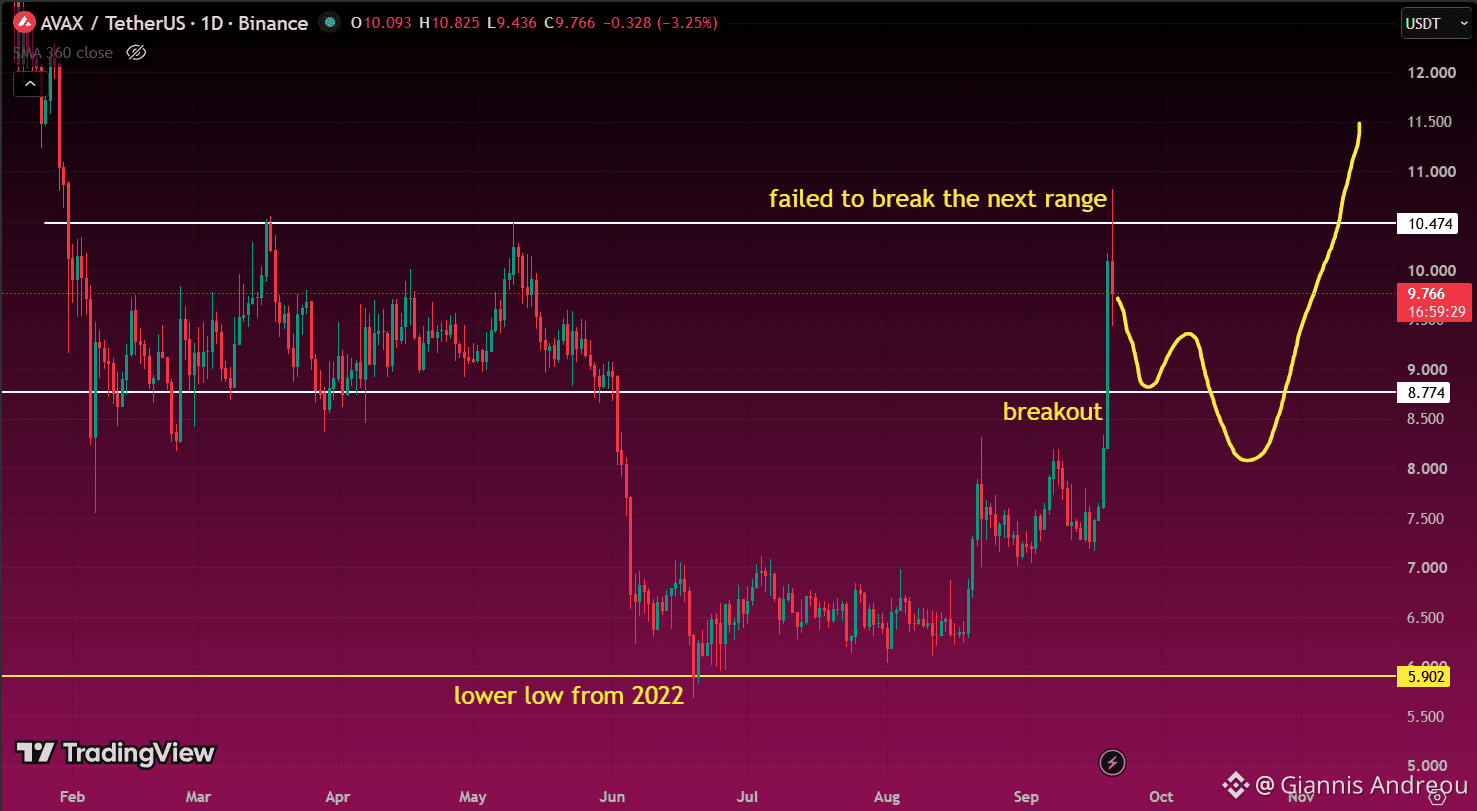
🏔️ $AVAX BROKE OUT, BUT THE REAL TEST IS ABOVE
$AVAX finally broke above the $8.77 range resistance.
That was the first positive step.
But price then failed to break the next major resistance around $10.47.
That matters.
For now, I’m watching for a retest of the $8.77 area.
If that level holds as support, $AVAX gets another chance to attack $10.47.
Break that, and the chart starts opening up toward the $11.5 area and higher.
But the bigger macro picture is still not perfect.
$AVAX already made a lower low below the 2022 bottom around $5.90, so I still want to see stronger structure before getting too bullish.
The roadmap is simple:
Hold $8.77.
Break $10.47.
Then the trend starts looking much healthier.
Nothing is guaranteed. This is simply the higher-probability scenario I see from the technical setup, not a recommendation to buy $AVAX. Always do your own research.
🏔️ $AVAX BROKE OUT, BUT THE REAL TEST IS ABOVE
$AVAX finally broke above the $8.77 range resistance.
That was the first positive step.
But price then failed to break the next major resistance around $10.47.
That matters.
For now, I’m watching for a retest of the $8.77 area.
If that level holds as support, $AVAX gets another chance to attack $10.47.
Break that, and the chart starts opening up toward the $11.5 area and higher.
But the bigger macro picture is still not perfect.
$AVAX already made a lower low below the 2022 bottom around $5.90, so I still want to see stronger structure before getting too bullish.
The roadmap is simple:
Hold $8.77.
Break $10.47.
Then the trend starts looking much healthier.
Nothing is guaranteed. This is simply the higher-probability scenario I see from the technical setup, not a recommendation to buy $AVAX. Always do your own research.
$AVAX finally broke above the $8.77 range resistance.
That was the first positive step.
But price then failed to break the next major resistance around $10.47.
That matters.
For now, I’m watching for a retest of the $8.77 area.
If that level holds as support, $AVAX gets another chance to attack $10.47.
Break that, and the chart starts opening up toward the $11.5 area and higher.
But the bigger macro picture is still not perfect.
$AVAX already made a lower low below the 2022 bottom around $5.90, so I still want to see stronger structure before getting too bullish.
The roadmap is simple:
Hold $8.77.
Break $10.47.
Then the trend starts looking much healthier.
Nothing is guaranteed. This is simply the higher-probability scenario I see from the technical setup, not a recommendation to buy $AVAX. Always do your own research.
807
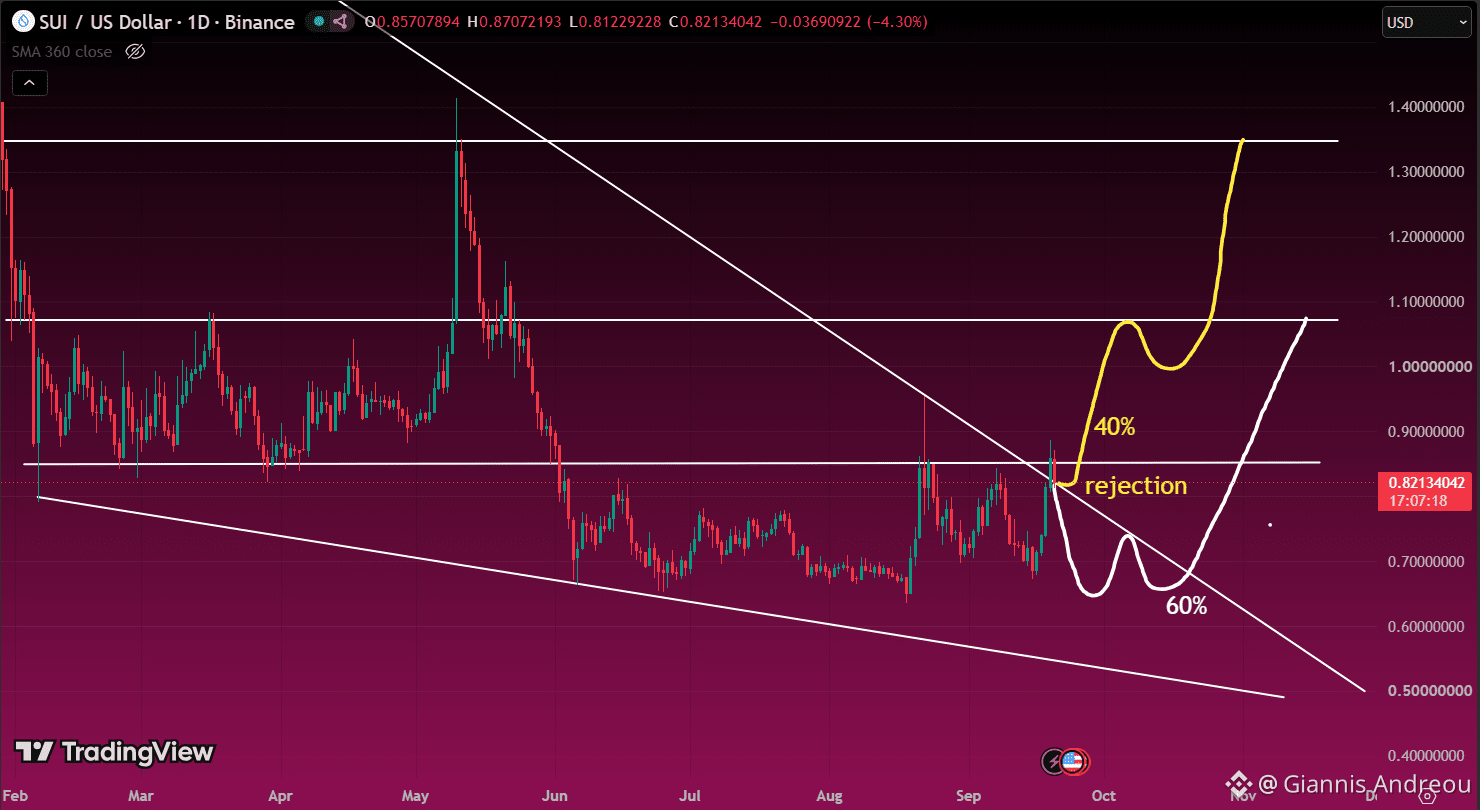
💧 SUI REJECTION OR RESET
$SUI just got rejected at a major resistance.
And this is happening right on the descending trendline of the bigger falling wedge.
That matters.
For me, there are 2 scenarios here.
The first one is the bullish case.
A small retrace, hold above the broken wedge area, and then continuation higher.
That would keep the breakout alive and give $SUI another chance to attack resistance again.
The second scenario is the weaker one, and honestly the more likely one for now.
If price loses this area and slips back inside the triangle, then the breakout starts looking weak.
And if that happens, a deeper retrace becomes much more likely before any real move up.
So the level is simple.
Hold the breakout area, and bulls still have control.
Lose it, and $SUI probably needs more time.
Right now I’d say it looks like a 40% chance for immediate continuation and a 60% chance of dropping back into the triangle first.
This is the decision zone.
Not a recommendation to buy or sell $SUI. Always do your own research.
💧 SUI REJECTION OR RESET
$SUI just got rejected at a major resistance.
And this is happening right on the descending trendline of the bigger falling wedge.
That matters.
For me, there are 2 scenarios here.
The first one is the bullish case.
A small retrace, hold above the broken wedge area, and then continuation higher.
That would keep the breakout alive and give $SUI another chance to attack resistance again.
The second scenario is the weaker one, and honestly the more likely one for now.
If price loses this area and slips back inside the triangle, then the breakout starts looking weak.
And if that happens, a deeper retrace becomes much more likely before any real move up.
So the level is simple.
Hold the breakout area, and bulls still have control.
Lose it, and $SUI probably needs more time.
Right now I’d say it looks like a 40% chance for immediate continuation and a 60% chance of dropping back into the triangle first.
This is the decision zone.
Not a recommendation to buy or sell $SUI. Always do your own research.
$SUI just got rejected at a major resistance.
And this is happening right on the descending trendline of the bigger falling wedge.
That matters.
For me, there are 2 scenarios here.
The first one is the bullish case.
A small retrace, hold above the broken wedge area, and then continuation higher.
That would keep the breakout alive and give $SUI another chance to attack resistance again.
The second scenario is the weaker one, and honestly the more likely one for now.
If price loses this area and slips back inside the triangle, then the breakout starts looking weak.
And if that happens, a deeper retrace becomes much more likely before any real move up.
So the level is simple.
Hold the breakout area, and bulls still have control.
Lose it, and $SUI probably needs more time.
Right now I’d say it looks like a 40% chance for immediate continuation and a 60% chance of dropping back into the triangle first.
This is the decision zone.
Not a recommendation to buy or sell $SUI. Always do your own research.
1.3k
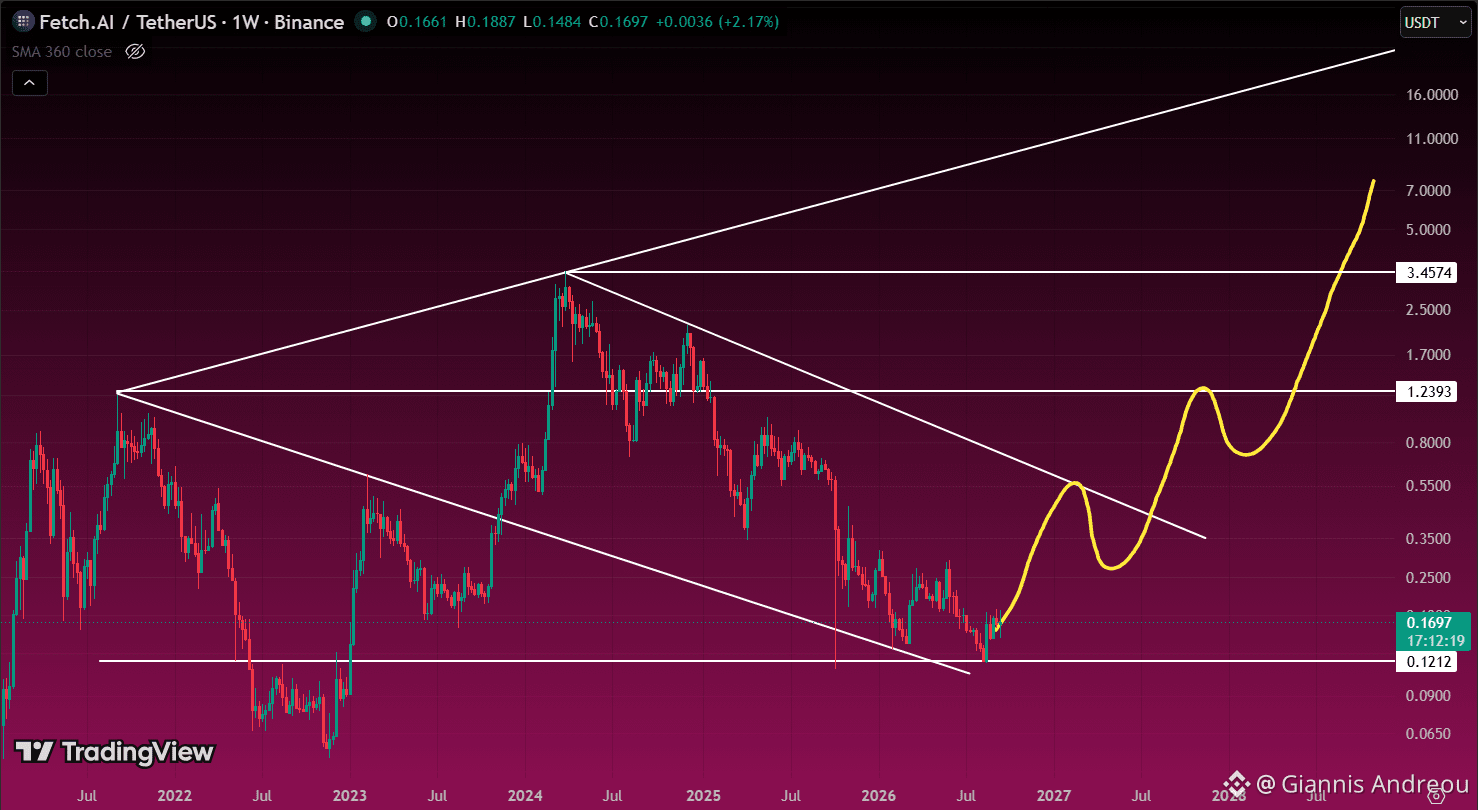
🤖 $FET IS SITTING AT A MAJOR MACRO SUPPORT
$FET is trading near one of the most important areas on the weekly chart.
Price just reacted from the $0.12 support, right where the long-term descending support line also sits.
That matters.
For now, the bigger structure is still trapped below a major descending trendline.
The first real test would be a move toward roughly $0.50–$0.60.
If $FET eventually breaks that trendline and holds above it, the chart starts changing completely.
Then the bigger levels I’m watching are:
$1.24
Then the previous major high around $3.45.
For me, the important thing right now is simple.
Hold the $0.12 area.
Build structure.
Then attack the macro downtrend.
If AI momentum returns strongly next cycle, $FET is still one of the charts I want on my watchlist.
Nothing is guaranteed. This is simply the higher-probability scenario I see from the technical setup, not a recommendation to buy $FET. Always do your own research.
🤖 $FET IS SITTING AT A MAJOR MACRO SUPPORT
$FET is trading near one of the most important areas on the weekly chart.
Price just reacted from the $0.12 support, right where the long-term descending support line also sits.
That matters.
For now, the bigger structure is still trapped below a major descending trendline.
The first real test would be a move toward roughly $0.50–$0.60.
If $FET eventually breaks that trendline and holds above it, the chart starts changing completely.
Then the bigger levels I’m watching are:
$1.24
Then the previous major high around $3.45.
For me, the important thing right now is simple.
Hold the $0.12 area.
Build structure.
Then attack the macro downtrend.
If AI momentum returns strongly next cycle, $FET is still one of the charts I want on my watchlist.
Nothing is guaranteed. This is simply the higher-probability scenario I see from the technical setup, not a recommendation to buy $FET. Always do your own research.
$FET is trading near one of the most important areas on the weekly chart.
Price just reacted from the $0.12 support, right where the long-term descending support line also sits.
That matters.
For now, the bigger structure is still trapped below a major descending trendline.
The first real test would be a move toward roughly $0.50–$0.60.
If $FET eventually breaks that trendline and holds above it, the chart starts changing completely.
Then the bigger levels I’m watching are:
$1.24
Then the previous major high around $3.45.
For me, the important thing right now is simple.
Hold the $0.12 area.
Build structure.
Then attack the macro downtrend.
If AI momentum returns strongly next cycle, $FET is still one of the charts I want on my watchlist.
Nothing is guaranteed. This is simply the higher-probability scenario I see from the technical setup, not a recommendation to buy $FET. Always do your own research.
2
1.1k
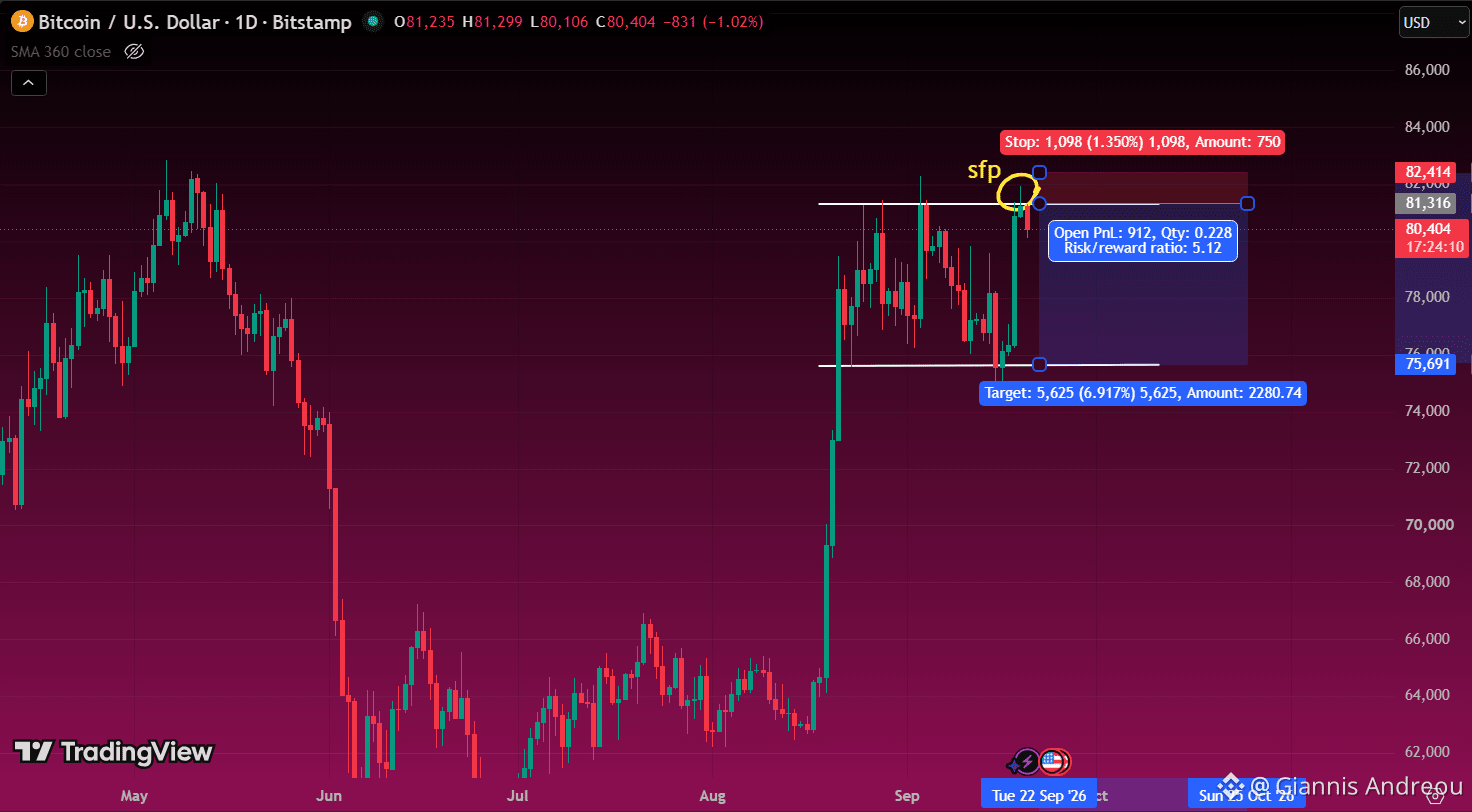
🎯 $BTC SHORT SETUP TRIGGERED
As we discussed on Friday and Saturday, the plan was simple.
Wait for the daily close.
If $BTC swept above the range and then closed back inside, I would look for the short.
That is exactly what happened.
$BTC printed an SFP, failed to hold the breakout, and moved back inside the range.
So I carefully entered the short.
Entry: around $81.3K
Stop: around $82.4K
Target: around $75.7K
Risk/reward: roughly 5:1
The macro backdrop still doesn’t look great either, which adds another reason for caution.
If price completes around half of the move, I’ll move the stop loss to entry.
From there, the trade can run without adding unnecessary risk.
Nothing is guaranteed. This is simply the setup I’m trading based on the technical picture, not a recommendation to short $BTC. Always do your own research.
🎯 $BTC SHORT SETUP TRIGGERED
As we discussed on Friday and Saturday, the plan was simple.
Wait for the daily close.
If $BTC swept above the range and then closed back inside, I would look for the short.
That is exactly what happened.
$BTC printed an SFP, failed to hold the breakout, and moved back inside the range.
So I carefully entered the short.
Entry: around $81.3K
Stop: around $82.4K
Target: around $75.7K
Risk/reward: roughly 5:1
The macro backdrop still doesn’t look great either, which adds another reason for caution.
If price completes around half of the move, I’ll move the stop loss to entry.
From there, the trade can run without adding unnecessary risk.
Nothing is guaranteed. This is simply the setup I’m trading based on the technical picture, not a recommendation to short $BTC. Always do your own research.
As we discussed on Friday and Saturday, the plan was simple.
Wait for the daily close.
If $BTC swept above the range and then closed back inside, I would look for the short.
That is exactly what happened.
$BTC printed an SFP, failed to hold the breakout, and moved back inside the range.
So I carefully entered the short.
Entry: around $81.3K
Stop: around $82.4K
Target: around $75.7K
Risk/reward: roughly 5:1
The macro backdrop still doesn’t look great either, which adds another reason for caution.
If price completes around half of the move, I’ll move the stop loss to entry.
From there, the trade can run without adding unnecessary risk.
Nothing is guaranteed. This is simply the setup I’m trading based on the technical picture, not a recommendation to short $BTC. Always do your own research.
251
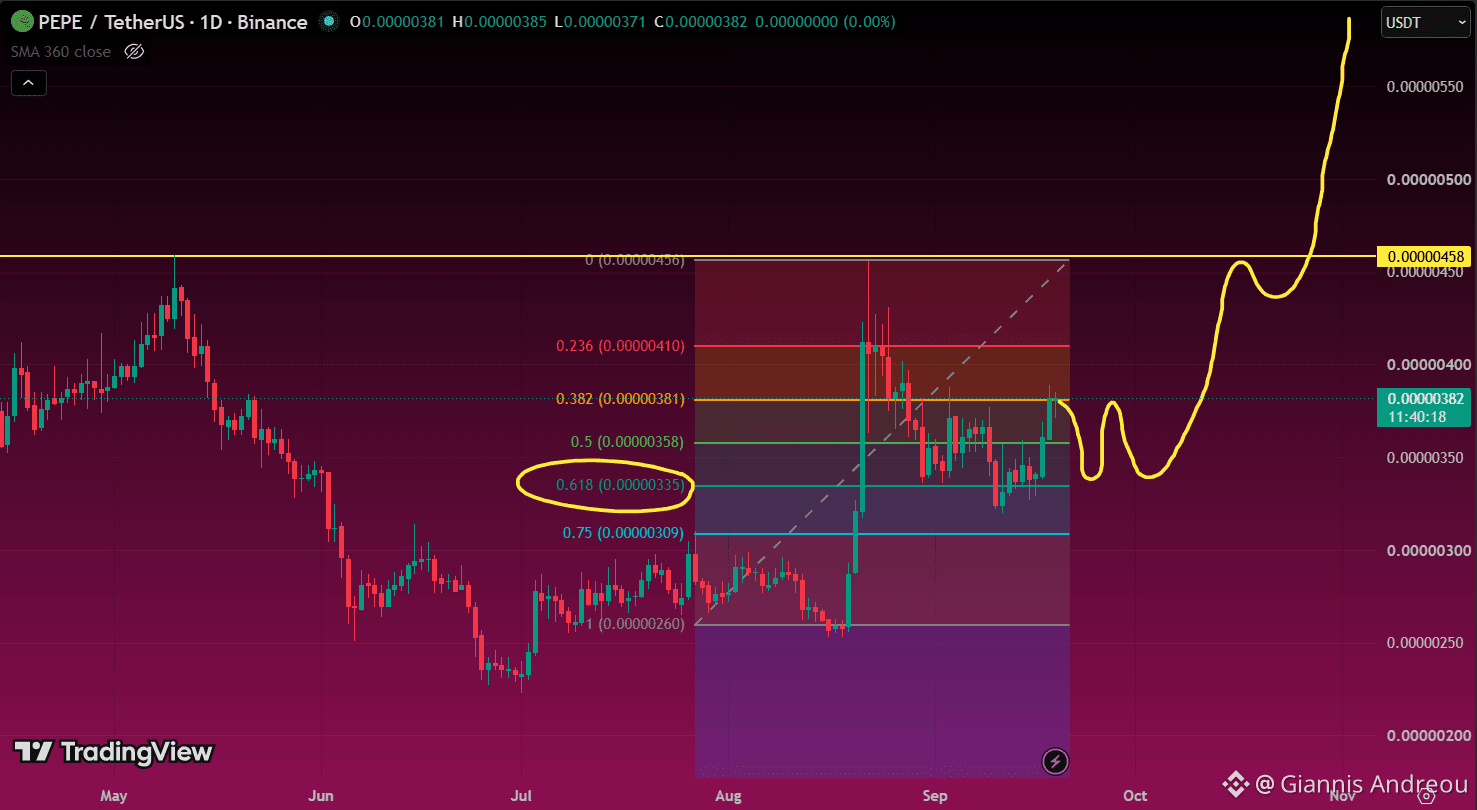
🐸 $PEPE JUST PULLED BACK INTO THE ZONE I WANTED
After a move of roughly 70%, $PEPE finally cooled off.
And look where price came back.
Right into the 0.618 Fib area around $0.00000335.
That matters.
This is one of the most common retracement zones after a strong move.
Now I want to see $PEPE do one thing:
Hold this area and start consolidating.
If that happens, I think the probability of another expansion higher increases.
The next levels I’m watching are around:
$0.00000381 → $0.00000410 → $0.00000458
Strong move.
Healthy pullback.
Now we see if buyers defend the zone.
Nothing is guaranteed. This is simply the higher-probability scenario I see from the technical setup, not a recommendation to buy $PEPE. Always do your own research.
🐸 $PEPE JUST PULLED BACK INTO THE ZONE I WANTED
After a move of roughly 70%, $PEPE finally cooled off.
And look where price came back.
Right into the 0.618 Fib area around $0.00000335.
That matters.
This is one of the most common retracement zones after a strong move.
Now I want to see $PEPE do one thing:
Hold this area and start consolidating.
If that happens, I think the probability of another expansion higher increases.
The next levels I’m watching are around:
$0.00000381 → $0.00000410 → $0.00000458
Strong move.
Healthy pullback.
Now we see if buyers defend the zone.
Nothing is guaranteed. This is simply the higher-probability scenario I see from the technical setup, not a recommendation to buy $PEPE. Always do your own research.
After a move of roughly 70%, $PEPE finally cooled off.
And look where price came back.
Right into the 0.618 Fib area around $0.00000335.
That matters.
This is one of the most common retracement zones after a strong move.
Now I want to see $PEPE do one thing:
Hold this area and start consolidating.
If that happens, I think the probability of another expansion higher increases.
The next levels I’m watching are around:
$0.00000381 → $0.00000410 → $0.00000458
Strong move.
Healthy pullback.
Now we see if buyers defend the zone.
Nothing is guaranteed. This is simply the higher-probability scenario I see from the technical setup, not a recommendation to buy $PEPE. Always do your own research.
8
2.2k
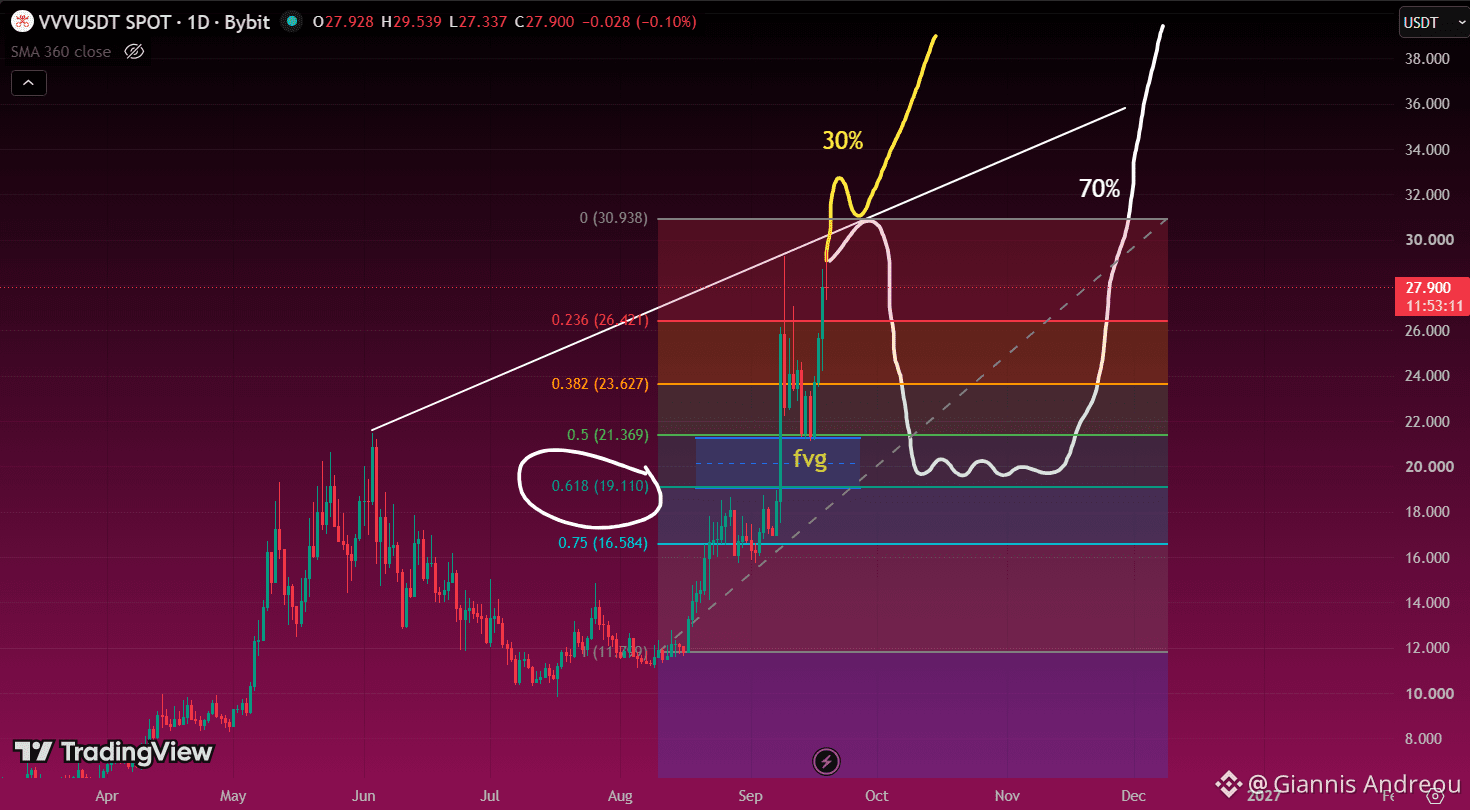
📊 $VVV HAS 2 CLEAR SCENARIOS HERE
$VVV is sitting at a very important area right now.
The chart has a clear trendline, a visible FVG below, and the fib levels are giving us the map.
Right now price is pushing near the upper part of the range, but I think there are 2 main paths from here.
The first scenario is the bullish one.
If $VVV holds strength and keeps accepting above this area, then a move toward the top of the range around 30.9 looks possible.
If that level breaks cleanly, continuation higher can come fast, especially if the trendline keeps acting as support.
That is the lower probability scenario for me right now, around 30%.
The second scenario is the one I respect more.
Price could sweep a bit higher or stall here, and then come back down to fill the FVG.
That sends $VVV back into the 21.3 to 19.1 zone, which is also where the 0.5 and 0.618 fib levels sit.
That whole area looks like the main support zone if we get a deeper retrace.
Below that, 16.58 is another key level from the 0.75 fib.
So for me the chart is simple.
Bullish scenario:
hold strength, break higher, and attack 30.9.
More likely scenario:
retrace first, fill the FVG, test the fib support zone, and then decide the next bigger move.
The levels that matter most to me are 30.9 on top, then 23.6, 21.3, 19.1 and 16.58 below.
This is not financial advice. Always do your own research.
📊 $VVV HAS 2 CLEAR SCENARIOS HERE
$VVV is sitting at a very important area right now.
The chart has a clear trendline, a visible FVG below, and the fib levels are giving us the map.
Right now price is pushing near the upper part of the range, but I think there are 2 main paths from here.
The first scenario is the bullish one.
If $VVV holds strength and keeps accepting above this area, then a move toward the top of the range around 30.9 looks possible.
If that level breaks cleanly, continuation higher can come fast, especially if the trendline keeps acting as support.
That is the lower probability scenario for me right now, around 30%.
The second scenario is the one I respect more.
Price could sweep a bit higher or stall here, and then come back down to fill the FVG.
That sends $VVV back into the 21.3 to 19.1 zone, which is also where the 0.5 and 0.618 fib levels sit.
That whole area looks like the main support zone if we get a deeper retrace.
Below that, 16.58 is another key level from the 0.75 fib.
So for me the chart is simple.
Bullish scenario:
hold strength, break higher, and attack 30.9.
More likely scenario:
retrace first, fill the FVG, test the fib support zone, and then decide the next bigger move.
The levels that matter most to me are 30.9 on top, then 23.6, 21.3, 19.1 and 16.58 below.
This is not financial advice. Always do your own research.
$VVV is sitting at a very important area right now.
The chart has a clear trendline, a visible FVG below, and the fib levels are giving us the map.
Right now price is pushing near the upper part of the range, but I think there are 2 main paths from here.
The first scenario is the bullish one.
If $VVV holds strength and keeps accepting above this area, then a move toward the top of the range around 30.9 looks possible.
If that level breaks cleanly, continuation higher can come fast, especially if the trendline keeps acting as support.
That is the lower probability scenario for me right now, around 30%.
The second scenario is the one I respect more.
Price could sweep a bit higher or stall here, and then come back down to fill the FVG.
That sends $VVV back into the 21.3 to 19.1 zone, which is also where the 0.5 and 0.618 fib levels sit.
That whole area looks like the main support zone if we get a deeper retrace.
Below that, 16.58 is another key level from the 0.75 fib.
So for me the chart is simple.
Bullish scenario:
hold strength, break higher, and attack 30.9.
More likely scenario:
retrace first, fill the FVG, test the fib support zone, and then decide the next bigger move.
The levels that matter most to me are 30.9 on top, then 23.6, 21.3, 19.1 and 16.58 below.
This is not financial advice. Always do your own research.
375
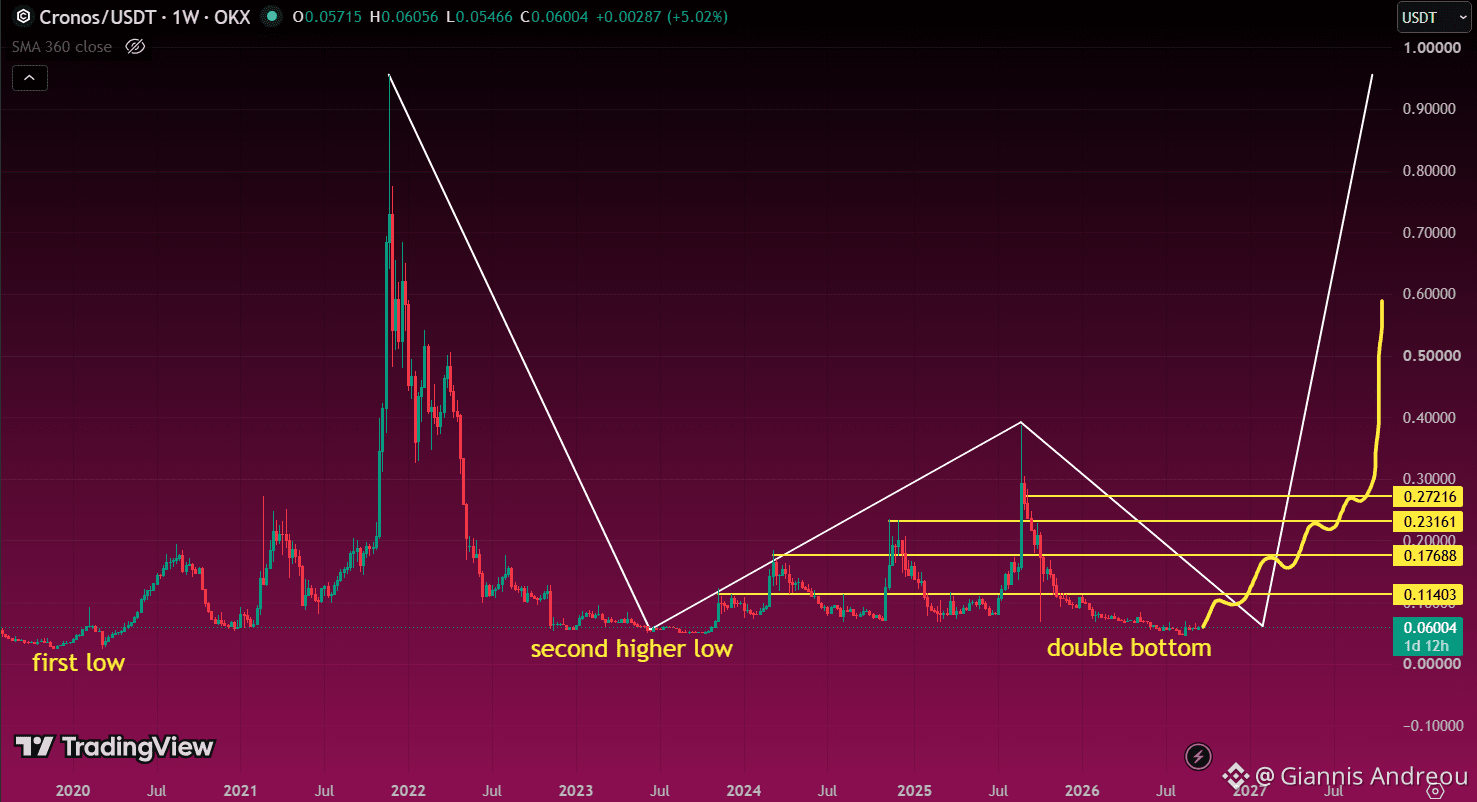
🔄 $CRONOS MAY BE BUILDING A HUGE W PATTERN
The weekly chart is starting to get interesting.
First major low in 2020.
Then a higher low in 2023.
And now price is trying to build a double bottom around the current area.
That creates the possibility of a much larger W structure.
The levels I’m watching are clear:
$0.114 → $0.177 → $0.232 → $0.272
If $CRONOS starts reclaiming those levels one by one, the bigger structure could shift fast.
Above $0.27, the chart starts opening up much more.
For now, the bottom structure is what matters most.
Nothing is guaranteed. This is simply the higher-probability scenario I see from the technical setup, not a recommendation to buy $CRONOS. Always do your own research.
🔄 $CRONOS MAY BE BUILDING A HUGE W PATTERN
The weekly chart is starting to get interesting.
First major low in 2020.
Then a higher low in 2023.
And now price is trying to build a double bottom around the current area.
That creates the possibility of a much larger W structure.
The levels I’m watching are clear:
$0.114 → $0.177 → $0.232 → $0.272
If $CRONOS starts reclaiming those levels one by one, the bigger structure could shift fast.
Above $0.27, the chart starts opening up much more.
For now, the bottom structure is what matters most.
Nothing is guaranteed. This is simply the higher-probability scenario I see from the technical setup, not a recommendation to buy $CRONOS. Always do your own research.
The weekly chart is starting to get interesting.
First major low in 2020.
Then a higher low in 2023.
And now price is trying to build a double bottom around the current area.
That creates the possibility of a much larger W structure.
The levels I’m watching are clear:
$0.114 → $0.177 → $0.232 → $0.272
If $CRONOS starts reclaiming those levels one by one, the bigger structure could shift fast.
Above $0.27, the chart starts opening up much more.
For now, the bottom structure is what matters most.
Nothing is guaranteed. This is simply the higher-probability scenario I see from the technical setup, not a recommendation to buy $CRONOS. Always do your own research.
115
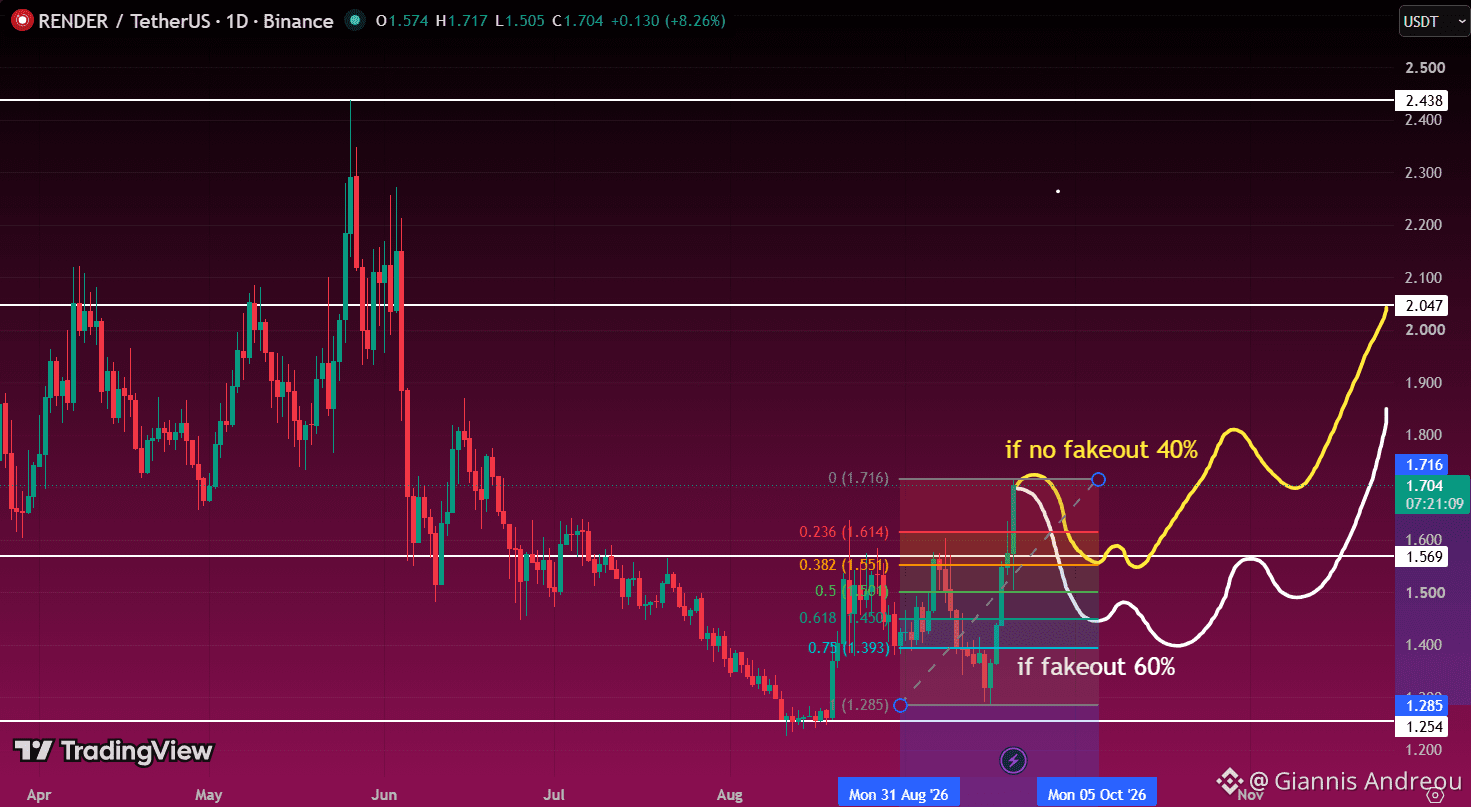
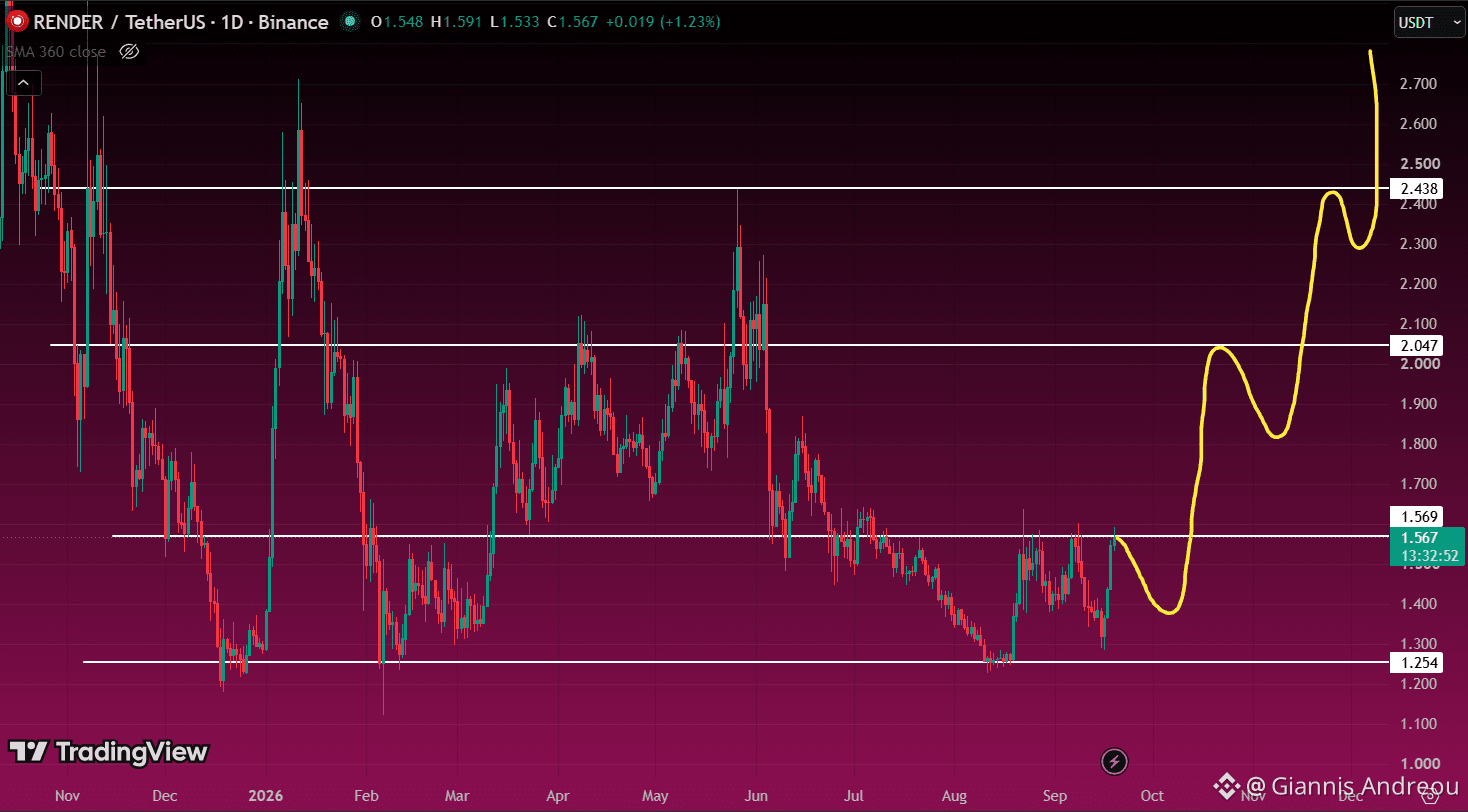
🤖 $RENDER IS HOLDING THE LEVEL THAT MATTERS
$RENDER keeps defending the $1.25 support.
That’s the first thing I like.
Now price is pushing into the $1.57 resistance again.
If that level finally breaks and holds, the chart starts opening up.
The next areas I’m watching are:
$2.05
Then $2.44
And after that, the structure gets much more interesting.
So for me, the roadmap is simple.
Hold $1.25.
Break $1.57.
Then start reclaiming the higher resistances one by one.
As long as the support keeps holding, the setup remains constructive.
Nothing is guaranteed. This is simply the higher-probability scenario I see from the technical setup, not a recommendation to buy $RENDER. Always do your own research.
🤖 $RENDER IS HOLDING THE LEVEL THAT MATTERS
$RENDER keeps defending the $1.25 support.
That’s the first thing I like.
Now price is pushing into the $1.57 resistance again.
If that level finally breaks and holds, the chart starts opening up.
The next areas I’m watching are:
$2.05
Then $2.44
And after that, the structure gets much more interesting.
So for me, the roadmap is simple.
Hold $1.25.
Break $1.57.
Then start reclaiming the higher resistances one by one.
As long as the support keeps holding, the setup remains constructive.
Nothing is guaranteed. This is simply the higher-probability scenario I see from the technical setup, not a recommendation to buy $RENDER. Always do your own research.
$RENDER keeps defending the $1.25 support.
That’s the first thing I like.
Now price is pushing into the $1.57 resistance again.
If that level finally breaks and holds, the chart starts opening up.
The next areas I’m watching are:
$2.05
Then $2.44
And after that, the structure gets much more interesting.
So for me, the roadmap is simple.
Hold $1.25.
Break $1.57.
Then start reclaiming the higher resistances one by one.
As long as the support keeps holding, the setup remains constructive.
Nothing is guaranteed. This is simply the higher-probability scenario I see from the technical setup, not a recommendation to buy $RENDER. Always do your own research.
2
988
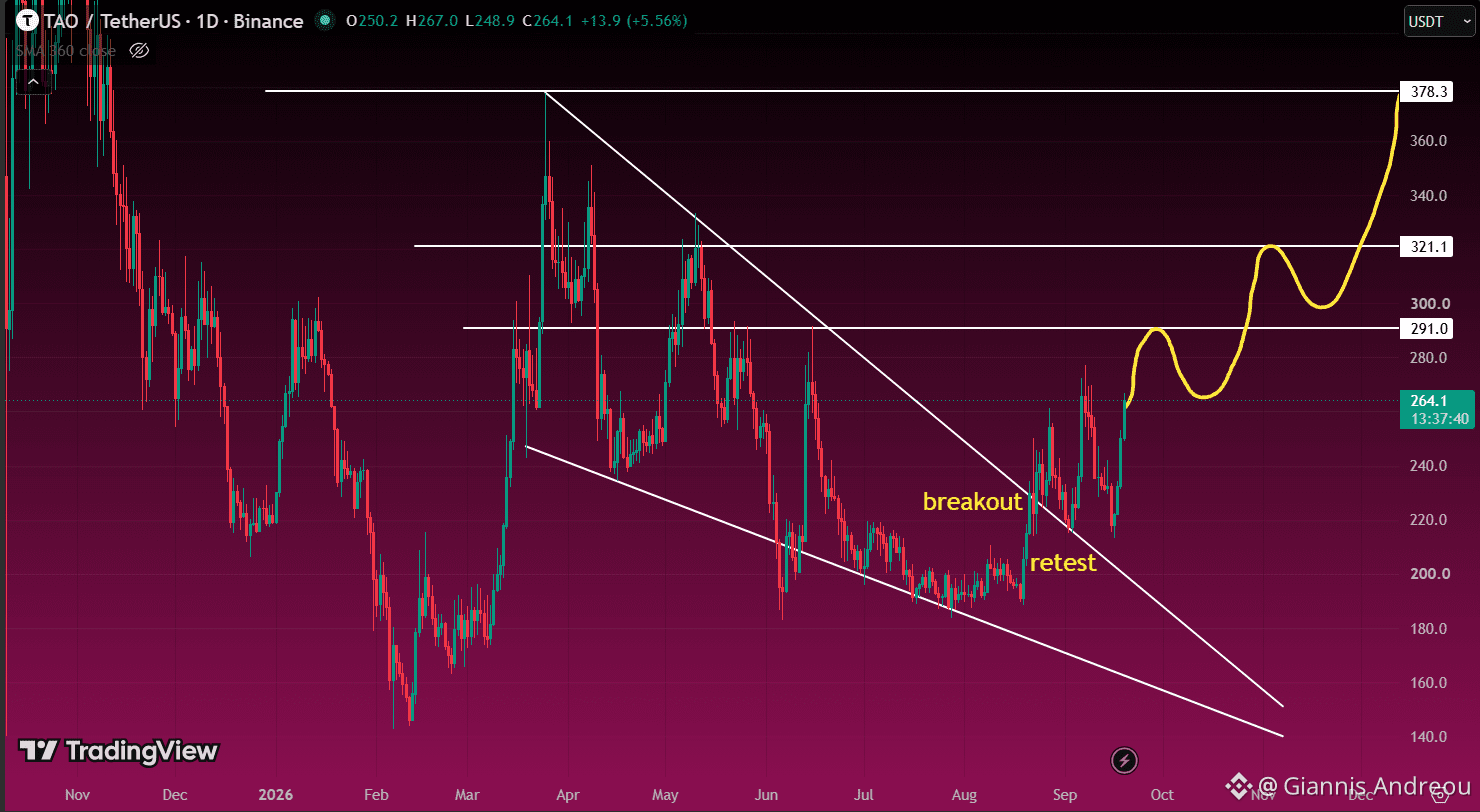
🧠 $TAO BROKE THE DOWNTREND
$TAO already did the first important thing.
It broke out of the long descending structure
and then came back for the retest.
That retest matters.
So far, price is holding above the broken trendline
and that keeps the bullish scenario alive.
Now the next levels are very clear.
First key resistance is around $291.
If that breaks, the next area I’m watching is around $321.
And if momentum stays strong after that,
the bigger target on the chart sits near $378.
So structurally, this chart looks much better than before.
The breakout happened.
The retest happened.
Now it’s about whether $TAO can start reclaiming the horizontal resistances one by one.
As long as the breakout area keeps holding,
this setup still looks constructive.
Not a recommendation to buy or sell $TAO. Always do your own research.
🧠 $TAO BROKE THE DOWNTREND
$TAO already did the first important thing.
It broke out of the long descending structure
and then came back for the retest.
That retest matters.
So far, price is holding above the broken trendline
and that keeps the bullish scenario alive.
Now the next levels are very clear.
First key resistance is around $291.
If that breaks, the next area I’m watching is around $321.
And if momentum stays strong after that,
the bigger target on the chart sits near $378.
So structurally, this chart looks much better than before.
The breakout happened.
The retest happened.
Now it’s about whether $TAO can start reclaiming the horizontal resistances one by one.
As long as the breakout area keeps holding,
this setup still looks constructive.
Not a recommendation to buy or sell $TAO. Always do your own research.
$TAO already did the first important thing.
It broke out of the long descending structure
and then came back for the retest.
That retest matters.
So far, price is holding above the broken trendline
and that keeps the bullish scenario alive.
Now the next levels are very clear.
First key resistance is around $291.
If that breaks, the next area I’m watching is around $321.
And if momentum stays strong after that,
the bigger target on the chart sits near $378.
So structurally, this chart looks much better than before.
The breakout happened.
The retest happened.
Now it’s about whether $TAO can start reclaiming the horizontal resistances one by one.
As long as the breakout area keeps holding,
this setup still looks constructive.
Not a recommendation to buy or sell $TAO. Always do your own research.
3
4
3.2k
Log in to explore more content
Join global crypto users on Binance Square
⚡️ Get latest and useful information about crypto.
💬 Trusted by the world’s largest crypto exchange.
👍 Discover real insights from verified creators.
Email / Phone number
Trending Topics
SaylorHintsStrategyBitcoinBuy
2.3M views
12,360 Discussing
#saylorhintsstrategybitcoinbuy
🚨 SAYLOR JUST DROPPED THE SUNDAY $BTC HINT 👀
Michael Saylor reposted his usual Bitcoin chart again.
If history repeats, those orange dots could be signaling another Strategy BTC purchase is coming. 🟠
And when Saylor buys, the market watches.
🐋 Massive BTC holdings
💰 Continued accumulation strategy
📈 Potential short-term sentiment boost
But here’s the key:
A repost is NOT confirmation of a purchase.
The real signal comes when Strategy officially reports the transaction.
🔥 If another major BTC buy is announced, will the market react this time?
Or is Saylor’s accumulation becoming so routine that traders barely react anymore?
👀 Watch the announcement.
$MSTRB
#BTC #strategy #crypto #BitcoinNews
sdatta
·5 Likes
·5.9k views
BOJRaisesRatesTo31YearHigh
246,322 views
3,242 Discussing
BuffettStepsDownAsBerkshireChairman
118,989 views
1,736 Discussing