Binance Square
speculative trader
670 Posts
speculative trader

جاري العقول لا تقدم نفسك قربان لها
227 Following
32 Followers
86 Liked
Posts
·
--
Get a UDT reward
Get a UDT reward
龙虾量化带单
·
--
Bullish
Follow me to get your bonus. Also, I will select 3 people from the reshare list, and each will receive $5
关注我领取你的红包,另外我将从转发者中抽3人,每人送5美元#ETH $BTC

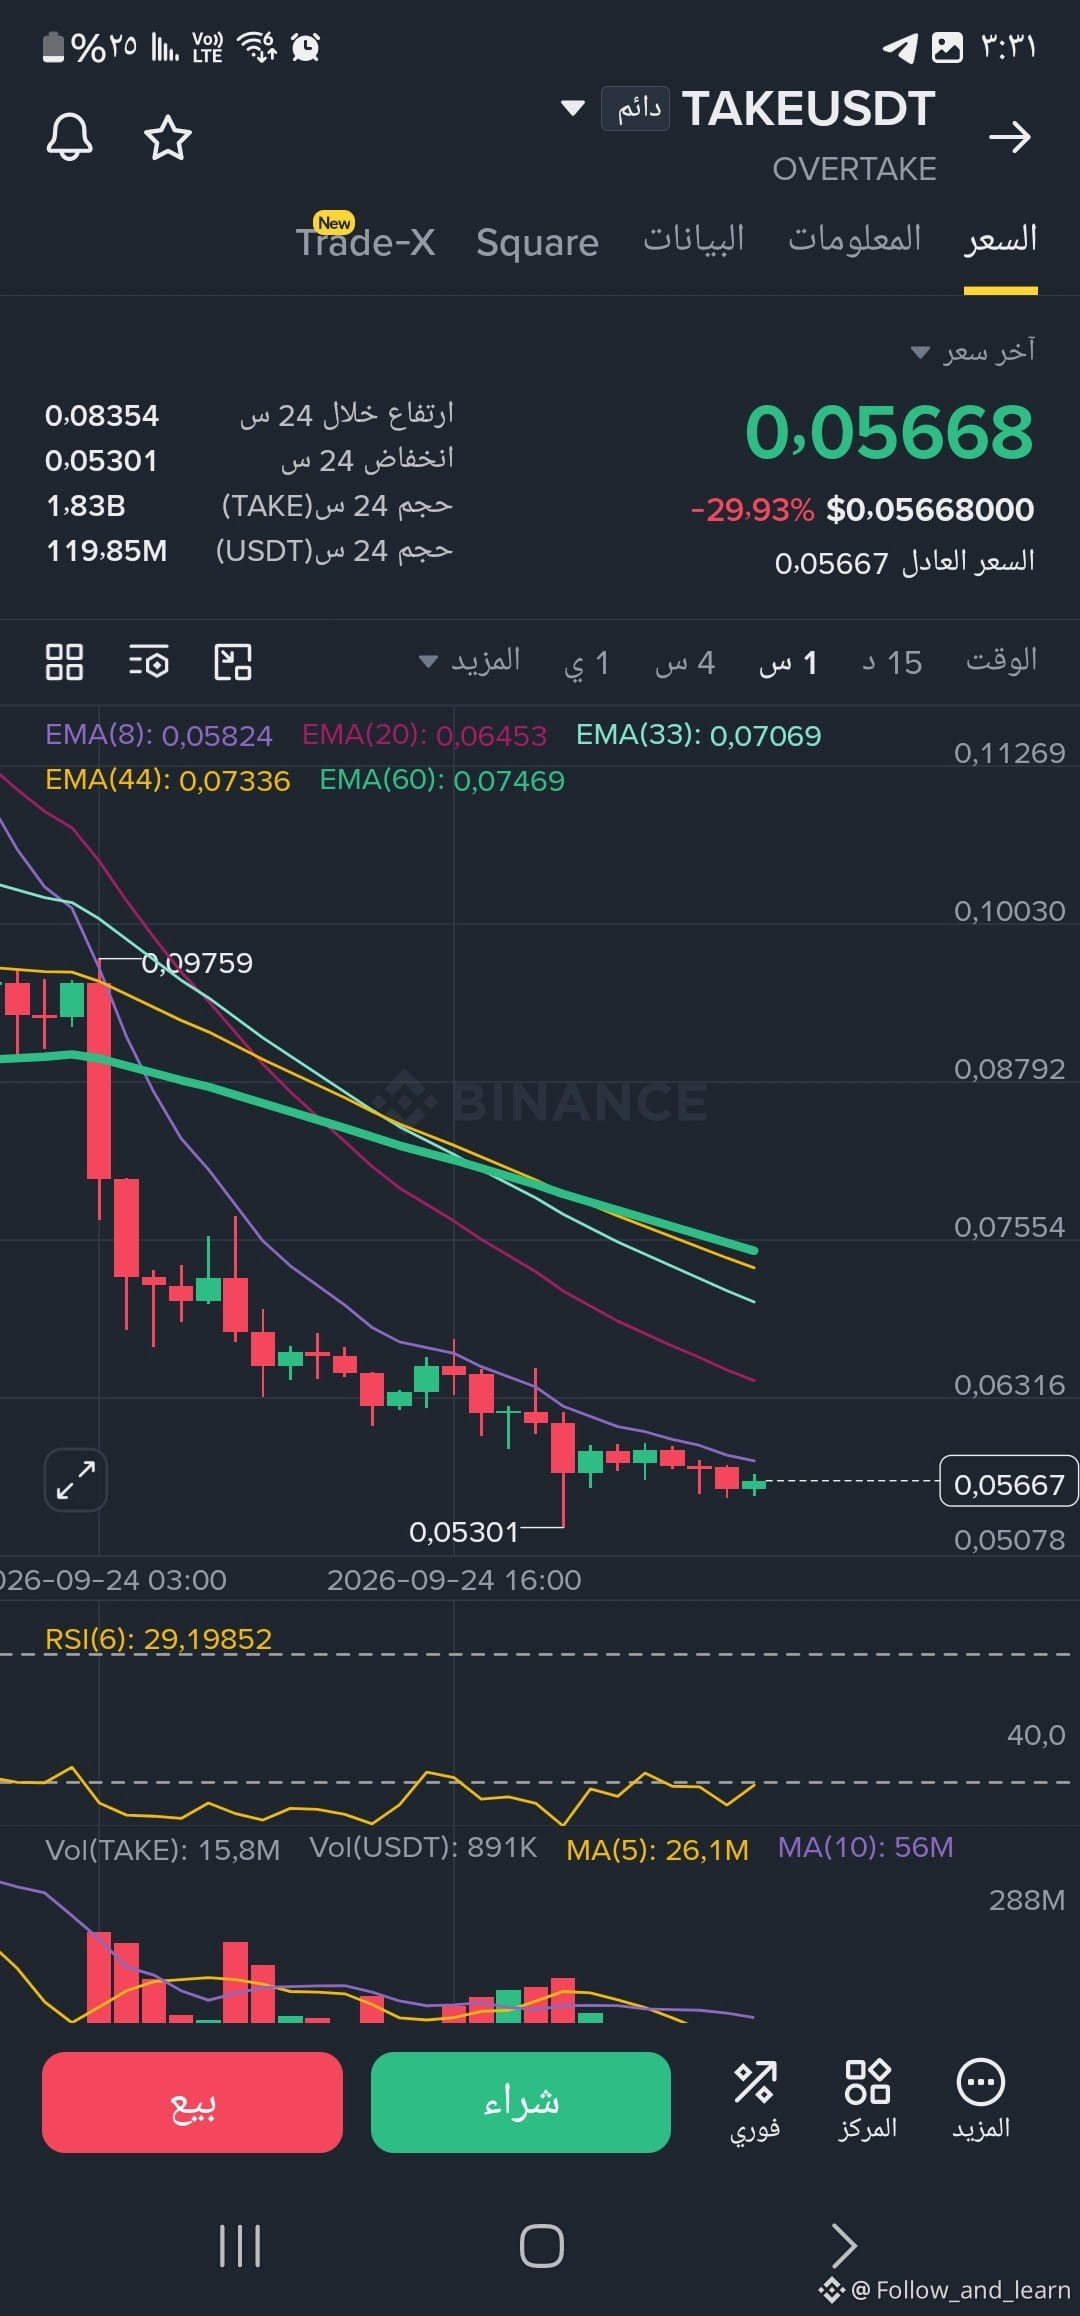
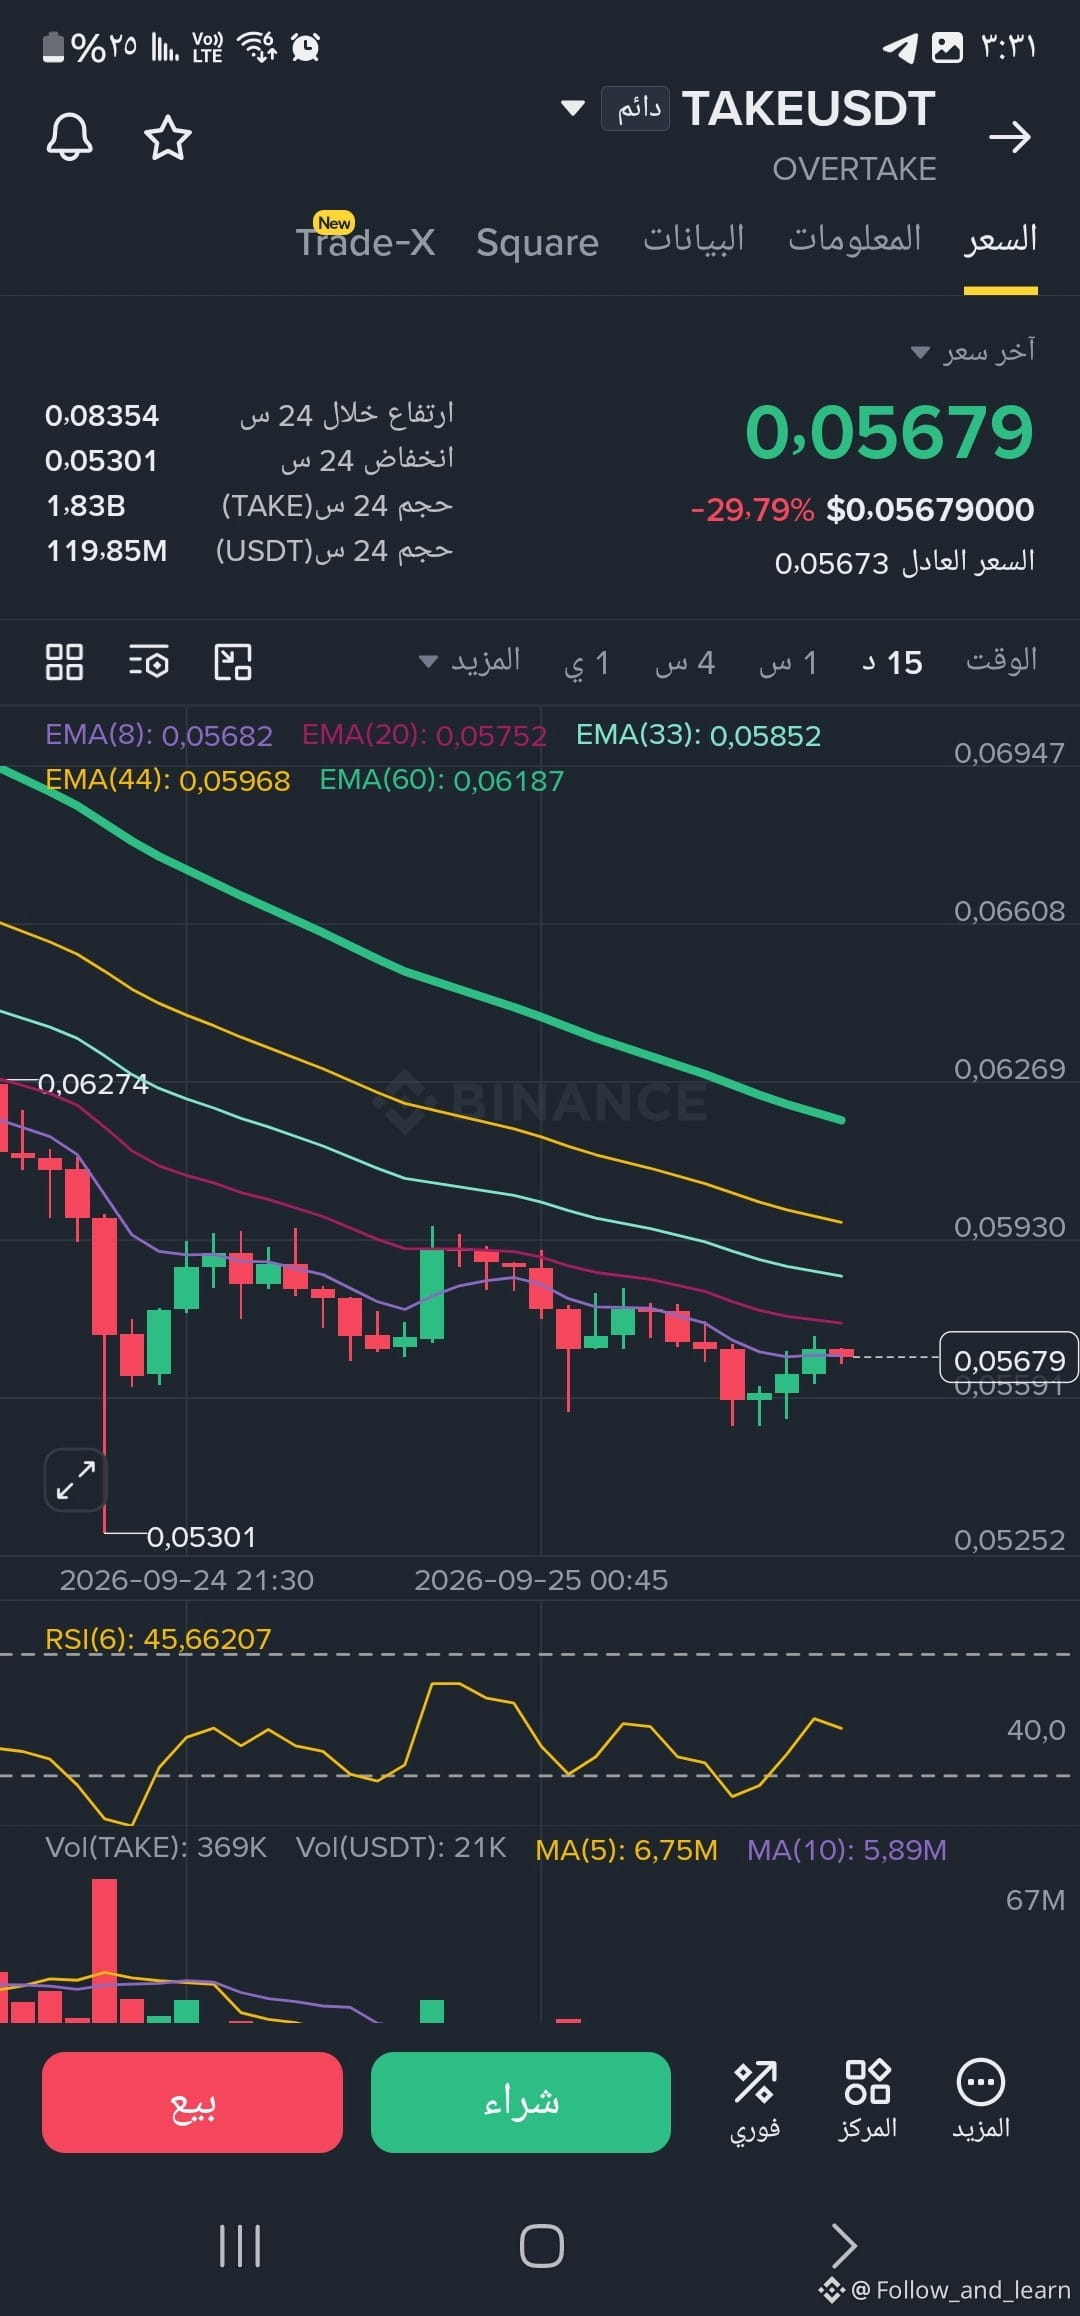
🎭 The screen is red... will you fall into the trap or seize the opportunity? When you see a coin drop more than 29\% in a single day, your mind goes through two stages: 1️⃣ Fear (Panic): "The market is collapsing—I’ll sell everything to protect what’s left!" 2️⃣ Revenge Trading: "The coin is at the bottom—I’ll enter right now with all my capital to make up for the loss!" Both of these feelings are the #1 reason 90\% of beginner traders go bankrupt. Real trading isn’t gambling on the next candle—it’s patience and waiting for the right moment. Let’s read the chart of coin $TAKE with an expert’s eyes, not a novice’s emotion: 📉 What does the chart tell us right now? * The market is exhausted on the sell side: the RSI indicator on the 1-hour timeframe has dropped below 30, meaning sellers have drained most of their power. Entering a short trade late in these zones is like jumping off a train that’s already going at full speed. * A battle at the critical zone: the price is trying to hold above the $0.0530 area. This zone is currently the buyer’s last line of defense. * Resistance blocking the rise: any bounce in the range between $0.0585 and $0.0595 will run into moving averages (EMA)—the areas that professionals look at to reassess the trend. 💡 Don’t enter because you "feel" the price will go up or down. {future}(TAKEUSDT) If you want to buy, wait for a clear reversal signal with a candle close that confirms strong buying. If you want to sell with the bearish trend, don’t chase the bottom—wait for a pullback where your targets are clear.
🎭 The screen is red... will you fall into the trap or seize the opportunity?
When you see a coin drop more than 29\% in a single day, your mind goes through two stages:
1️⃣ Fear (Panic): "The market is collapsing—I’ll sell everything to protect what’s left!"
2️⃣ Revenge Trading: "The coin is at the bottom—I’ll enter right now with all my capital to make up for the loss!"
Both of these feelings are the #1 reason 90\% of beginner traders go bankrupt. Real trading isn’t gambling on the next candle—it’s patience and waiting for the right moment.
Let’s read the chart of coin $TAKE with an expert’s eyes, not a novice’s emotion:
📉 What does the chart tell us right now?
* The market is exhausted on the sell side: the RSI indicator on the 1-hour timeframe has dropped below 30, meaning sellers have drained most of their power. Entering a short trade late in these zones is like jumping off a train that’s already going at full speed.
* A battle at the critical zone: the price is trying to hold above the $0.0530 area. This zone is currently the buyer’s last line of defense.
* Resistance blocking the rise: any bounce in the range between $0.0585 and $0.0595 will run into moving averages (EMA)—the areas that professionals look at to reassess the trend.
💡 Don’t enter because you "feel" the price will go up or down.
If you want to buy, wait for a clear reversal signal with a candle close that confirms strong buying.
If you want to sell with the bearish trend, don’t chase the bottom—wait for a pullback where your targets are clear.
Get a USDT gift. Follow me to get the gifts. The red envelope 🚀🎁👇
VIRUS小玉儿
·
--
🧧🧧🧧virus virus is what you made me bewitched by, it is what made me see the light. You don’t even have the world’s #1 largest wallet address. A bit unfair—come to the crypto world.

Get a USD reward. Follow me to get the gifts. The red envelope 🚀🎁👇
幸运雨Rain
·
--
☀️🧧🧧Guard your cognition and wait for blooms to unfold📈
Market tides ebb and flow—this is the norm🕊️
Don’t let short-term price swings disturb your judgment; deepen your thinking✨
Eliminate impulsiveness, refuse to follow the crowd, and maintain independent thinking💎
Invest in knowledge, plan patiently—time will deliver the answer🌿

Accumulate steadily and pay off gradually; move forward with stability💫
#AI股持续上涨还有哪些投资机会

virus
virus
Virus平常心
·
--
🧧🧧🧧Today's obscure take may become tomorrow's consensus; today's consensus may also become tomorrow's history.#virus

The answer is 5
The answer is 5
Ahli Hidaya
·
--
Bullish
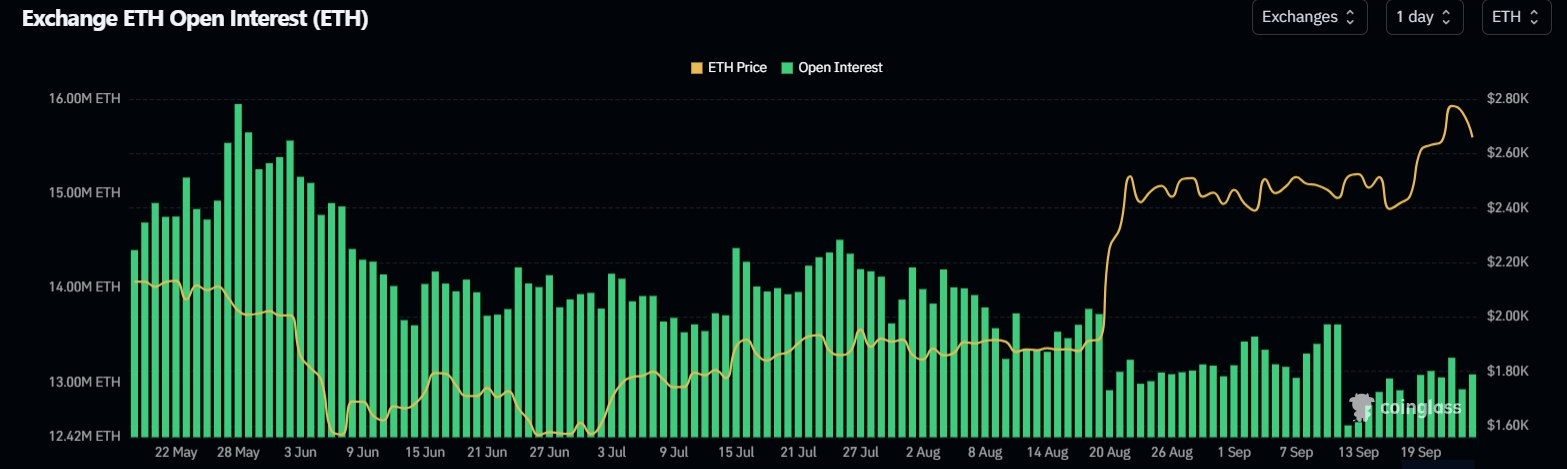
Ethereum Takes a Breather: Can ETH Hold Above $2,620 Support After Rejection at $2,780? 📉✨
Ethereum ($ETH) has hit a temporary roadblock, sliding about 3% to dip below the $2,700 mark as the broader crypto market pauses its recent rally. After a strong push that tested resistance near the $2,786 high, a wave of late long positions got caught and flushed out, bringing total liquidations past $111 million—with the vast majority ($97.6M) coming from overzealous longs.
Key Market Dynamics Right Now:
The Pullback & Support: ETH is currently looking for a stable footing. Immediate downside support rests around $2,626, with deeper moving average cushions near $2,550 if selling pressure expands.
Calm Leverage & Activity: Unlike previous explosive breakouts, derivatives open interest and on-chain active addresses have stayed relatively flat, indicating that this cool-off is more of a healthy market pause than a structural breakdown.
The Bullish Counter-Narrative: Despite the short-term flush, macro demand and institutional interest remain alive. Maintaining key moving averages keeps the broader recovery structure intact.
What's Next for Traders?
Bulls need to reclaim the $2,700–$2,710 range quickly to regain momentum, while a failure to hold $2,626 could invite a deeper retest of lower liquidity zones.
Are you buying this dip, or waiting for a deeper correction before scaling back into ETH? Let’s talk strategy below! 👇
#Ethereum #ETH #CryptoAnalysis #BinanceSquare #CryptoTrading #MarketUpdate$usdc$ETH

#DYOR!!
The answer is 1
The answer is 1
圣克斯Lucky1688
·
--
🧧🎁🌹🧧🎁🌹
9/24 Important News:

1. Regulatory and banking industry integration: The U.S. OCC conditionally approves licenses for three digital-asset banks
Federal oversight breaks down barriers: The U.S. Office of the Comptroller of the Currency (OCC) has conditionally approved the bank-license applications of three digital-asset institutions—Bastion, Catena, and Agora.
Supporting stablecoin compliance: Although the three institutions still must meet stringent requirements for capital, liquidity, and pre-opening conditions, this marks an acceleration in stablecoins and crypto custody companies integrating into traditional financial infrastructure under U.S. federal regulation. This is a long-term positive for compliant stablecoin settlement on mainnets such as Ethereum and BNB Chain.

2. Stablecoins and payment applications: Traditional finance and Web3 settlement accelerate integration
BVNK integrates the Stellar network: Enterprise stablecoin payments platform BVNK has officially connected to the Stellar blockchain, providing corporate clients with a faster cross-border stablecoin settlement channel. Previously, the platform had just partnered with Marqeta to launch stablecoin issuance services.
Reap and Visa expand stablecoin cards: Payments company Reap announced, together with Visa, that its stablecoin card program will be expanded to more than 100 markets worldwide, significantly lowering the barrier for enterprises and everyday consumers to use crypto for routine payroll and settlement.
Bitpace partners with Fireblocks: Cross-border payments provider Bitpace has integrated Fireblocks infrastructure, further improving the security and compliance of cross-border stablecoin transfers.

3. Industry infrastructure and market liquidity
BeInCrypto releases a liquidity report: The latest exchange order-book depth study shows that major platforms such as LBank perform strongly in depth for leading crypto assets ($52.16 million) and tokenized stocks. This reflects that market liquidity concentration is shifting toward exchanges with deep, robust buy/sell order books.
Follow me—answer 1 and take away the $SOL 红包!
🧧🎁🌹🧧🎁🌹

Follow me to get the gifts Red envelope 🚀🎁👇 Y6P9PF60 YPT8Q2P3 5MJRJ9TE EZI8WH6Z
Follow me to get the gifts Red envelope 🚀🎁👇
Y6P9PF60
YPT8Q2P3
5MJRJ9TE
EZI8WH6Z
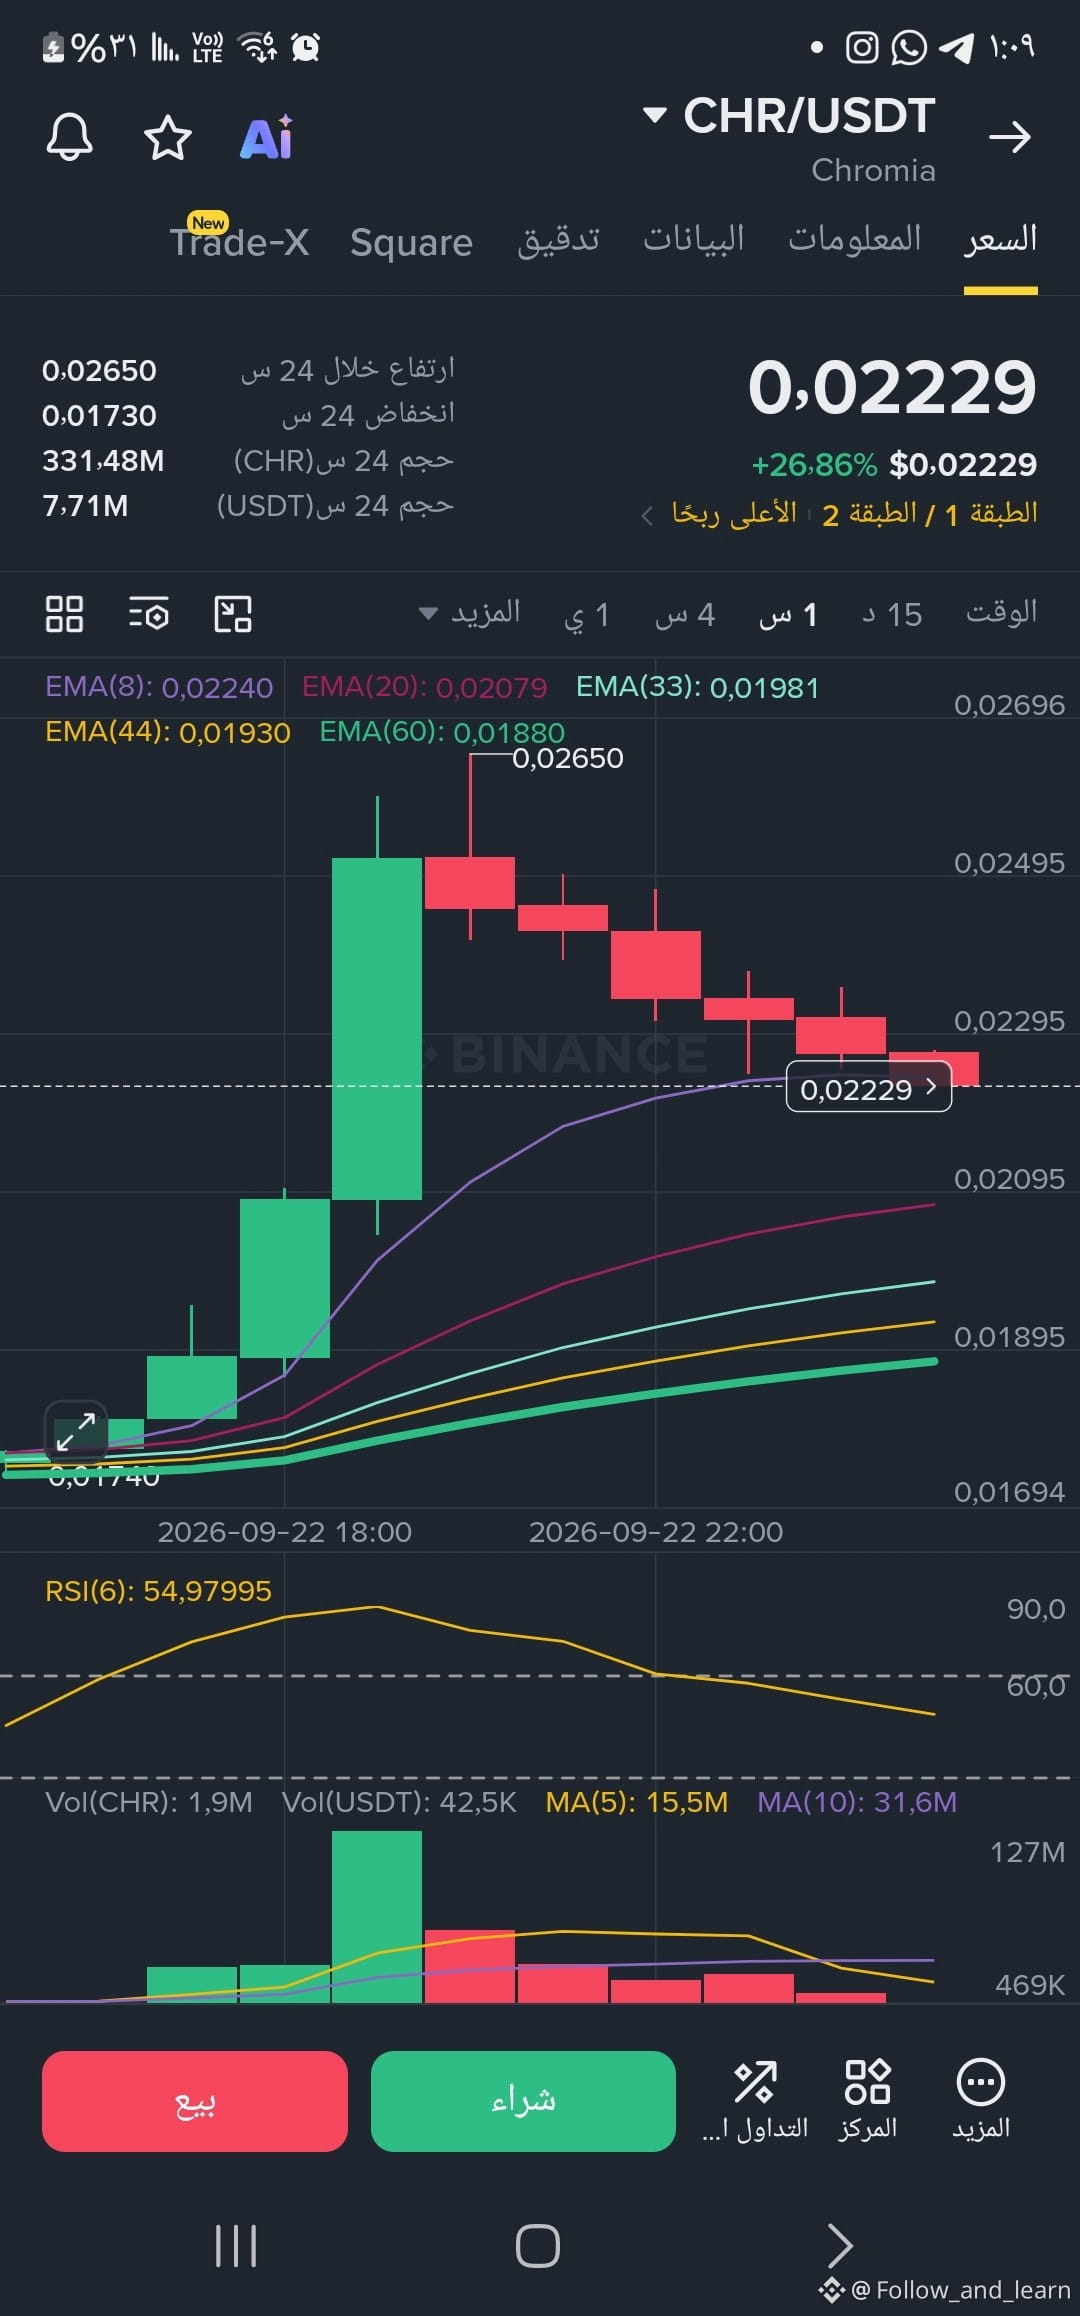
🔥 Analysis of $CHR on the clock frame: Don’t chase the peaks! 💡 After a strong rally that broke above +26% and reached a high at $0.02650, we are currently seeing a healthy, calm correction to rebuild a new price base. 📊 Technical levels, briefly: 🛡️ Support zones (accumulation): between $0.0208 - $0.0220 (near the 20 EMA). 🎯 Next targets: $0.02495, then a retest of the high at $0.02650. 📉 Indicators: The RSI has pulled back to 54.9, giving a signal that buying momentum is cooling off and the indicator is releasing to allow further upward movement later. 💡 Tip for beginners: Profit doesn’t come from chasing green candles (FOMO), but from patience and buying at support. Split your entry (DCA) and don’t put all your capital in at once! 💬 What do you think—do you see $CHR ready to launch again? #CHRUSDT
🔥 Analysis of $CHR on the clock frame: Don’t chase the peaks! 💡

After a strong rally that broke above +26% and reached a high at $0.02650, we are currently seeing a healthy, calm correction to rebuild a new price base.

📊 Technical levels, briefly:

🛡️ Support zones (accumulation): between $0.0208 - $0.0220 (near the 20 EMA).

🎯 Next targets: $0.02495, then a retest of the high at $0.02650.

📉 Indicators: The RSI has pulled back to 54.9, giving a signal that buying momentum is cooling off and the indicator is releasing to allow further upward movement later.

💡 Tip for beginners: Profit doesn’t come from chasing green candles (FOMO), but from patience and buying at support. Split your entry (DCA) and don’t put all your capital in at once!

💬 What do you think—do you see $CHR ready to launch again?
#CHRUSDT
​💥 The secret they don’t tell you market makers | How to turn your losses into record profits? 🚀🔥 ​Have you ever wondered why the price drops immediately after you enter a trade? 🛑 The reason isn’t “bad luck,” but because you enter the zone that the whales target to close their trap! 🐋⚡ ​Here is the three-part secret that separates the 5% winners from the 95% losers in trading: ​1️⃣ Catch with the whales—don’t be their prey: look for “hidden liquidity” zones before opening any trade, and don’t enter just because you see a momentum candle! 2️⃣ Flexibility is your deadly weapon: don’t get attached to your opinion or a specific coin; the market doesn’t care about emotions—move where the liquidity goes only! 3️⃣ Risk management is your solid shield: a trading plan without a predefined stop-loss is just financial suicide! 💡 ​💡 Golden rule: the successful trader doesn’t predict the future—they prepares for every scenario and seizes opportunities with cold-blooded calm! ​💬 Today’s challenge question: what percentage is your commitment to stop-losses in your most recent trades? (Be honest with yourself and share in the comments!) #BTC #XAUTUSTD #ALCH🔥🔥🔥 $BTC {spot}(BTCUSDT) $XAUT {spot}(XAUTUSDT) $ALCH
​💥 The secret they don’t tell you market makers | How to turn your losses into record profits? 🚀🔥
​Have you ever wondered why the price drops immediately after you enter a trade? 🛑
The reason isn’t “bad luck,” but because you enter the zone that the whales target to close their trap! 🐋⚡
​Here is the three-part secret that separates the 5% winners from the 95% losers in trading:
​1️⃣ Catch with the whales—don’t be their prey: look for “hidden liquidity” zones before opening any trade, and don’t enter just because you see a momentum candle!
2️⃣ Flexibility is your deadly weapon: don’t get attached to your opinion or a specific coin; the market doesn’t care about emotions—move where the liquidity goes only!
3️⃣ Risk management is your solid shield: a trading plan without a predefined stop-loss is just financial suicide! 💡
​💡 Golden rule: the successful trader doesn’t predict the future—they prepares for every scenario and seizes opportunities with cold-blooded calm!
​💬 Today’s challenge question: what percentage is your commitment to stop-losses in your most recent trades? (Be honest with yourself and share in the comments!)
#BTC #XAUTUSTD #ALCH🔥🔥🔥
$BTC

$XAUT

$ALCH
Trade cautiously spot—grab opportunities, don’t be greedy; a little that lasts is better than a lot that ends. $ALCH #ALCH🔥🔥🔥
·
--
Bullish
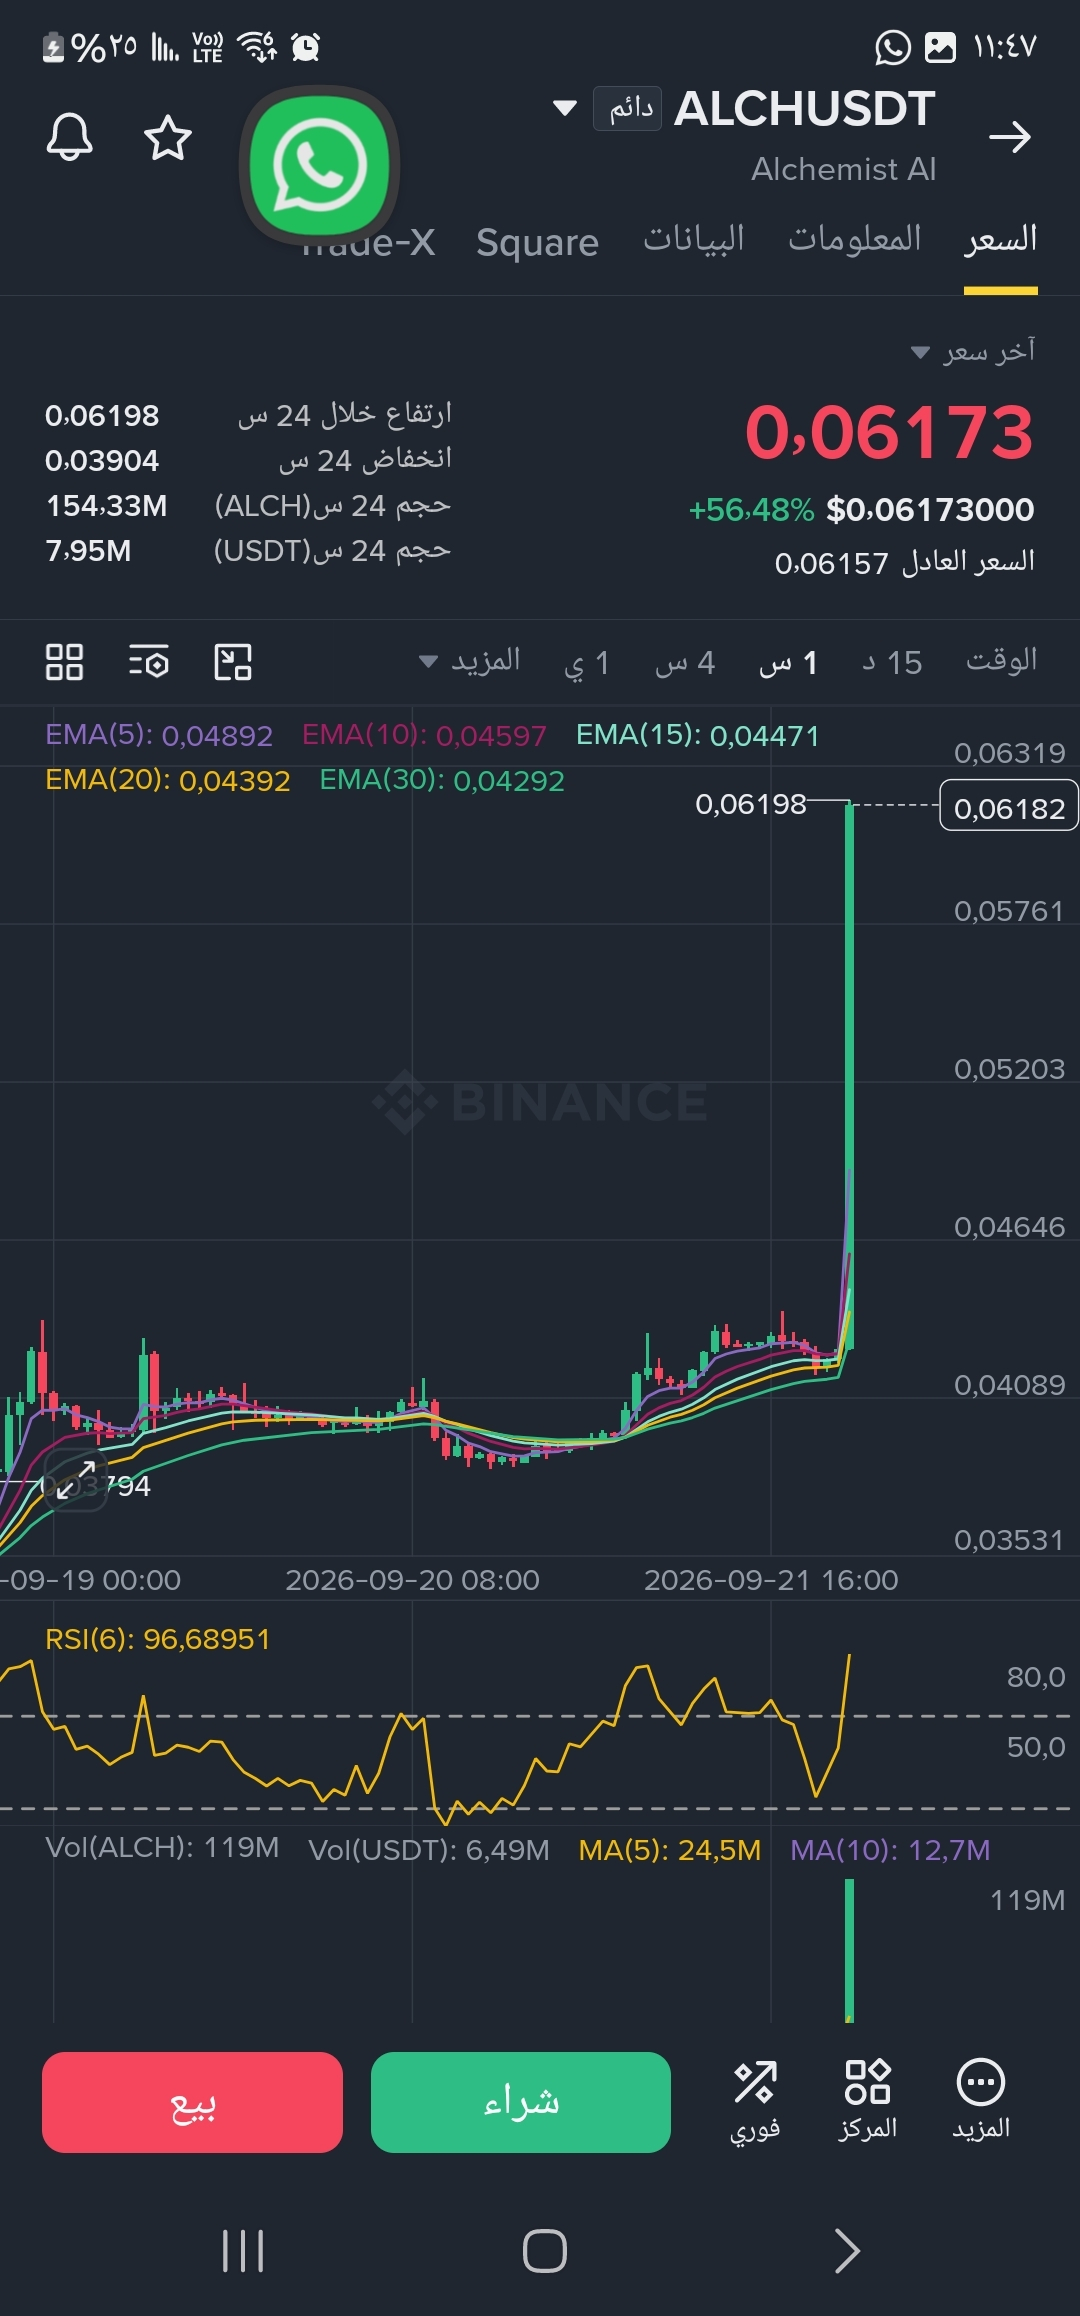
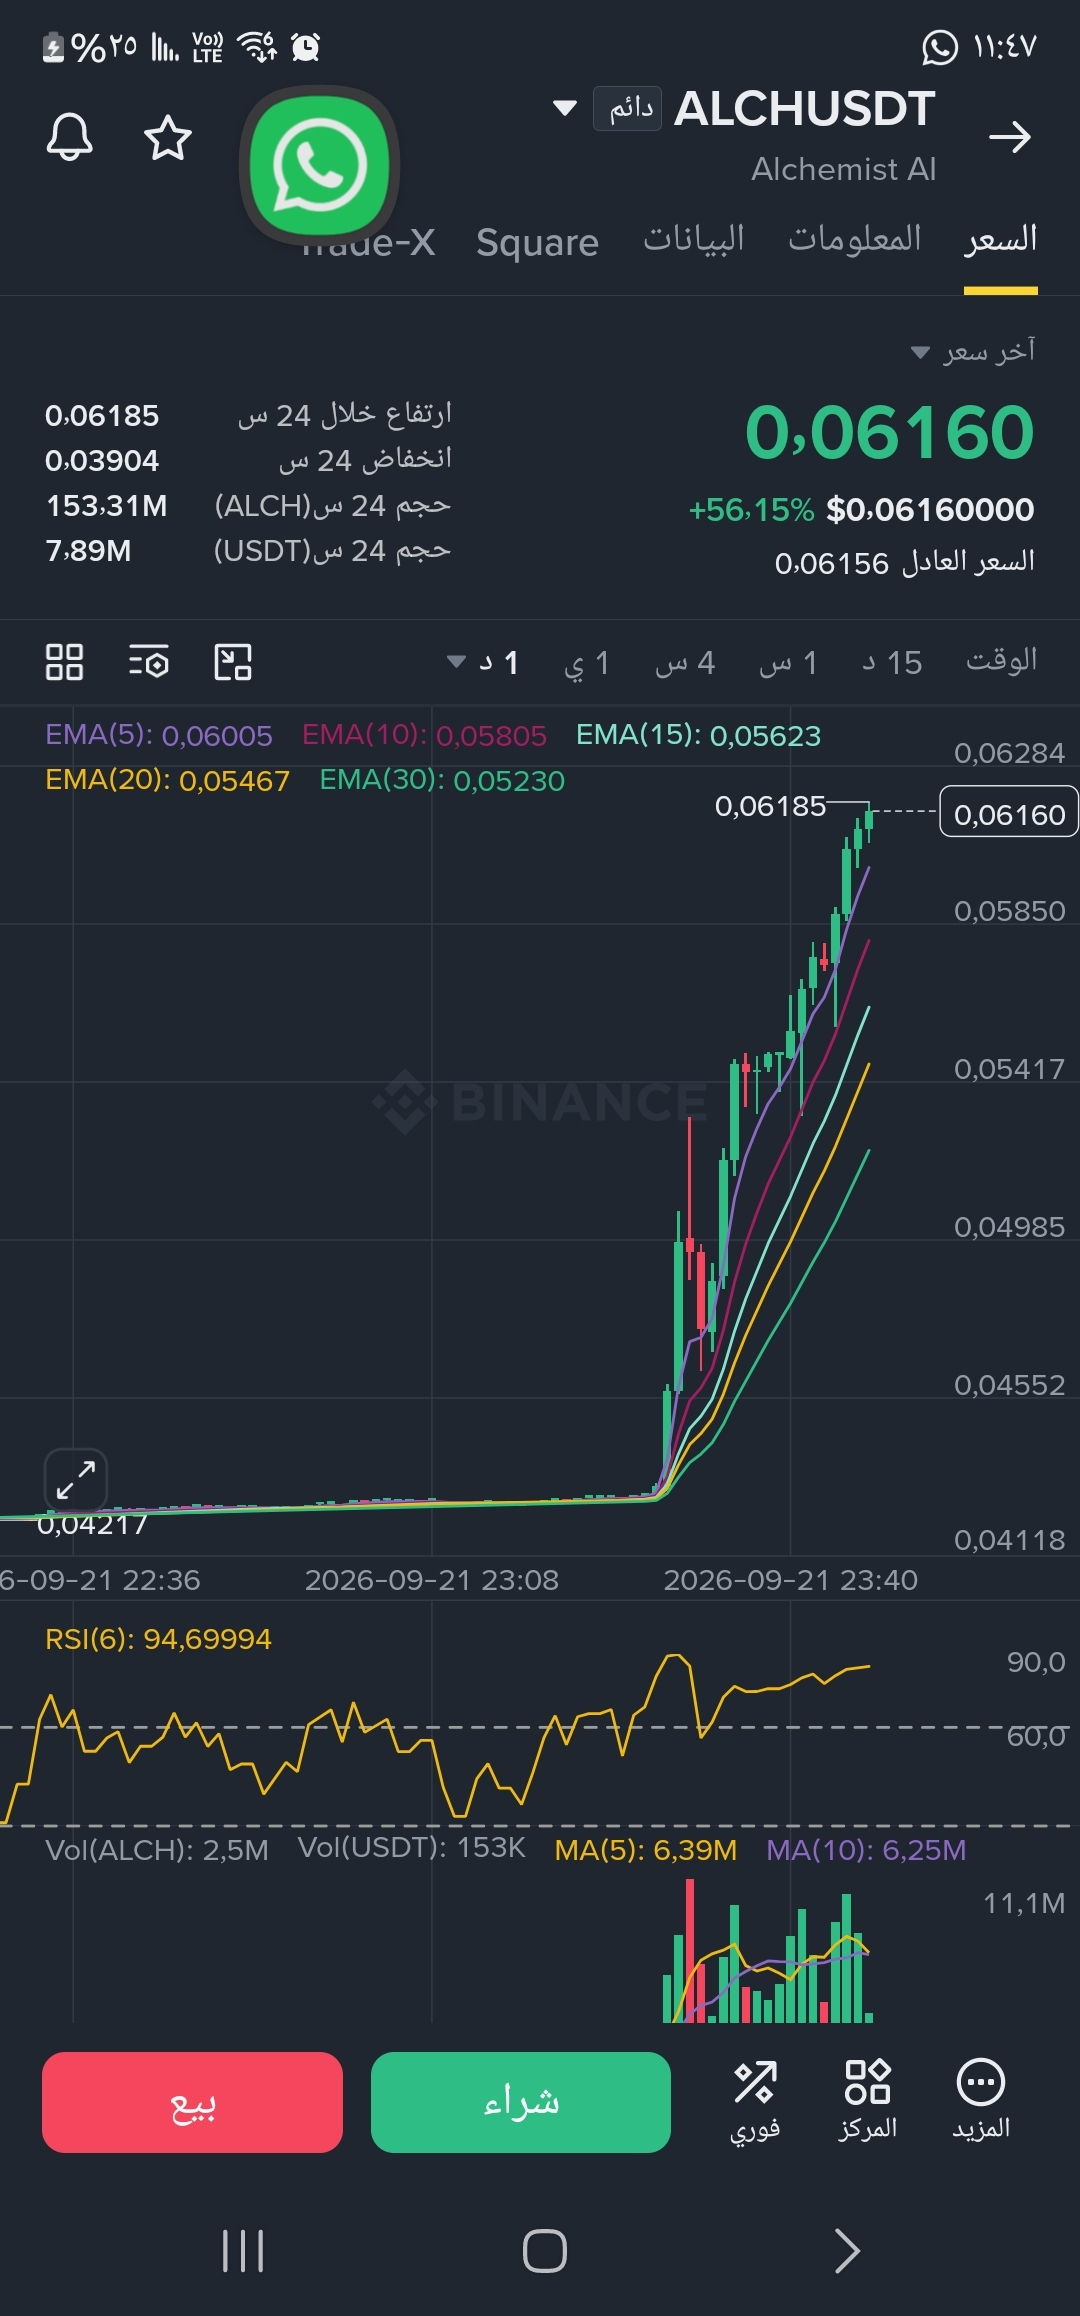
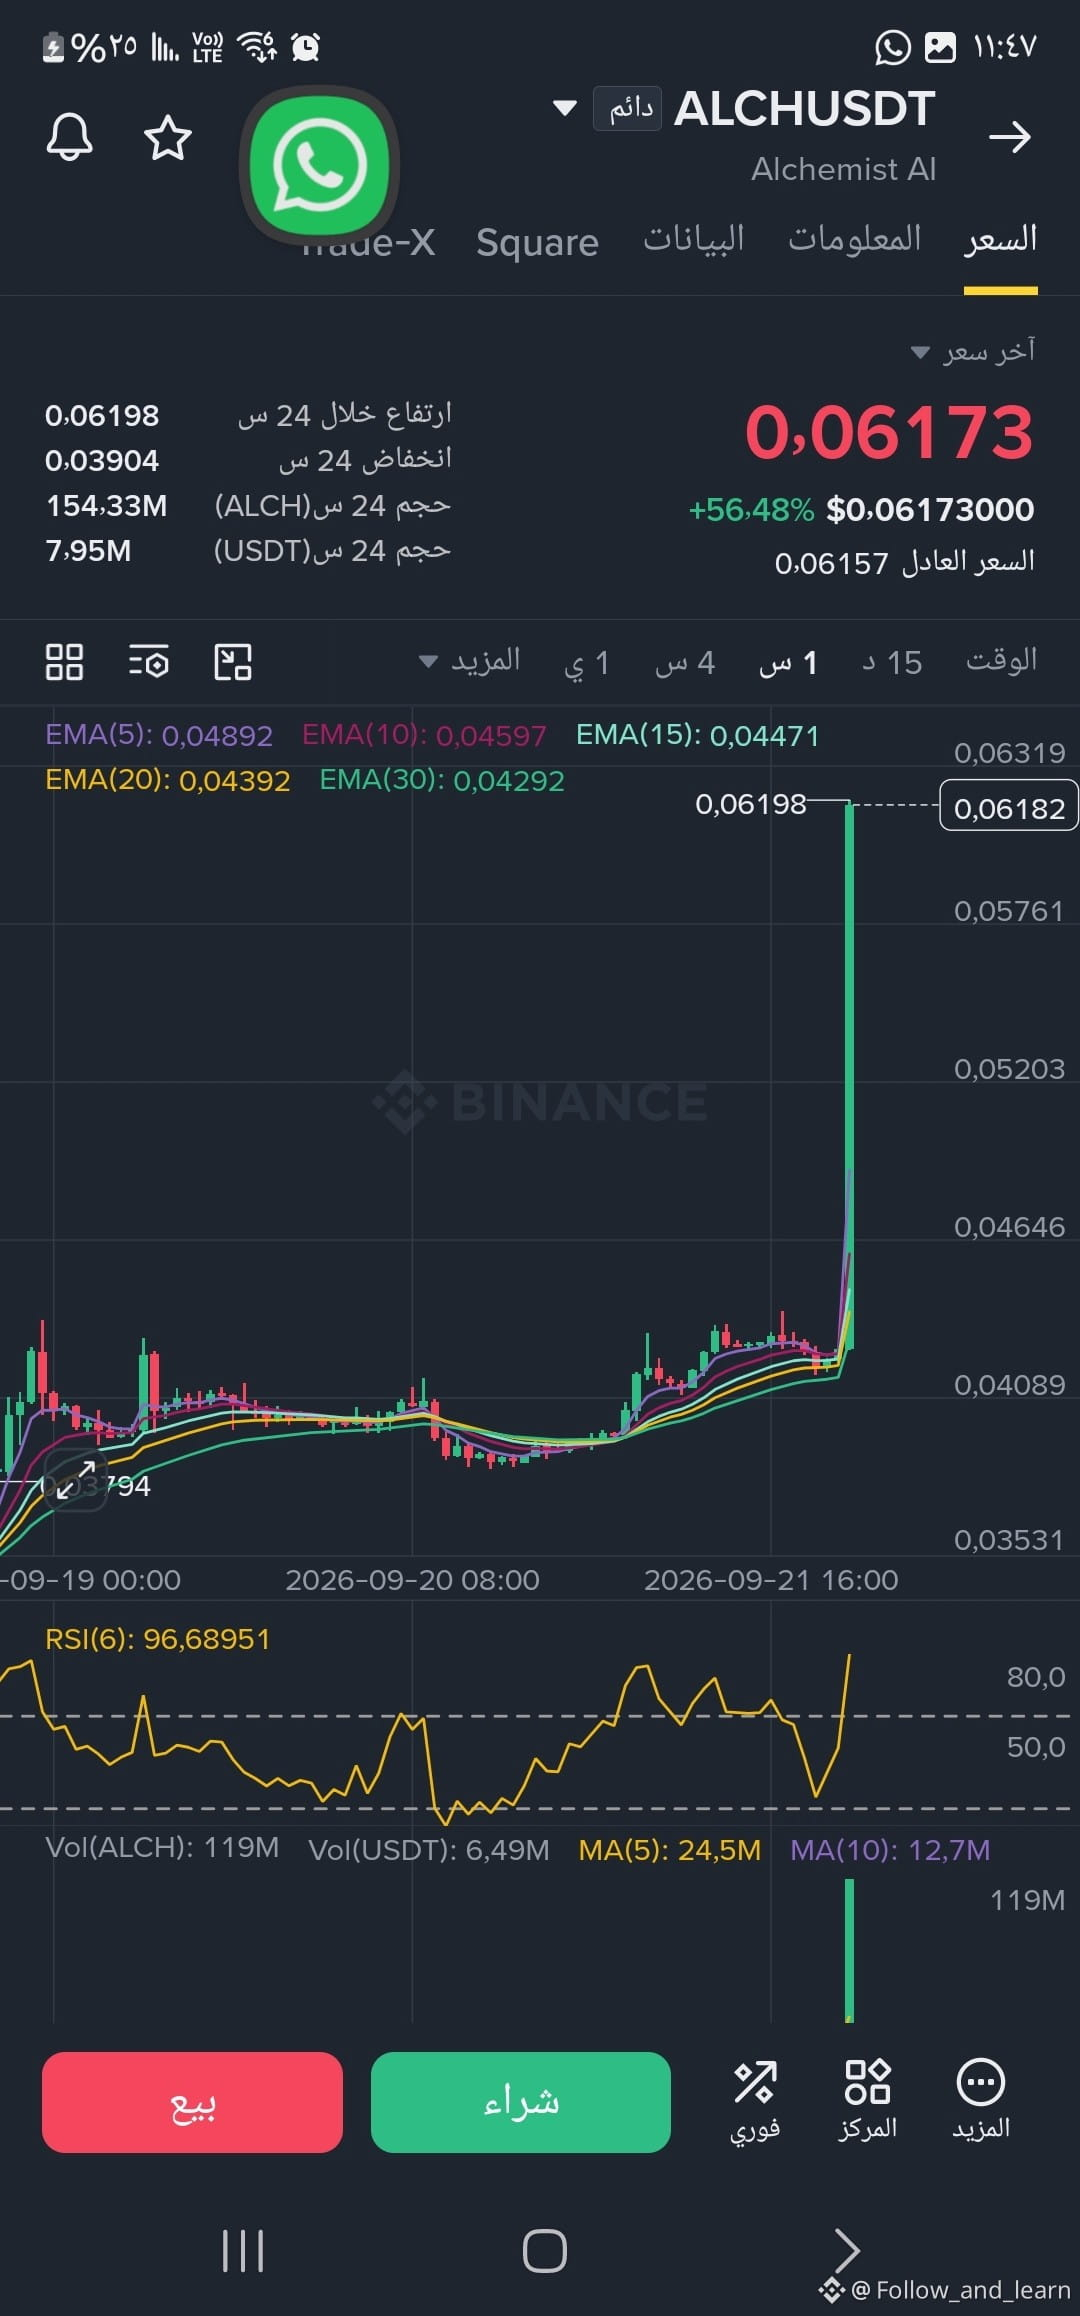
🔥 Green candles deceive emotions... don’t fall for the FOMO trap! When you see a rocket-like rising candle, a beginner rushes to enter out of fear of missing out, while a professional trader sits calmly and waits.. Why? 📊 Quick read for ALCH/USDT (1-hour timeframe): * Vertical explosion (+56%): the price jumped from 0.039 to 0.061, pulling far away from the price averages. * RSI at 96.68! A record overbought level and very dangerous—this suggests profit-taking and a likely correction is near. 💡 Golden advice: Don’t be the “liquidity” that the market maker withdraws at the peak. Safe entry is always after the correction is over and after a retest—not during the sudden spike. Protect your capital by placing a stop-loss order. Crypto opportunities repeat daily, but if you lose your capital, it won’t come back easily! $ALCH {future}(ALCHUSDT) #ALCH🔥🔥🔥
🔥 Green candles deceive emotions... don’t fall for the FOMO trap!
When you see a rocket-like rising candle, a beginner rushes to enter out of fear of missing out, while a professional trader sits calmly and waits.. Why?
📊 Quick read for ALCH/USDT (1-hour timeframe):
* Vertical explosion (+56%): the price jumped from 0.039 to 0.061, pulling far away from the price averages.
* RSI at 96.68! A record overbought level and very dangerous—this suggests profit-taking and a likely correction is near.
💡 Golden advice:
Don’t be the “liquidity” that the market maker withdraws at the peak. Safe entry is always after the correction is over and after a retest—not during the sudden spike.
Protect your capital by placing a stop-loss order. Crypto opportunities repeat daily, but if you lose your capital, it won’t come back easily!
$ALCH
#ALCH🔥🔥🔥
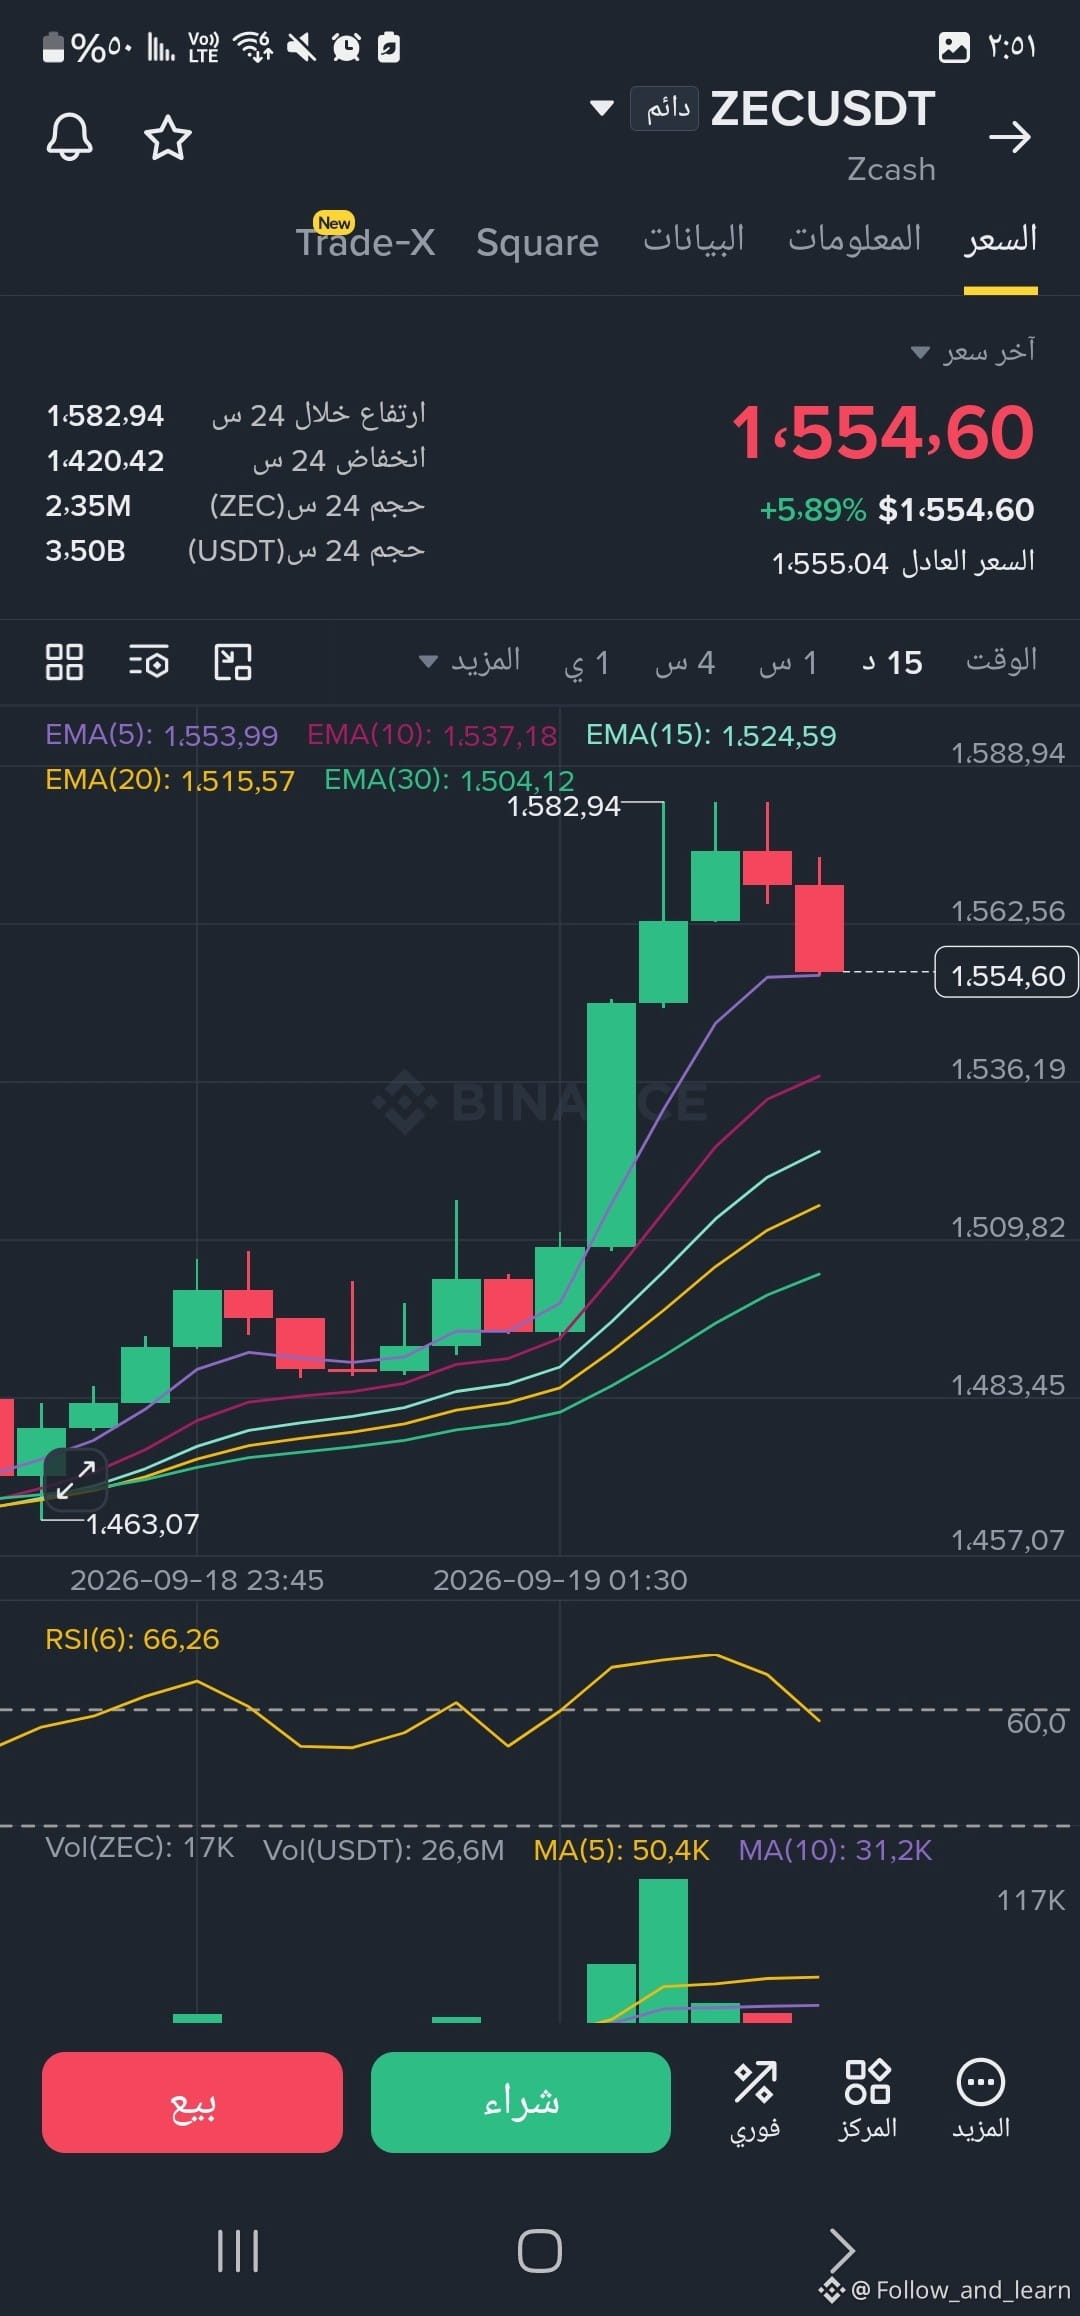
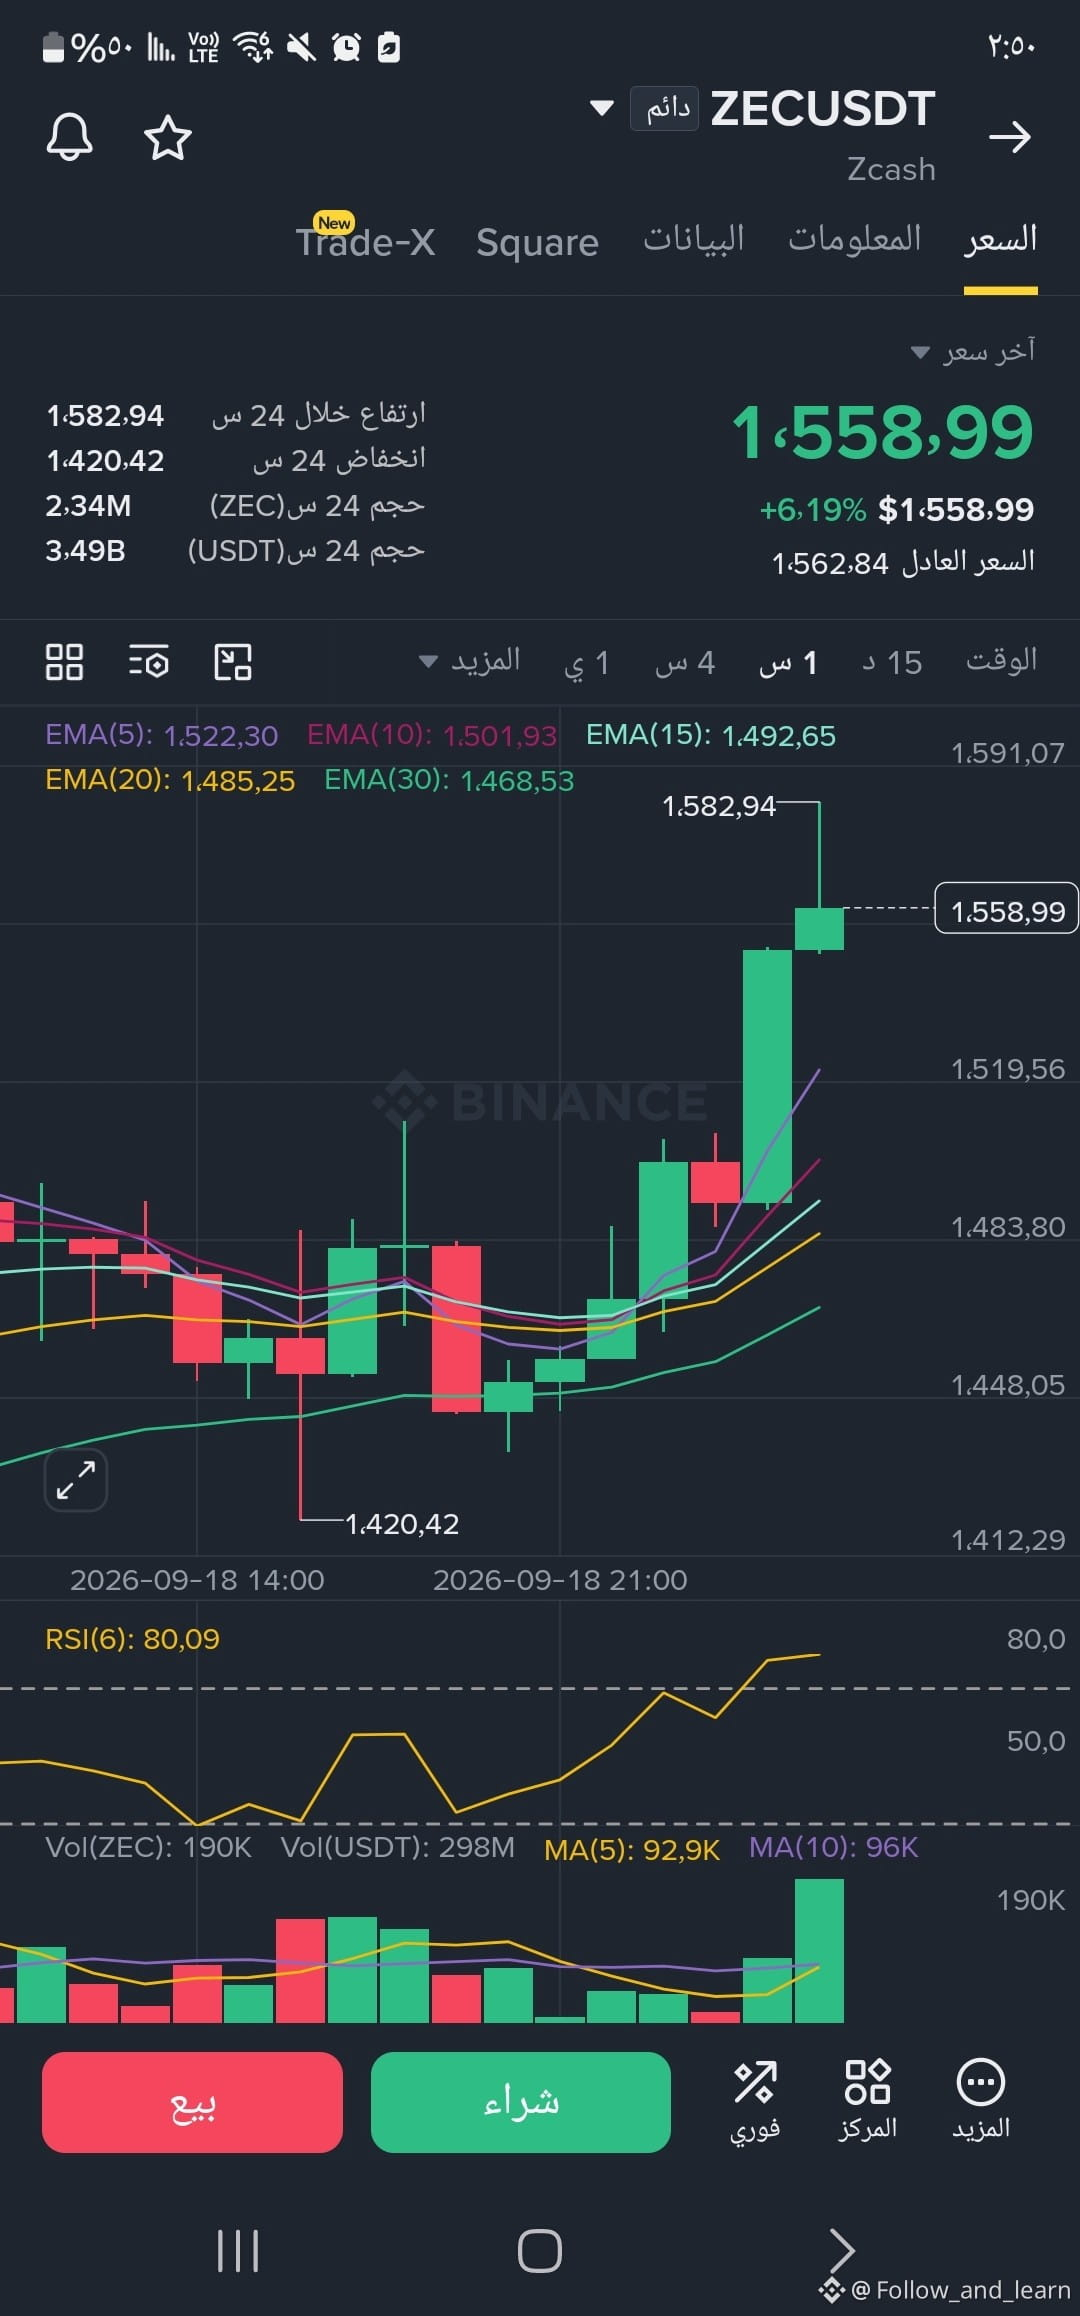
🚀$ZEC : Don’t Fall Into the FOMO Trap! A Quick Analysis and an Action Plan for Beginners 🛑 {future}(ZECUSDT) Seeing rising green candles sparks the urge to enter quickly, but buying at the peaks is the #1 reason beginners lose money. Here’s a practical and straightforward technical snapshot for the ZEC coin: 📊 The Coin’s Technical Reality: • 1-hour timeframe: the RSI indicator has crossed 80 (high overbought) ⚠️, meaning indicators are inflated and the market needs to cool off or correct. • 15-minute timeframe: a healthy correction has started after the strong rise and after touching the 1582.9 high. 🎯 Smart Handling Plan: * Avoid immediate buying: entering at peak zones has high risk. * Wait for the support area: the best retest is likely around the moving average zones (between 1520 - 1530). Entering from these areas offers a much better Risk/Reward ratio. * Trade cautiously: not breaking the 1500 support zone helps ensure the coin’s positive behavior continues. 💡 Tip: Profits don’t come from chasing green candles—they come from the end of red candles and identifying fair entry zones. Always protect your capital by placing a stop-loss order. #ZEC/USDT Share your thoughts: Do you think the coin will continue rising or enter a deeper correction? 👇
🚀$ZEC : Don’t Fall Into the FOMO Trap! A Quick Analysis and an Action Plan for Beginners 🛑
Seeing rising green candles sparks the urge to enter quickly, but buying at the peaks is the #1 reason beginners lose money. Here’s a practical and straightforward technical snapshot for the ZEC coin:
📊 The Coin’s Technical Reality:
• 1-hour timeframe: the RSI indicator has crossed 80 (high overbought) ⚠️, meaning indicators are inflated and the market needs to cool off or correct.
• 15-minute timeframe: a healthy correction has started after the strong rise and after touching the 1582.9 high.
🎯 Smart Handling Plan:
* Avoid immediate buying: entering at peak zones has high risk.
* Wait for the support area: the best retest is likely around the moving average zones (between 1520 - 1530). Entering from these areas offers a much better Risk/Reward ratio.
* Trade cautiously: not breaking the 1500 support zone helps ensure the coin’s positive behavior continues.
💡 Tip:
Profits don’t come from chasing green candles—they come from the end of red candles and identifying fair entry zones. Always protect your capital by placing a stop-loss order.
#ZEC/USDT
Share your thoughts: Do you think the coin will continue rising or enter a deeper correction? 👇
💡 3 golden rules for beginners in such situations: * Don’t chase the upward move: Buying after a +130% rise makes you an easy target for those who want to take profits and exit. * Look for stability: A successful trade doesn’t start during the air-push, but when the price calms down and builds a solid support base. * Risk management first: Don’t put all your capital in—set your goals and your stop-loss before you hit the buy button. The market is full of daily opportunities, and missing one opportunity is better than entering a trade that costs you your capital.
💡 3 golden rules for beginners in such situations:
* Don’t chase the upward move: Buying after a +130% rise makes you an easy target for those who want to take profits and exit.
* Look for stability: A successful trade doesn’t start during the air-push, but when the price calms down and builds a solid support base.
* Risk management first: Don’t put all your capital in—set your goals and your stop-loss before you hit the buy button.
The market is full of daily opportunities, and missing one opportunity is better than entering a trade that costs you your capital.
speculative trader
·
--
$ONE #one
🔥 +130% rise in $ONE.. Are you jumping in now, or waiting? A real lesson from the heart of the market!
I know this feeling well; when you see a huge green candle blasting across the screen and a +130% figure sparkling in front of you, the biggest driver behind all losses whispers in your ear: FOMO (Fear Of Missing Out).
After years of trading, moving between charts and market swings, here’s advice worth its weight in gold: "The candle that burns your eyes with its beautiful green might burn your portfolio if you enter it emotionally!"
📊 Quick technical analysis for $ONE (1-hour frame):
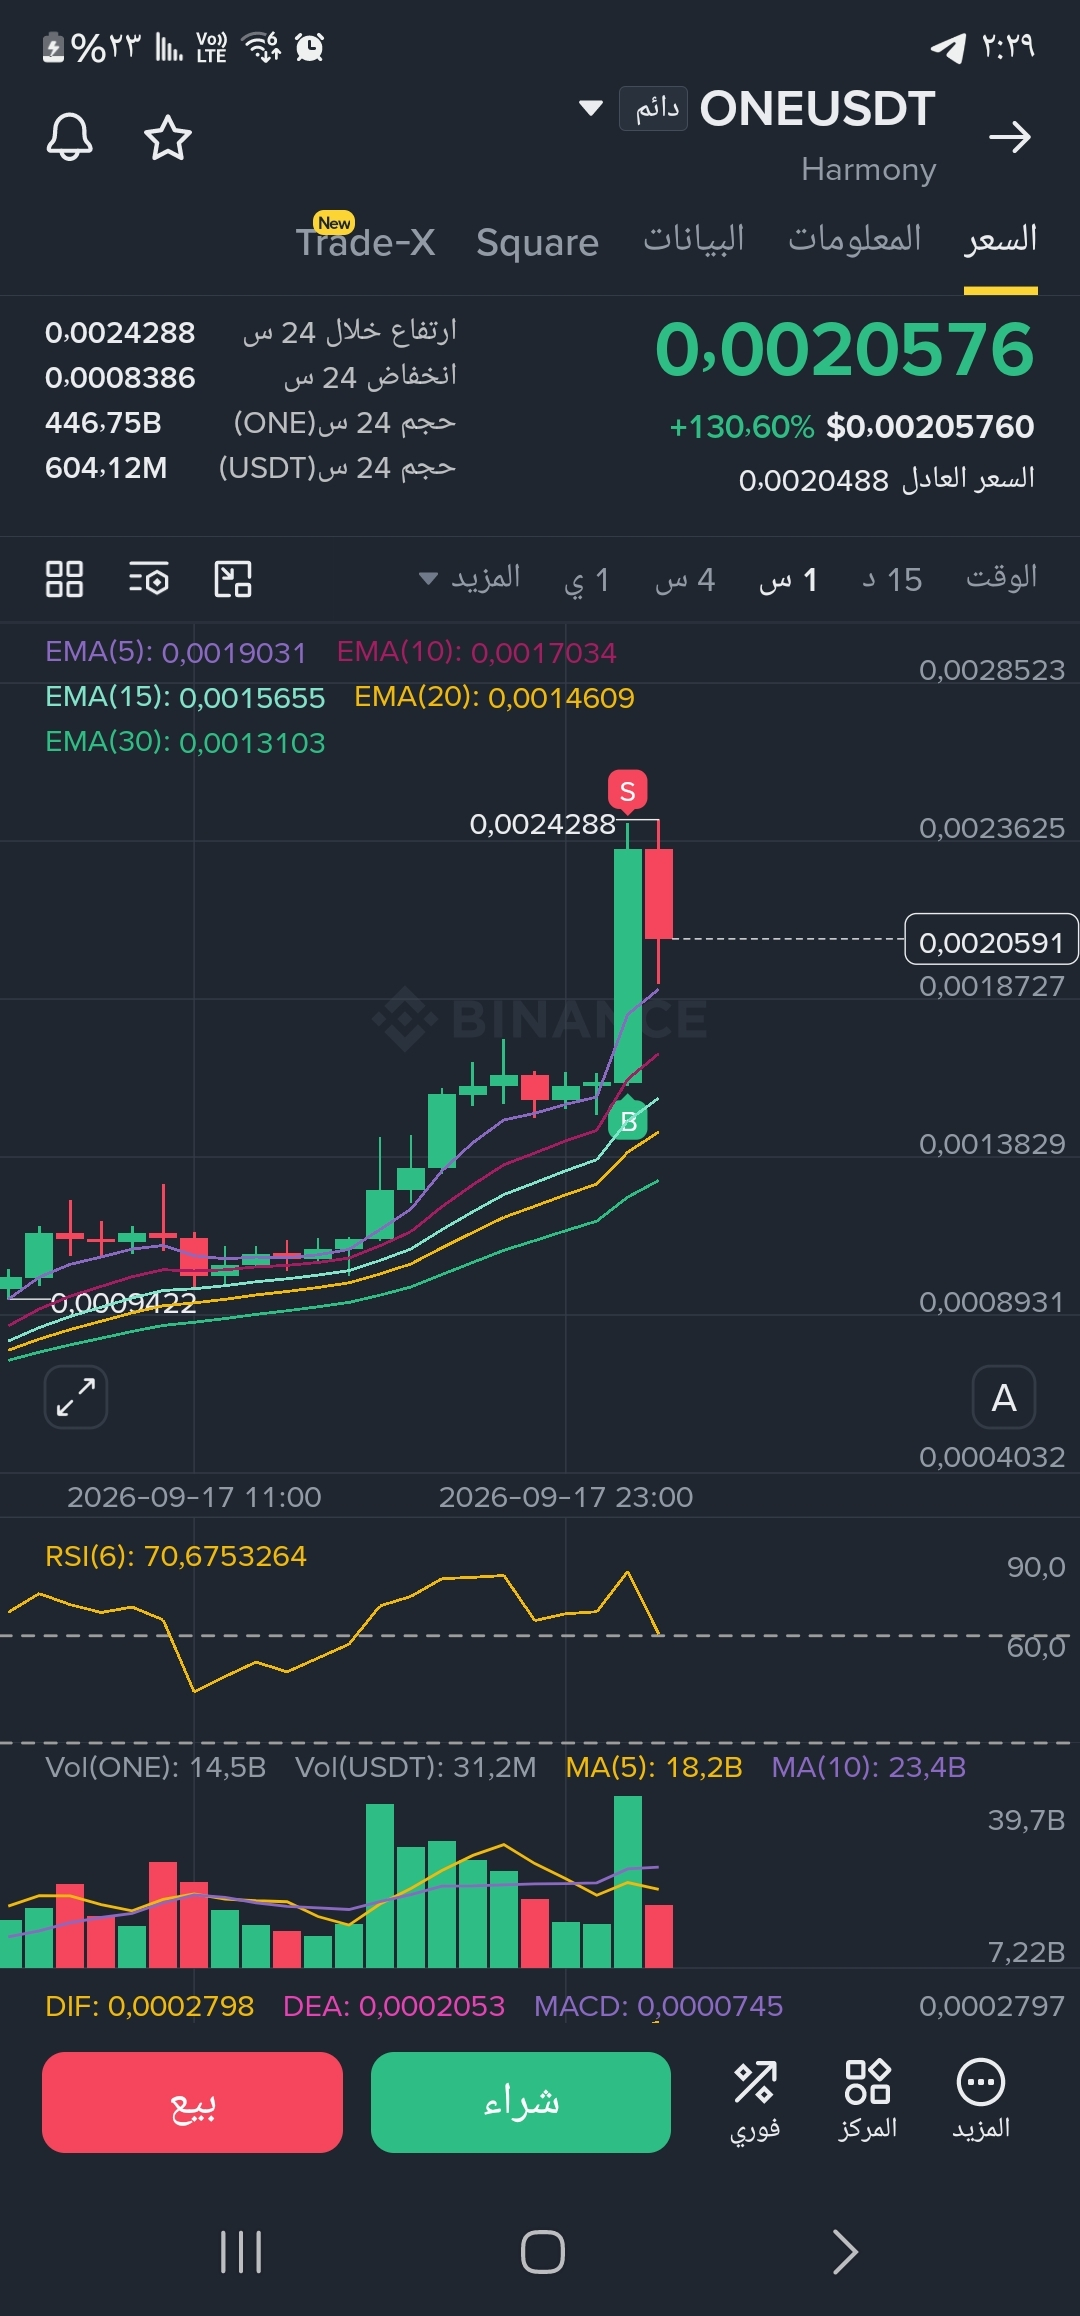
* Price action: Explosive rally lifted the coin from the bottom to a peak at 0.002428, followed by a corrective candle and profit-taking that has pushed the price down toward areas around 0.00205.
* Relative Strength Index (RSI): It has reached very overbought territory (above 80), and is now starting to curve downward to cool the indicator—this is normal and healthy for any sustainable uptrend.
* Moving Averages (EMA): Price is far from its averages, forming EMA(5) at 0.00190 and EMA(10) at 0.00170—these are the first dynamic support zones to watch for price behavior there.
🎯 Key levels to monitor:
* Main resistance: 0.00242 (breaking above it requires massive liquidity and stability above it).
* Support & retest zones: 0.00190 then 0.00170.
$ONE #one 🔥 +130% rise in $ONE.. Are you jumping in now, or waiting? A real lesson from the heart of the market! I know this feeling well; when you see a huge green candle blasting across the screen and a +130% figure sparkling in front of you, the biggest driver behind all losses whispers in your ear: FOMO (Fear Of Missing Out). After years of trading, moving between charts and market swings, here’s advice worth its weight in gold: "The candle that burns your eyes with its beautiful green might burn your portfolio if you enter it emotionally!" 📊 Quick technical analysis for $ONE (1-hour frame): * Price action: Explosive rally lifted the coin from the bottom to a peak at 0.002428, followed by a corrective candle and profit-taking that has pushed the price down toward areas around 0.00205. * Relative Strength Index (RSI): It has reached very overbought territory (above 80), and is now starting to curve downward to cool the indicator—this is normal and healthy for any sustainable uptrend. * Moving Averages (EMA): Price is far from its averages, forming EMA(5) at 0.00190 and EMA(10) at 0.00170—these are the first dynamic support zones to watch for price behavior there. 🎯 Key levels to monitor: * Main resistance: 0.00242 (breaking above it requires massive liquidity and stability above it). * Support & retest zones: 0.00190 then 0.00170.
$ONE #one
🔥 +130% rise in $ONE .. Are you jumping in now, or waiting? A real lesson from the heart of the market!
I know this feeling well; when you see a huge green candle blasting across the screen and a +130% figure sparkling in front of you, the biggest driver behind all losses whispers in your ear: FOMO (Fear Of Missing Out).
After years of trading, moving between charts and market swings, here’s advice worth its weight in gold: "The candle that burns your eyes with its beautiful green might burn your portfolio if you enter it emotionally!"
📊 Quick technical analysis for $ONE (1-hour frame):
* Price action: Explosive rally lifted the coin from the bottom to a peak at 0.002428, followed by a corrective candle and profit-taking that has pushed the price down toward areas around 0.00205.
* Relative Strength Index (RSI): It has reached very overbought territory (above 80), and is now starting to curve downward to cool the indicator—this is normal and healthy for any sustainable uptrend.
* Moving Averages (EMA): Price is far from its averages, forming EMA(5) at 0.00190 and EMA(10) at 0.00170—these are the first dynamic support zones to watch for price behavior there.
🎯 Key levels to monitor:
* Main resistance: 0.00242 (breaking above it requires massive liquidity and stability above it).
* Support & retest zones: 0.00190 then 0.00170.
And its ending is musk with $DOGE for your consideration, I’m a traveler lying down 😴
..
..
speculative trader
·
--
​🔥 September FOMC: What’s the next move for the Federal Reserve?
Federal sessions, for any professional trader, no longer cause the same anxiety as they used to. After years in front of screens, traders learn that the first candle of an FOMC news release is always booby-trapped. Its purpose isn’t to guide the market as much as it is to capture liquidity and settle exposed positions.
Let’s be realistic: the latest CPI indicator came in at 0.3% higher, and markets are currently pricing in something close to a 90% chance of a 25 basis point interest rate hike. The question everyone is asking is: is this the start of a new rate-hike cycle?
Article
​🔥 September FOMC: What’s the next move for the Federal Reserve?Federal sessions, for any professional trader, no longer cause the same anxiety as they used to. After years in front of screens, traders learn that the first candle of an FOMC news release is always booby-trapped. Its purpose isn’t to guide the market as much as it is to capture liquidity and settle exposed positions. Let’s be realistic: the latest CPI indicator came in at 0.3% higher, and markets are currently pricing in something close to a 90% chance of a 25 basis point interest rate hike. The question everyone is asking is: is this the start of a new rate-hike cycle?

​🔥 September FOMC: What’s the next move for the Federal Reserve?

Federal sessions, for any professional trader, no longer cause the same anxiety as they used to. After years in front of screens, traders learn that the first candle of an FOMC news release is always booby-trapped. Its purpose isn’t to guide the market as much as it is to capture liquidity and settle exposed positions.
Let’s be realistic: the latest CPI indicator came in at 0.3% higher, and markets are currently pricing in something close to a 90% chance of a 25 basis point interest rate hike. The question everyone is asking is: is this the start of a new rate-hike cycle?
·
--
Bearish
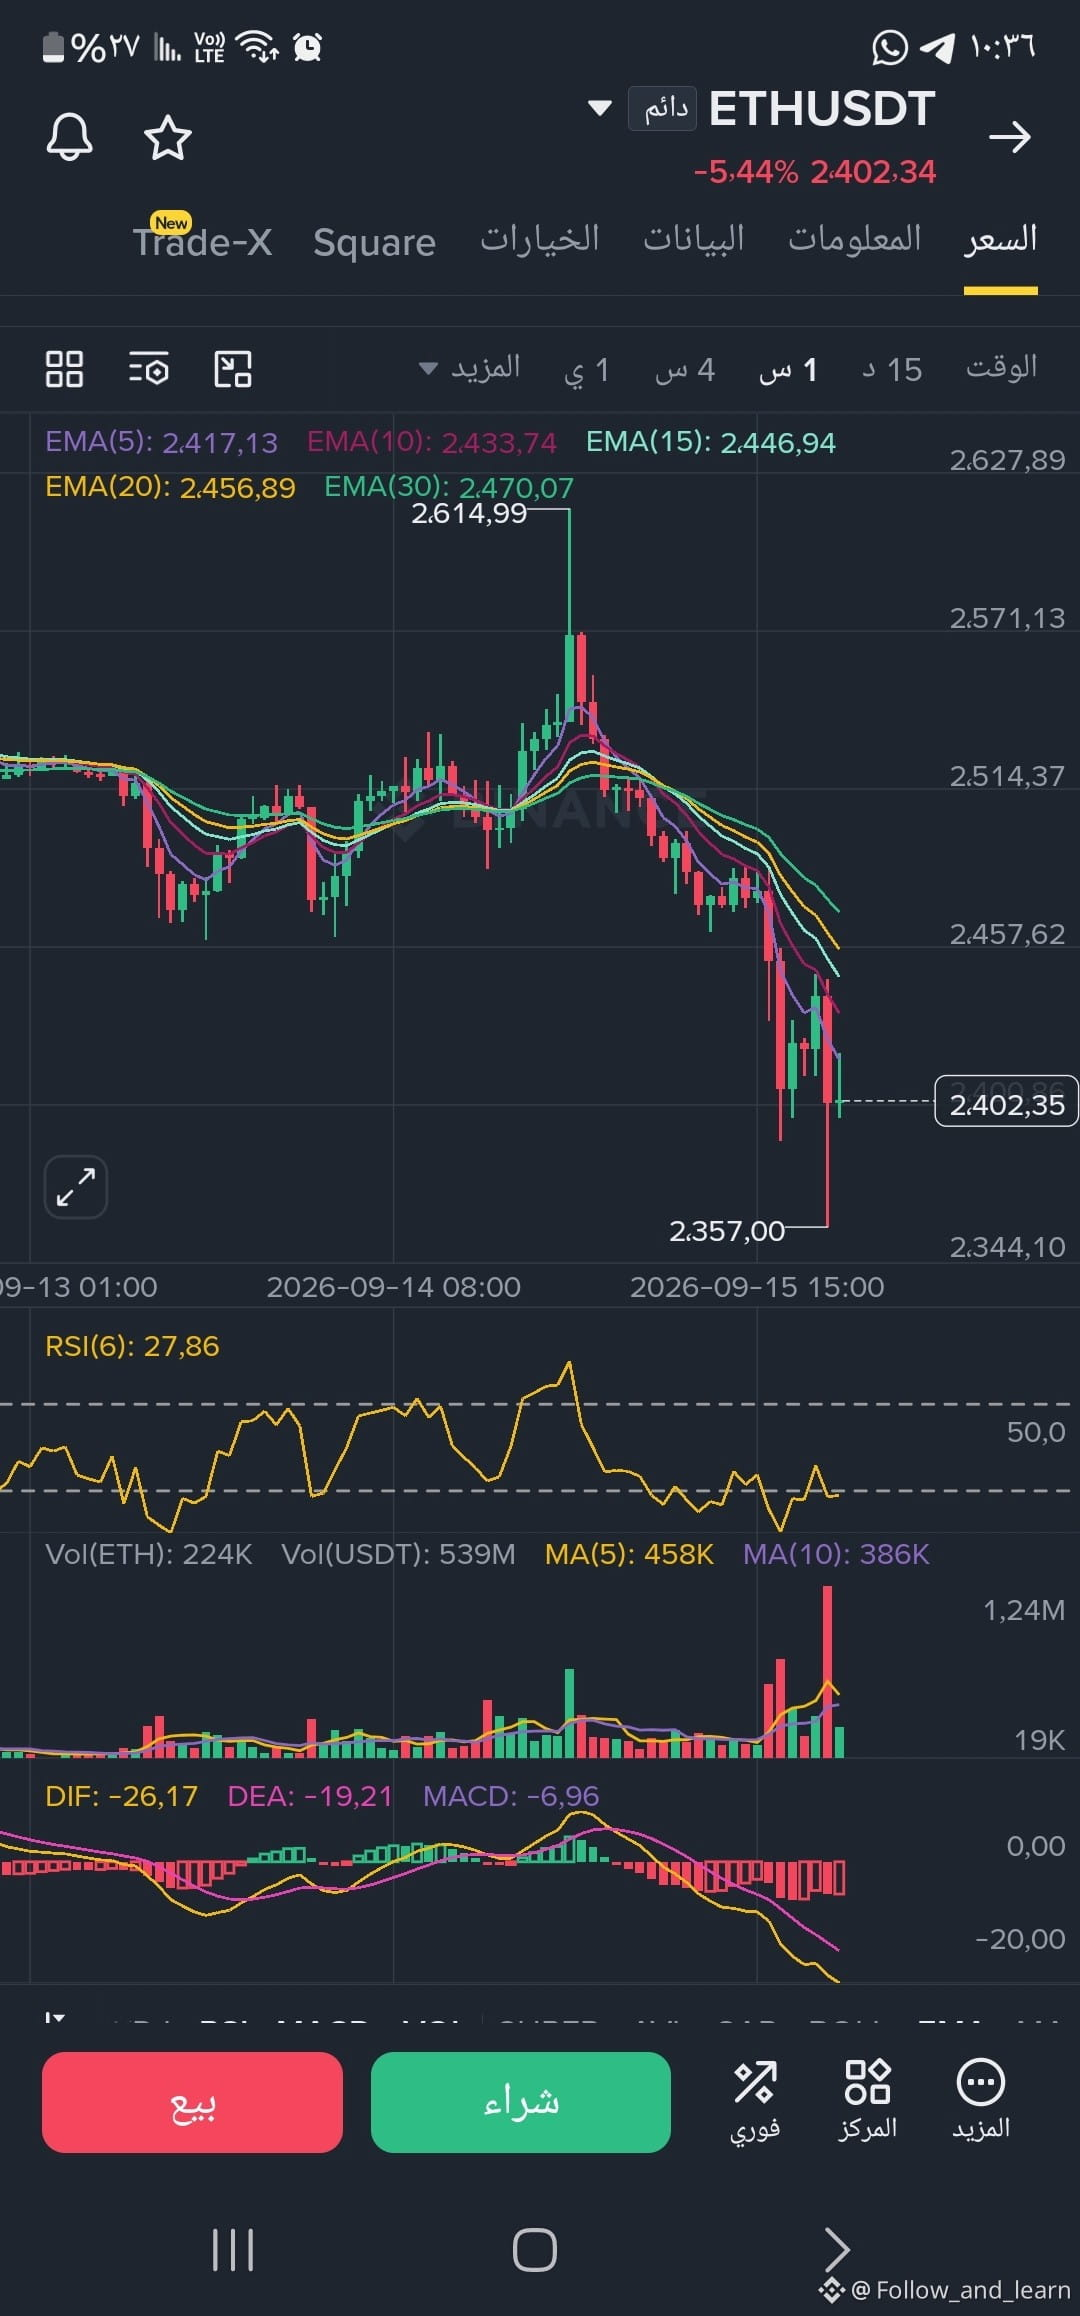
#Ethereum $ETH {future}(ETHUSDT) 🚨 Don’t let red candles steal your peace… Trading is a game of patience and risk management before it becomes numbers! I know that feeling well: the market paints in red, tension starts, and fear pushes you to make emotional, quick decisions. But after many long years in these markets, I can assure you that "the best opportunities are always born out of fear and hesitation". Here is a quick, realistic analysis of the ETH/USDT coin (on the 1-hour timeframe) to align your digital compass: 📊 Brief Technical Analysis: * Current situation: The coin has experienced a sharp correction from the $2,614 peak to a temporary low at $2,357, and is currently trading near $2,402. * Relative Strength Index (RSI 6): It is recording very low levels at 27.86 (oversold zone). Historically, this indicates the likelihood of a temporary speculative rebound (Bounce). * Moving Averages (EMA): Price is trading below all moving averages (EMA 5, 10, 20, 30), meaning downward momentum is still the most direct and dominant in the short term. * Support and Resistance levels: * First support: $2,357 (the last low—keeping it is essential for price stability). * First resistance: $2,435 - $2,450 (a range to break above the moving averages and restore balance). 💡 A piece of practical experience advice for beginners: * Don’t chase the market out of fear (FOMO or Panic): a sharp drop doesn’t mean you should buy all at once, and it doesn’t mean you should sell at a loss just because you’re afraid.
#Ethereum $ETH
🚨 Don’t let red candles steal your peace… Trading is a game of patience and risk management before it becomes numbers!
I know that feeling well: the market paints in red, tension starts, and fear pushes you to make emotional, quick decisions. But after many long years in these markets, I can assure you that "the best opportunities are always born out of fear and hesitation".
Here is a quick, realistic analysis of the ETH/USDT coin (on the 1-hour timeframe) to align your digital compass:
📊 Brief Technical Analysis:
* Current situation: The coin has experienced a sharp correction from the $2,614 peak to a temporary low at $2,357, and is currently trading near $2,402.
* Relative Strength Index (RSI 6): It is recording very low levels at 27.86 (oversold zone). Historically, this indicates the likelihood of a temporary speculative rebound (Bounce).
* Moving Averages (EMA): Price is trading below all moving averages (EMA 5, 10, 20, 30), meaning downward momentum is still the most direct and dominant in the short term.
* Support and Resistance levels:
* First support: $2,357 (the last low—keeping it is essential for price stability).
* First resistance: $2,435 - $2,450 (a range to break above the moving averages and restore balance).
💡 A piece of practical experience advice for beginners:
* Don’t chase the market out of fear (FOMO or Panic): a sharp drop doesn’t mean you should buy all at once, and it doesn’t mean you should sell at a loss just because you’re afraid.
Log in to explore more content
Join global crypto users on Binance Square
⚡️ Get latest and useful information about crypto.
💬 Trusted by the world’s largest crypto exchange.
👍 Discover real insights from verified creators.
Email / Phone number
Sitemap
Cookie Preferences
Platform T&Cs