🎭 The screen is red... will you fall into the trap or seize the opportunity?
When you see a coin drop more than 29\% in a single day, your mind goes through two stages:
1️⃣ Fear (Panic): "The market is collapsing—I’ll sell everything to protect what’s left!"
2️⃣ Revenge Trading: "The coin is at the bottom—I’ll enter right now with all my capital to make up for the loss!"
Both of these feelings are the #1 reason 90\% of beginner traders go bankrupt. Real trading isn’t gambling on the next candle—it’s patience and waiting for the right moment.
Let’s read the chart of coin $TAKE with an expert’s eyes, not a novice’s emotion:
📉 What does the chart tell us right now?
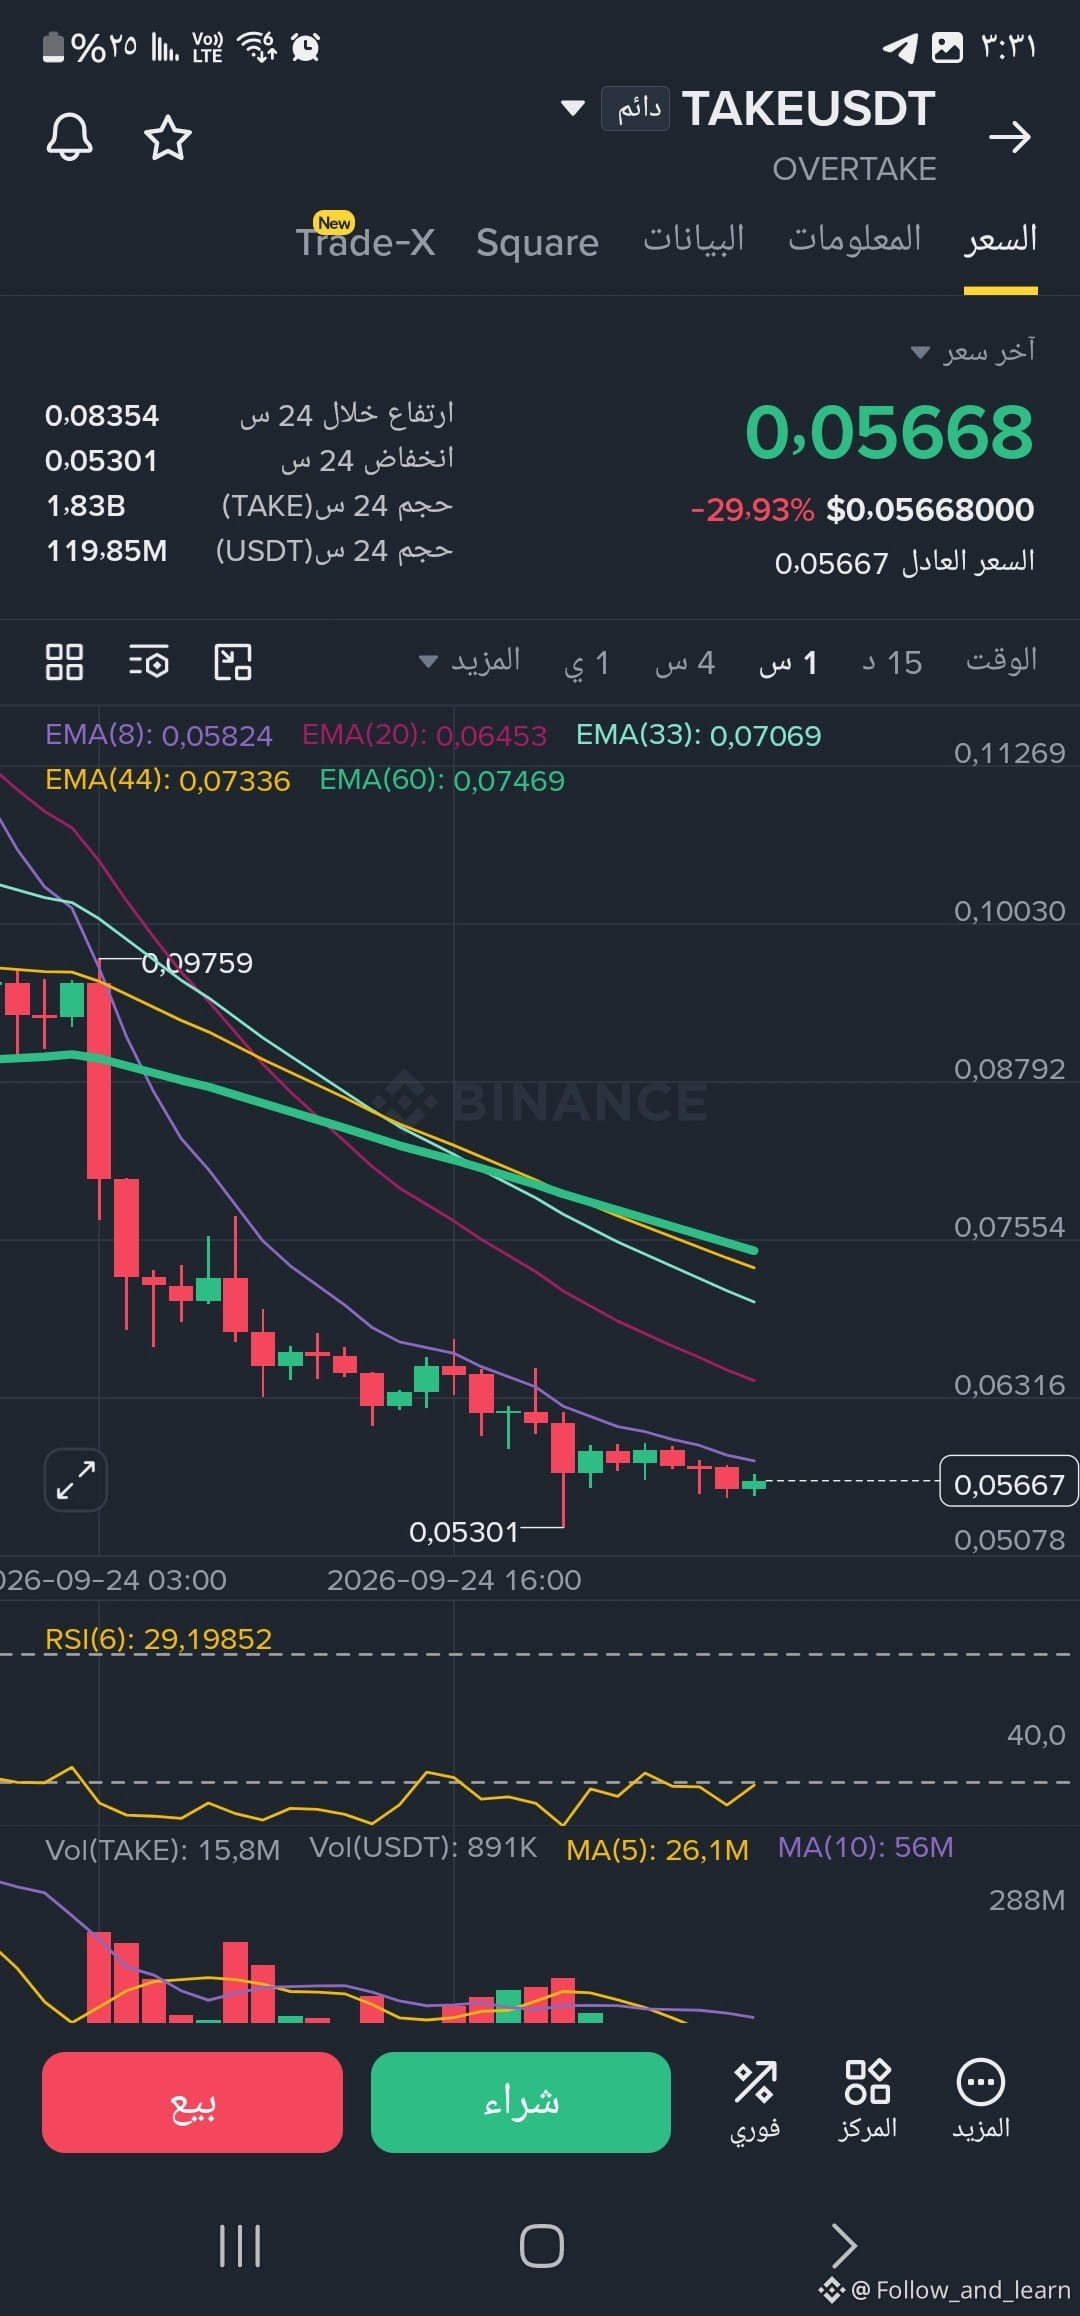
* The market is exhausted on the sell side: the RSI indicator on the 1-hour timeframe has dropped below 30, meaning sellers have drained most of their power. Entering a short trade late in these zones is like jumping off a train that’s already going at full speed.
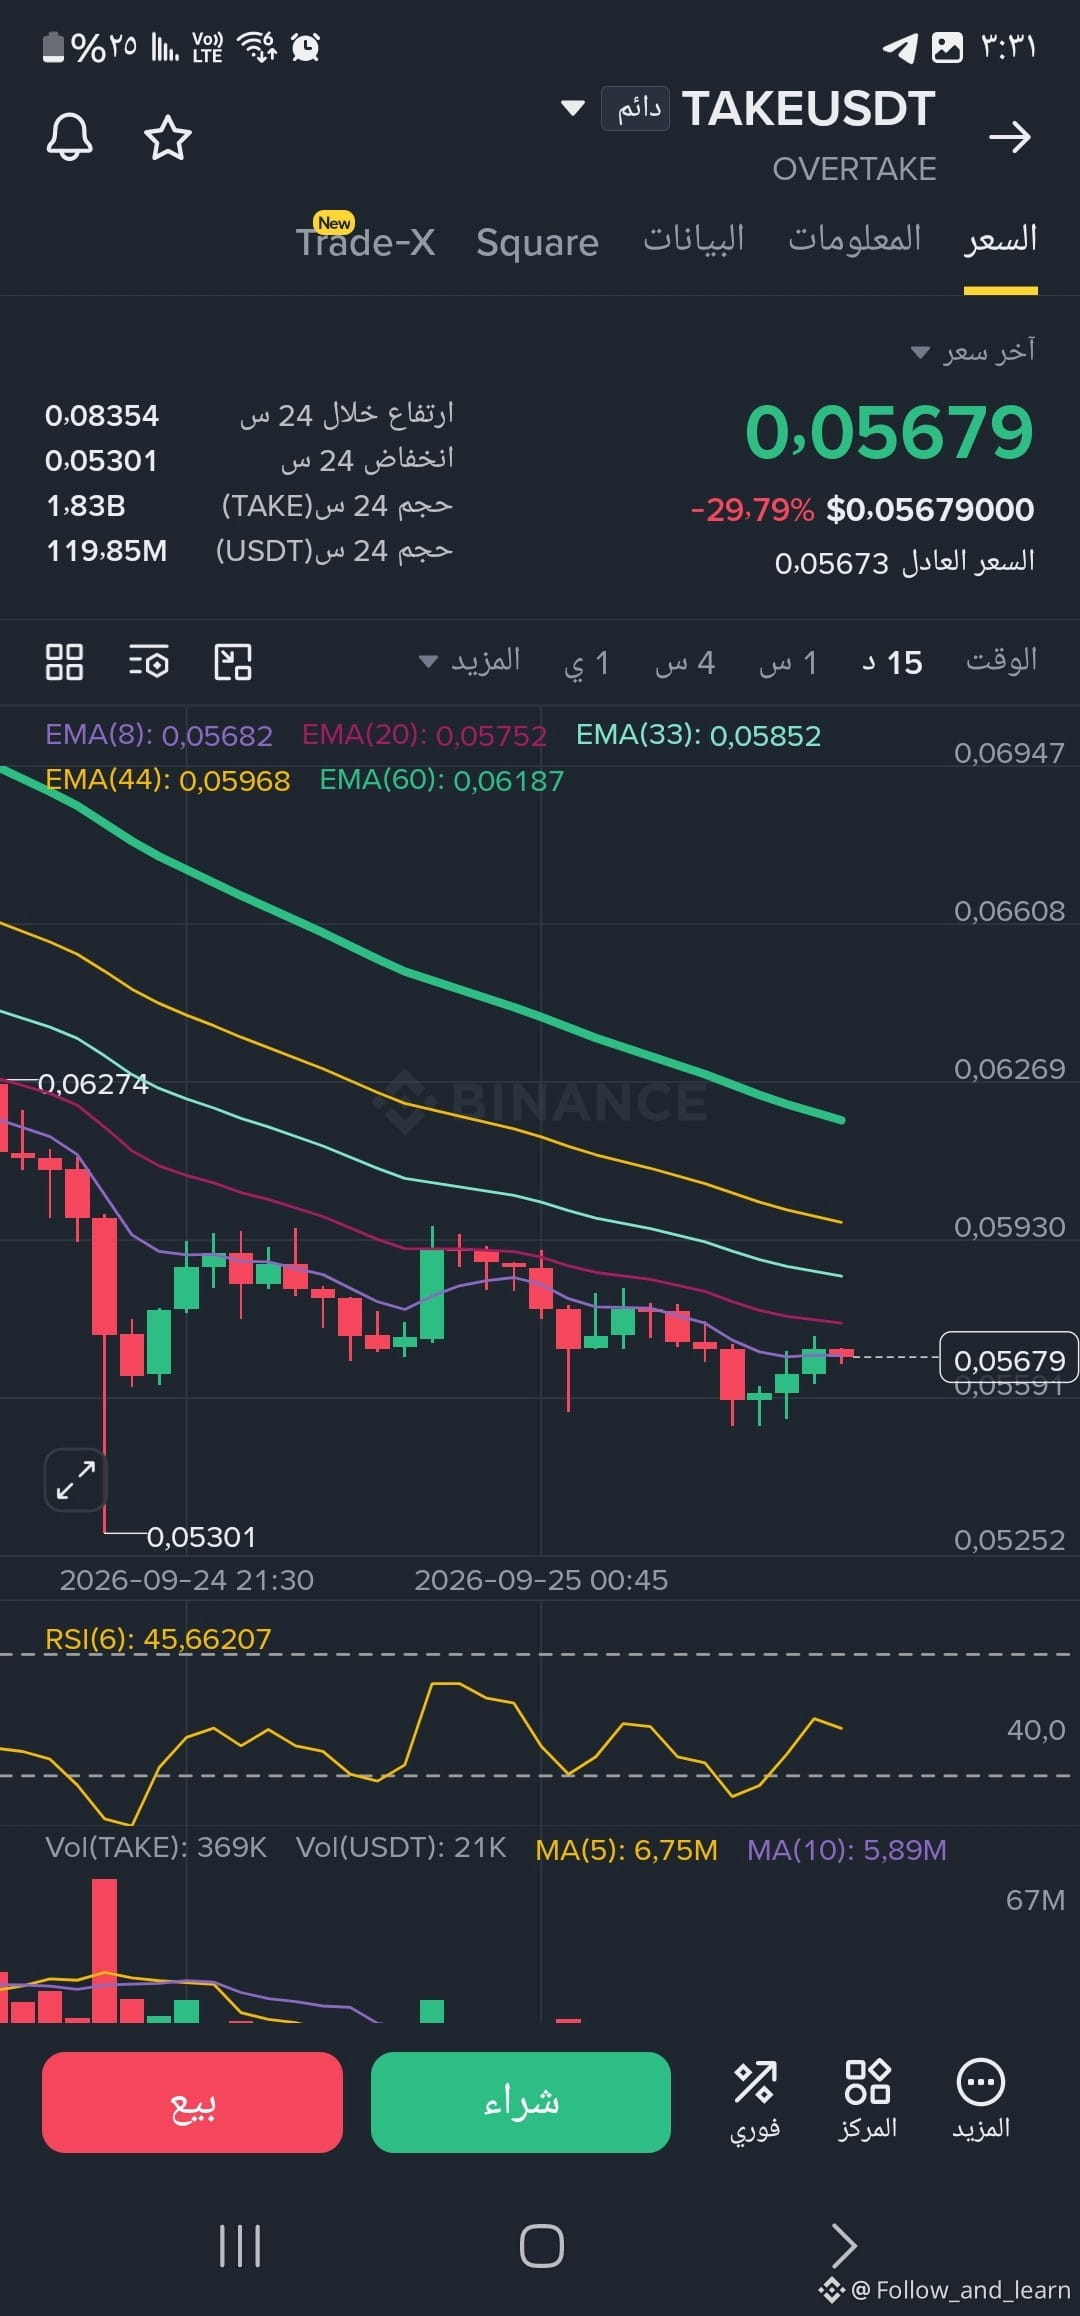
* A battle at the critical zone: the price is trying to hold above the $0.0530 area. This zone is currently the buyer’s last line of defense.
* Resistance blocking the rise: any bounce in the range between $0.0585 and $0.0595 will run into moving averages (EMA)—the areas that professionals look at to reassess the trend.
💡 Don’t enter because you "feel" the price will go up or down.
If you want to buy, wait for a clear reversal signal with a candle close that confirms strong buying.
If you want to sell with the bearish trend, don’t chase the bottom—wait for a pullback where your targets are clear.
When you see a coin drop more than 29\% in a single day, your mind goes through two stages:
1️⃣ Fear (Panic): "The market is collapsing—I’ll sell everything to protect what’s left!"
2️⃣ Revenge Trading: "The coin is at the bottom—I’ll enter right now with all my capital to make up for the loss!"
Both of these feelings are the #1 reason 90\% of beginner traders go bankrupt. Real trading isn’t gambling on the next candle—it’s patience and waiting for the right moment.
Let’s read the chart of coin $TAKE with an expert’s eyes, not a novice’s emotion:
📉 What does the chart tell us right now?
* The market is exhausted on the sell side: the RSI indicator on the 1-hour timeframe has dropped below 30, meaning sellers have drained most of their power. Entering a short trade late in these zones is like jumping off a train that’s already going at full speed.
* A battle at the critical zone: the price is trying to hold above the $0.0530 area. This zone is currently the buyer’s last line of defense.
* Resistance blocking the rise: any bounce in the range between $0.0585 and $0.0595 will run into moving averages (EMA)—the areas that professionals look at to reassess the trend.
💡 Don’t enter because you "feel" the price will go up or down.
If you want to buy, wait for a clear reversal signal with a candle close that confirms strong buying.
If you want to sell with the bearish trend, don’t chase the bottom—wait for a pullback where your targets are clear.