
Crypto box 007
110 Posts

Crypto box 007
Report
Block User
Crypto Analyst | Technical Trader. Sharing market insights & chart analysis. Not financial advice. DYOR
Open Trade
Frequent Trader
4.7 Years
15 Following
23 Followers
91 Liked
Posts
Portfolio
All
Quotes
Sui’s stablecoin market cap increased by 1.79% over the past 7 days, reaching $550.23 million, according to DefiLlama.
USDC dominates the ecosystem, accounting for 69.27% of the total stablecoin market cap.
A positive sign of growing stablecoin activity within the Sui ecosystem.
#SuiNetwork #SUI #Stablecoins #Crypto
Sui’s stablecoin market cap increased by 1.79% over the past 7 days, reaching $550.23 million, according to DefiLlama.
USDC dominates the ecosystem, accounting for 69.27% of the total stablecoin market cap.
A positive sign of growing stablecoin activity within the Sui ecosystem.
#SuiNetwork #SUI #Stablecoins #Crypto
USDC dominates the ecosystem, accounting for 69.27% of the total stablecoin market cap.
A positive sign of growing stablecoin activity within the Sui ecosystem.
#SuiNetwork #SUI #Stablecoins #Crypto

1
3
819
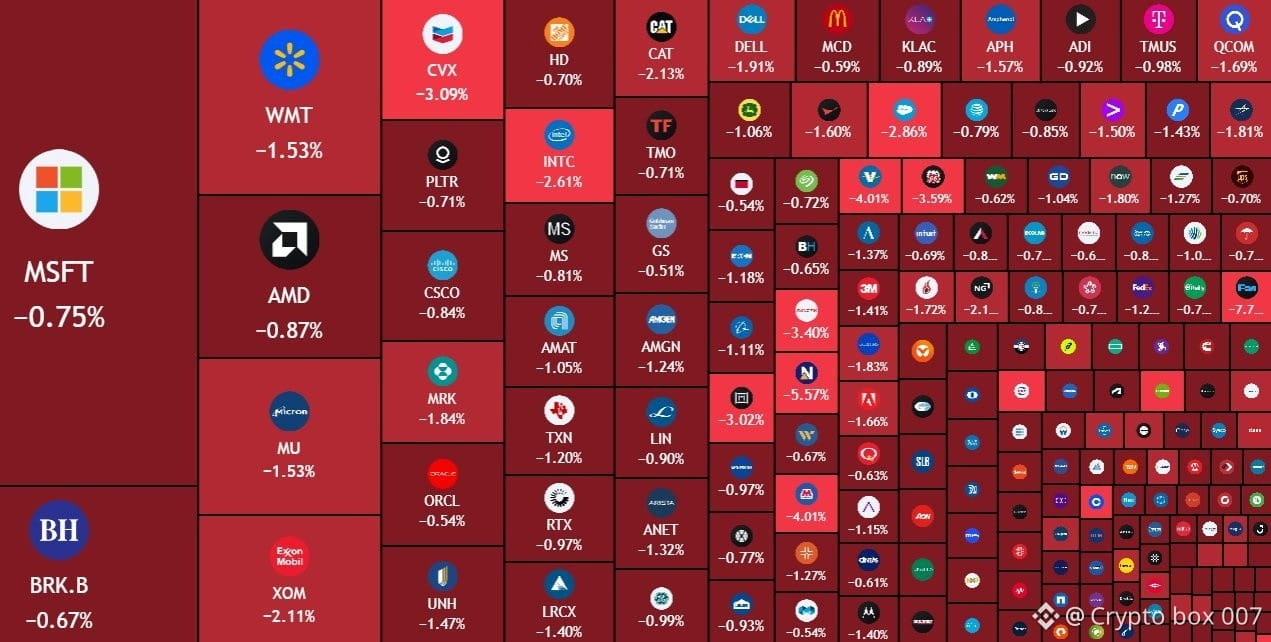
Breaking : Over $500,000,000,000 wiped out from the US stock market in just 10 minutes.
#USstock
Breaking : Over $500,000,000,000 wiped out from the US stock market in just 10 minutes.
#USstock
#USstock
1
292
30D trade $BTC 1.6K USDT
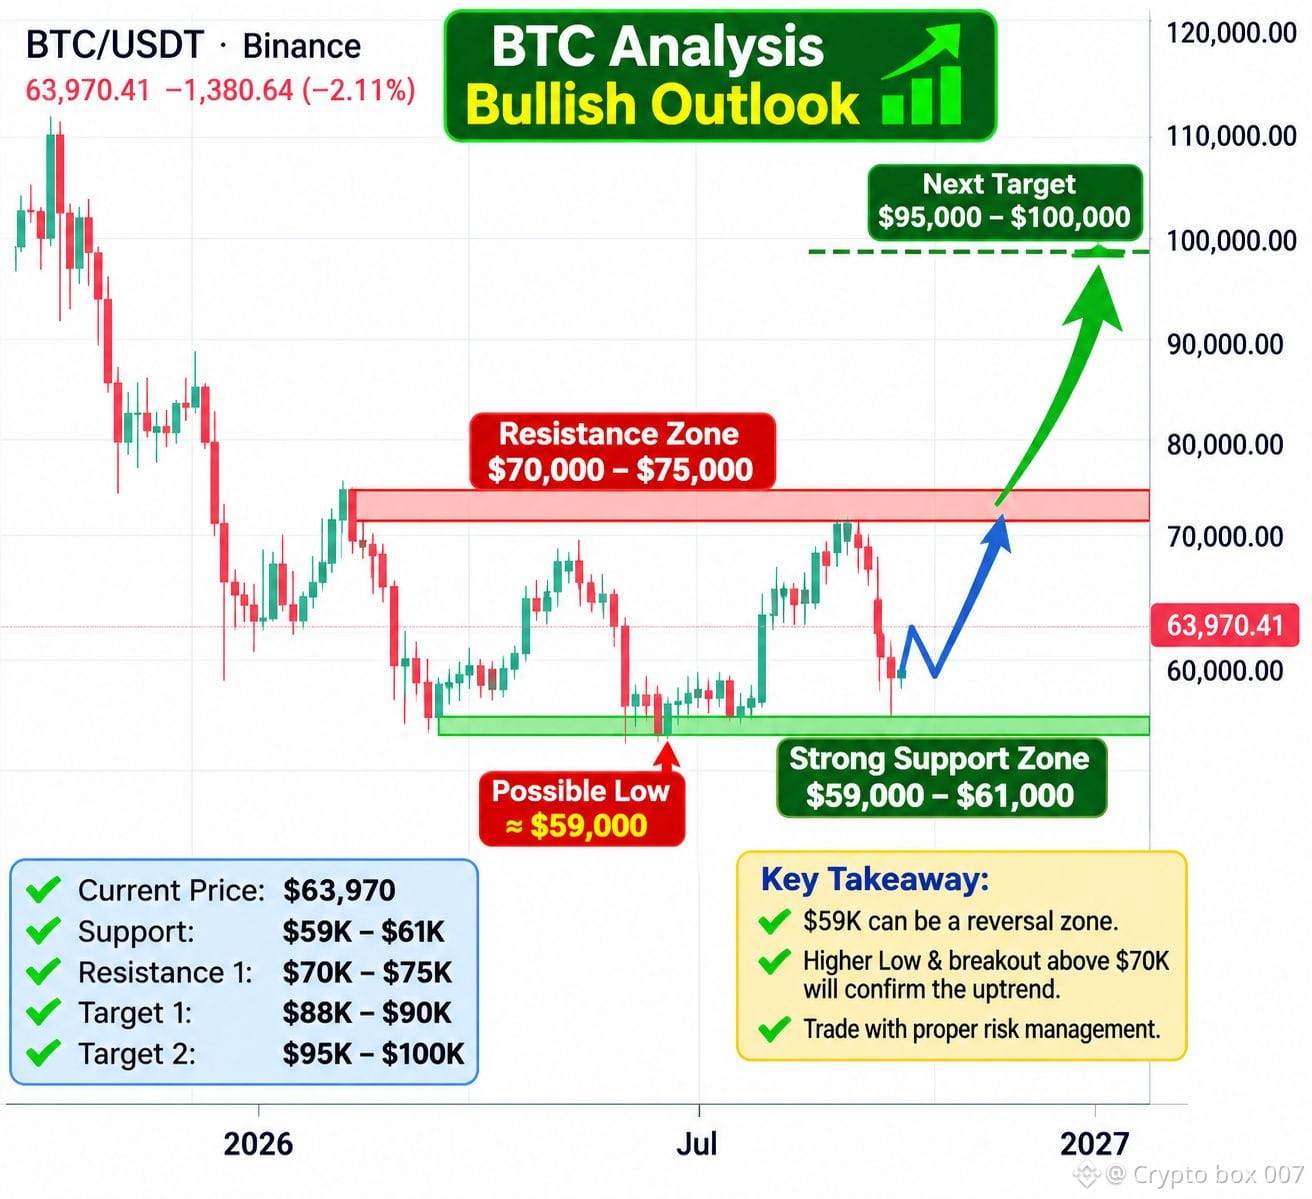
BTC/USDT Weekly Analysis: A Potential Bottom Near $59,000 Before the Next Uptrend?
Bitcoin is currently trading around $63,970, showing significant bearish pressure on the weekly timeframe.
Based on the provided Binance weekly chart, BTC remains in a broader downtrend, with lower highs and strong selling pressure.
Key Technical Levels
Current Price: $63,970
Major Support Zone: $59,000–$61,000
Potential Bottom: Around $59,000
Resistance 1: $70,000–$75,000
Upside Target 1: $88,000–$90,000
Upside Target 2: $95,000–$100,000
My Market Outlook
I believe Bitcoin could revisit the $59,000–$61,000 region before establishing a stronger recovery.
If buyers defend this support zone and BTC forms a confirmed higher low, a bullish reversal could develop.
The first major challenge would be reclaiming the $70,000–$75,000 resistance zone. A confirmed weekly breakout above this area could open the door toward $88,000–$90,000, followed by the $95,000–$100,000 region.
What Could Invalidate This Scenario?
A strong weekly close below $59,000 would weaken this bullish outlook and increase the risk of further downside.
My Strategy: Watch the $59K–$61K support zone closely. Wait for confirmation of buying pressure rather than entering blindly.
Bitcoin may be approaching an important turning point, but patience and risk management remain essential.
This is a technical market outlook, not a guaranteed price prediction or financial advice.
#BTC #BTC突破7万大关 #bitcoin $BTC
BTC/USDT Weekly Analysis: A Potential Bottom Near $59,000 Before the Next Uptrend?
Bitcoin is currently trading around $63,970, showing significant bearish pressure on the weekly timeframe.
Based on the provided Binance weekly chart, BTC remains in a broader downtrend, with lower highs and strong selling pressure.
Key Technical Levels
Current Price: $63,970
Major Support Zone: $59,000–$61,000
Potential Bottom: Around $59,000
Resistance 1: $70,000–$75,000
Upside Target 1: $88,000–$90,000
Upside Target 2: $95,000–$100,000
My Market Outlook
I believe Bitcoin could revisit the $59,000–$61,000 region before establishing a stronger recovery.
If buyers defend this support zone and BTC forms a confirmed higher low, a bullish reversal could develop.
The first major challenge would be reclaiming the $70,000–$75,000 resistance zone. A confirmed weekly breakout above this area could open the door toward $88,000–$90,000, followed by the $95,000–$100,000 region.
What Could Invalidate This Scenario?
A strong weekly close below $59,000 would weaken this bullish outlook and increase the risk of further downside.
My Strategy: Watch the $59K–$61K support zone closely. Wait for confirmation of buying pressure rather than entering blindly.
Bitcoin may be approaching an important turning point, but patience and risk management remain essential.
This is a technical market outlook, not a guaranteed price prediction or financial advice.
#BTC #BTC突破7万大关 #bitcoin $BTC
Bitcoin is currently trading around $63,970, showing significant bearish pressure on the weekly timeframe.
Based on the provided Binance weekly chart, BTC remains in a broader downtrend, with lower highs and strong selling pressure.
Key Technical Levels
Current Price: $63,970
Major Support Zone: $59,000–$61,000
Potential Bottom: Around $59,000
Resistance 1: $70,000–$75,000
Upside Target 1: $88,000–$90,000
Upside Target 2: $95,000–$100,000
My Market Outlook
I believe Bitcoin could revisit the $59,000–$61,000 region before establishing a stronger recovery.
If buyers defend this support zone and BTC forms a confirmed higher low, a bullish reversal could develop.
The first major challenge would be reclaiming the $70,000–$75,000 resistance zone. A confirmed weekly breakout above this area could open the door toward $88,000–$90,000, followed by the $95,000–$100,000 region.
What Could Invalidate This Scenario?
A strong weekly close below $59,000 would weaken this bullish outlook and increase the risk of further downside.
My Strategy: Watch the $59K–$61K support zone closely. Wait for confirmation of buying pressure rather than entering blindly.
Bitcoin may be approaching an important turning point, but patience and risk management remain essential.
This is a technical market outlook, not a guaranteed price prediction or financial advice.
#BTC #BTC突破7万大关 #bitcoin $BTC
1
2
744
Article
XRP: The Next 10X Opportunity? Is a Massive Bull Run Coming?XRP: Could the Next Bull Run Deliver a 3x to 10x Rally?
XRP may be preparing for its next major move. Are investors overlooking a potential opportunity?
Looking at the monthly chart, XRP is trading around $0.98 after experiencing a significant correction from its previous highs.
However, major corrections have historically created opportunities for long-term investors willing to manage risk and wait for the next market cycle.
1. Monthly Chart: A Potential Recovery Setup
XRP has experienced a substantial decline from its previous peak near the $3–$3.50 region.
The current price area around $0.95–$1.00 is an important zone to monitor.
If XRP establishes a strong monthly recovery and reclaims the $1.50 and $2.00 levels, bullish momentum could gradually strengthen.
2. Why XRP Could Perform Strongly
Several factors could support XRP's long-term growth:
Growing interest in blockchain-based cross-border payments.
Expansion of the XRP Ledger ecosystem.
Greater institutional participation in digital assets.
Potential growth in regulated investment products.
A strong recovery in the overall cryptocurrency market.
These factors could contribute to renewed demand, although network adoption does not automatically translate into higher XRP prices.
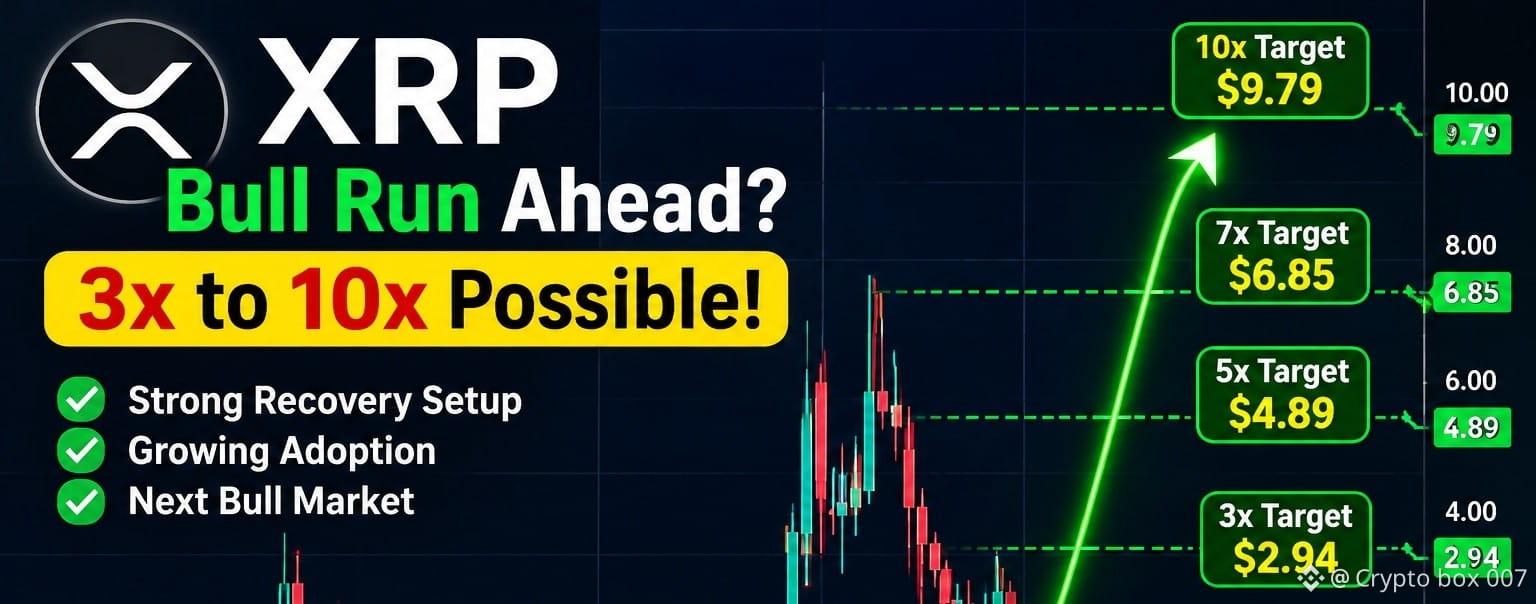
3. My Bullish Price Scenarios
If the next major crypto bull market brings strong liquidity and renewed demand for altcoins, XRP could potentially target:
$2.94: Approximately 3x
$4.89: Approximately 5x
$6.85: Approximately 7x
$9.79: Approximately 10x
These are speculative bull-market scenarios, not guaranteed price predictions.
4. What Could Invalidate This Bullish Outlook?
Investors should monitor the $0.90–$0.95 support region.
A sustained breakdown below this area could open the door to further downside.
On the upside, reclaiming $1.50 and subsequently $2.00 with strong volume would provide more convincing evidence of a trend reversal.
Final Thoughts
I believe XRP deserves serious attention ahead of the next potential altcoin bull run.
A move toward $3 could represent a realistic bullish scenario if market conditions improve. A move toward $5–$10 would require significantly stronger demand, liquidity and adoption.
The opportunity could be substantial, but so is the risk.
Don't chase green candles. Watch the monthly structure, manage your risk, and think beyond short-term price movements.
Could XRP reach $5 or even $10 in the next major bull run? What do you think? Drop your opinion... 👇👇👇
#XRP #Ripple #Crypto #Altcoin #BullRun
XRP: The Next 10X Opportunity? Is a Massive Bull Run Coming?
XRP: Could the Next Bull Run Deliver a 3x to 10x Rally?
XRP may be preparing for its next major move. Are investors overlooking a potential opportunity?
Looking at the monthly chart, XRP is trading around $0.98 after experiencing a significant correction from its previous highs.
However, major corrections have historically created opportunities for long-term investors willing to manage risk and wait for the next market cycle.
1. Monthly Chart: A Potential Recovery Setup
XRP has experienced a substantial decline from its previous peak near the $3–$3.50 region.
The current price area around $0.95–$1.00 is an important zone to monitor.
If XRP establishes a strong monthly recovery and reclaims the $1.50 and $2.00 levels, bullish momentum could gradually strengthen.
2. Why XRP Could Perform Strongly
Several factors could support XRP's long-term growth:
Growing interest in blockchain-based cross-border payments.
Expansion of the XRP Ledger ecosystem.
Greater institutional participation in digital assets.
Potential growth in regulated investment products.
A strong recovery in the overall cryptocurrency market.
These factors could contribute to renewed demand, although network adoption does not automatically translate into higher XRP prices.
3. My Bullish Price Scenarios
If the next major crypto bull market brings strong liquidity and renewed demand for altcoins, XRP could potentially target:
$2.94: Approximately 3x
$4.89: Approximately 5x
$6.85: Approximately 7x
$9.79: Approximately 10x
These are speculative bull-market scenarios, not guaranteed price predictions.
4. What Could Invalidate This Bullish Outlook?
Investors should monitor the $0.90–$0.95 support region.
A sustained breakdown below this area could open the door to further downside.
On the upside, reclaiming $1.50 and subsequently $2.00 with strong volume would provide more convincing evidence of a trend reversal.
Final Thoughts
I believe XRP deserves serious attention ahead of the next potential altcoin bull run.
A move toward $3 could represent a realistic bullish scenario if market conditions improve. A move toward $5–$10 would require significantly stronger demand, liquidity and adoption.
The opportunity could be substantial, but so is the risk.
Don't chase green candles. Watch the monthly structure, manage your risk, and think beyond short-term price movements.
Could XRP reach $5 or even $10 in the next major bull run? What do you think? Drop your opinion... 👇👇👇
#XRP #Ripple #Crypto #Altcoin #BullRun
XRP may be preparing for its next major move. Are investors overlooking a potential opportunity?
Looking at the monthly chart, XRP is trading around $0.98 after experiencing a significant correction from its previous highs.
However, major corrections have historically created opportunities for long-term investors willing to manage risk and wait for the next market cycle.
1. Monthly Chart: A Potential Recovery Setup
XRP has experienced a substantial decline from its previous peak near the $3–$3.50 region.
The current price area around $0.95–$1.00 is an important zone to monitor.
If XRP establishes a strong monthly recovery and reclaims the $1.50 and $2.00 levels, bullish momentum could gradually strengthen.
2. Why XRP Could Perform Strongly
Several factors could support XRP's long-term growth:
Growing interest in blockchain-based cross-border payments.
Expansion of the XRP Ledger ecosystem.
Greater institutional participation in digital assets.
Potential growth in regulated investment products.
A strong recovery in the overall cryptocurrency market.
These factors could contribute to renewed demand, although network adoption does not automatically translate into higher XRP prices.
3. My Bullish Price Scenarios
If the next major crypto bull market brings strong liquidity and renewed demand for altcoins, XRP could potentially target:
$2.94: Approximately 3x
$4.89: Approximately 5x
$6.85: Approximately 7x
$9.79: Approximately 10x
These are speculative bull-market scenarios, not guaranteed price predictions.
4. What Could Invalidate This Bullish Outlook?
Investors should monitor the $0.90–$0.95 support region.
A sustained breakdown below this area could open the door to further downside.
On the upside, reclaiming $1.50 and subsequently $2.00 with strong volume would provide more convincing evidence of a trend reversal.
Final Thoughts
I believe XRP deserves serious attention ahead of the next potential altcoin bull run.
A move toward $3 could represent a realistic bullish scenario if market conditions improve. A move toward $5–$10 would require significantly stronger demand, liquidity and adoption.
The opportunity could be substantial, but so is the risk.
Don't chase green candles. Watch the monthly structure, manage your risk, and think beyond short-term price movements.
Could XRP reach $5 or even $10 in the next major bull run? What do you think? Drop your opinion... 👇👇👇
#XRP #Ripple #Crypto #Altcoin #BullRun
7
24
15.8k
BITCOIN COULD REACH $250,000 BY 2028 — IS NOW THE TIME TO BUY?Bitcoin remains one of the most interesting long-term investment opportunities in the crypto market. Could BTC reach $250,000 by 2028? I believe this is an ambitious but achievable bullish scenario.
Here is why investors should pay attention:
🔹 Limited Supply: Bitcoin has a maximum supply of just 21 million coins.
🔹 Institutional Demand: Growing institutional interest could bring significant capital into the Bitcoin market.
🔹 Bitcoin Halving: Reduced new supply following halving events could support long-term price appreciation if demand continues growing.
🔹 Global Adoption: Increasing recognition of Bitcoin as a digital asset could strengthen its position in the global financial system.
My long-term outlook remains bullish. Investors who believe in Bitcoin's future may consider accumulating BTC gradually rather than chasing sudden price movements.
My Target: $250,000 by 2028! 🎯
Remember: No target is guaranteed. Always do your own research, manage risk, and never invest money you cannot afford to lose.
#Bitcoin #BTC #CryptoInvestment #BullRun #BTC250K $BTC
BITCOIN COULD REACH $250,000 BY 2028 — IS NOW THE TIME TO BUY?
Bitcoin remains one of the most interesting long-term investment opportunities in the crypto market. Could BTC reach $250,000 by 2028? I believe this is an ambitious but achievable bullish scenario.
Here is why investors should pay attention:
🔹 Limited Supply: Bitcoin has a maximum supply of just 21 million coins.
🔹 Institutional Demand: Growing institutional interest could bring significant capital into the Bitcoin market.
🔹 Bitcoin Halving: Reduced new supply following halving events could support long-term price appreciation if demand continues growing.
🔹 Global Adoption: Increasing recognition of Bitcoin as a digital asset could strengthen its position in the global financial system.
My long-term outlook remains bullish. Investors who believe in Bitcoin's future may consider accumulating BTC gradually rather than chasing sudden price movements.
My Target: $250,000 by 2028! 🎯
Remember: No target is guaranteed. Always do your own research, manage risk, and never invest money you cannot afford to lose.
#Bitcoin #BTC #CryptoInvestment #BullRun #BTC250K $BTC
Here is why investors should pay attention:
🔹 Limited Supply: Bitcoin has a maximum supply of just 21 million coins.
🔹 Institutional Demand: Growing institutional interest could bring significant capital into the Bitcoin market.
🔹 Bitcoin Halving: Reduced new supply following halving events could support long-term price appreciation if demand continues growing.
🔹 Global Adoption: Increasing recognition of Bitcoin as a digital asset could strengthen its position in the global financial system.
My long-term outlook remains bullish. Investors who believe in Bitcoin's future may consider accumulating BTC gradually rather than chasing sudden price movements.
My Target: $250,000 by 2028! 🎯
Remember: No target is guaranteed. Always do your own research, manage risk, and never invest money you cannot afford to lose.
#Bitcoin #BTC #CryptoInvestment #BullRun #BTC250K $BTC
2
718
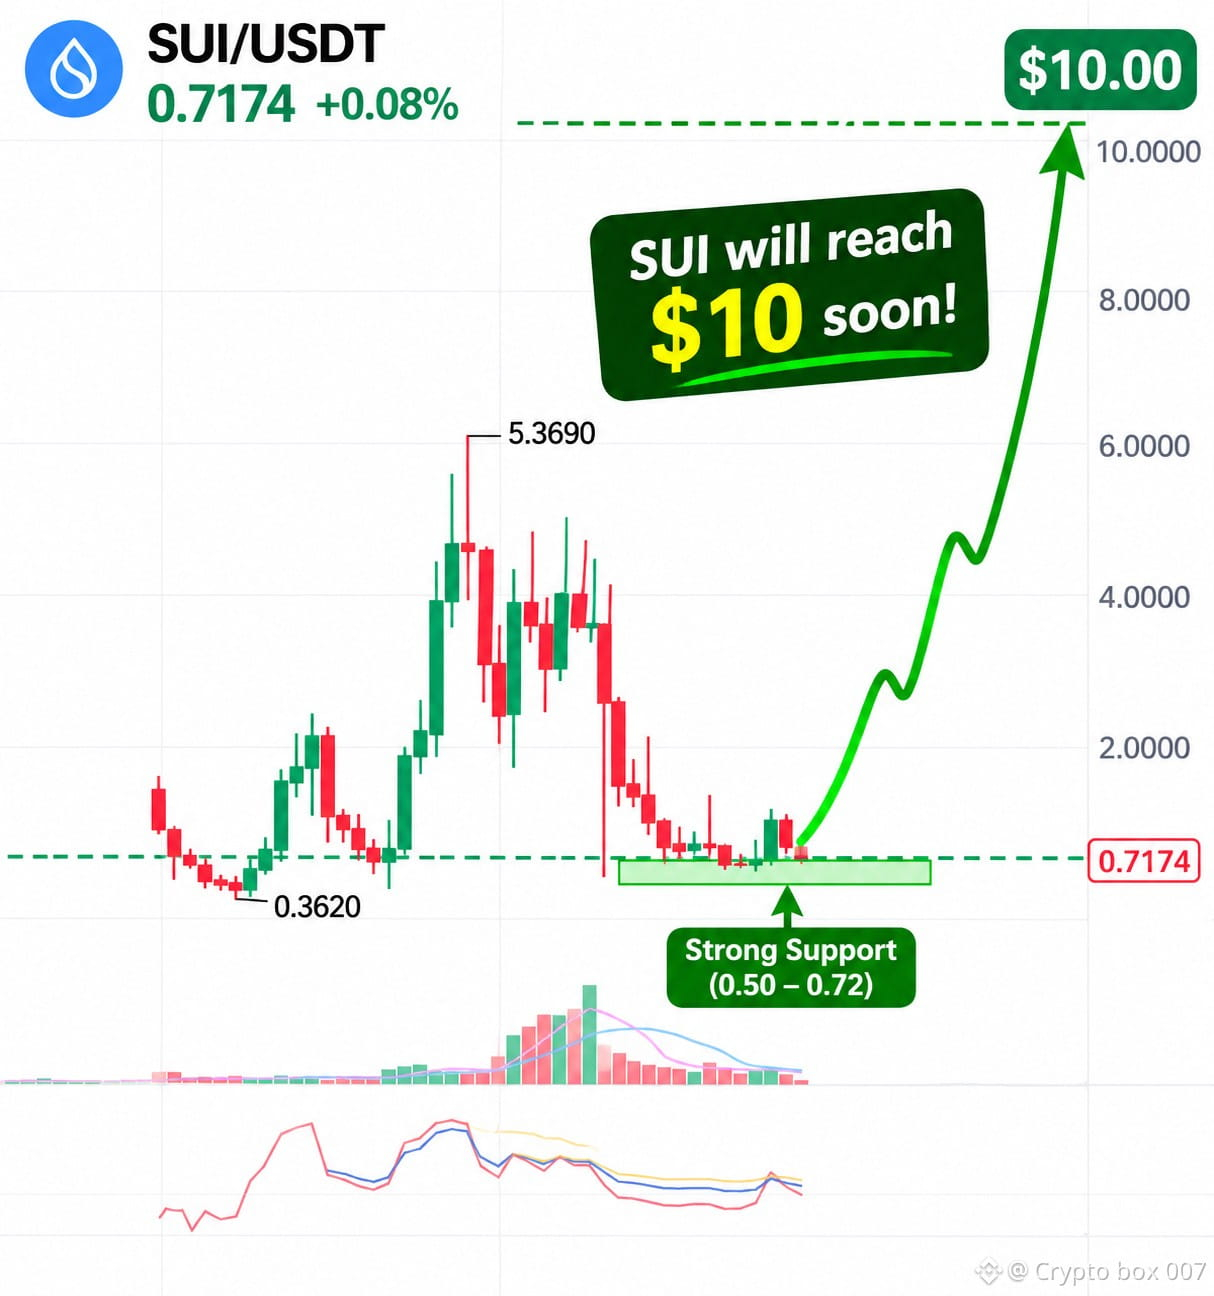
I believe in Sui. Starting today, I will buy $5 worth of Sui every day till December 31.
#Sui #BinanceSquare #SUI🔥
I believe in Sui. Starting today, I will buy $5 worth of Sui every day till December 31.
#Sui #BinanceSquare #SUI🔥
#Sui #BinanceSquare #SUI🔥

1
4
361
·
--
Bearish
How much further do you think the price of Bitcoin could fall?
#BTC #BinanceSquareFamily #TradingTales #CryptoPatience $BTC
How much further do you think the price of Bitcoin could fall?
#BTC #BinanceSquareFamily #TradingTales #CryptoPatience $BTC
#BTC #BinanceSquareFamily #TradingTales #CryptoPatience $BTC
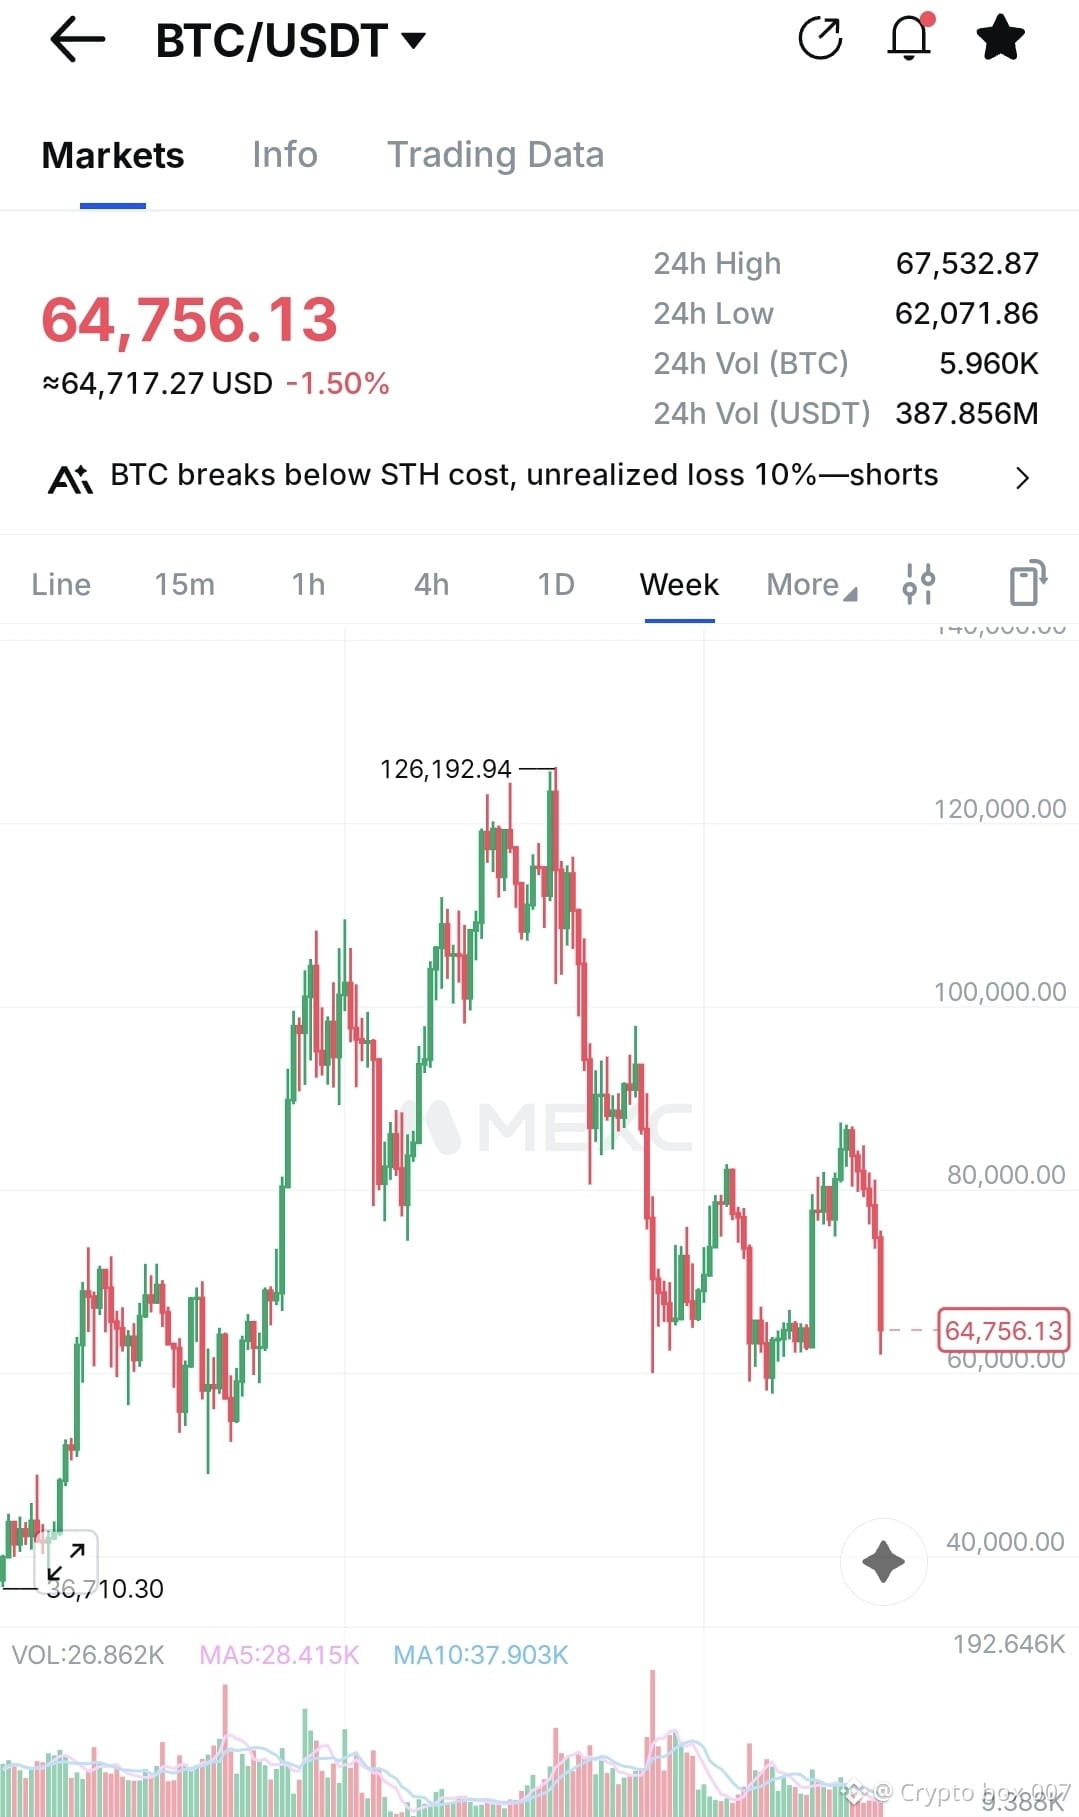

Best Wishes!
From Crypto box 007
3
34
·
--
Bearish
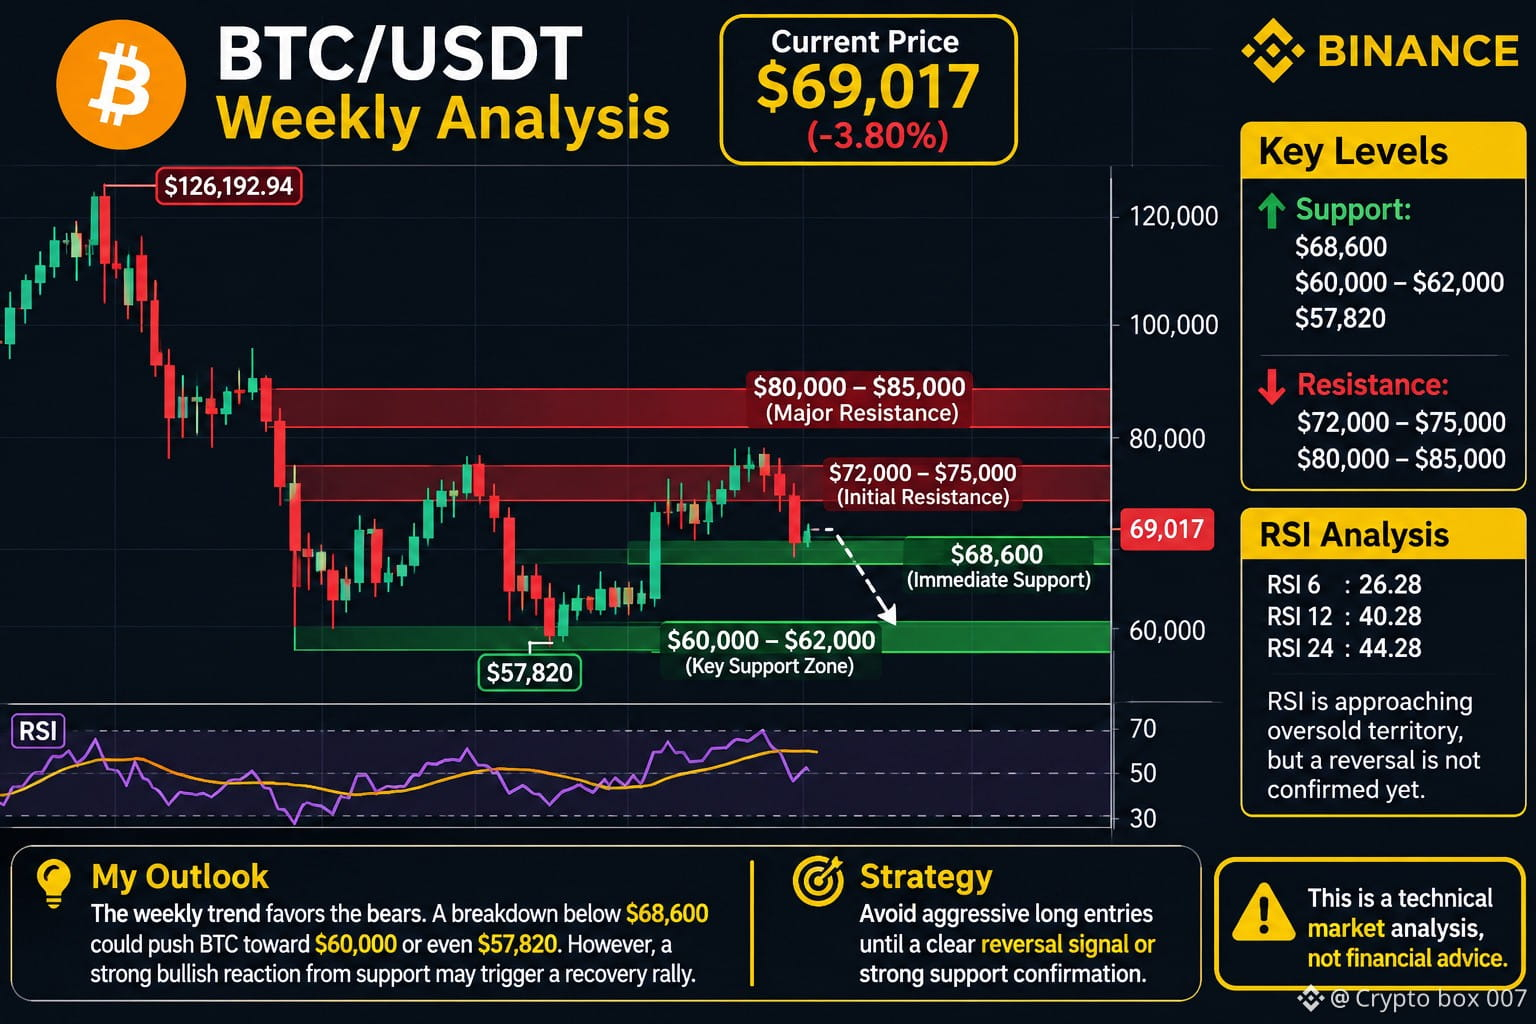
BTC Weekly Analysis: Is Bitcoin Heading Toward $60K?
Bitcoin is currently trading around $69,017, showing significant bearish pressure on the weekly timeframe.
1. Market Structure
BTC has faced strong rejection from the $84,000–$85,000 resistance area. The recent weekly candles indicate continued selling pressure, with lower highs suggesting that sellers remain in control.
2. Key Support Levels
$68,600: Immediate support.
$60,000–$62,000: Important psychological and technical support zone.
$57,820: Major previous swing low.
A breakdown below $68,600 could increase the probability of a move toward $60K.
3. Key Resistance Levels
$72,000–$75,000: Initial resistance.
$80,000–$85,000: Major resistance zone.
BTC needs a strong weekly recovery above these levels to improve its bullish outlook.
4. RSI Analysis
Weekly RSI readings:
RSI 6: 26.28
RSI 12: 40.28
RSI 24: 44.28
The short-term RSI is approaching oversold territory, indicating strong bearish momentum. However, an oversold RSI alone does not confirm a reversal.
My Outlook
The weekly trend currently favors the bears. If BTC loses the $68,600 support, a deeper correction toward $60,000 or even the previous low near $57,820 becomes possible.
However, a strong bullish reaction from support could trigger a relief rally.
Strategy: Avoid aggressive long entries until a clear reversal signal or strong support confirmation appears.
This is a technical market analysis, not financial advice.
#BTC #bitcoin #CryptoAnalysis #BTCUSDT #BinanceSquare $BTC
{future}(BTCUSDT)
BTC Weekly Analysis: Is Bitcoin Heading Toward $60K?
Bitcoin is currently trading around $69,017, showing significant bearish pressure on the weekly timeframe.
1. Market Structure
BTC has faced strong rejection from the $84,000–$85,000 resistance area. The recent weekly candles indicate continued selling pressure, with lower highs suggesting that sellers remain in control.
2. Key Support Levels
$68,600: Immediate support.
$60,000–$62,000: Important psychological and technical support zone.
$57,820: Major previous swing low.
A breakdown below $68,600 could increase the probability of a move toward $60K.
3. Key Resistance Levels
$72,000–$75,000: Initial resistance.
$80,000–$85,000: Major resistance zone.
BTC needs a strong weekly recovery above these levels to improve its bullish outlook.
4. RSI Analysis
Weekly RSI readings:
RSI 6: 26.28
RSI 12: 40.28
RSI 24: 44.28
The short-term RSI is approaching oversold territory, indicating strong bearish momentum. However, an oversold RSI alone does not confirm a reversal.
My Outlook
The weekly trend currently favors the bears. If BTC loses the $68,600 support, a deeper correction toward $60,000 or even the previous low near $57,820 becomes possible.
However, a strong bullish reaction from support could trigger a relief rally.
Strategy: Avoid aggressive long entries until a clear reversal signal or strong support confirmation appears.
This is a technical market analysis, not financial advice.
#BTC #bitcoin #CryptoAnalysis #BTCUSDT #BinanceSquare $BTC
Bitcoin is currently trading around $69,017, showing significant bearish pressure on the weekly timeframe.
1. Market Structure
BTC has faced strong rejection from the $84,000–$85,000 resistance area. The recent weekly candles indicate continued selling pressure, with lower highs suggesting that sellers remain in control.
2. Key Support Levels
$68,600: Immediate support.
$60,000–$62,000: Important psychological and technical support zone.
$57,820: Major previous swing low.
A breakdown below $68,600 could increase the probability of a move toward $60K.
3. Key Resistance Levels
$72,000–$75,000: Initial resistance.
$80,000–$85,000: Major resistance zone.
BTC needs a strong weekly recovery above these levels to improve its bullish outlook.
4. RSI Analysis
Weekly RSI readings:
RSI 6: 26.28
RSI 12: 40.28
RSI 24: 44.28
The short-term RSI is approaching oversold territory, indicating strong bearish momentum. However, an oversold RSI alone does not confirm a reversal.
My Outlook
The weekly trend currently favors the bears. If BTC loses the $68,600 support, a deeper correction toward $60,000 or even the previous low near $57,820 becomes possible.
However, a strong bullish reaction from support could trigger a relief rally.
Strategy: Avoid aggressive long entries until a clear reversal signal or strong support confirmation appears.
This is a technical market analysis, not financial advice.
#BTC #bitcoin #CryptoAnalysis #BTCUSDT #BinanceSquare $BTC
1
92
·
--
Bearish
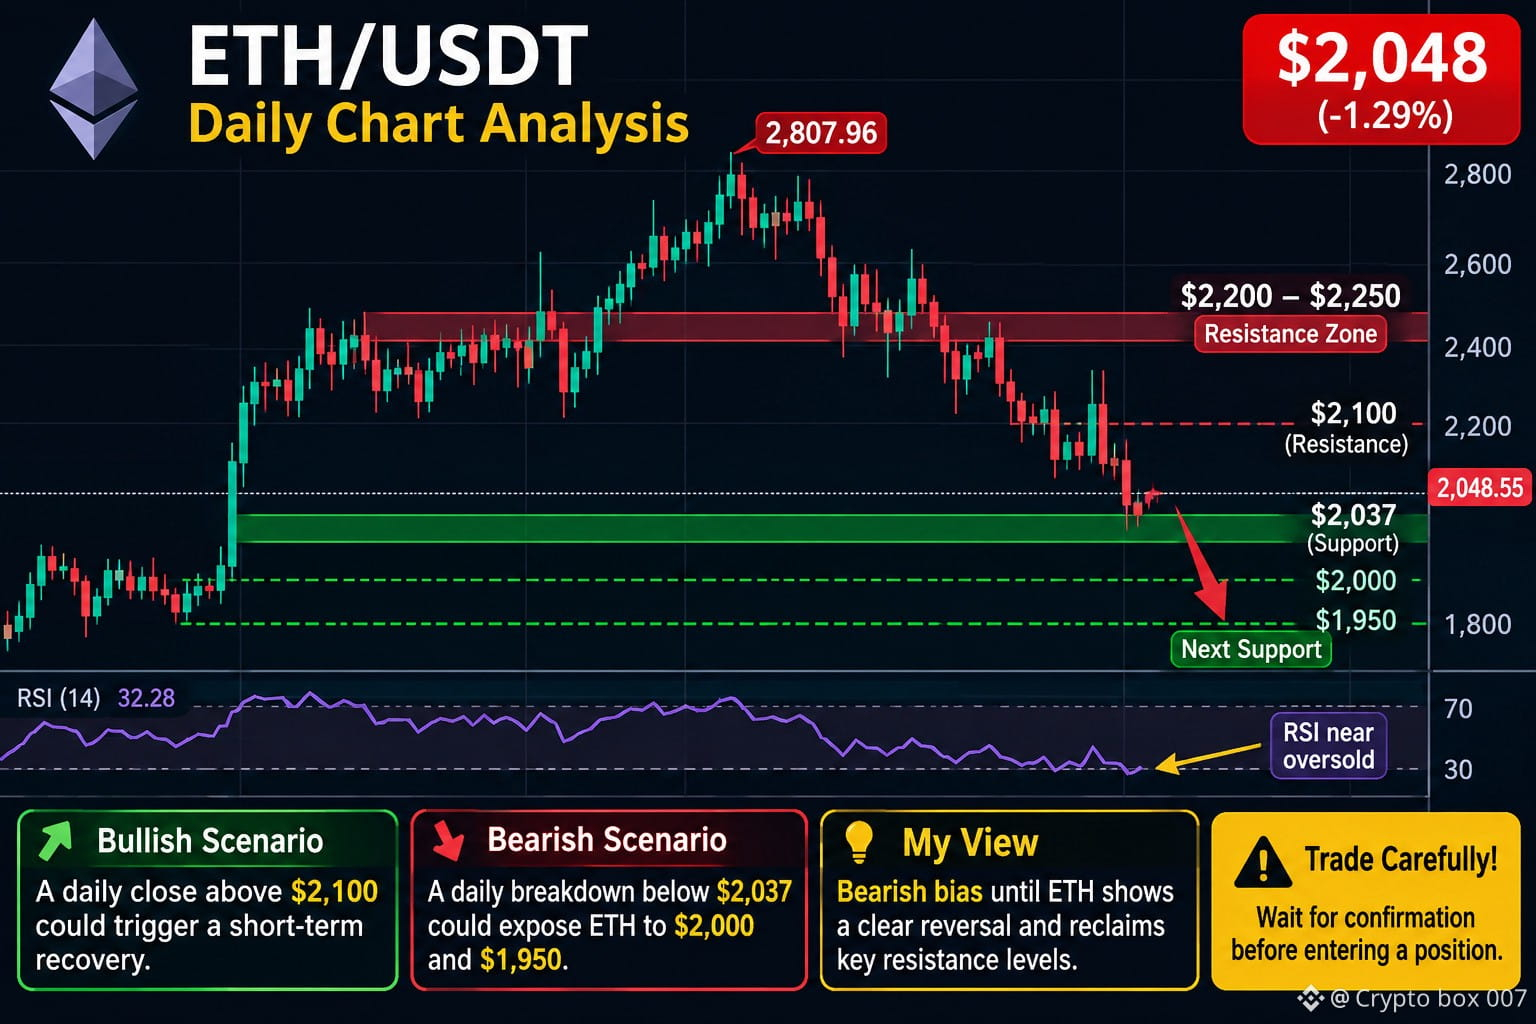
📉 ETH/USDT – Daily Chart Analysis
Current Price: $2,048
Market Structure: Bearish 🔴
ETH continues to show a clear bearish structure, forming lower highs and lower lows after rejecting the $2,800 resistance zone.
Key Support Levels:
$2,037 – Immediate support
$2,000 – Psychological support
$1,950 – Next downside area
Key Resistance Levels:
$2,100 – Immediate resistance
$2,200–$2,250 – Major resistance zone
Technical Outlook: RSI is approaching oversold territory, suggesting a possible short-term relief bounce. However, selling pressure remains dominant.
Bullish Scenario: A strong daily close above $2,100 could trigger a short-term recovery.
Bearish Scenario: A daily breakdown below $2,037 could expose ETH to further downside toward $2,000 and $1,950.
My View: Bearish bias until ETH shows a clear reversal and reclaims key resistance levels.
⚠️ Trade carefully. Wait for confirmation before entering a position.
#ETH #Ethereum #CryptoAnalysis #BinanceSquare $ETH
{future}(ETHUSDT)
📉 ETH/USDT – Daily Chart Analysis
Current Price: $2,048
Market Structure: Bearish 🔴
ETH continues to show a clear bearish structure, forming lower highs and lower lows after rejecting the $2,800 resistance zone.
Key Support Levels:
$2,037 – Immediate support
$2,000 – Psychological support
$1,950 – Next downside area
Key Resistance Levels:
$2,100 – Immediate resistance
$2,200–$2,250 – Major resistance zone
Technical Outlook: RSI is approaching oversold territory, suggesting a possible short-term relief bounce. However, selling pressure remains dominant.
Bullish Scenario: A strong daily close above $2,100 could trigger a short-term recovery.
Bearish Scenario: A daily breakdown below $2,037 could expose ETH to further downside toward $2,000 and $1,950.
My View: Bearish bias until ETH shows a clear reversal and reclaims key resistance levels.
⚠️ Trade carefully. Wait for confirmation before entering a position.
#ETH #Ethereum #CryptoAnalysis #BinanceSquare $ETH
Current Price: $2,048
Market Structure: Bearish 🔴
ETH continues to show a clear bearish structure, forming lower highs and lower lows after rejecting the $2,800 resistance zone.
Key Support Levels:
$2,037 – Immediate support
$2,000 – Psychological support
$1,950 – Next downside area
Key Resistance Levels:
$2,100 – Immediate resistance
$2,200–$2,250 – Major resistance zone
Technical Outlook: RSI is approaching oversold territory, suggesting a possible short-term relief bounce. However, selling pressure remains dominant.
Bullish Scenario: A strong daily close above $2,100 could trigger a short-term recovery.
Bearish Scenario: A daily breakdown below $2,037 could expose ETH to further downside toward $2,000 and $1,950.
My View: Bearish bias until ETH shows a clear reversal and reclaims key resistance levels.
⚠️ Trade carefully. Wait for confirmation before entering a position.
#ETH #Ethereum #CryptoAnalysis #BinanceSquare $ETH
1
65
·
--
Bearish
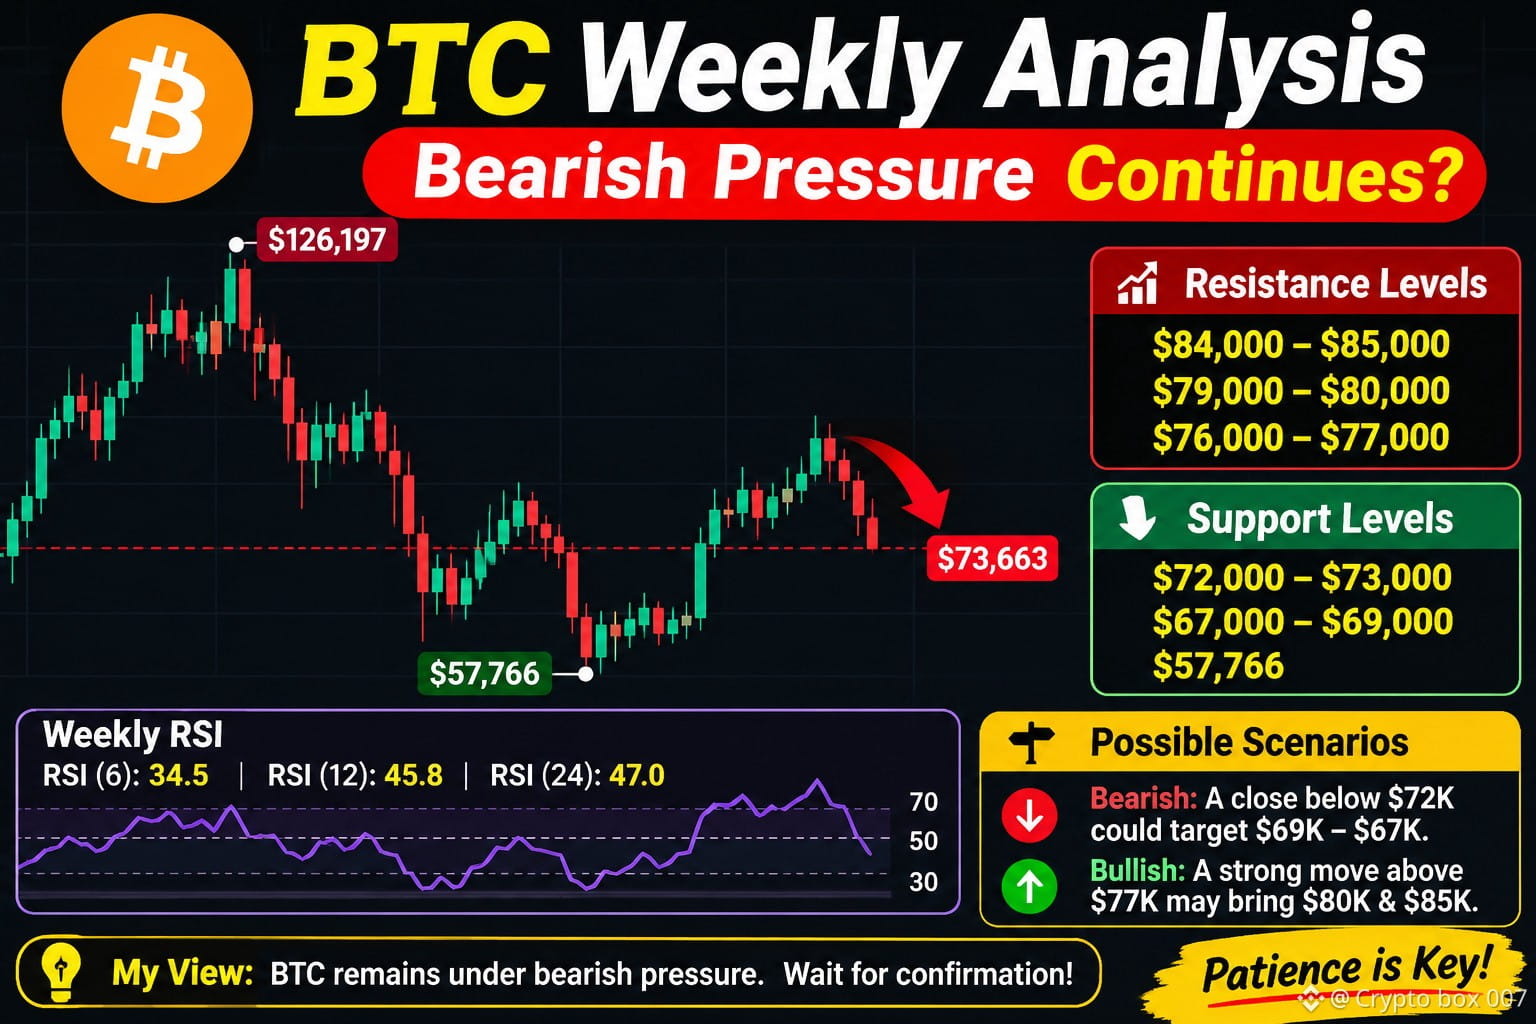
BTC Weekly Analysis – Bearish Pressure Continues?
Bitcoin is currently trading around $73,663 on the weekly timeframe.
After recovering from the $57,766 low, BTC rallied toward the $85,000 resistance zone. However, sellers stepped in, triggering another downward move.
Technical Overview:
Weekly RSI (6): 34.5
Weekly RSI (12): 45.8
Weekly RSI (24): 47.0
Momentum remains weak, with all RSI readings below 50.
Key Resistance Levels:
$76,000–$77,000
$79,000–$80,000
$84,000–$85,000
Key Support Levels:
$72,000–$73,000
$67,000–$69,000
$57,766 (Major Support)
Possible Scenarios:
🔴 Bearish: A weekly close below $72,000 could open the door toward $69,000–$67,000.
🟢 Bullish: A strong recovery above $77,000 could bring $80,000 and $85,000 back into focus.
My View: BTC remains under bearish pressure on the weekly timeframe. I would prefer to wait for confirmation before considering a new long position.
Patience is key. Let the market confirm its direction.
#BTC #Bitcoin #CryptoAnalysis #TechnicalAnalysis #BinanceSquare $BTC
{spot}(BTCUSDT)
BTC Weekly Analysis – Bearish Pressure Continues?
Bitcoin is currently trading around $73,663 on the weekly timeframe.
After recovering from the $57,766 low, BTC rallied toward the $85,000 resistance zone. However, sellers stepped in, triggering another downward move.
Technical Overview:
Weekly RSI (6): 34.5
Weekly RSI (12): 45.8
Weekly RSI (24): 47.0
Momentum remains weak, with all RSI readings below 50.
Key Resistance Levels:
$76,000–$77,000
$79,000–$80,000
$84,000–$85,000
Key Support Levels:
$72,000–$73,000
$67,000–$69,000
$57,766 (Major Support)
Possible Scenarios:
🔴 Bearish: A weekly close below $72,000 could open the door toward $69,000–$67,000.
🟢 Bullish: A strong recovery above $77,000 could bring $80,000 and $85,000 back into focus.
My View: BTC remains under bearish pressure on the weekly timeframe. I would prefer to wait for confirmation before considering a new long position.
Patience is key. Let the market confirm its direction.
#BTC #Bitcoin #CryptoAnalysis #TechnicalAnalysis #BinanceSquare $BTC
Bitcoin is currently trading around $73,663 on the weekly timeframe.
After recovering from the $57,766 low, BTC rallied toward the $85,000 resistance zone. However, sellers stepped in, triggering another downward move.
Technical Overview:
Weekly RSI (6): 34.5
Weekly RSI (12): 45.8
Weekly RSI (24): 47.0
Momentum remains weak, with all RSI readings below 50.
Key Resistance Levels:
$76,000–$77,000
$79,000–$80,000
$84,000–$85,000
Key Support Levels:
$72,000–$73,000
$67,000–$69,000
$57,766 (Major Support)
Possible Scenarios:
🔴 Bearish: A weekly close below $72,000 could open the door toward $69,000–$67,000.
🟢 Bullish: A strong recovery above $77,000 could bring $80,000 and $85,000 back into focus.
My View: BTC remains under bearish pressure on the weekly timeframe. I would prefer to wait for confirmation before considering a new long position.
Patience is key. Let the market confirm its direction.
#BTC #Bitcoin #CryptoAnalysis #TechnicalAnalysis #BinanceSquare $BTC
1
101
⚠️ Binance hacked with over $5.6 billion stolen. This is the largest hack in crypto history.
Binance co-founder Yi He says the exchange will cover all losses from the hack and user funds remain safe, with deposits and withdrawals paused for security checks.
Binance says $3,000,000,000 worth of stolen crypto has now been frozen following major hack. Stay Safu
#FedWatch #EarningsSeason #USMidtermElections #BinanceWillListPredictPREDICT #HackerAlert
⚠️ Binance hacked with over $5.6 billion stolen. This is the largest hack in crypto history.
Binance co-founder Yi He says the exchange will cover all losses from the hack and user funds remain safe, with deposits and withdrawals paused for security checks.
Binance says $3,000,000,000 worth of stolen crypto has now been frozen following major hack. Stay Safu
#FedWatch #EarningsSeason #USMidtermElections #BinanceWillListPredictPREDICT #HackerAlert
Binance co-founder Yi He says the exchange will cover all losses from the hack and user funds remain safe, with deposits and withdrawals paused for security checks.
Binance says $3,000,000,000 worth of stolen crypto has now been frozen following major hack. Stay Safu
#FedWatch #EarningsSeason #USMidtermElections #BinanceWillListPredictPREDICT #HackerAlert

2
185
Crypto worth $5.91 billion has been stolen from Binance. No one’s assets are safe.
#Stolencrypto #hack
Crypto worth $5.91 billion has been stolen from Binance. No one’s assets are safe.
#Stolencrypto #hack
#Stolencrypto #hack

122
🇮🇱 NEWS: Netanyahu says Israel is exploring blockchain and crypto to get around potential international banking sanctions.
#NewsAboutCrypto #newscrypto
🇮🇱 NEWS: Netanyahu says Israel is exploring blockchain and crypto to get around potential international banking sanctions.
#NewsAboutCrypto #newscrypto
#NewsAboutCrypto #newscrypto
2
61
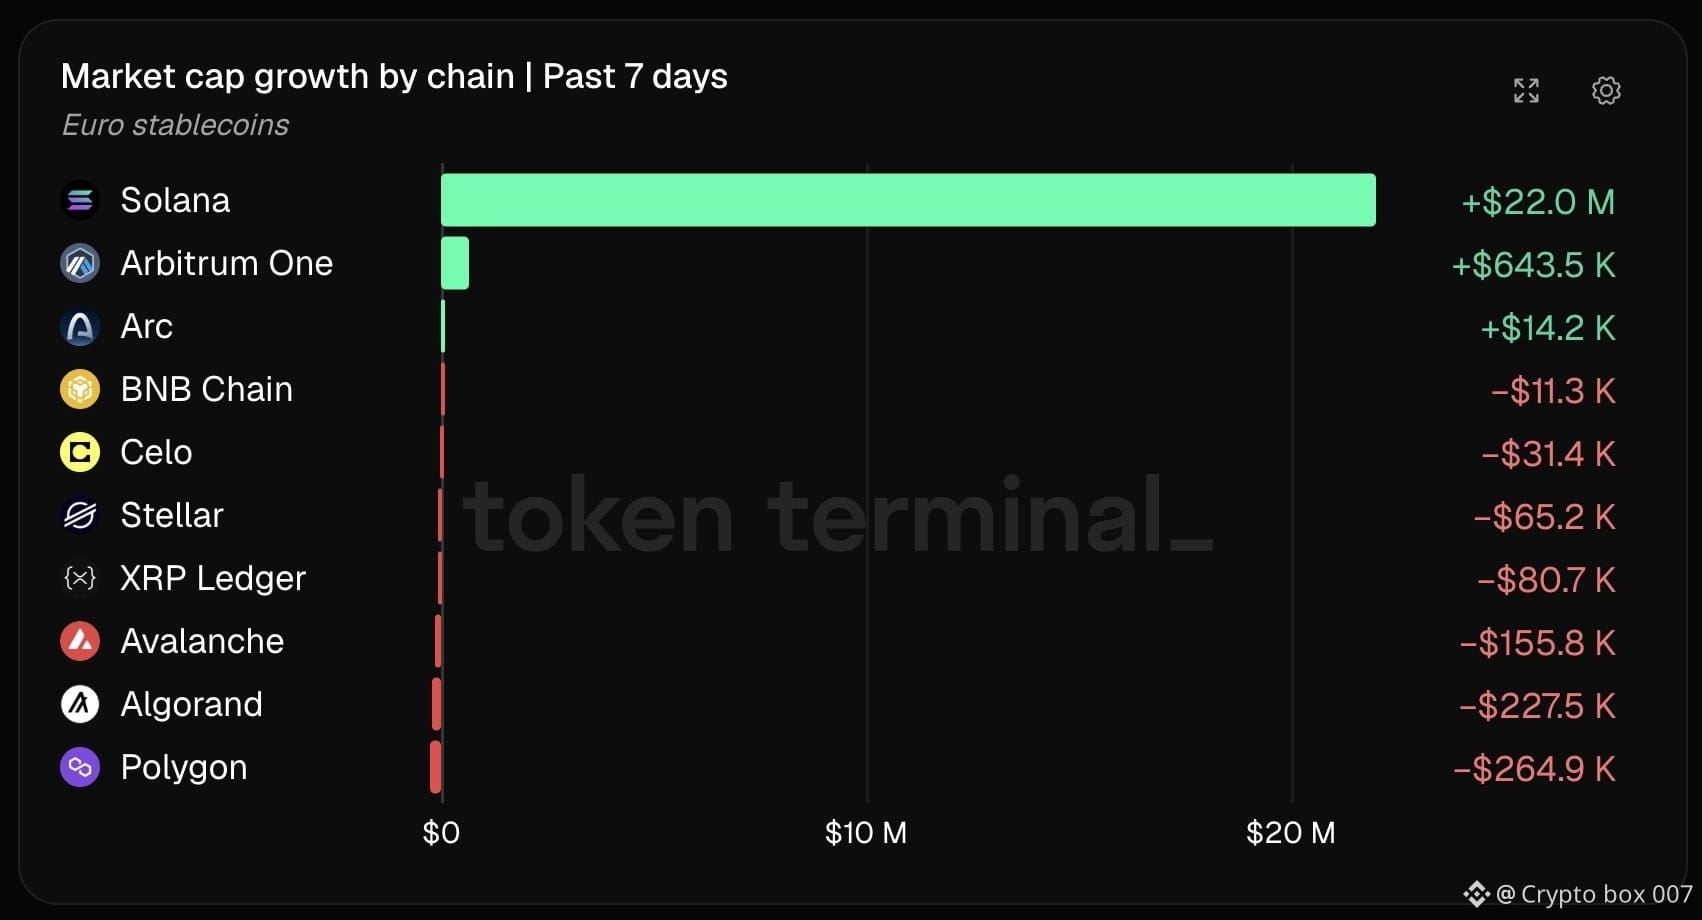
🇪🇺 LATEST: Solana just added $22M in euro stablecoins in a week, more than every other chain on Token Terminal's list combined.
#SOL #Solana $SOL #Usdt #BinancePick #EarningsSeason
🇪🇺 LATEST: Solana just added $22M in euro stablecoins in a week, more than every other chain on Token Terminal's list combined.
#SOL #Solana $SOL #Usdt #BinancePick #EarningsSeason
#SOL #Solana $SOL #Usdt #BinancePick #EarningsSeason
1
65

Log in to explore more content
Join global crypto users on Binance Square
⚡️ Get latest and useful information about crypto.
💬 Trusted by the world’s largest crypto exchange.
👍 Discover real insights from verified creators.
Email / Phone number
Trending Topics
AnthropicToDebutAfter$83IPOPricing
15,333 views
124 Discussing
Stock Futures Hold Near Flat as Anthropic Prices IPO at $83 Ahead of Debut
Binance News
·8 Likes
·7.3k views
BTCRemainsUnderPressureAfterHawkishFOMCMinutes
57,463 views
1,080 Discussing
NvidiaBoardReportedlySplitOverHuang’sReturn
19,065 views
515 Discussing