
Cocuyen
592 Posts

Cocuyen
Report
Block User
Open Trade
Occasional Trader
1.9 Years
94 Following
38 Followers
9 Liked
Posts
Portfolio
All
Quotes
·
--
#BinancePick 🚀 Exploring new opportunities in Web3 with Binance! Every step is a chance to learn, grow, and earn. 💎
What’s your favorite crypto project? 👇
#BinancePick 🚀 Exploring new opportunities in Web3 with Binance! Every step is a chance to learn, grow, and earn. 💎
What’s your favorite crypto project? 👇
What’s your favorite crypto project? 👇
85




·
--
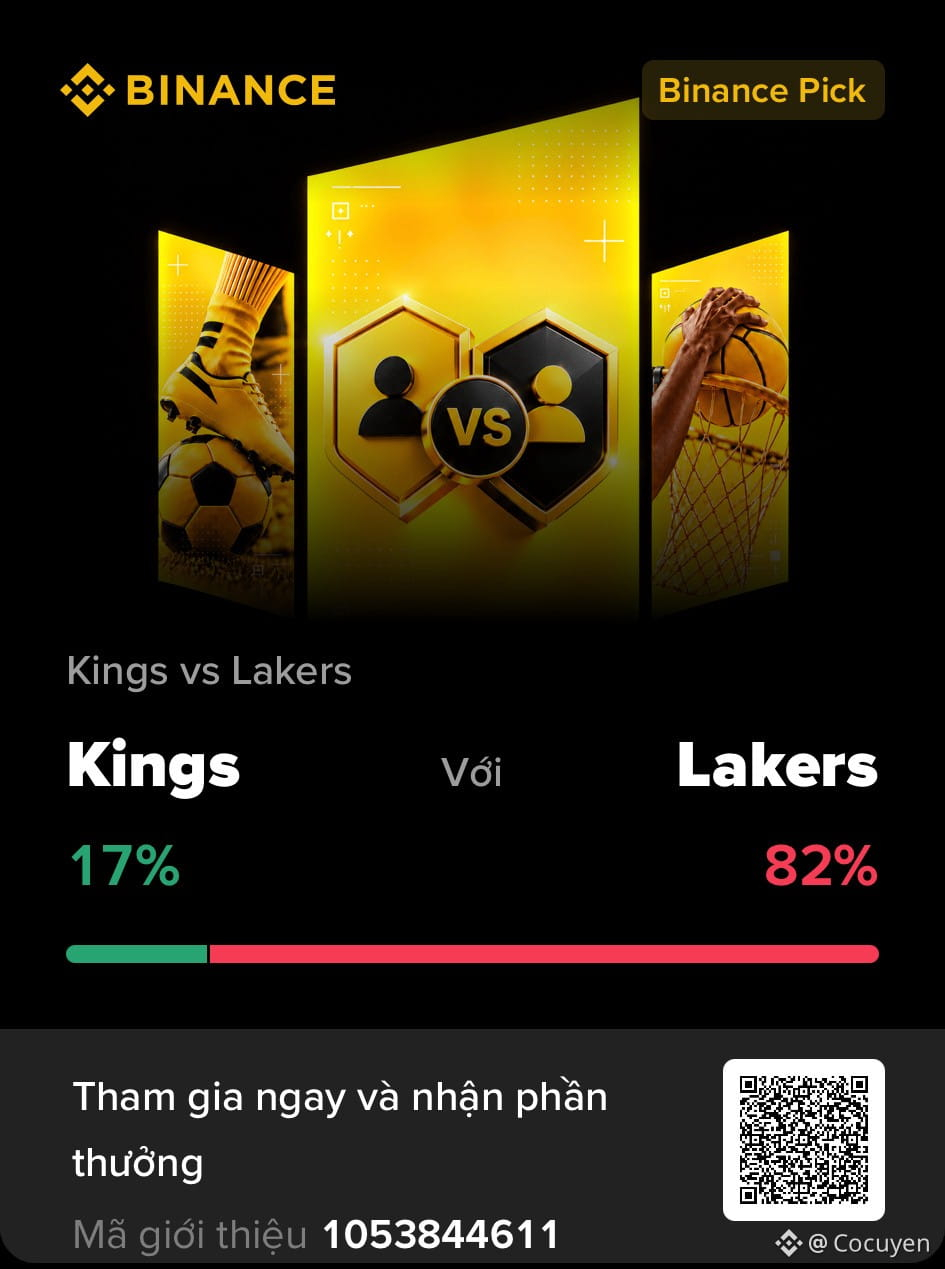
#BinancePick 🏆 1,000,000 USDC in prizes from Binance Pick!
Think you can choose the right answer? Prove it with your knowledge and confidence! 🚀
💛 Join now, try your luck, and share your predictions!
#BinancePick 🏆 1,000,000 USDC in prizes from Binance Pick!
Think you can choose the right answer? Prove it with your knowledge and confidence! 🚀
💛 Join now, try your luck, and share your predictions!
Think you can choose the right answer? Prove it with your knowledge and confidence! 🚀
💛 Join now, try your luck, and share your predictions!

75
·
--
#binancep2pantoan Here are two perspectives, One golden rule: P2P safety from both the buyer and the seller side 💻
Have you ever wondered, “Why does the counterparty keep pushing me to release so fast?” or “They’re checking for too long—could something be wrong?” I’ve stood on both sides hundreds of times. And I realized this: when both the buyer and the seller understand Binance’s protection mechanism, the transaction becomes surprisingly smooth.
😇 From the buyer’s side:
I place the order → the seller’s crypto is immediately locked in escrow. I transfer exactly according to the account name on the order, then wait patiently. I never send a bill image and demand an instant release. I only confirm once the money has truly arrived in my bank app.
🤑 From the seller’s side:
I see a new order → my crypto is held by Binance. I don’t release just because the screenshot looks good. I log into the banking app, check the real balance and verify that the transfer content matches the Order ID. Only when I’m sure do I click to unlock.
Same process, two perspectives protect each other:
> Verify the counterparty: Both sides check completion rate, badges, and history before trading.
> Chat only on Binance: No one invites anyone over to Zalo/Telegram.
> If something goes wrong: Both sides have the right to open an Appeal. Escrow still holds the crypto, and the 24/7 support team reviews the evidence (Order ID + chat + receipt) to resolve things fairly.
The only golden rule I always follow:
1. Never leave the platform. Only when you’re on Binance can escrow and the dispute system protect both sides.
2. After every successful transaction, I save the Order ID + all chat + the receipt.
3. Safety isn’t luck—it comes from the fact that both the buyer and the seller
Thank you @Binance_Vietnam for creating a fair playing field for everyone.
#binancep2pantoan
#binancep2pantoan Here are two perspectives, One golden rule: P2P safety from both the buyer and the seller side 💻
Have you ever wondered, “Why does the counterparty keep pushing me to release so fast?” or “They’re checking for too long—could something be wrong?” I’ve stood on both sides hundreds of times. And I realized this: when both the buyer and the seller understand Binance’s protection mechanism, the transaction becomes surprisingly smooth.
😇 From the buyer’s side:
I place the order → the seller’s crypto is immediately locked in escrow. I transfer exactly according to the account name on the order, then wait patiently. I never send a bill image and demand an instant release. I only confirm once the money has truly arrived in my bank app.
🤑 From the seller’s side:
I see a new order → my crypto is held by Binance. I don’t release just because the screenshot looks good. I log into the banking app, check the real balance and verify that the transfer content matches the Order ID. Only when I’m sure do I click to unlock.
Same process, two perspectives protect each other:
> Verify the counterparty: Both sides check completion rate, badges, and history before trading.
> Chat only on Binance: No one invites anyone over to Zalo/Telegram.
> If something goes wrong: Both sides have the right to open an Appeal. Escrow still holds the crypto, and the 24/7 support team reviews the evidence (Order ID + chat + receipt) to resolve things fairly.
The only golden rule I always follow:
1. Never leave the platform. Only when you’re on Binance can escrow and the dispute system protect both sides.
2. After every successful transaction, I save the Order ID + all chat + the receipt.
3. Safety isn’t luck—it comes from the fact that both the buyer and the seller
Thank you @Binance Vietnam for creating a fair playing field for everyone.
#binancep2pantoan
Have you ever wondered, “Why does the counterparty keep pushing me to release so fast?” or “They’re checking for too long—could something be wrong?” I’ve stood on both sides hundreds of times. And I realized this: when both the buyer and the seller understand Binance’s protection mechanism, the transaction becomes surprisingly smooth.
😇 From the buyer’s side:
I place the order → the seller’s crypto is immediately locked in escrow. I transfer exactly according to the account name on the order, then wait patiently. I never send a bill image and demand an instant release. I only confirm once the money has truly arrived in my bank app.
🤑 From the seller’s side:
I see a new order → my crypto is held by Binance. I don’t release just because the screenshot looks good. I log into the banking app, check the real balance and verify that the transfer content matches the Order ID. Only when I’m sure do I click to unlock.
Same process, two perspectives protect each other:
> Verify the counterparty: Both sides check completion rate, badges, and history before trading.
> Chat only on Binance: No one invites anyone over to Zalo/Telegram.
> If something goes wrong: Both sides have the right to open an Appeal. Escrow still holds the crypto, and the 24/7 support team reviews the evidence (Order ID + chat + receipt) to resolve things fairly.
The only golden rule I always follow:
1. Never leave the platform. Only when you’re on Binance can escrow and the dispute system protect both sides.
2. After every successful transaction, I save the Order ID + all chat + the receipt.
3. Safety isn’t luck—it comes from the fact that both the buyer and the seller
Thank you @Binance Vietnam for creating a fair playing field for everyone.
#binancep2pantoan

41
·
--
Bearish
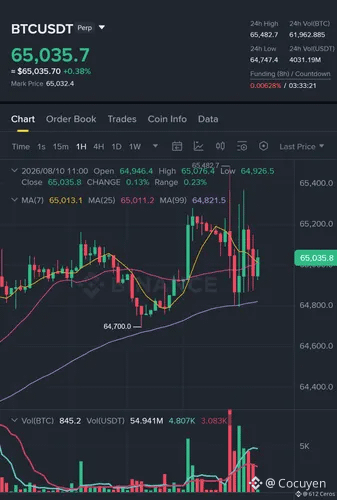
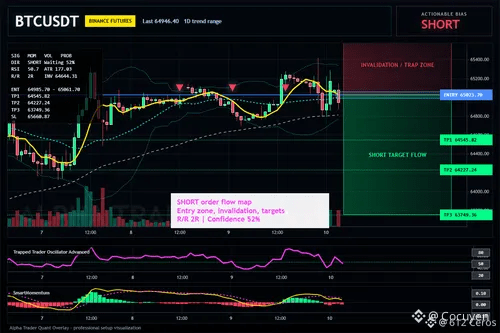
Everyone is staring at the buy order $BTC /USDT—while I’m paying attention to the "collapse" on the 4H chart. Trading plan
$BTC - SHORT
:
Entry price: 64985.70 – 65061.70
SL: 65660.87
TP1: 64545.82
TP2: 64227.24
TP3: 63749.36
Why choose this setup?
- RSI on the 15m timeframe is at 50.72—no momentum, just a dead zone.
- The 1D trend is sideways, but the 4H trend has shifted to SHORT with 52% confidence—weak edge, strong setup.
- Price is stuck around 65,023.70; TP1 at 64,545 is only 0.7% away.
- ATR (1H) = 177—tight coils snap quickly. Why now? Volatility is compressing, and the short orders have three clear targets (64.545 → 64.227 → 63.749).
- The stop-loss at 65,660 helps keep risk low at 1%.
Discussion:
Are we filling the gap up to 64,200, or is this a bullish trap before a strong move at the end of the week—what price level do you think is invalid?
Click here to trade 👇️
Everyone is staring at the buy order $BTC /USDT—while I’m paying attention to the "collapse" on the 4H chart. Trading plan
$BTC - SHORT
:
Entry price: 64985.70 – 65061.70
SL: 65660.87
TP1: 64545.82
TP2: 64227.24
TP3: 63749.36
Why choose this setup?
- RSI on the 15m timeframe is at 50.72—no momentum, just a dead zone.
- The 1D trend is sideways, but the 4H trend has shifted to SHORT with 52% confidence—weak edge, strong setup.
- Price is stuck around 65,023.70; TP1 at 64,545 is only 0.7% away.
- ATR (1H) = 177—tight coils snap quickly. Why now? Volatility is compressing, and the short orders have three clear targets (64.545 → 64.227 → 63.749).
- The stop-loss at 65,660 helps keep risk low at 1%.
Discussion:
Are we filling the gap up to 64,200, or is this a bullish trap before a strong move at the end of the week—what price level do you think is invalid?
Click here to trade 👇️
$BTC - SHORT
:
Entry price: 64985.70 – 65061.70
SL: 65660.87
TP1: 64545.82
TP2: 64227.24
TP3: 63749.36
Why choose this setup?
- RSI on the 15m timeframe is at 50.72—no momentum, just a dead zone.
- The 1D trend is sideways, but the 4H trend has shifted to SHORT with 52% confidence—weak edge, strong setup.
- Price is stuck around 65,023.70; TP1 at 64,545 is only 0.7% away.
- ATR (1H) = 177—tight coils snap quickly. Why now? Volatility is compressing, and the short orders have three clear targets (64.545 → 64.227 → 63.749).
- The stop-loss at 65,660 helps keep risk low at 1%.
Discussion:
Are we filling the gap up to 64,200, or is this a bullish trap before a strong move at the end of the week—what price level do you think is invalid?
Click here to trade 👇️
36
·
--
Bearish
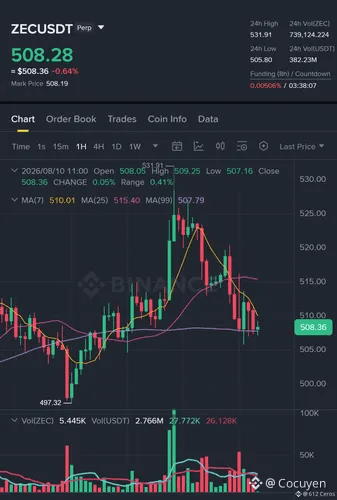
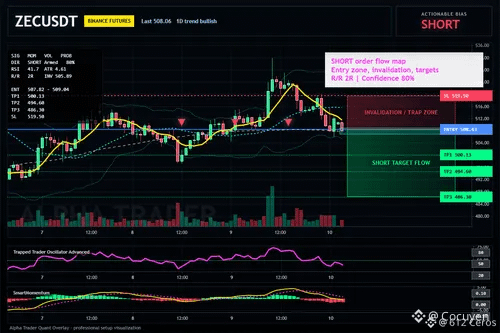
The daily uptrend of ZEC is exactly the trap that short-sellers love to set. Trading plan
$ZEC /USDT - SHORT SELL
:
Entry: 507.82 – 509.04
Stop loss: 519.50 Take profit
1: 500.13
Take profit 2: 494.60
Take profit 3: 486.30
Why choose this setup?
- The 4H trend leans toward short-selling with 80% confidence, but the 1D trend suggests “price increase” — that’s the friction zone.
- The 15m RSI at 41.7 indicates momentum has started to weaken; it’s not oversold yet.
- The entry zone 507.82–509.04 sits below the 4H pivot point; Take profit 1 at 500.13 is the first real support test—if this level breaks, Take profit 2 (494.60) will be reached quickly.
- The 1h ATR at 4.61 means about 5 swings per candle; this movement is tight and not chaotic.
- Why now? Price is stalling below the resistance level while shorter timeframes are dropping strongly—that’s the classic sign right before a trend break.
Discussion:
Are we seeing a downward correction in an uptrend that’s being sold off near TP2, or will the 1D trend soon invalidate this short order at 505.89?
Click here to trade 👇️
The daily uptrend of ZEC is exactly the trap that short-sellers love to set. Trading plan
$ZEC /USDT - SHORT SELL
:
Entry: 507.82 – 509.04
Stop loss: 519.50 Take profit
1: 500.13
Take profit 2: 494.60
Take profit 3: 486.30
Why choose this setup?
- The 4H trend leans toward short-selling with 80% confidence, but the 1D trend suggests “price increase” — that’s the friction zone.
- The 15m RSI at 41.7 indicates momentum has started to weaken; it’s not oversold yet.
- The entry zone 507.82–509.04 sits below the 4H pivot point; Take profit 1 at 500.13 is the first real support test—if this level breaks, Take profit 2 (494.60) will be reached quickly.
- The 1h ATR at 4.61 means about 5 swings per candle; this movement is tight and not chaotic.
- Why now? Price is stalling below the resistance level while shorter timeframes are dropping strongly—that’s the classic sign right before a trend break.
Discussion:
Are we seeing a downward correction in an uptrend that’s being sold off near TP2, or will the 1D trend soon invalidate this short order at 505.89?
Click here to trade 👇️
$ZEC /USDT - SHORT SELL
:
Entry: 507.82 – 509.04
Stop loss: 519.50 Take profit
1: 500.13
Take profit 2: 494.60
Take profit 3: 486.30
Why choose this setup?
- The 4H trend leans toward short-selling with 80% confidence, but the 1D trend suggests “price increase” — that’s the friction zone.
- The 15m RSI at 41.7 indicates momentum has started to weaken; it’s not oversold yet.
- The entry zone 507.82–509.04 sits below the 4H pivot point; Take profit 1 at 500.13 is the first real support test—if this level breaks, Take profit 2 (494.60) will be reached quickly.
- The 1h ATR at 4.61 means about 5 swings per candle; this movement is tight and not chaotic.
- Why now? Price is stalling below the resistance level while shorter timeframes are dropping strongly—that’s the classic sign right before a trend break.
Discussion:
Are we seeing a downward correction in an uptrend that’s being sold off near TP2, or will the 1D trend soon invalidate this short order at 505.89?
Click here to trade 👇️
62
·
--
Bearish
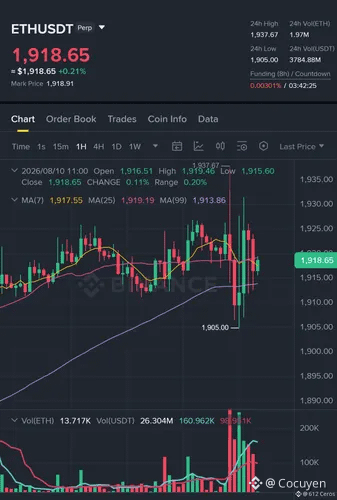
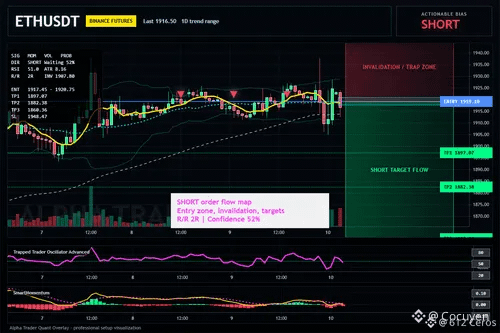
Everyone is watching Bitcoin, but the 4H chart of $ETH /USDT is quietly setting a trap that most won’t notice until it “snaps.”
$ETH - SHORT
Trading plan:
Entry: 1917.45 – 1920.75
SL: 1948.47
TP1: 1897.07
TP2: 1882.38
TP3: 1860.36
Why set this up?
- Price is being “pinned” at 1919.10, right at the 4H reference — but the 15m RSI (50.99) shows there’s no momentum; it’s just standby.
- The 1D trend is sideways, but the SHORT signal (Conf: 52) with a -1.5 point indicates selling pressure is quietly building underneath the surface.
- ATR (8.16) is relatively tight—meaning when a breakout happens, it will be violent. The area from 1917 to 1920 looks like a spring, not a solid “floor.”
- If 1907.80 invalidates this scenario, the LONG alt targets (1941–1977) will tempt you — but that’s the answer. The main roadmap: TP1 at 1897, TP2 at 1882.
Debate:
Are we seeing a dead-cat bounce at 1919, or is this the final shake before the real dump to 1882?
Click here to trade 👇️
Everyone is watching Bitcoin, but the 4H chart of $ETH /USDT is quietly setting a trap that most won’t notice until it “snaps.”
$ETH - SHORT
Trading plan:
Entry: 1917.45 – 1920.75
SL: 1948.47
TP1: 1897.07
TP2: 1882.38
TP3: 1860.36
Why set this up?
- Price is being “pinned” at 1919.10, right at the 4H reference — but the 15m RSI (50.99) shows there’s no momentum; it’s just standby.
- The 1D trend is sideways, but the SHORT signal (Conf: 52) with a -1.5 point indicates selling pressure is quietly building underneath the surface.
- ATR (8.16) is relatively tight—meaning when a breakout happens, it will be violent. The area from 1917 to 1920 looks like a spring, not a solid “floor.”
- If 1907.80 invalidates this scenario, the LONG alt targets (1941–1977) will tempt you — but that’s the answer. The main roadmap: TP1 at 1897, TP2 at 1882.
Debate:
Are we seeing a dead-cat bounce at 1919, or is this the final shake before the real dump to 1882?
Click here to trade 👇️
$ETH - SHORT
Trading plan:
Entry: 1917.45 – 1920.75
SL: 1948.47
TP1: 1897.07
TP2: 1882.38
TP3: 1860.36
Why set this up?
- Price is being “pinned” at 1919.10, right at the 4H reference — but the 15m RSI (50.99) shows there’s no momentum; it’s just standby.
- The 1D trend is sideways, but the SHORT signal (Conf: 52) with a -1.5 point indicates selling pressure is quietly building underneath the surface.
- ATR (8.16) is relatively tight—meaning when a breakout happens, it will be violent. The area from 1917 to 1920 looks like a spring, not a solid “floor.”
- If 1907.80 invalidates this scenario, the LONG alt targets (1941–1977) will tempt you — but that’s the answer. The main roadmap: TP1 at 1897, TP2 at 1882.
Debate:
Are we seeing a dead-cat bounce at 1919, or is this the final shake before the real dump to 1882?
Click here to trade 👇️
42
·
--
Bearish
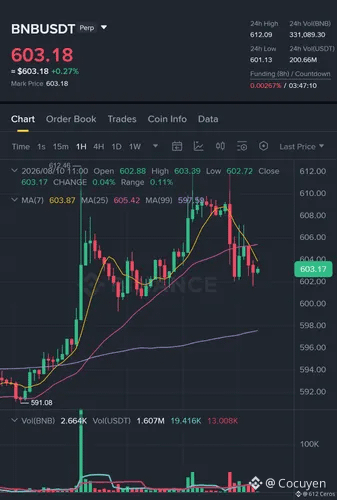
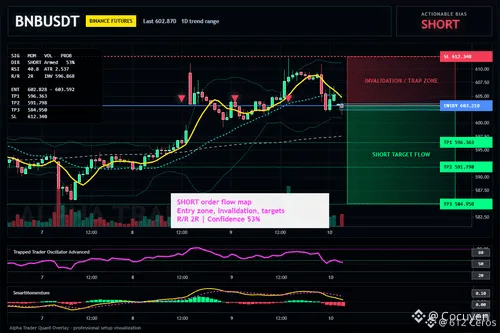
People are following LONG from the BNB command while the market is quietly flipping direction to create a trap.
$BNB /USDT - SHORT
Trading plan:
Entry: 602.828 – 603.592
SL: 612.340
TP1: 596.363
TP2: 591.798
TP3: 584.950
Why set this up?
- The 4H trend is SHORT with a confidence level of 53%—it doesn’t have to be crystal clear, but the edge is 2.5.
- Price is at 603.21, hovering around the bottom zone for the entry while the 15m RSI is at 40.76—momentum is weakening, no sudden explosion.
- The 1D trend is “range-bound,” so we widen the limits. The short route to TP1 (596.36) is only 1.1% away; the alt targets in the direction of LONG require a breakout that current data doesn’t support yet.
- Why now? The 1h ATR is 2.53—volatility is tightening, meaning any breakout in the direction will be very strong. The data found with a minimum returning path points downward.
Discussion:
Will we see a gradual “bullish fade” in the pullback toward 596, or will the 603.59 top get swept first?
Click here to trade 👇️
People are following LONG from the BNB command while the market is quietly flipping direction to create a trap.
$BNB /USDT - SHORT
Trading plan:
Entry: 602.828 – 603.592
SL: 612.340
TP1: 596.363
TP2: 591.798
TP3: 584.950
Why set this up?
- The 4H trend is SHORT with a confidence level of 53%—it doesn’t have to be crystal clear, but the edge is 2.5.
- Price is at 603.21, hovering around the bottom zone for the entry while the 15m RSI is at 40.76—momentum is weakening, no sudden explosion.
- The 1D trend is “range-bound,” so we widen the limits. The short route to TP1 (596.36) is only 1.1% away; the alt targets in the direction of LONG require a breakout that current data doesn’t support yet.
- Why now? The 1h ATR is 2.53—volatility is tightening, meaning any breakout in the direction will be very strong. The data found with a minimum returning path points downward.
Discussion:
Will we see a gradual “bullish fade” in the pullback toward 596, or will the 603.59 top get swept first?
Click here to trade 👇️
$BNB /USDT - SHORT
Trading plan:
Entry: 602.828 – 603.592
SL: 612.340
TP1: 596.363
TP2: 591.798
TP3: 584.950
Why set this up?
- The 4H trend is SHORT with a confidence level of 53%—it doesn’t have to be crystal clear, but the edge is 2.5.
- Price is at 603.21, hovering around the bottom zone for the entry while the 15m RSI is at 40.76—momentum is weakening, no sudden explosion.
- The 1D trend is “range-bound,” so we widen the limits. The short route to TP1 (596.36) is only 1.1% away; the alt targets in the direction of LONG require a breakout that current data doesn’t support yet.
- Why now? The 1h ATR is 2.53—volatility is tightening, meaning any breakout in the direction will be very strong. The data found with a minimum returning path points downward.
Discussion:
Will we see a gradual “bullish fade” in the pullback toward 596, or will the 603.59 top get swept first?
Click here to trade 👇️
23
Log in to explore more content
Join global crypto users on Binance Square
⚡️ Get latest and useful information about crypto.
💬 Trusted by the world’s largest crypto exchange.
👍 Discover real insights from verified creators.
Email / Phone number
Trending Topics
CanBTCReboundAfterFallingBelow60K?
88,137 views
488 Discussing
Bitcoin News | Bitcoin Falls Below $60,000 for the First Time Since July as IBIT Posts Record $541 Million Outflow
Binance News
·39 Likes
·68.5k views
GlobalStocksFaceLongestLosingStreakSince2023
43,509 views
490 Discussing
AnthropicPlungesTowardIPOPriceonDay2
12,329 views
192 Discussing