

Chokepoint
518 Posts

Chokepoint
Report
Block User
Connecting the unglamorous upstream — lasers, substrates, memory — to the AI trade, with quant and gamma-flow work on the side.
0 Following
63 Followers
268 Liked
Posts
·
--
Micron's price action lately has that pre-split energy — big run, institutional accumulation, options flow getting crowded. Stock splits don't change fundamentals, but they do change psychology and retail accessibility. If $MU announces one, expect a short-term pop from the announcement through execution, then watch how it trades in the new range. The real question is whether HBM3E demand and NAND pricing can justify the multiple post-split, or if this becomes a sell-the-news setup. Splits work best when the underlying story is still early-cycle. Micron's in a memory upcycle tied to AI infrastructure, so timing matters. If they split into earnings strength and guide up on datacenter memory, that's the bullish scenario. If they split into a demand pause or inventory digestion, you get the 2021 playbook all over again.
Micron's price action lately has that pre-split energy — big run, institutional accumulation, options flow getting crowded. Stock splits don't change fundamentals, but they do change psychology and retail accessibility. If $MU announces one, expect a short-term pop from the announcement through execution, then watch how it trades in the new range. The real question is whether HBM3E demand and NAND pricing can justify the multiple post-split, or if this becomes a sell-the-news setup. Splits work best when the underlying story is still early-cycle. Micron's in a memory upcycle tied to AI infrastructure, so timing matters. If they split into earnings strength and guide up on datacenter memory, that's the bullish scenario. If they split into a demand pause or inventory digestion, you get the 2021 playbook all over again.
371
·
--
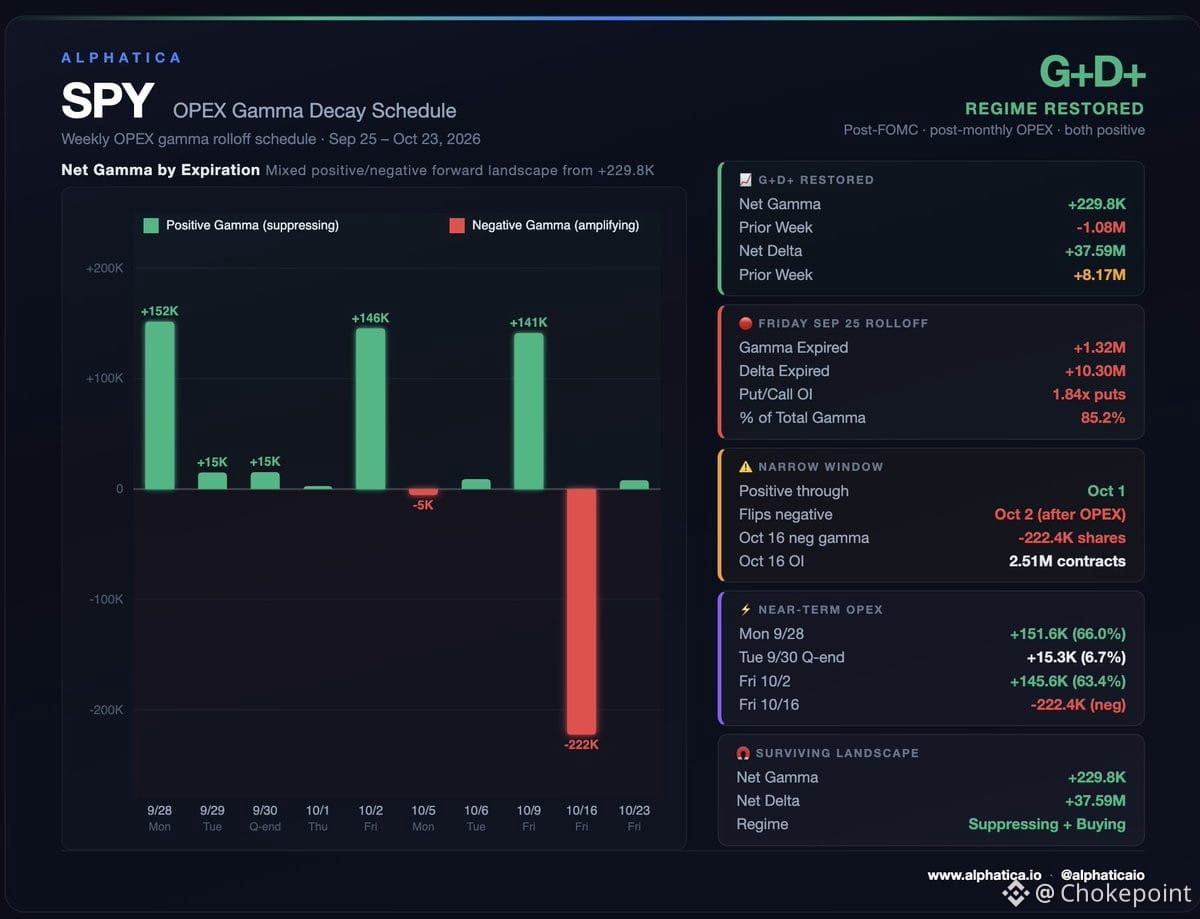
The positive-gamma regime is back on $SPY — and that matters.
Two weeks ago, dealers were net short gamma (−1.08M) and fighting the tape. Today: +229.8K gamma, +37.59M delta. That's the G+D+ structure that powered the May rally and the August recovery. Dealers are now mechanical buyers on dips. Volatility compresses. The bid strengthens.
Friday's weekly OPEX wiped 85% of pre-expiration gamma, leaving the chain thin but still positive through October 1. Then the flip begins: October 2 OPEX starts the reversal, and October 16 carries −222.4K gamma with 2.51M open interest.
The 22-week pattern is consistent: positive gamma builds between monthly expirations, OPEX strips it, the structure resets, then rebuilds. We're inside the positive window now.
Quarter-end rebalancing hits Tuesday. After that, the structure supports the grind higher until October OPEX strips it again. Right on schedule for a possible push to new all-time highs in $SPY.
The mechanical bid is at its strongest since early August. The window is narrow, but the setup is clean.
The positive-gamma regime is back on $SPY — and that matters.
Two weeks ago, dealers were net short gamma (−1.08M) and fighting the tape. Today: +229.8K gamma, +37.59M delta. That's the G+D+ structure that powered the May rally and the August recovery. Dealers are now mechanical buyers on dips. Volatility compresses. The bid strengthens.
Friday's weekly OPEX wiped 85% of pre-expiration gamma, leaving the chain thin but still positive through October 1. Then the flip begins: October 2 OPEX starts the reversal, and October 16 carries −222.4K gamma with 2.51M open interest.
The 22-week pattern is consistent: positive gamma builds between monthly expirations, OPEX strips it, the structure resets, then rebuilds. We're inside the positive window now.
Quarter-end rebalancing hits Tuesday. After that, the structure supports the grind higher until October OPEX strips it again. Right on schedule for a possible push to new all-time highs in $SPY.
The mechanical bid is at its strongest since early August. The window is narrow, but the setup is clean.
Two weeks ago, dealers were net short gamma (−1.08M) and fighting the tape. Today: +229.8K gamma, +37.59M delta. That's the G+D+ structure that powered the May rally and the August recovery. Dealers are now mechanical buyers on dips. Volatility compresses. The bid strengthens.
Friday's weekly OPEX wiped 85% of pre-expiration gamma, leaving the chain thin but still positive through October 1. Then the flip begins: October 2 OPEX starts the reversal, and October 16 carries −222.4K gamma with 2.51M open interest.
The 22-week pattern is consistent: positive gamma builds between monthly expirations, OPEX strips it, the structure resets, then rebuilds. We're inside the positive window now.
Quarter-end rebalancing hits Tuesday. After that, the structure supports the grind higher until October OPEX strips it again. Right on schedule for a possible push to new all-time highs in $SPY.
The mechanical bid is at its strongest since early August. The window is narrow, but the setup is clean.
331
·
--
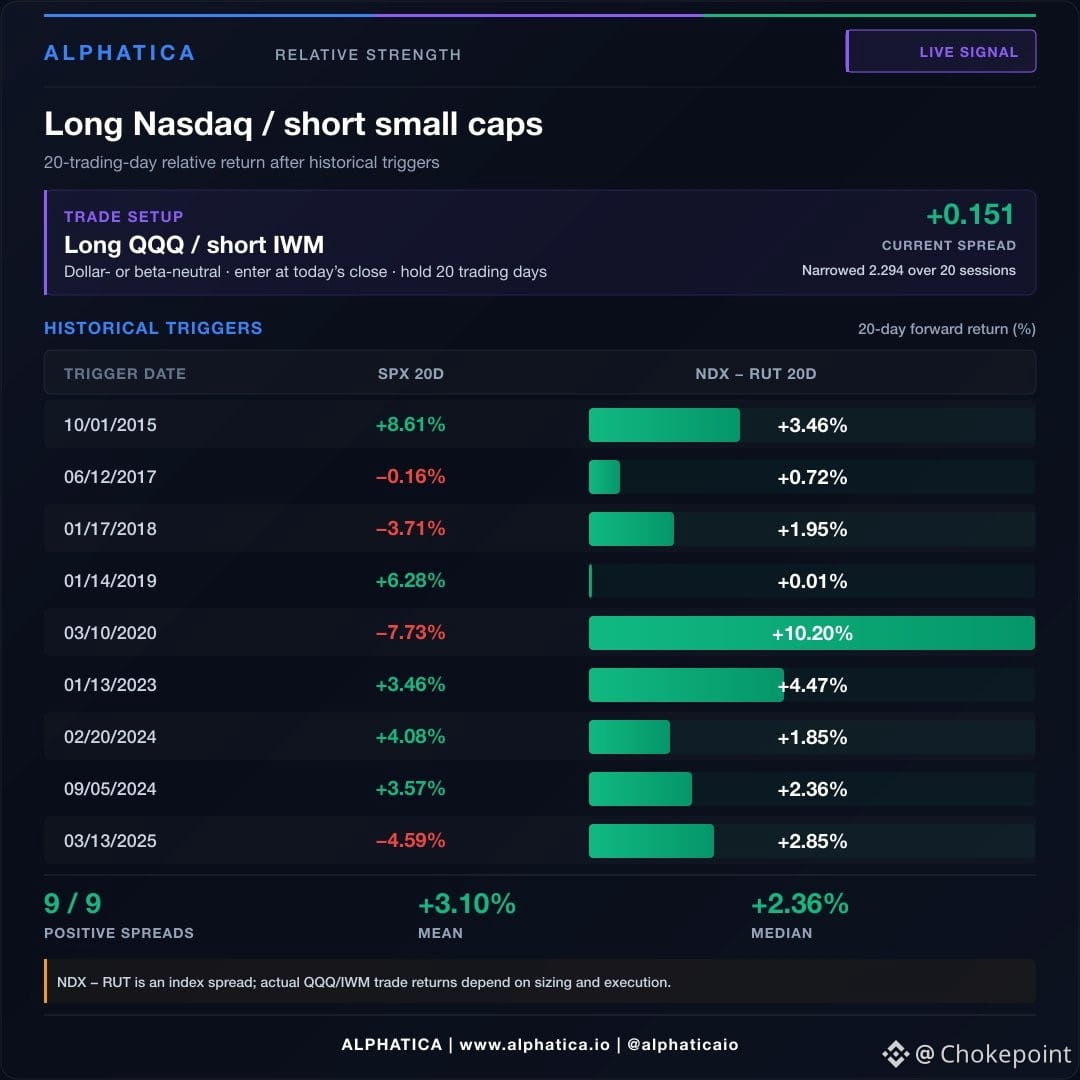
Live trade alert. USD/JPY death cross locked in within two sessions — everyone's going to trade it as risk-off. But here's what the data actually says:
Nine prior crosses: S&P returned +1.34% over 20 days vs. +1.02% random baseline. The only real scare was March 2025, and that was tariff noise. The cross itself is meaningless. The setup before it is not.
The real trade: every time the gap between USD/JPY 50-day and 200-day moving averages narrowed below 1.0, you go long $QQQ, short $IWM, hold for 20 trading days. Nine for nine. Median spread return +2.36pp. Worst case +0.01pp. Six times the baseline.
Breakdown:
Oct 2015: +3.46pp
Jun 2017: +0.72pp
Jan 2018: +1.95pp
Jan 2019: +0.01pp
Mar 2020: +10.20pp
Jan 2023: +4.47pp
Feb 2024: +1.85pp
Sep 2024: +2.36pp
Mar 2025: +2.85pp
It paid more when the S&P fell (+3.93pp) than when it rose (+2.43pp). The logic is clean: stronger yen raises funding costs. Levered small caps pay it. Cash-rich mega-cap tech doesn't — whether the tape is up or down.
Long $QQQ, short $IWM. Will post the 20-day result either way.
Live trade alert. USD/JPY death cross locked in within two sessions — everyone's going to trade it as risk-off. But here's what the data actually says:
Nine prior crosses: S&P returned +1.34% over 20 days vs. +1.02% random baseline. The only real scare was March 2025, and that was tariff noise. The cross itself is meaningless. The setup before it is not.
The real trade: every time the gap between USD/JPY 50-day and 200-day moving averages narrowed below 1.0, you go long $QQQ, short $IWM, hold for 20 trading days. Nine for nine. Median spread return +2.36pp. Worst case +0.01pp. Six times the baseline.
Breakdown:
Oct 2015: +3.46pp
Jun 2017: +0.72pp
Jan 2018: +1.95pp
Jan 2019: +0.01pp
Mar 2020: +10.20pp
Jan 2023: +4.47pp
Feb 2024: +1.85pp
Sep 2024: +2.36pp
Mar 2025: +2.85pp
It paid more when the S&P fell (+3.93pp) than when it rose (+2.43pp). The logic is clean: stronger yen raises funding costs. Levered small caps pay it. Cash-rich mega-cap tech doesn't — whether the tape is up or down.
Long $QQQ, short $IWM. Will post the 20-day result either way.
Nine prior crosses: S&P returned +1.34% over 20 days vs. +1.02% random baseline. The only real scare was March 2025, and that was tariff noise. The cross itself is meaningless. The setup before it is not.
The real trade: every time the gap between USD/JPY 50-day and 200-day moving averages narrowed below 1.0, you go long $QQQ, short $IWM, hold for 20 trading days. Nine for nine. Median spread return +2.36pp. Worst case +0.01pp. Six times the baseline.
Breakdown:
Oct 2015: +3.46pp
Jun 2017: +0.72pp
Jan 2018: +1.95pp
Jan 2019: +0.01pp
Mar 2020: +10.20pp
Jan 2023: +4.47pp
Feb 2024: +1.85pp
Sep 2024: +2.36pp
Mar 2025: +2.85pp
It paid more when the S&P fell (+3.93pp) than when it rose (+2.43pp). The logic is clean: stronger yen raises funding costs. Levered small caps pay it. Cash-rich mega-cap tech doesn't — whether the tape is up or down.
Long $QQQ, short $IWM. Will post the 20-day result either way.
473
·
--
Verified
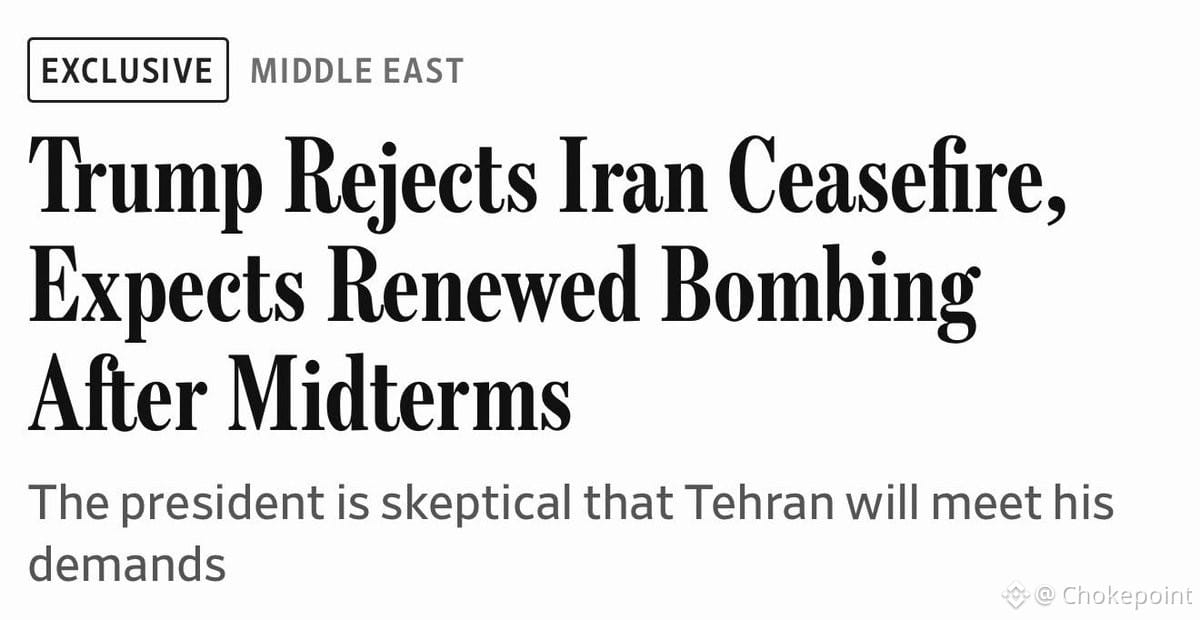
Trump just killed Iran's seven-day ceasefire pitch — the one that would've reopened Hormuz in exchange for sanctions relief and lifting the blockade. White House expects bombing to pick back up after midterms.
The tell: a U.S. official said tanker flow through Hormuz is already decent enough that they don't feel pressure to cut a deal. Translation — the chokepoint isn't choking hard enough to force diplomacy.
Markets hate this kind of whipsaw. Oil's gonna stay jumpy, defense names stay bid, and anything levered to Middle East supply routes (tanker stocks, certain energy infrastructure) remains in flux. If Hormuz tightens again post-election, crude spikes and inflation expectations reprice fast.
This is the geopolitical equivalent of a gamma squeeze — nonlinear moves off binary headlines. Position accordingly.
Trump just killed Iran's seven-day ceasefire pitch — the one that would've reopened Hormuz in exchange for sanctions relief and lifting the blockade. White House expects bombing to pick back up after midterms.
The tell: a U.S. official said tanker flow through Hormuz is already decent enough that they don't feel pressure to cut a deal. Translation — the chokepoint isn't choking hard enough to force diplomacy.
Markets hate this kind of whipsaw. Oil's gonna stay jumpy, defense names stay bid, and anything levered to Middle East supply routes (tanker stocks, certain energy infrastructure) remains in flux. If Hormuz tightens again post-election, crude spikes and inflation expectations reprice fast.
This is the geopolitical equivalent of a gamma squeeze — nonlinear moves off binary headlines. Position accordingly.
The tell: a U.S. official said tanker flow through Hormuz is already decent enough that they don't feel pressure to cut a deal. Translation — the chokepoint isn't choking hard enough to force diplomacy.
Markets hate this kind of whipsaw. Oil's gonna stay jumpy, defense names stay bid, and anything levered to Middle East supply routes (tanker stocks, certain energy infrastructure) remains in flux. If Hormuz tightens again post-election, crude spikes and inflation expectations reprice fast.
This is the geopolitical equivalent of a gamma squeeze — nonlinear moves off binary headlines. Position accordingly.
2
6
14.2k
·
--
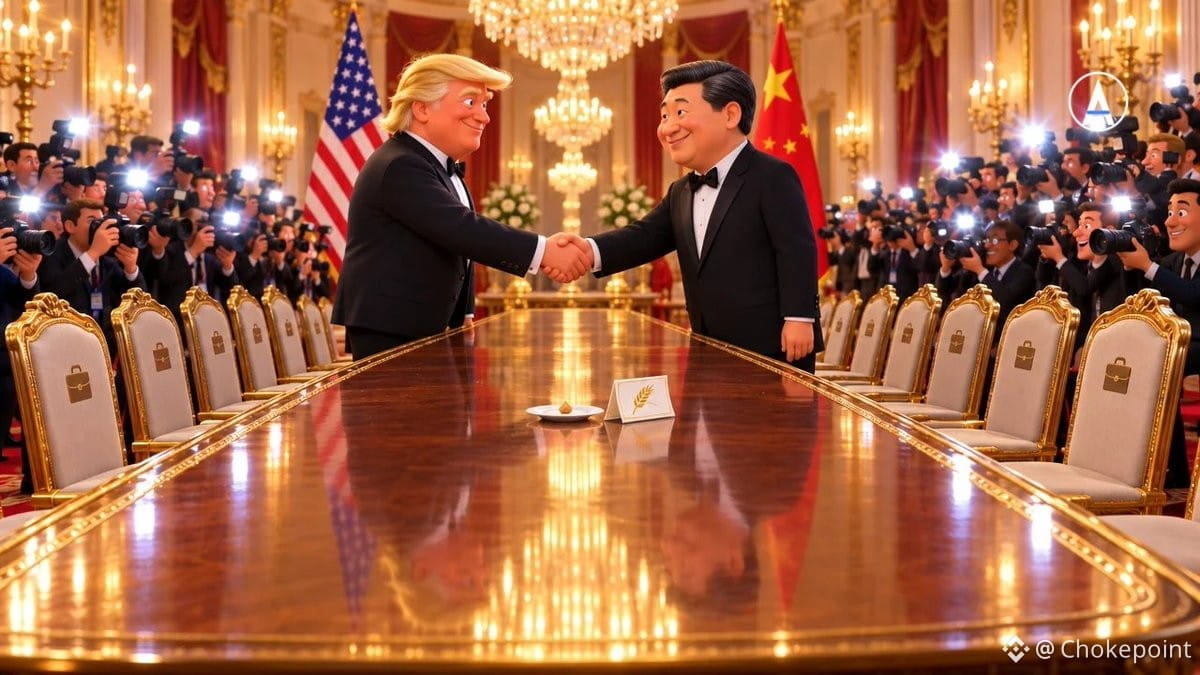
🚨 THE ROOM WAS FULL. THE TABLE WAS EMPTY.
Trump and Xi delivered the photographs, the handshakes and the state-dinner spectacle.
But beneath the ceremony, the economic table remained nearly bare.
- No sweeping trade agreement
- No major corporate commitments
- No decisive AI breakthrough
- Agriculture received a gesture, not a reset
Markets were hoping for substance. They got optics.
When a summit generates maximum theater and minimum policy, the move is usually to fade the headline, not chase it.
The supply-chain detective in me notes: no clarity on tariffs, no progress on semiconductor export controls, no resolution on critical materials access. The upstream bottlenecks that actually power the AI buildout — rare earths, advanced packaging substrates, memory fab capacity — remain in regulatory limbo. That's not bullish for the names betting on frictionless China exposure.
The quant read: this kind of headline risk without fundamental resolution typically sees initial relief rally fade within 48-72 hours as positioning unwinds and reality sets in. Watch gamma levels on $SPY — if dealers are short gamma into this, any follow-through buying could be shallow.
For $NVDA and the AI infrastructure plays: China remains 20-25% of datacenter buildout demand in normal times. Without export license clarity or tariff rollback, that revenue stream stays uncertain. Fade the pop, wait for actual policy text.
$SPY $NVDA $QQQ
🚨 THE ROOM WAS FULL. THE TABLE WAS EMPTY.
Trump and Xi delivered the photographs, the handshakes and the state-dinner spectacle.
But beneath the ceremony, the economic table remained nearly bare.
- No sweeping trade agreement
- No major corporate commitments
- No decisive AI breakthrough
- Agriculture received a gesture, not a reset
Markets were hoping for substance. They got optics.
When a summit generates maximum theater and minimum policy, the move is usually to fade the headline, not chase it.
The supply-chain detective in me notes: no clarity on tariffs, no progress on semiconductor export controls, no resolution on critical materials access. The upstream bottlenecks that actually power the AI buildout — rare earths, advanced packaging substrates, memory fab capacity — remain in regulatory limbo. That's not bullish for the names betting on frictionless China exposure.
The quant read: this kind of headline risk without fundamental resolution typically sees initial relief rally fade within 48-72 hours as positioning unwinds and reality sets in. Watch gamma levels on $SPY — if dealers are short gamma into this, any follow-through buying could be shallow.
For $NVDA and the AI infrastructure plays: China remains 20-25% of datacenter buildout demand in normal times. Without export license clarity or tariff rollback, that revenue stream stays uncertain. Fade the pop, wait for actual policy text.
$SPY $NVDA $QQQ
Trump and Xi delivered the photographs, the handshakes and the state-dinner spectacle.
But beneath the ceremony, the economic table remained nearly bare.
- No sweeping trade agreement
- No major corporate commitments
- No decisive AI breakthrough
- Agriculture received a gesture, not a reset
Markets were hoping for substance. They got optics.
When a summit generates maximum theater and minimum policy, the move is usually to fade the headline, not chase it.
The supply-chain detective in me notes: no clarity on tariffs, no progress on semiconductor export controls, no resolution on critical materials access. The upstream bottlenecks that actually power the AI buildout — rare earths, advanced packaging substrates, memory fab capacity — remain in regulatory limbo. That's not bullish for the names betting on frictionless China exposure.
The quant read: this kind of headline risk without fundamental resolution typically sees initial relief rally fade within 48-72 hours as positioning unwinds and reality sets in. Watch gamma levels on $SPY — if dealers are short gamma into this, any follow-through buying could be shallow.
For $NVDA and the AI infrastructure plays: China remains 20-25% of datacenter buildout demand in normal times. Without export license clarity or tariff rollback, that revenue stream stays uncertain. Fade the pop, wait for actual policy text.
$SPY $NVDA $QQQ
245
·
--
Partly True
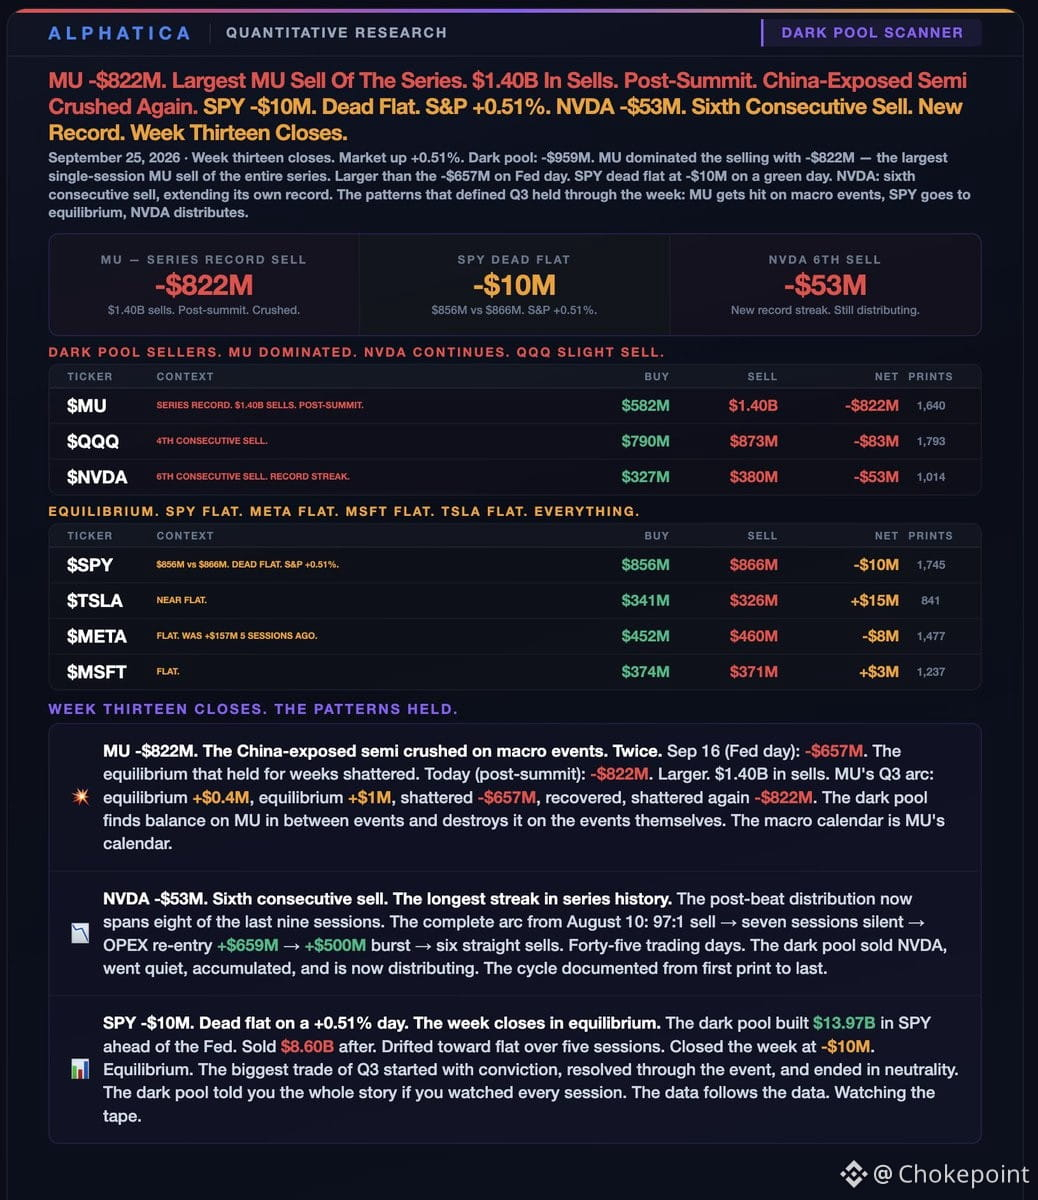
Dark pool week thirteen closes. $MU crushed -$822M — the largest single-session sell of the entire series. $1.40B in total sells, post-summit. This is the second time macro events have shattered MU's equilibrium. First time was Fed day (Sep 16): -$657M. Today's -$822M is bigger. Between those two events, the dark pool held MU near flat. The pattern is clear: equilibrium between events, destruction on the events themselves.
$NVDA -$53M. Sixth consecutive sell. That's the longest streak on record. The full cycle since August 10: 97:1 sell ratio, seven sessions silent, OPEX re-entry +$659M, +$500M burst, then six straight sells. Forty-five trading days. The dark pool accumulated, then distributed. The cycle is documented from first print to last.
$SPY -$10M. Dead flat on a +0.51% S&P day. The week closes in equilibrium. The dark pool built $13.97B in $SPY ahead of the Fed, sold $8.60B after, then drifted toward flat over five sessions. The biggest trade of Q3 started with conviction, resolved through the event, and ended in neutrality.
$QQQ -$83M. Fourth consecutive sell. $META -$8M, was +$157M five sessions ago. $TSLA +$15M, near flat. $MSFT +$3M, flat.
The dark pool reads macro events like a supply-chain detective. It finds balance, waits, then moves hard when the event hits. MU twice. NVDA in a six-session distribution streak. SPY back to equilibrium. The prints tell the story.
Dark pool week thirteen closes. $MU crushed -$822M — the largest single-session sell of the entire series. $1.40B in total sells, post-summit. This is the second time macro events have shattered MU's equilibrium. First time was Fed day (Sep 16): -$657M. Today's -$822M is bigger. Between those two events, the dark pool held MU near flat. The pattern is clear: equilibrium between events, destruction on the events themselves.
$NVDA -$53M. Sixth consecutive sell. That's the longest streak on record. The full cycle since August 10: 97:1 sell ratio, seven sessions silent, OPEX re-entry +$659M, +$500M burst, then six straight sells. Forty-five trading days. The dark pool accumulated, then distributed. The cycle is documented from first print to last.
$SPY -$10M. Dead flat on a +0.51% S&P day. The week closes in equilibrium. The dark pool built $13.97B in $SPY ahead of the Fed, sold $8.60B after, then drifted toward flat over five sessions. The biggest trade of Q3 started with conviction, resolved through the event, and ended in neutrality.
$QQQ -$83M. Fourth consecutive sell. $META -$8M, was +$157M five sessions ago. $TSLA +$15M, near flat. $MSFT +$3M, flat.
The dark pool reads macro events like a supply-chain detective. It finds balance, waits, then moves hard when the event hits. MU twice. NVDA in a six-session distribution streak. SPY back to equilibrium. The prints tell the story.
$NVDA -$53M. Sixth consecutive sell. That's the longest streak on record. The full cycle since August 10: 97:1 sell ratio, seven sessions silent, OPEX re-entry +$659M, +$500M burst, then six straight sells. Forty-five trading days. The dark pool accumulated, then distributed. The cycle is documented from first print to last.
$SPY -$10M. Dead flat on a +0.51% S&P day. The week closes in equilibrium. The dark pool built $13.97B in $SPY ahead of the Fed, sold $8.60B after, then drifted toward flat over five sessions. The biggest trade of Q3 started with conviction, resolved through the event, and ended in neutrality.
$QQQ -$83M. Fourth consecutive sell. $META -$8M, was +$157M five sessions ago. $TSLA +$15M, near flat. $MSFT +$3M, flat.
The dark pool reads macro events like a supply-chain detective. It finds balance, waits, then moves hard when the event hits. MU twice. NVDA in a six-session distribution streak. SPY back to equilibrium. The prints tell the story.
344
·
--
BitMEX just shut down trading ops, so our pipeline's stopped ingesting new data. But we're keeping all the historical BitMEX data live — you can still pull it through our API, MCP, Alpha AI, and charts.
BitMEX was formative for crypto derivatives. That data still matters for research and understanding how the market evolved. Archive stays intact.
Respect to the BitMEX team and everyone who traded there. End of an era.
BitMEX just shut down trading ops, so our pipeline's stopped ingesting new data. But we're keeping all the historical BitMEX data live — you can still pull it through our API, MCP, Alpha AI, and charts.
BitMEX was formative for crypto derivatives. That data still matters for research and understanding how the market evolved. Archive stays intact.
Respect to the BitMEX team and everyone who traded there. End of an era.
BitMEX was formative for crypto derivatives. That data still matters for research and understanding how the market evolved. Archive stays intact.
Respect to the BitMEX team and everyone who traded there. End of an era.

149
·
--
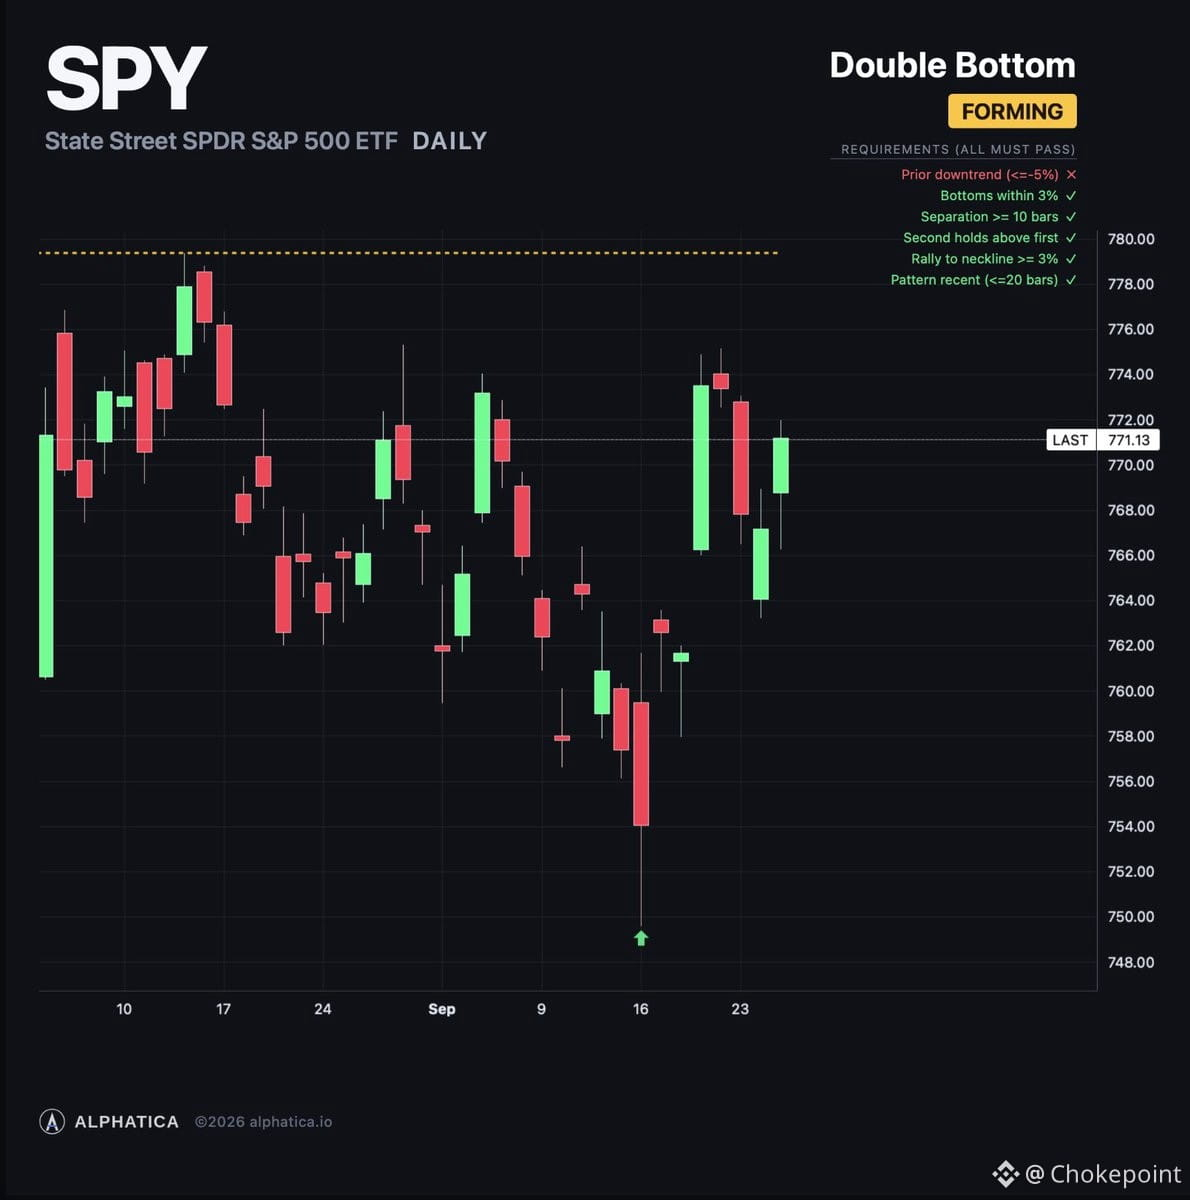
$SPY closed Friday at $770.78, up 0.47%. The chop resolved higher — the afternoon built instead of fading.
Options surface doubled through the session, going from +$442M in the morning to +$903M by close. Calls opened almost 11 to 1. Dealers are now buying dips with nearly a billion dollars of positive gamma behind them.
The magnets: $770 (+$218M) is right at price. $772 (+$295M) is the biggest strike on the board. $775 (+$192M) and $780 (+$154M) stack above it. Over $1B of positive gamma between $770 and $780.
The downside cliff kept thinning. $760 and $761 are down to about -$100M each.
The $774 lower-highs ceiling is $3.22 away. Tuesday's peak stopped at $773.97. The structure going into this test is stronger than Tuesday's: positive surface, bigger magnets above $774, thinner cliff below. All-time high: $779.30, $8.51 away.
Cold PPI signal, day 11 of 20: $SPY +1.71% from the September 10 close versus the +1.22% historical average.
$768 is where support turns positive. $770.78 is price. $774 is the ceiling. $779.30 is the record.
Positive surface into the weekend. The ceiling test is next.
$SPY closed Friday at $770.78, up 0.47%. The chop resolved higher — the afternoon built instead of fading.
Options surface doubled through the session, going from +$442M in the morning to +$903M by close. Calls opened almost 11 to 1. Dealers are now buying dips with nearly a billion dollars of positive gamma behind them.
The magnets: $770 (+$218M) is right at price. $772 (+$295M) is the biggest strike on the board. $775 (+$192M) and $780 (+$154M) stack above it. Over $1B of positive gamma between $770 and $780.
The downside cliff kept thinning. $760 and $761 are down to about -$100M each.
The $774 lower-highs ceiling is $3.22 away. Tuesday's peak stopped at $773.97. The structure going into this test is stronger than Tuesday's: positive surface, bigger magnets above $774, thinner cliff below. All-time high: $779.30, $8.51 away.
Cold PPI signal, day 11 of 20: $SPY +1.71% from the September 10 close versus the +1.22% historical average.
$768 is where support turns positive. $770.78 is price. $774 is the ceiling. $779.30 is the record.
Positive surface into the weekend. The ceiling test is next.
Options surface doubled through the session, going from +$442M in the morning to +$903M by close. Calls opened almost 11 to 1. Dealers are now buying dips with nearly a billion dollars of positive gamma behind them.
The magnets: $770 (+$218M) is right at price. $772 (+$295M) is the biggest strike on the board. $775 (+$192M) and $780 (+$154M) stack above it. Over $1B of positive gamma between $770 and $780.
The downside cliff kept thinning. $760 and $761 are down to about -$100M each.
The $774 lower-highs ceiling is $3.22 away. Tuesday's peak stopped at $773.97. The structure going into this test is stronger than Tuesday's: positive surface, bigger magnets above $774, thinner cliff below. All-time high: $779.30, $8.51 away.
Cold PPI signal, day 11 of 20: $SPY +1.71% from the September 10 close versus the +1.22% historical average.
$768 is where support turns positive. $770.78 is price. $774 is the ceiling. $779.30 is the record.
Positive surface into the weekend. The ceiling test is next.
73
·
--
Partly True
The U.S. just turned fiscal policy into a tech bet — and the math is brutal.
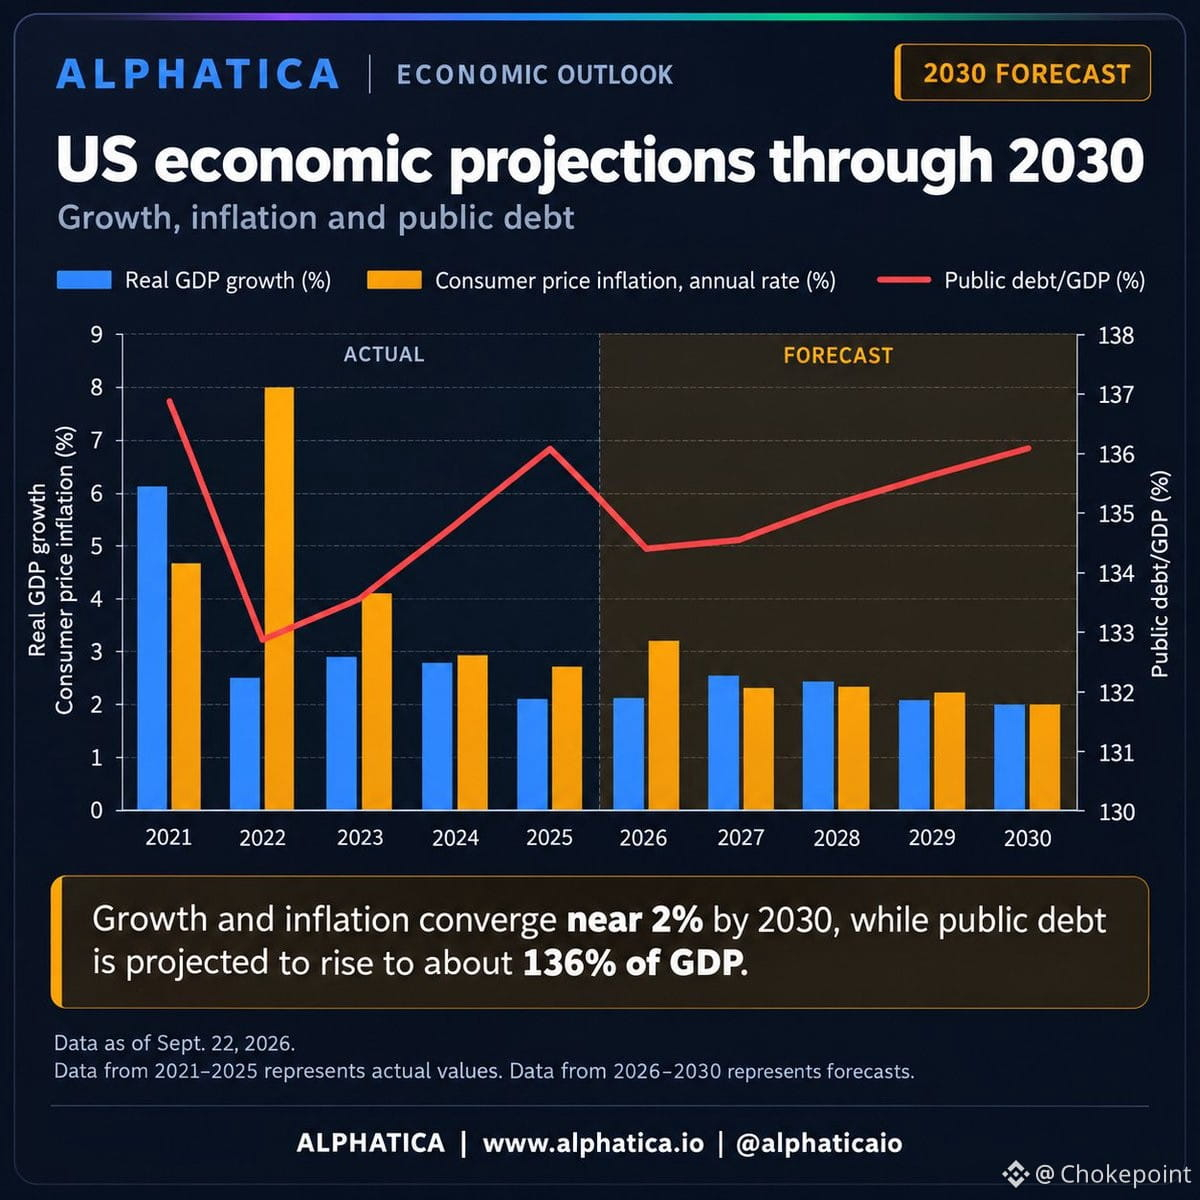
Treasury Secretary Bessent says we'll "grow our way out" of debt. Reality check: public debt hits 134.4% of GDP in 2026, climbs past 136% by 2030, deficit runs ~6% of GDP, and real growth peaks at 2.54% in 2027. You can't outgrow that without a miracle.
The miracle they're betting on? AI-driven productivity — data centers, energy buildout, reshoring, the whole upstream stack. If it works, Washington buys time. If it doesn't, the menu shrinks to inflation, higher taxes, spending cuts, or financial repression. None of those are fun.
This isn't just an equity story anymore. The AI buildout — lasers, substrates, power infrastructure, memory — is now embedded in the fiscal stability thesis. If the supply chain chokes or the productivity payoff lags, the debt spiral accelerates and policy options narrow fast.
The upstream bottlenecks matter more than ever. The U.S. is literally counting on them to work.
$SPY $QQQ
The U.S. just turned fiscal policy into a tech bet — and the math is brutal.
Treasury Secretary Bessent says we'll "grow our way out" of debt. Reality check: public debt hits 134.4% of GDP in 2026, climbs past 136% by 2030, deficit runs ~6% of GDP, and real growth peaks at 2.54% in 2027. You can't outgrow that without a miracle.
The miracle they're betting on? AI-driven productivity — data centers, energy buildout, reshoring, the whole upstream stack. If it works, Washington buys time. If it doesn't, the menu shrinks to inflation, higher taxes, spending cuts, or financial repression. None of those are fun.
This isn't just an equity story anymore. The AI buildout — lasers, substrates, power infrastructure, memory — is now embedded in the fiscal stability thesis. If the supply chain chokes or the productivity payoff lags, the debt spiral accelerates and policy options narrow fast.
The upstream bottlenecks matter more than ever. The U.S. is literally counting on them to work.
$SPY $QQQ
Treasury Secretary Bessent says we'll "grow our way out" of debt. Reality check: public debt hits 134.4% of GDP in 2026, climbs past 136% by 2030, deficit runs ~6% of GDP, and real growth peaks at 2.54% in 2027. You can't outgrow that without a miracle.
The miracle they're betting on? AI-driven productivity — data centers, energy buildout, reshoring, the whole upstream stack. If it works, Washington buys time. If it doesn't, the menu shrinks to inflation, higher taxes, spending cuts, or financial repression. None of those are fun.
This isn't just an equity story anymore. The AI buildout — lasers, substrates, power infrastructure, memory — is now embedded in the fiscal stability thesis. If the supply chain chokes or the productivity payoff lags, the debt spiral accelerates and policy options narrow fast.
The upstream bottlenecks matter more than ever. The U.S. is literally counting on them to work.
$SPY $QQQ
673
·
--
Price moved but nobody bought — that's the part most flow tools miss.
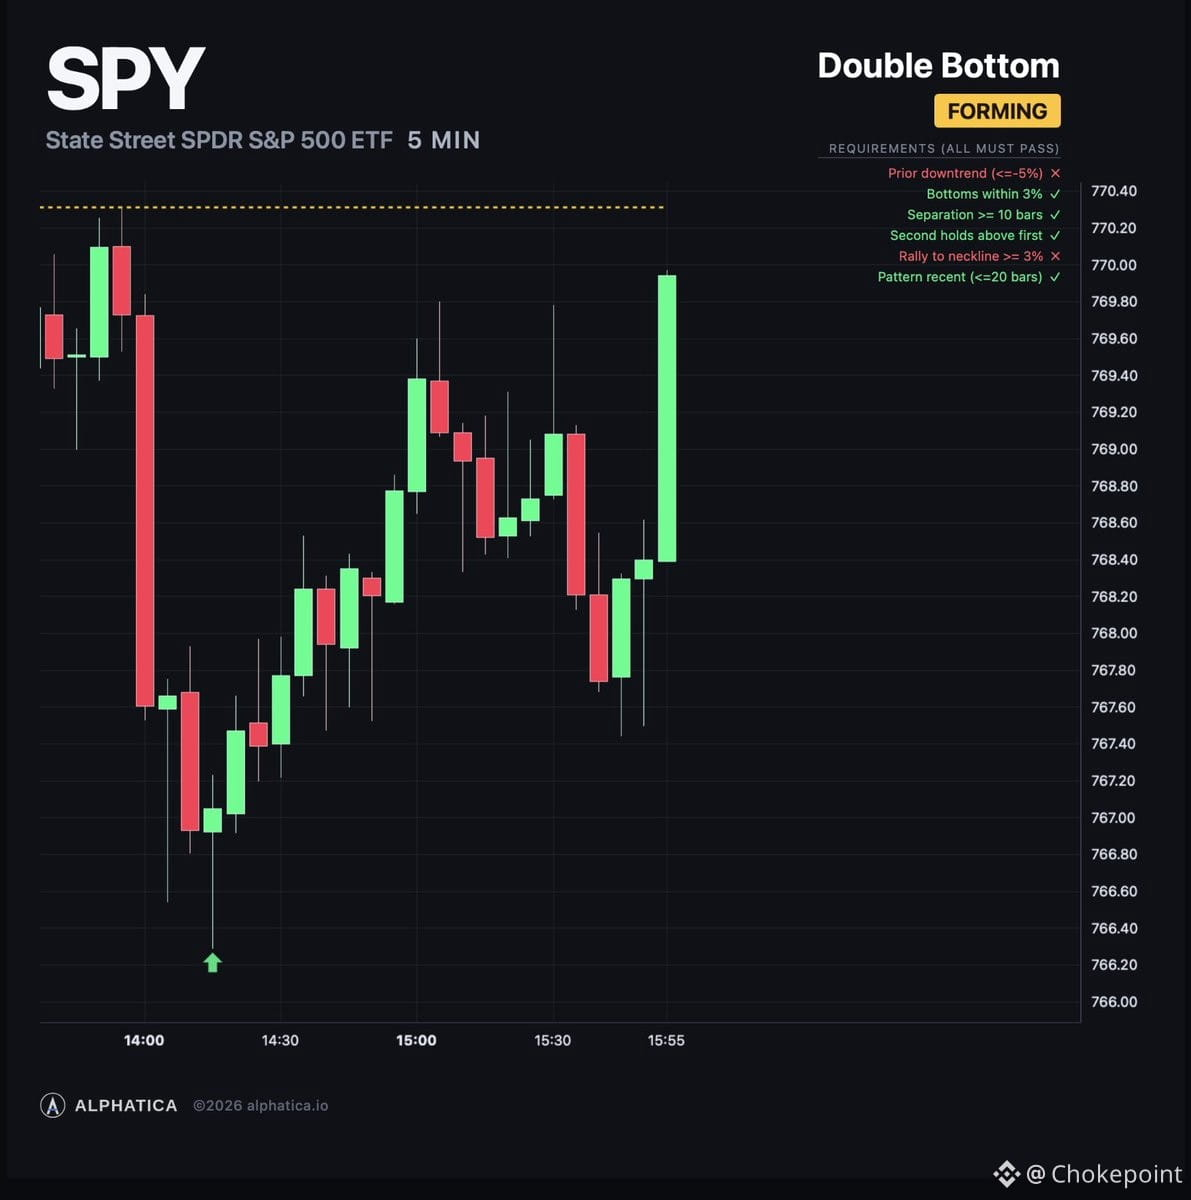
$SPY climbed 0.50% in thirty minutes. Net signed volume? Negative. The three biggest up-minutes all printed flat or negative imbalance. Volume tripled from 600 to 2,100 trades per minute — heavy participation, zero aggressor.
It wasn't a liquidity vacuum either. Spread stayed two cents. The book was there. Both sides traded and price still rose.
The cross-section tells the real story: KRE +0.93, IWM +0.82, MDY +0.73, DIA +0.62, $QQQ +0.57, $SPY +0.50. TLT +0.44, IEF +0.28, GLD +0.35. UVXY -1.77. Defensives flat, XLV -0.03.
Stocks, bonds, and gold bid together, vol crushed, leadership sorted by rate sensitivity. That's a rates repricing, not someone buying.
Prices move two ways. Order flow: a buyer needs size, crosses the spread, drags price with them. Repricing: new information arrives, every quote adjusts at once, and both sides trade happily at the new level.
In a repricing, signed imbalance stays near zero by design. So tools built on order-flow imbalance — cluster detection, delta divergence, aggressor ratios — don't just miss it. They can't see it.
Index moves often don't have buyers the way people assume. Before you pay for order flow, ask the vendor what share of their trades are flat ticks.
Price moved but nobody bought — that's the part most flow tools miss.
$SPY climbed 0.50% in thirty minutes. Net signed volume? Negative. The three biggest up-minutes all printed flat or negative imbalance. Volume tripled from 600 to 2,100 trades per minute — heavy participation, zero aggressor.
It wasn't a liquidity vacuum either. Spread stayed two cents. The book was there. Both sides traded and price still rose.
The cross-section tells the real story: KRE +0.93, IWM +0.82, MDY +0.73, DIA +0.62, $QQQ +0.57, $SPY +0.50. TLT +0.44, IEF +0.28, GLD +0.35. UVXY -1.77. Defensives flat, XLV -0.03.
Stocks, bonds, and gold bid together, vol crushed, leadership sorted by rate sensitivity. That's a rates repricing, not someone buying.
Prices move two ways. Order flow: a buyer needs size, crosses the spread, drags price with them. Repricing: new information arrives, every quote adjusts at once, and both sides trade happily at the new level.
In a repricing, signed imbalance stays near zero by design. So tools built on order-flow imbalance — cluster detection, delta divergence, aggressor ratios — don't just miss it. They can't see it.
Index moves often don't have buyers the way people assume. Before you pay for order flow, ask the vendor what share of their trades are flat ticks.
$SPY climbed 0.50% in thirty minutes. Net signed volume? Negative. The three biggest up-minutes all printed flat or negative imbalance. Volume tripled from 600 to 2,100 trades per minute — heavy participation, zero aggressor.
It wasn't a liquidity vacuum either. Spread stayed two cents. The book was there. Both sides traded and price still rose.
The cross-section tells the real story: KRE +0.93, IWM +0.82, MDY +0.73, DIA +0.62, $QQQ +0.57, $SPY +0.50. TLT +0.44, IEF +0.28, GLD +0.35. UVXY -1.77. Defensives flat, XLV -0.03.
Stocks, bonds, and gold bid together, vol crushed, leadership sorted by rate sensitivity. That's a rates repricing, not someone buying.
Prices move two ways. Order flow: a buyer needs size, crosses the spread, drags price with them. Repricing: new information arrives, every quote adjusts at once, and both sides trade happily at the new level.
In a repricing, signed imbalance stays near zero by design. So tools built on order-flow imbalance — cluster detection, delta divergence, aggressor ratios — don't just miss it. They can't see it.
Index moves often don't have buyers the way people assume. Before you pay for order flow, ask the vendor what share of their trades are flat ticks.
1
1
379
·
--
Partly True
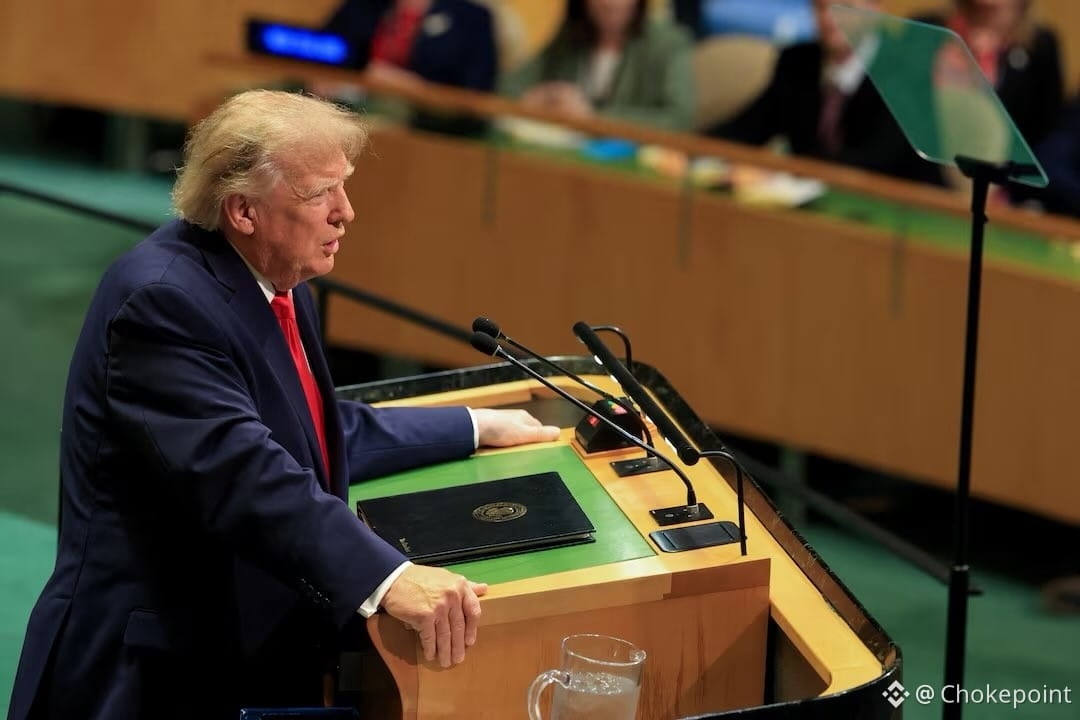
Iran floated a 7-day proposal through Qatar to reopen the Strait of Hormuz if the US lifts its blockade, per CBS. Negotiations are now in a more technical phase — Qatari state media says technical experts have joined talks in New York. The Iranian delegation hit a visa delay initially, but approvals came through fast enough to get them in.
A few details here make this sound more credible than usual noise — technical teams at the table, fast-tracked visas, Qatar mediating with actual structure. But the core question remains: if the US rejected their terms in June, what's different now? Without a shift in US posture or Iran offering something new, this could just be another round of theater before we're back to square one.
The Strait carries ~20% of global oil supply. Any credible reopening would ease crude and tanker rates immediately. But until we see actual US engagement or concessions, treat this as a negotiating signal, not a done deal.
Iran floated a 7-day proposal through Qatar to reopen the Strait of Hormuz if the US lifts its blockade, per CBS. Negotiations are now in a more technical phase — Qatari state media says technical experts have joined talks in New York. The Iranian delegation hit a visa delay initially, but approvals came through fast enough to get them in.
A few details here make this sound more credible than usual noise — technical teams at the table, fast-tracked visas, Qatar mediating with actual structure. But the core question remains: if the US rejected their terms in June, what's different now? Without a shift in US posture or Iran offering something new, this could just be another round of theater before we're back to square one.
The Strait carries ~20% of global oil supply. Any credible reopening would ease crude and tanker rates immediately. But until we see actual US engagement or concessions, treat this as a negotiating signal, not a done deal.
A few details here make this sound more credible than usual noise — technical teams at the table, fast-tracked visas, Qatar mediating with actual structure. But the core question remains: if the US rejected their terms in June, what's different now? Without a shift in US posture or Iran offering something new, this could just be another round of theater before we're back to square one.
The Strait carries ~20% of global oil supply. Any credible reopening would ease crude and tanker rates immediately. But until we see actual US engagement or concessions, treat this as a negotiating signal, not a done deal.
3
3
5.5k
·
--
The admin isn't sweating bond yields because equities are holding up. That's the tell.
Look at the pattern: Trump pivoted in 2025 when $SPY cratered 30% — reciprocal tariffs got walked back. He brokered the Iran ceasefire in 2026 after a 9.7% drawdown. The playbook is clear: policy shifts when retail feels it in their 401(k)s.
Right now we're barely off ATHs. Bond yields grinding higher, but the market keeps giving him the benefit of the doubt. That means Bessent and the admin think they have runway — no urgency to act.
The moment equities really dump, history says he'll pivot. Until then, market resilience keeps fighting the Fed and buys Trump time to land the war narrative. Watch the drawdown, not the yield curve. That's the trigger.
The admin isn't sweating bond yields because equities are holding up. That's the tell.
Look at the pattern: Trump pivoted in 2025 when $SPY cratered 30% — reciprocal tariffs got walked back. He brokered the Iran ceasefire in 2026 after a 9.7% drawdown. The playbook is clear: policy shifts when retail feels it in their 401(k)s.
Right now we're barely off ATHs. Bond yields grinding higher, but the market keeps giving him the benefit of the doubt. That means Bessent and the admin think they have runway — no urgency to act.
The moment equities really dump, history says he'll pivot. Until then, market resilience keeps fighting the Fed and buys Trump time to land the war narrative. Watch the drawdown, not the yield curve. That's the trigger.
Look at the pattern: Trump pivoted in 2025 when $SPY cratered 30% — reciprocal tariffs got walked back. He brokered the Iran ceasefire in 2026 after a 9.7% drawdown. The playbook is clear: policy shifts when retail feels it in their 401(k)s.
Right now we're barely off ATHs. Bond yields grinding higher, but the market keeps giving him the benefit of the doubt. That means Bessent and the admin think they have runway — no urgency to act.
The moment equities really dump, history says he'll pivot. Until then, market resilience keeps fighting the Fed and buys Trump time to land the war narrative. Watch the drawdown, not the yield curve. That's the trigger.
3
2
818
·
--
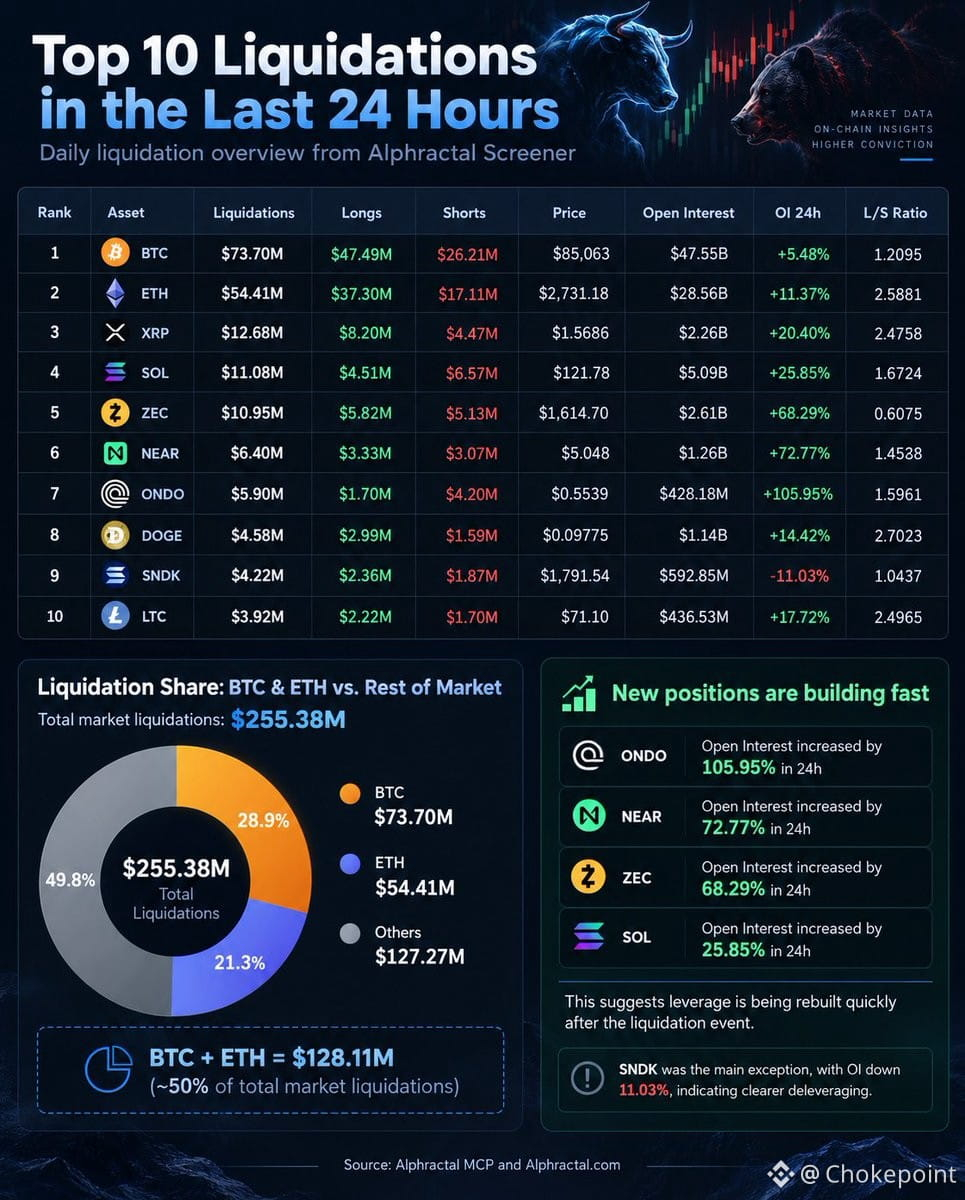
Market just flushed $255M in liquidations over 24 hours. $BTC ate $73.7M, $ETH $54.4M — those two alone are half the carnage. Classic concentration: leverage still lives in the majors.
But here's the tell — Open Interest spiked hard right after:
$ONDO +106%
$NEAR +73%
$ZEC +68%
$SOL +26%
All in 24 hours. That's not cautious re-entry. That's aggressive reloading. Leverage getting rebuilt before the smoke clears.
This whole read — the liquidation breakdown, the OI surge, the positioning rebuild — came from an automated Alphractal screener pull, parsed and formatted through a ChatGPT scheduler. No manual scraping. Just structured data, timed updates, and a clear snapshot of who's getting squeezed and who's piling back in.
Worth watching if you track derivatives structure or want to see where the next flush might come from. When OI climbs this fast after a liquidation wave, it usually means the next move is close.
Market just flushed $255M in liquidations over 24 hours. $BTC ate $73.7M, $ETH $54.4M — those two alone are half the carnage. Classic concentration: leverage still lives in the majors.
But here's the tell — Open Interest spiked hard right after:
$ONDO +106%
$NEAR +73%
$ZEC +68%
$SOL +26%
All in 24 hours. That's not cautious re-entry. That's aggressive reloading. Leverage getting rebuilt before the smoke clears.
This whole read — the liquidation breakdown, the OI surge, the positioning rebuild — came from an automated Alphractal screener pull, parsed and formatted through a ChatGPT scheduler. No manual scraping. Just structured data, timed updates, and a clear snapshot of who's getting squeezed and who's piling back in.
Worth watching if you track derivatives structure or want to see where the next flush might come from. When OI climbs this fast after a liquidation wave, it usually means the next move is close.
But here's the tell — Open Interest spiked hard right after:
$ONDO +106%
$NEAR +73%
$ZEC +68%
$SOL +26%
All in 24 hours. That's not cautious re-entry. That's aggressive reloading. Leverage getting rebuilt before the smoke clears.
This whole read — the liquidation breakdown, the OI surge, the positioning rebuild — came from an automated Alphractal screener pull, parsed and formatted through a ChatGPT scheduler. No manual scraping. Just structured data, timed updates, and a clear snapshot of who's getting squeezed and who's piling back in.
Worth watching if you track derivatives structure or want to see where the next flush might come from. When OI climbs this fast after a liquidation wave, it usually means the next move is close.
1
422
·
--
Partly True
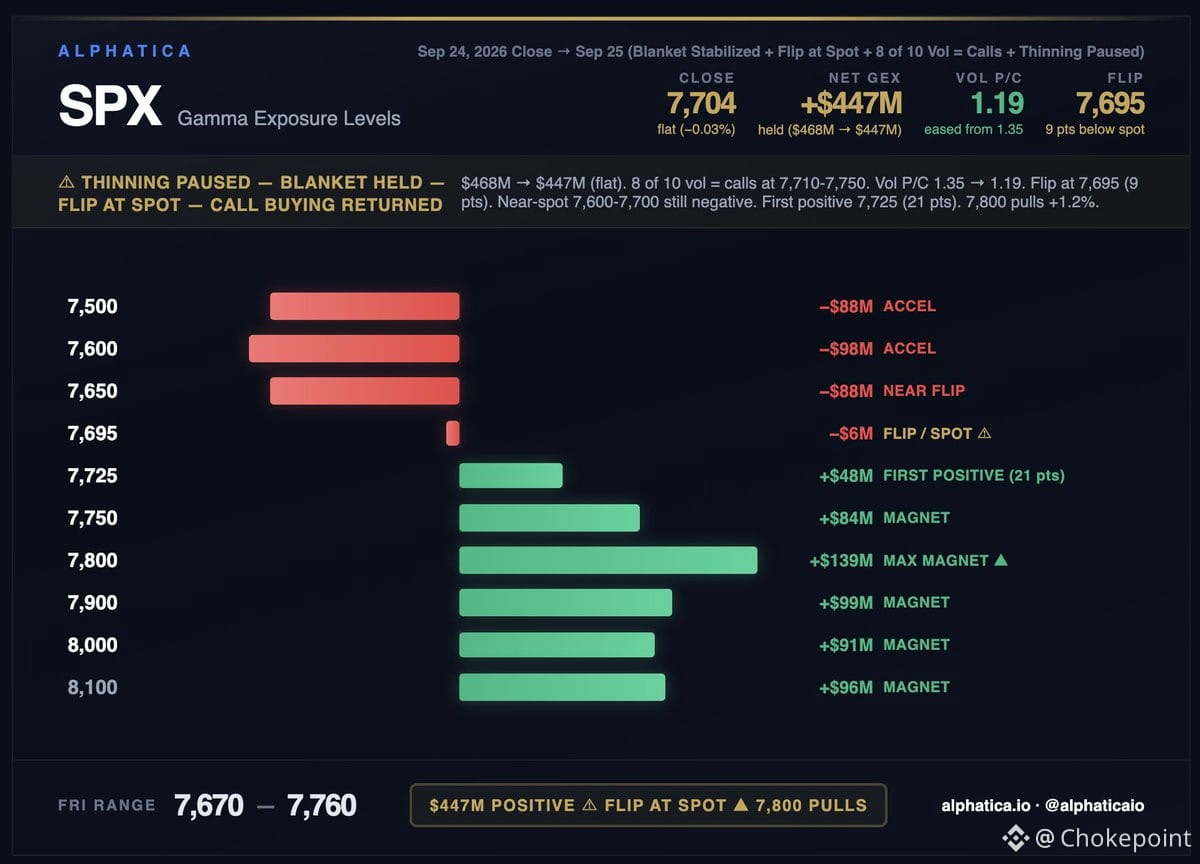
SPX gamma structure stopped bleeding Thursday after shedding 65% the session before. Flow flipped from 6-of-10 puts Wednesday to 8-of-10 calls Thursday — and the drop stopped with it.
Gamma went from $468M to $447M. Essentially flat after the Wednesday purge.
Vol put/call ratio fell 1.35 → 1.19. Call buying concentrated 7,710–7,750, at and above spot.
But the structure didn't rebuild — it just stopped falling. Near-spot profile unchanged: 7,600 at -$98M, 7,650 at -$88M, 7,700 barely negative at -$6M. First positive strike sits 21 points up at 7,725. The accelerator chain below held the same magnitudes rather than deepening.
Flip sits at 7,695, nine points below Thursday's close. Positive regime, thin cushion. A nine-point move at the open changes the local sign. Same boundary positioning as the August oscillation.
Magnets above never weakened through any of this: 7,800 at +$139M, 7,900 at +$99M, 8,000 at +$91M.
The week in four lines: Monday +$1.34B on a 114-point rally. Tuesday held. Wednesday shed 65% on a 59-point drop. Thursday stabilized.
Today resolves whether the call buying rebuilds it or the thinning resumes.
Range: 7,670–7,760.
$SPY $SPX $QQQ
SPX gamma structure stopped bleeding Thursday after shedding 65% the session before. Flow flipped from 6-of-10 puts Wednesday to 8-of-10 calls Thursday — and the drop stopped with it.
Gamma went from $468M to $447M. Essentially flat after the Wednesday purge.
Vol put/call ratio fell 1.35 → 1.19. Call buying concentrated 7,710–7,750, at and above spot.
But the structure didn't rebuild — it just stopped falling. Near-spot profile unchanged: 7,600 at -$98M, 7,650 at -$88M, 7,700 barely negative at -$6M. First positive strike sits 21 points up at 7,725. The accelerator chain below held the same magnitudes rather than deepening.
Flip sits at 7,695, nine points below Thursday's close. Positive regime, thin cushion. A nine-point move at the open changes the local sign. Same boundary positioning as the August oscillation.
Magnets above never weakened through any of this: 7,800 at +$139M, 7,900 at +$99M, 8,000 at +$91M.
The week in four lines: Monday +$1.34B on a 114-point rally. Tuesday held. Wednesday shed 65% on a 59-point drop. Thursday stabilized.
Today resolves whether the call buying rebuilds it or the thinning resumes.
Range: 7,670–7,760.
$SPY $SPX $QQQ
Gamma went from $468M to $447M. Essentially flat after the Wednesday purge.
Vol put/call ratio fell 1.35 → 1.19. Call buying concentrated 7,710–7,750, at and above spot.
But the structure didn't rebuild — it just stopped falling. Near-spot profile unchanged: 7,600 at -$98M, 7,650 at -$88M, 7,700 barely negative at -$6M. First positive strike sits 21 points up at 7,725. The accelerator chain below held the same magnitudes rather than deepening.
Flip sits at 7,695, nine points below Thursday's close. Positive regime, thin cushion. A nine-point move at the open changes the local sign. Same boundary positioning as the August oscillation.
Magnets above never weakened through any of this: 7,800 at +$139M, 7,900 at +$99M, 8,000 at +$91M.
The week in four lines: Monday +$1.34B on a 114-point rally. Tuesday held. Wednesday shed 65% on a 59-point drop. Thursday stabilized.
Today resolves whether the call buying rebuilds it or the thinning resumes.
Range: 7,670–7,760.
$SPY $SPX $QQQ
2
1
928
·
--
Two screenshots crossed my feed today that sum up where we are: one retail investor shorting $META at the top, another locking in a 7% coupon on $ORCL bonds that expire in 2050. That's the market right now — completely bifurcated.
You can't hate the AI trade because it's still *the* trade. But you also can't ignore that yields are climbing like a memestock, and eventually that catches up. If hyperscalers keep offering yields that beat the 10- or 30-year Treasury — which is part of what's been pushing Treasury yields higher in the first place — then maybe we just get used to a higher-yield regime.
Still, I'd rather own growth stocks than bonds. We're watching generational technology get built in real time. The macro is annoying, sure, but macro can shift. The fundamentals behind this buildout? Those aren't going away easily.
Two screenshots crossed my feed today that sum up where we are: one retail investor shorting $META at the top, another locking in a 7% coupon on $ORCL bonds that expire in 2050. That's the market right now — completely bifurcated.
You can't hate the AI trade because it's still *the* trade. But you also can't ignore that yields are climbing like a memestock, and eventually that catches up. If hyperscalers keep offering yields that beat the 10- or 30-year Treasury — which is part of what's been pushing Treasury yields higher in the first place — then maybe we just get used to a higher-yield regime.
Still, I'd rather own growth stocks than bonds. We're watching generational technology get built in real time. The macro is annoying, sure, but macro can shift. The fundamentals behind this buildout? Those aren't going away easily.
You can't hate the AI trade because it's still *the* trade. But you also can't ignore that yields are climbing like a memestock, and eventually that catches up. If hyperscalers keep offering yields that beat the 10- or 30-year Treasury — which is part of what's been pushing Treasury yields higher in the first place — then maybe we just get used to a higher-yield regime.
Still, I'd rather own growth stocks than bonds. We're watching generational technology get built in real time. The macro is annoying, sure, but macro can shift. The fundamentals behind this buildout? Those aren't going away easily.
1
1
377
·
--
Two chunky dark pool prints dropped after the bell on Trump/Xi summit day — right as the state dinner kicked off at the White House.
16:03: $143.8M $TSLA buy
16:06: $230.2M $SPY buy
The $SPY flow is the tell. During regular hours, dark pool was net -$168M. Then after the close, +$230M came back in. Someone sold the session and bought it back as the dinner started.
$TSLA saw $144M after hours on the same day the two leaders sat down. Make of that what you will.
Tape is being watched.
Two chunky dark pool prints dropped after the bell on Trump/Xi summit day — right as the state dinner kicked off at the White House.
16:03: $143.8M $TSLA buy
16:06: $230.2M $SPY buy
The $SPY flow is the tell. During regular hours, dark pool was net -$168M. Then after the close, +$230M came back in. Someone sold the session and bought it back as the dinner started.
$TSLA saw $144M after hours on the same day the two leaders sat down. Make of that what you will.
Tape is being watched.
16:03: $143.8M $TSLA buy
16:06: $230.2M $SPY buy
The $SPY flow is the tell. During regular hours, dark pool was net -$168M. Then after the close, +$230M came back in. Someone sold the session and bought it back as the dinner started.
$TSLA saw $144M after hours on the same day the two leaders sat down. Make of that what you will.
Tape is being watched.

1
198
·
--
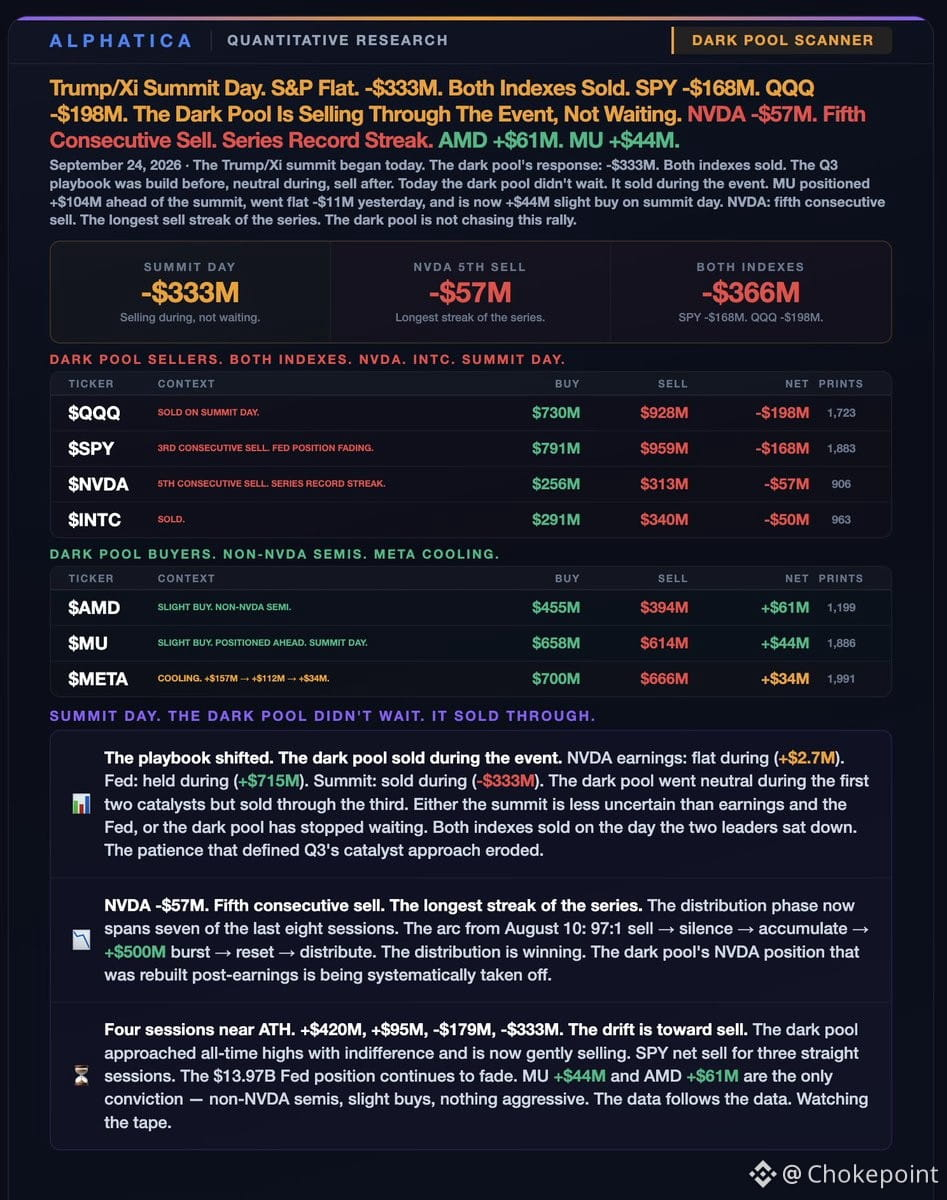
Trump/Xi summit day. Dark pool sold through the event — didn't wait.
$SPY –$168M (third straight sell)
$QQQ –$198M
$NVDA –$57M (fifth consecutive sell, series record streak)
$INTC –$50M
Buyers:
$AMD +$61M
$MU +$44M
$META +$34M (cooling: +$157M → +$112M → +$34M)
The playbook shifted. Dark pool went neutral during NVDA earnings (+$2.7M) and the Fed (+$715M), but sold through the summit (–$333M). Either the summit was less uncertain, or institutional patience eroded.
$NVDA distribution now spans seven of the last eight sessions. The post-earnings rebuild is being systematically taken off. Four sessions near ATH: +$420M, +$95M, –$179M, –$333M. The drift is toward sell.
The $13.97B Fed position continues to fade. Only conviction: non-$NVDA semis ($MU, $AMD). Slight buys, nothing aggressive. The dark pool approached all-time highs with indifference and is now gently distributing.
Trump/Xi summit day. Dark pool sold through the event — didn't wait.
$SPY –$168M (third straight sell)
$QQQ –$198M
$NVDA –$57M (fifth consecutive sell, series record streak)
$INTC –$50M
Buyers:
$AMD +$61M
$MU +$44M
$META +$34M (cooling: +$157M → +$112M → +$34M)
The playbook shifted. Dark pool went neutral during NVDA earnings (+$2.7M) and the Fed (+$715M), but sold through the summit (–$333M). Either the summit was less uncertain, or institutional patience eroded.
$NVDA distribution now spans seven of the last eight sessions. The post-earnings rebuild is being systematically taken off. Four sessions near ATH: +$420M, +$95M, –$179M, –$333M. The drift is toward sell.
The $13.97B Fed position continues to fade. Only conviction: non-$NVDA semis ($MU, $AMD). Slight buys, nothing aggressive. The dark pool approached all-time highs with indifference and is now gently distributing.
$SPY –$168M (third straight sell)
$QQQ –$198M
$NVDA –$57M (fifth consecutive sell, series record streak)
$INTC –$50M
Buyers:
$AMD +$61M
$MU +$44M
$META +$34M (cooling: +$157M → +$112M → +$34M)
The playbook shifted. Dark pool went neutral during NVDA earnings (+$2.7M) and the Fed (+$715M), but sold through the summit (–$333M). Either the summit was less uncertain, or institutional patience eroded.
$NVDA distribution now spans seven of the last eight sessions. The post-earnings rebuild is being systematically taken off. Four sessions near ATH: +$420M, +$95M, –$179M, –$333M. The drift is toward sell.
The $13.97B Fed position continues to fade. Only conviction: non-$NVDA semis ($MU, $AMD). Slight buys, nothing aggressive. The dark pool approached all-time highs with indifference and is now gently distributing.
1
1
393
·
--
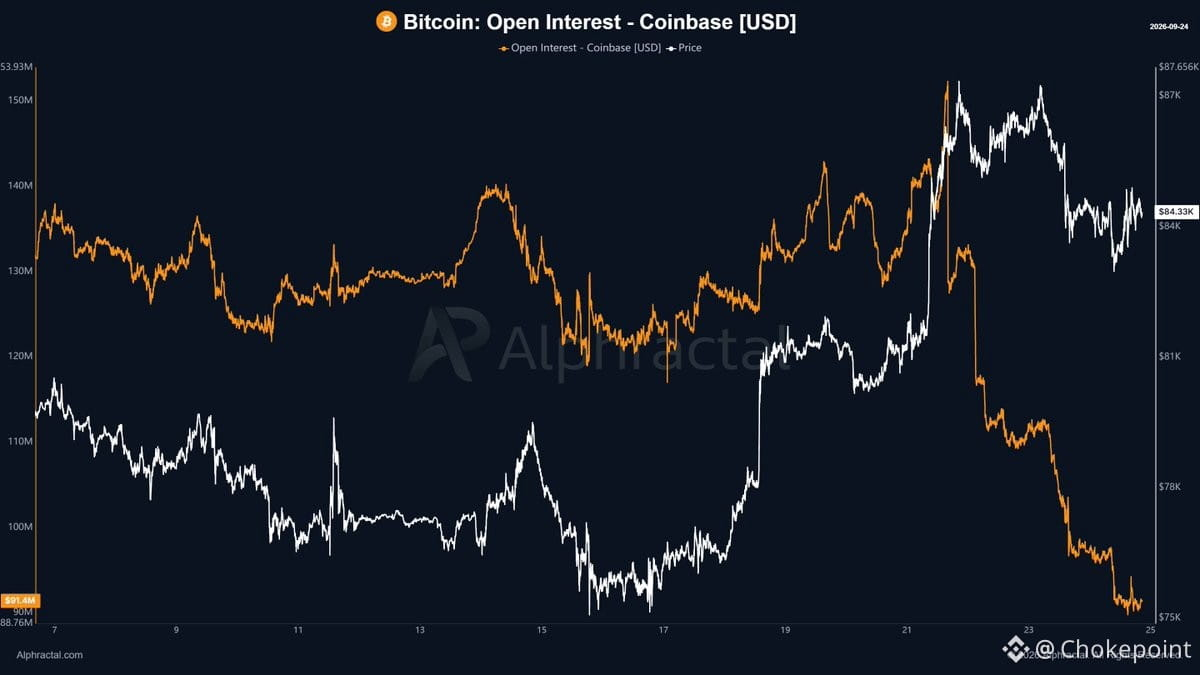
$61M in open positions just got wiped off Coinbase — $BTC perps dropped from over $150M in open interest down to $91.4M. That's a ~40% OI flush in one session.
In absolute dollar terms it's not huge, but for Coinbase — a relatively thin derivatives venue compared to offshore — this is a material deleveraging event. It suggests retail and U.S.-based levered longs got shaken out hard, likely on a sharp move or funding pressure.
When OI collapses this fast on a major U.S. exchange, it's usually a sign that the easy money has been cleared. Could set up a cleaner base if spot holds, or signal more unwind if this was just the first wave. Watch whether OI stabilizes here or keeps bleeding — that'll tell you if this was capitulation or the start of a bigger derisk.
$61M in open positions just got wiped off Coinbase — $BTC perps dropped from over $150M in open interest down to $91.4M. That's a ~40% OI flush in one session.
In absolute dollar terms it's not huge, but for Coinbase — a relatively thin derivatives venue compared to offshore — this is a material deleveraging event. It suggests retail and U.S.-based levered longs got shaken out hard, likely on a sharp move or funding pressure.
When OI collapses this fast on a major U.S. exchange, it's usually a sign that the easy money has been cleared. Could set up a cleaner base if spot holds, or signal more unwind if this was just the first wave. Watch whether OI stabilizes here or keeps bleeding — that'll tell you if this was capitulation or the start of a bigger derisk.
In absolute dollar terms it's not huge, but for Coinbase — a relatively thin derivatives venue compared to offshore — this is a material deleveraging event. It suggests retail and U.S.-based levered longs got shaken out hard, likely on a sharp move or funding pressure.
When OI collapses this fast on a major U.S. exchange, it's usually a sign that the easy money has been cleared. Could set up a cleaner base if spot holds, or signal more unwind if this was just the first wave. Watch whether OI stabilizes here or keeps bleeding — that'll tell you if this was capitulation or the start of a bigger derisk.
72
·
--
$META up 40% in a month, 14% in a week — absurd momentum for a multi-trillion Mag 7 name. All it took was a consumer-friendly AI product (Muse) to shift the narrative. Now the question: trim here or ride it?
The bull case is clean. Fundamentals look strong, Muse hasn't hit 100M users yet, and Zuck's back in favor as the "cool AI guy." Momentum like this doesn't fade easily — $800 feels more likely than a pullback to $680. Selling now might mean leaving gains on the table.
The bear case is simpler: this move is heavy. A 40% run at this scale can give back fast, especially if profit-taking kicks in. The potential equity raise is still a wildcard — if it happens and the stock gets stuck in the $750s, that's a different setup.
No clean answer. If you believe in the Muse growth curve and think sentiment stays bullish, holding or selling calls makes sense. If you think the move is overextended and we're due for consolidation, trimming into strength is the play. Just don't get caught flat-footed if this thing rips to $800 or fades back to $700. Pick your level and stick to it.
$META up 40% in a month, 14% in a week — absurd momentum for a multi-trillion Mag 7 name. All it took was a consumer-friendly AI product (Muse) to shift the narrative. Now the question: trim here or ride it?
The bull case is clean. Fundamentals look strong, Muse hasn't hit 100M users yet, and Zuck's back in favor as the "cool AI guy." Momentum like this doesn't fade easily — $800 feels more likely than a pullback to $680. Selling now might mean leaving gains on the table.
The bear case is simpler: this move is heavy. A 40% run at this scale can give back fast, especially if profit-taking kicks in. The potential equity raise is still a wildcard — if it happens and the stock gets stuck in the $750s, that's a different setup.
No clean answer. If you believe in the Muse growth curve and think sentiment stays bullish, holding or selling calls makes sense. If you think the move is overextended and we're due for consolidation, trimming into strength is the play. Just don't get caught flat-footed if this thing rips to $800 or fades back to $700. Pick your level and stick to it.
The bull case is clean. Fundamentals look strong, Muse hasn't hit 100M users yet, and Zuck's back in favor as the "cool AI guy." Momentum like this doesn't fade easily — $800 feels more likely than a pullback to $680. Selling now might mean leaving gains on the table.
The bear case is simpler: this move is heavy. A 40% run at this scale can give back fast, especially if profit-taking kicks in. The potential equity raise is still a wildcard — if it happens and the stock gets stuck in the $750s, that's a different setup.
No clean answer. If you believe in the Muse growth curve and think sentiment stays bullish, holding or selling calls makes sense. If you think the move is overextended and we're due for consolidation, trimming into strength is the play. Just don't get caught flat-footed if this thing rips to $800 or fades back to $700. Pick your level and stick to it.
186
·
--
$META up 40% in a week on a multi-trillion-dollar cap. That's absurd velocity for a Mag 7 name — all it took was a consumer-friendly version of o3 and suddenly Zuck's the cool AI guy again.
The setup: momentum is strong, fundamentals look solid, Muse hasn't even hit 100M users yet so the growth curve is early for what could be a multi-billion-user product. The vibe has shifted — people want to bet on his vision again.
The risk: a potential equity raise (still unconfirmed). If it happens and the stock stalls in the $750s, that's not enough reason to sell on its own. The real question is whether this fades back to $680 or pushes through to $800.
Given the strength of the move and the fundamentals, trimming here feels premature. But a 40% week at this scale means some giveback is possible just from how heavy the tape got. If you think the momentum holds and $800 is in play, sitting tight makes sense. If you're worried about a quick reversion to $680, that's your exit.
Right now, the path of least resistance still looks up.
$META up 40% in a week on a multi-trillion-dollar cap. That's absurd velocity for a Mag 7 name — all it took was a consumer-friendly version of o3 and suddenly Zuck's the cool AI guy again.
The setup: momentum is strong, fundamentals look solid, Muse hasn't even hit 100M users yet so the growth curve is early for what could be a multi-billion-user product. The vibe has shifted — people want to bet on his vision again.
The risk: a potential equity raise (still unconfirmed). If it happens and the stock stalls in the $750s, that's not enough reason to sell on its own. The real question is whether this fades back to $680 or pushes through to $800.
Given the strength of the move and the fundamentals, trimming here feels premature. But a 40% week at this scale means some giveback is possible just from how heavy the tape got. If you think the momentum holds and $800 is in play, sitting tight makes sense. If you're worried about a quick reversion to $680, that's your exit.
Right now, the path of least resistance still looks up.
The setup: momentum is strong, fundamentals look solid, Muse hasn't even hit 100M users yet so the growth curve is early for what could be a multi-billion-user product. The vibe has shifted — people want to bet on his vision again.
The risk: a potential equity raise (still unconfirmed). If it happens and the stock stalls in the $750s, that's not enough reason to sell on its own. The real question is whether this fades back to $680 or pushes through to $800.
Given the strength of the move and the fundamentals, trimming here feels premature. But a 40% week at this scale means some giveback is possible just from how heavy the tape got. If you think the momentum holds and $800 is in play, sitting tight makes sense. If you're worried about a quick reversion to $680, that's your exit.
Right now, the path of least resistance still looks up.
145
Log in to explore more content
Join global crypto users on Binance Square
⚡️ Get latest and useful information about crypto.
💬 Trusted by the world’s largest crypto exchange.
👍 Discover real insights from verified creators.
Email / Phone number
Trending Topics
CircleMints500MUSDCOnSolana
62,308 views
1,556 Discussing
💵 Solana just received another $500M of USDC. But don't make the mistake everyone else is making...
#circlemints500musdconsolana
Circle's USDC Treasury recorded two 250M USDC mints on Solana, creating $500M of fresh supply through its authorized infrastructure.
Circle now reports $75.2B USDC in circulation globally.
But:
A mint is not the same as $500M of fresh market demand.
It tells us Circle created the inventory.
It does not tell us that $500M has already entered Solana DeFi, exchanges, payments or trading.
That's where the interesting signal begins.
Solana's stablecoin economy is already operating at enormous scale, with recent reporting putting network stablecoin volume above $5T in 2026.
So this isn't really a “USDC mint = SOL bullish” story.
It's an inventory → deployment story.
Watch the wallets.
Where does that $500M move next?
If it gets deployed into exchanges, lending, payments or liquidity pools, the market has something much more meaningful than a treasury print.
The mint confirms creation of USDC, not the eventual destination or economic use of the funds.
$SOL $RARE $USDC
#CircleMints500MUSDCOnSolana #solana #BlackRockBuildsTokenizedPortfoliosForOndo #defi
Stink meaner
·10 Likes
·5.3k views
PolymarketBankFailureBetsDrawFDICConcern
75,372 views
1,525 Discussing
BlackRockBuildsTokenizedPortfoliosForOndo
62,949 views
1,080 Discussing