

TEKT0NIC 1
1.3k Posts

TEKT0NIC 1
Report
Block User
Passionate about crypto and blockchain | Crypto Enthusiastic | Technical Analysis | Fundamental News
0 Following
10 Followers
39 Liked
Posts
·
--
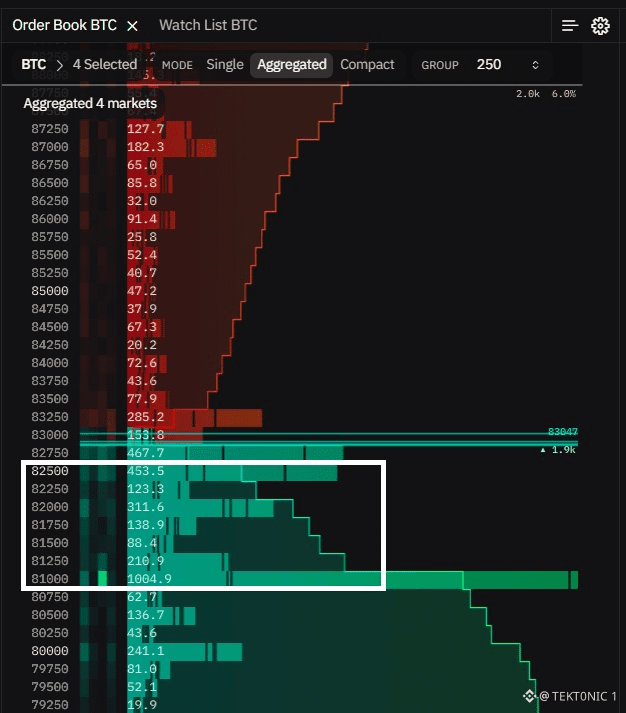
Bitcoin Bids Are Stacked From $81,000 to $82,500 on the Aggregated Book. $BTC price is near $83,047. The largest bid in that zone sits at $81,000. According to the four-market ladder, buy size builds as price steps down from $82,500, with the heaviest resting bid at $81,000. That is the zone some desks are marking as the next bounce area. Resting bids can be pulled. They are not a filled order until price trades there. Key Details: > Zone: $81,000 to $82,500. > $82,500: 453.5 BTC. $82,000: 311.6 BTC. > $81,250: 210.9 BTC. $81,000: 1,004.9 BTC. > Last price on the ladder: about $83,047. > Markets: four, aggregated. A 1,005 BTC bid at $81,000 is real size on this view. It only matters if it is still there when price reaches it. $83,250 still has sell size overhead. $BTC Bids $81,000–$82,500. Largest at $81,000: 1,005 BTC. Do you buy that zone if price trades into it, or wait to see if the bids stay? #BTC Price Analysis# #Bitcoin Price Prediction: What is Bitcoins next move?# #Macro Insights# $ETH
Bitcoin Bids Are Stacked From $81,000 to $82,500 on the Aggregated Book. $BTC price is near $83,047. The largest bid in that zone sits at $81,000. According to the four-market ladder, buy size builds as price steps down from $82,500, with the heaviest resting bid at $81,000. That is the zone some desks are marking as the next bounce area. Resting bids can be pulled. They are not a filled order until price trades there. Key Details: > Zone: $81,000 to $82,500. > $82,500: 453.5 BTC. $82,000: 311.6 BTC. > $81,250: 210.9 BTC. $81,000: 1,004.9 BTC. > Last price on the ladder: about $83,047. > Markets: four, aggregated. A 1,005 BTC bid at $81,000 is real size on this view. It only matters if it is still there when price reaches it. $83,250 still has sell size overhead. $BTC Bids $81,000–$82,500. Largest at $81,000: 1,005 BTC. Do you buy that zone if price trades into it, or wait to see if the bids stay? #BTC Price Analysis# #Bitcoin Price Prediction: What is Bitcoins next move?# #Macro Insights# $ETH
·
--
Polymarket’s Shayne Coplan says chasing 100x tokens is a greater-fool game. at TOKEN2049 in Singapore he called it irrational exuberance and hot potato. Traders buy a token they think is worthless because it might go 100x, and they want to sell before it goes back to zero. Some people get rich that way. He said the price still has to come down. his contrast is prediction markets. Polymarket does not offer a 100x. A contract pays out on an event, at odds the market sets. He said that is why some traders have moved over. DefiLlama has Polymarket at about $1.21 billion in the past seven days, second to Kalshi at about $2.3 billion. a contract with a known payout is a different trade from a token with no floor. It is also not a free edge. Informed traders still take the other side. Volume of $1.21 billion is activity. It is not proof the odds are fair. the 100x is the hot potato. The $1.21 billion is the market he is selling against it. #BTC Price Analysis# #Bitcoin Price Prediction: What is Bitcoins next move?# #Macro Insights# $BTC $ETH
Polymarket’s Shayne Coplan says chasing 100x tokens is a greater-fool game. at TOKEN2049 in Singapore he called it irrational exuberance and hot potato. Traders buy a token they think is worthless because it might go 100x, and they want to sell before it goes back to zero. Some people get rich that way. He said the price still has to come down. his contrast is prediction markets. Polymarket does not offer a 100x. A contract pays out on an event, at odds the market sets. He said that is why some traders have moved over. DefiLlama has Polymarket at about $1.21 billion in the past seven days, second to Kalshi at about $2.3 billion. a contract with a known payout is a different trade from a token with no floor. It is also not a free edge. Informed traders still take the other side. Volume of $1.21 billion is activity. It is not proof the odds are fair. the 100x is the hot potato. The $1.21 billion is the market he is selling against it. #BTC Price Analysis# #Bitcoin Price Prediction: What is Bitcoins next move?# #Macro Insights# $BTC $ETH


·
--
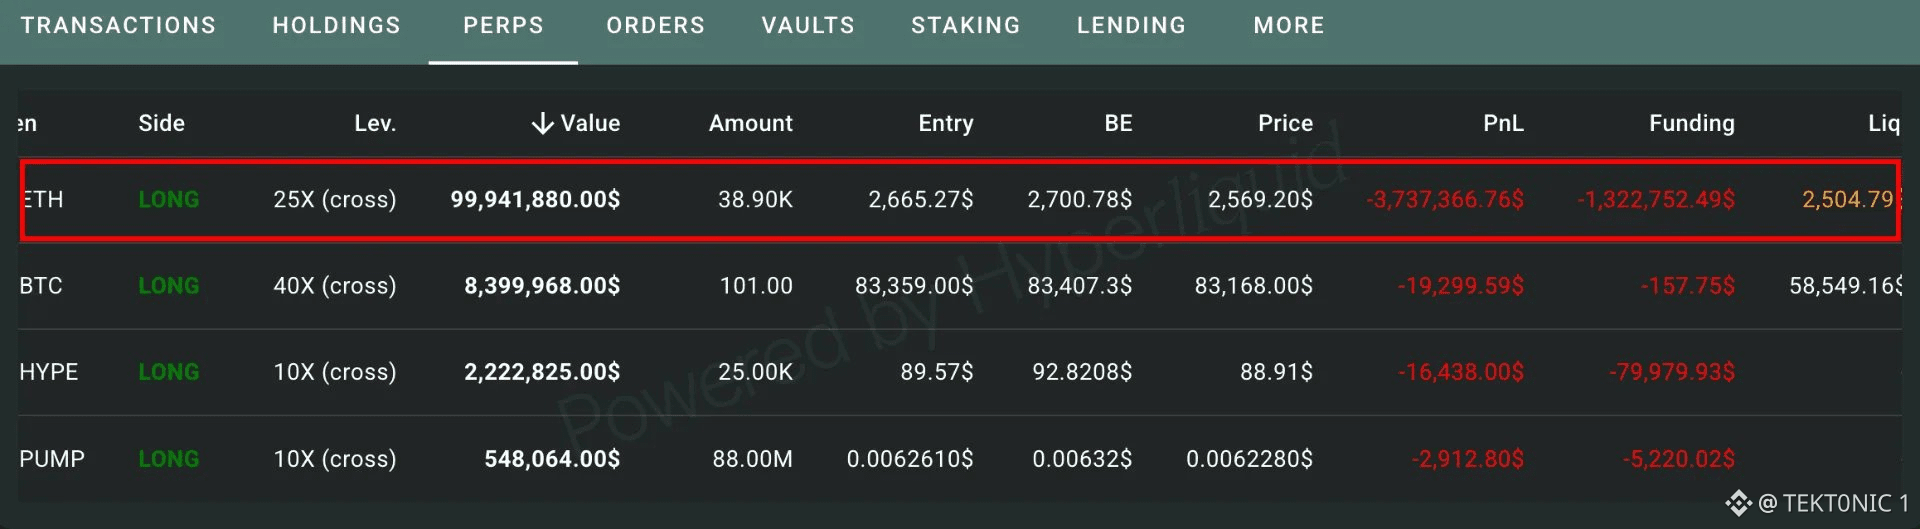
A 25x Ether Long Worth $99.9 Million Is About $64 From Liquidation. Mark is $2,569. The liquidation level is $2,504.79. According to the Hyperliquid book, the position is 38,900 $ETH , entered at $2,665.27, with a break-even of $2,700.78. Unrealized loss is $3.74 million. Funding paid is another $1.32 million. The same account is also long $BTC , HYPE, and PUMP, all in the red. Ether is the size that matters. Key Details: > ETH: 38,900 long, 25x, value $99.94 million. > Entry $2,665.27. Mark $2,569.20. Liquidation $2,504.79. > Unrealized: −$3.74 million. Funding: −$1.32 million. > Also open: 101 BTC at 40x, 25,000 HYPE at 10x, 88 million PUMP at 10x. A dip through $2,505 closes the largest leg. $2,700 is the break-even, not the nearby risk. $99.9M $ETH Long at 25x. Liquidation $2,505. Mark $2,569. #Bitcoin Price Prediction: What is Bitcoins next move?# #BTC Price Analysis# $BTC
A 25x Ether Long Worth $99.9 Million Is About $64 From Liquidation. Mark is $2,569. The liquidation level is $2,504.79. According to the Hyperliquid book, the position is 38,900 $ETH , entered at $2,665.27, with a break-even of $2,700.78. Unrealized loss is $3.74 million. Funding paid is another $1.32 million. The same account is also long $BTC , HYPE, and PUMP, all in the red. Ether is the size that matters. Key Details: > ETH: 38,900 long, 25x, value $99.94 million. > Entry $2,665.27. Mark $2,569.20. Liquidation $2,504.79. > Unrealized: −$3.74 million. Funding: −$1.32 million. > Also open: 101 BTC at 40x, 25,000 HYPE at 10x, 88 million PUMP at 10x. A dip through $2,505 closes the largest leg. $2,700 is the break-even, not the nearby risk. $99.9M $ETH Long at 25x. Liquidation $2,505. Mark $2,569. #Bitcoin Price Prediction: What is Bitcoins next move?# #BTC Price Analysis# $BTC
·
--
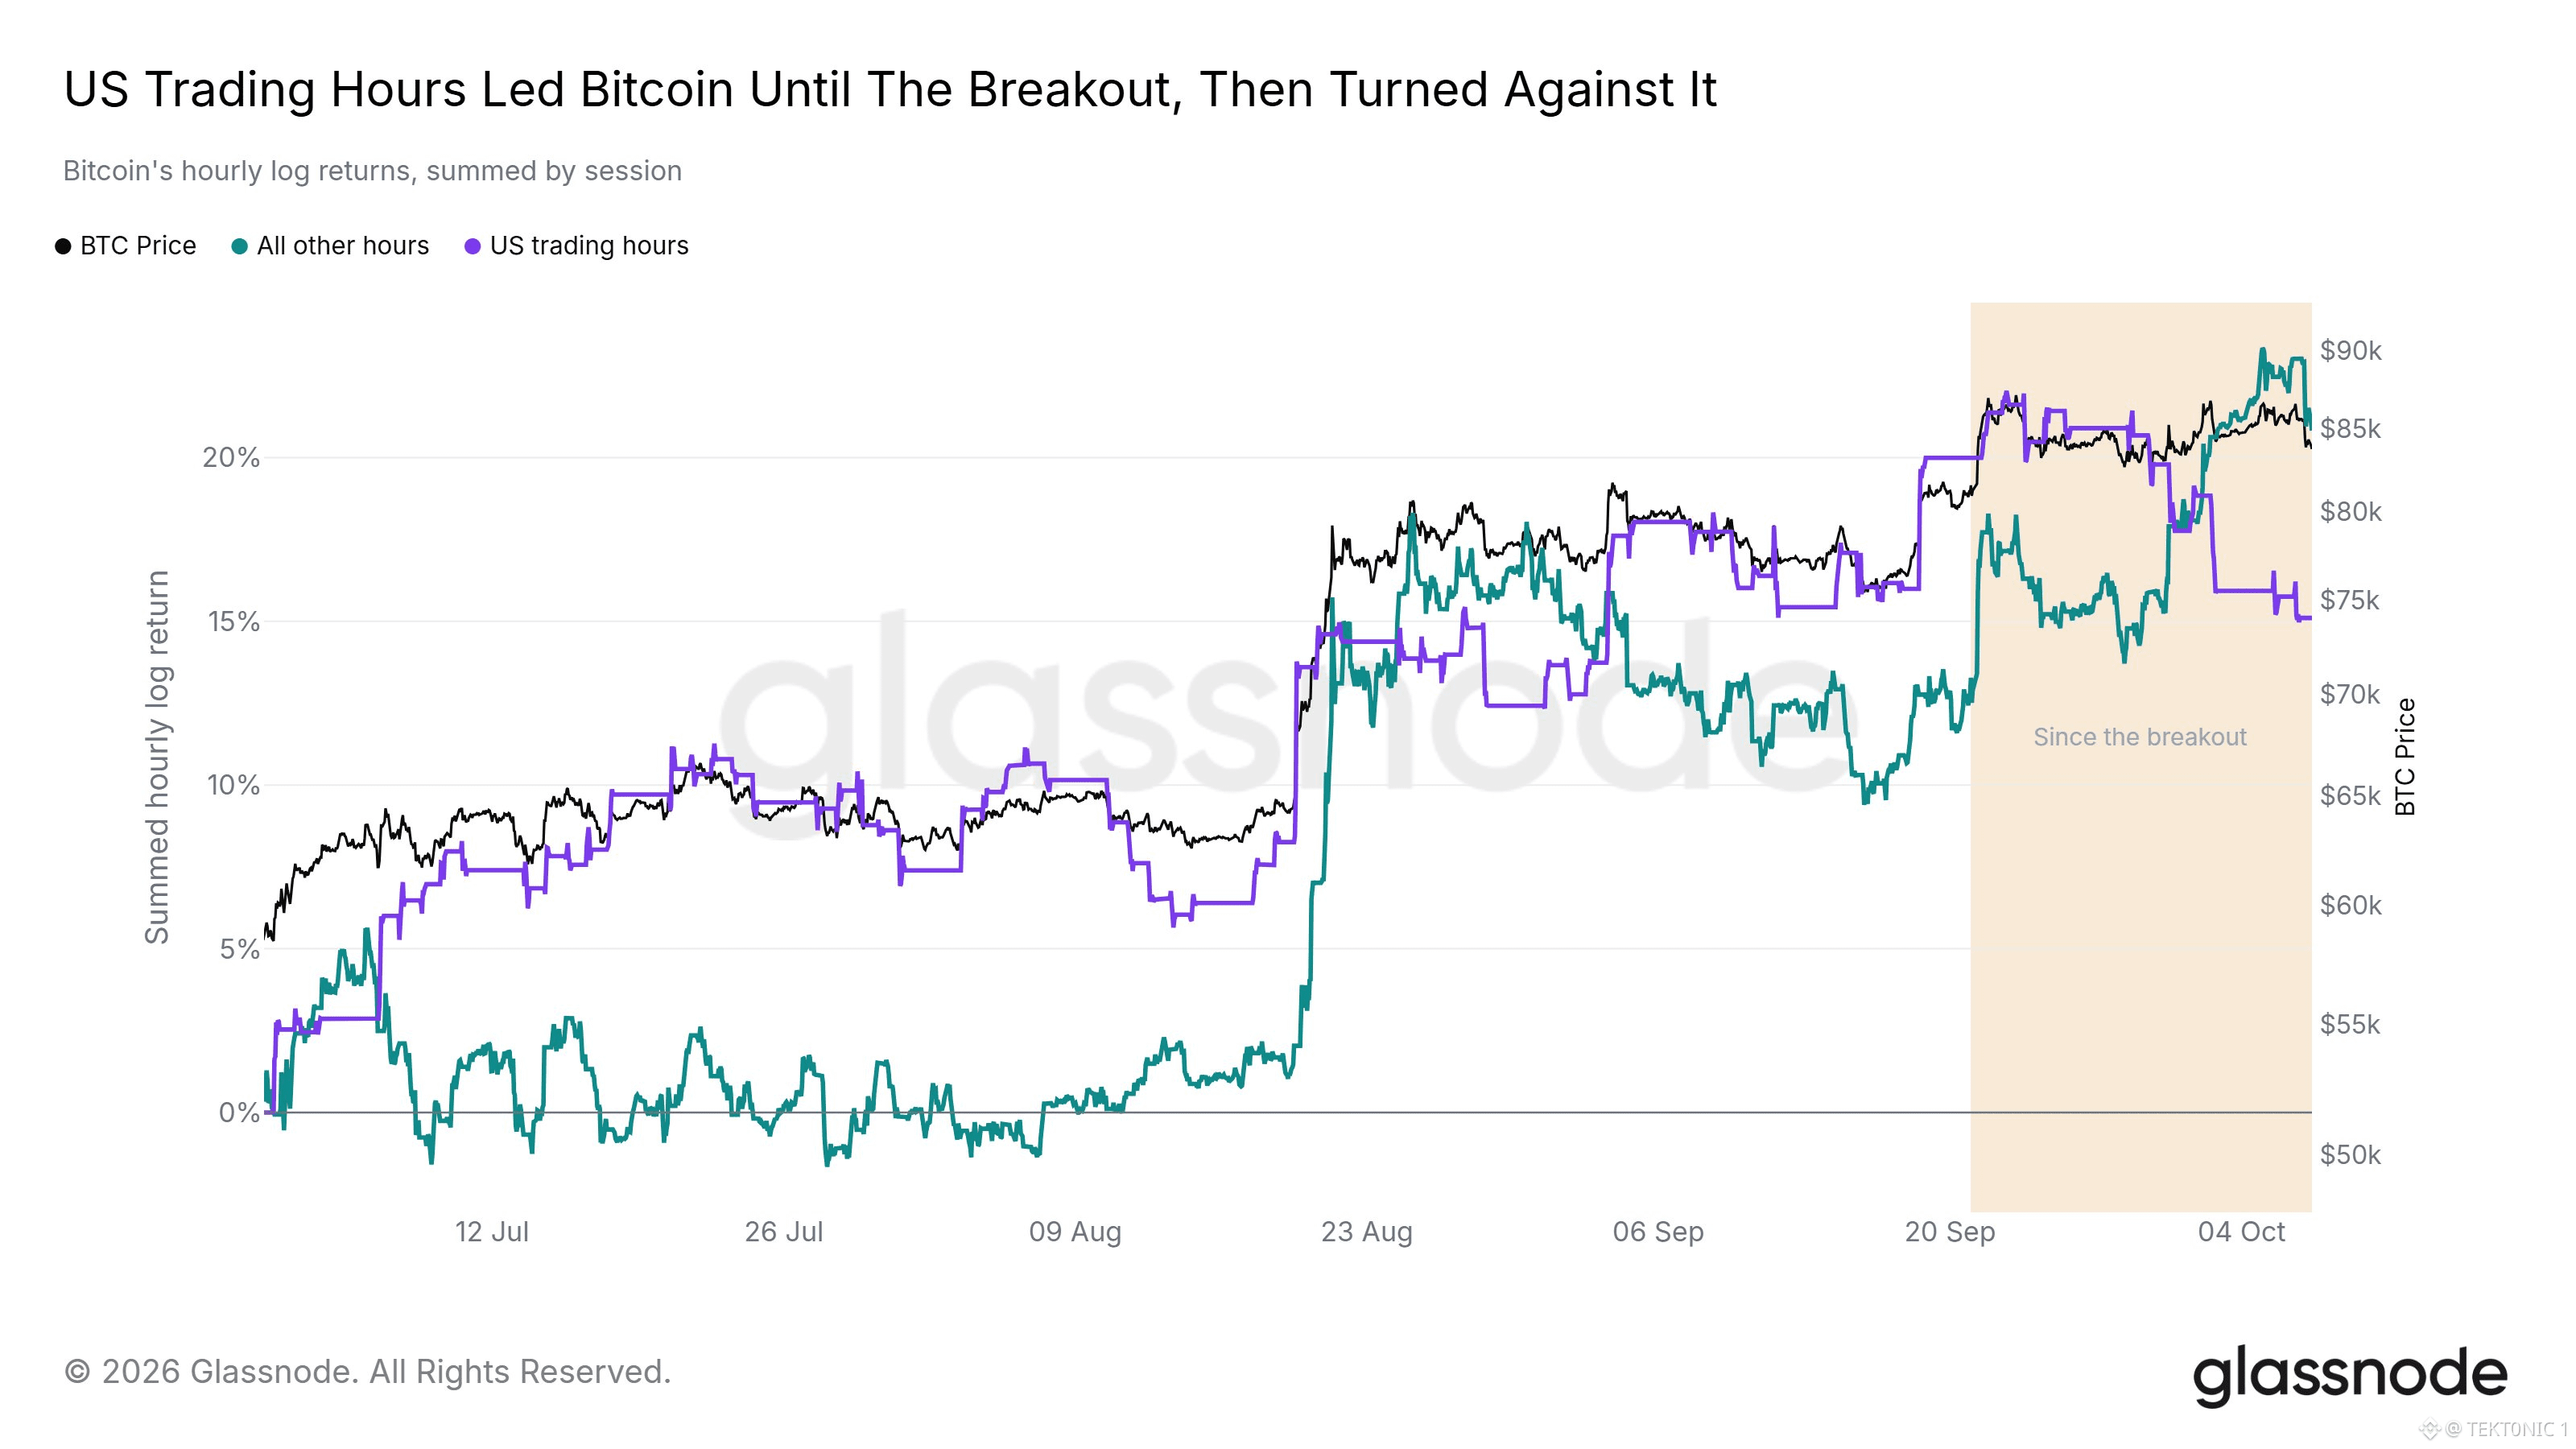
The U.S. session that led bitcoin has flipped. Glassnode splits hourly returns into U.S. trading hours and every other hour. From July through the September breakout, the U.S. session did most of the gains. The other hours were flat. Price followed the purple line up. since about September 20, that has reversed. The U.S. session’s summed return has fallen from about 21% toward 16%. The other hours have risen from about 12% toward 22%, and now sit above the U.S. line. Price pushed toward $90,000 in that window and is back near $85,000. a session return is who was buying during those hours, not a fund filing. U.S. hours overlap the ETF print and the New York cash open. A falling U.S. line since the breakout means that session has been a net seller. The bid has been outside it. the lead lasted until the breakout. Since then the other hours have carried the price. Watch whether the U.S. line turns back up. That is the session that led the first leg. #BTC Price Analysis# #Bitcoin Price Prediction: What is Bitcoins next move?# $BTC $ETH
The U.S. session that led bitcoin has flipped. Glassnode splits hourly returns into U.S. trading hours and every other hour. From July through the September breakout, the U.S. session did most of the gains. The other hours were flat. Price followed the purple line up. since about September 20, that has reversed. The U.S. session’s summed return has fallen from about 21% toward 16%. The other hours have risen from about 12% toward 22%, and now sit above the U.S. line. Price pushed toward $90,000 in that window and is back near $85,000. a session return is who was buying during those hours, not a fund filing. U.S. hours overlap the ETF print and the New York cash open. A falling U.S. line since the breakout means that session has been a net seller. The bid has been outside it. the lead lasted until the breakout. Since then the other hours have carried the price. Watch whether the U.S. line turns back up. That is the session that led the first leg. #BTC Price Analysis# #Bitcoin Price Prediction: What is Bitcoins next move?# $BTC $ETH
·
--
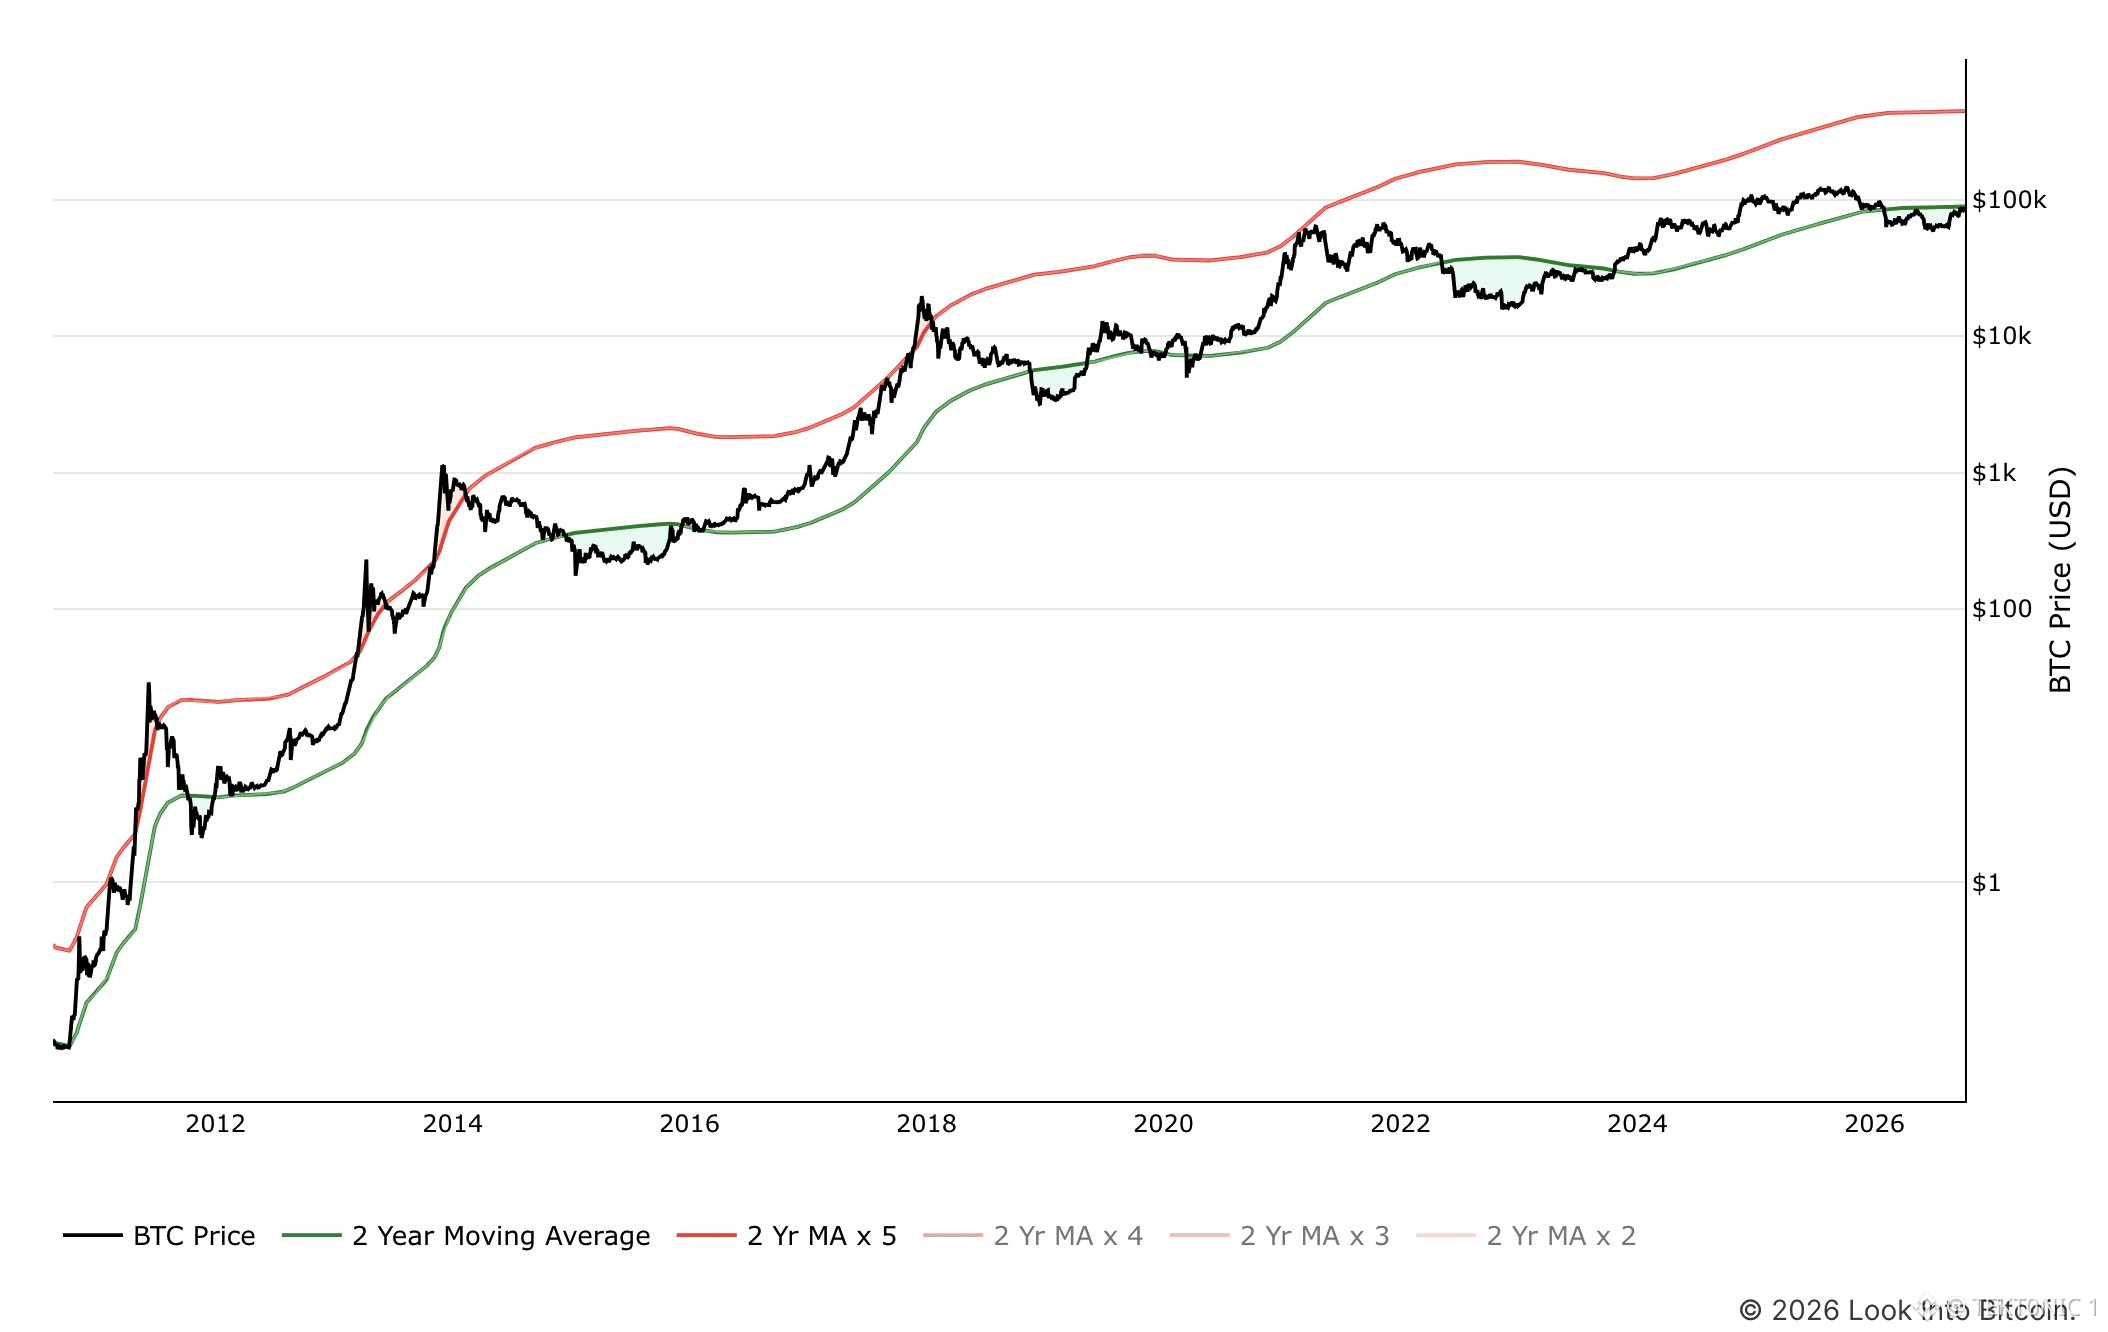
Bitcoin is back at its 2-year moving average. on the Look Into $BTC chart, the green line is that average, and price is sitting on it near $85,000. The red line is the same average multiplied by five. That band has marked the last cycle highs, in 2013, 2017, and 2021. Price is well under it. buying below the 2-year average has lined up with the better entries. It did in 2015, in 2019, and again in 2022. Each of those was followed by a move back above the average and, later, toward the 5x band. The average is a long mean. It is not a floor that holds on the first test. the hurdle is a hold above it. A weekly close back through the green line keeps the long trend intact ON THE $BTC chart. A close under it puts price where the last two recoveries started, not where they finished. $85,000 is the test. The 5x band is the old top zone. Price has not reached it. #BTC Price Analysis# #Bitcoin Price Prediction: What is Bitcoins next move?# $ETH
Bitcoin is back at its 2-year moving average. on the Look Into $BTC chart, the green line is that average, and price is sitting on it near $85,000. The red line is the same average multiplied by five. That band has marked the last cycle highs, in 2013, 2017, and 2021. Price is well under it. buying below the 2-year average has lined up with the better entries. It did in 2015, in 2019, and again in 2022. Each of those was followed by a move back above the average and, later, toward the 5x band. The average is a long mean. It is not a floor that holds on the first test. the hurdle is a hold above it. A weekly close back through the green line keeps the long trend intact ON THE $BTC chart. A close under it puts price where the last two recoveries started, not where they finished. $85,000 is the test. The 5x band is the old top zone. Price has not reached it. #BTC Price Analysis# #Bitcoin Price Prediction: What is Bitcoins next move?# $ETH
·
--
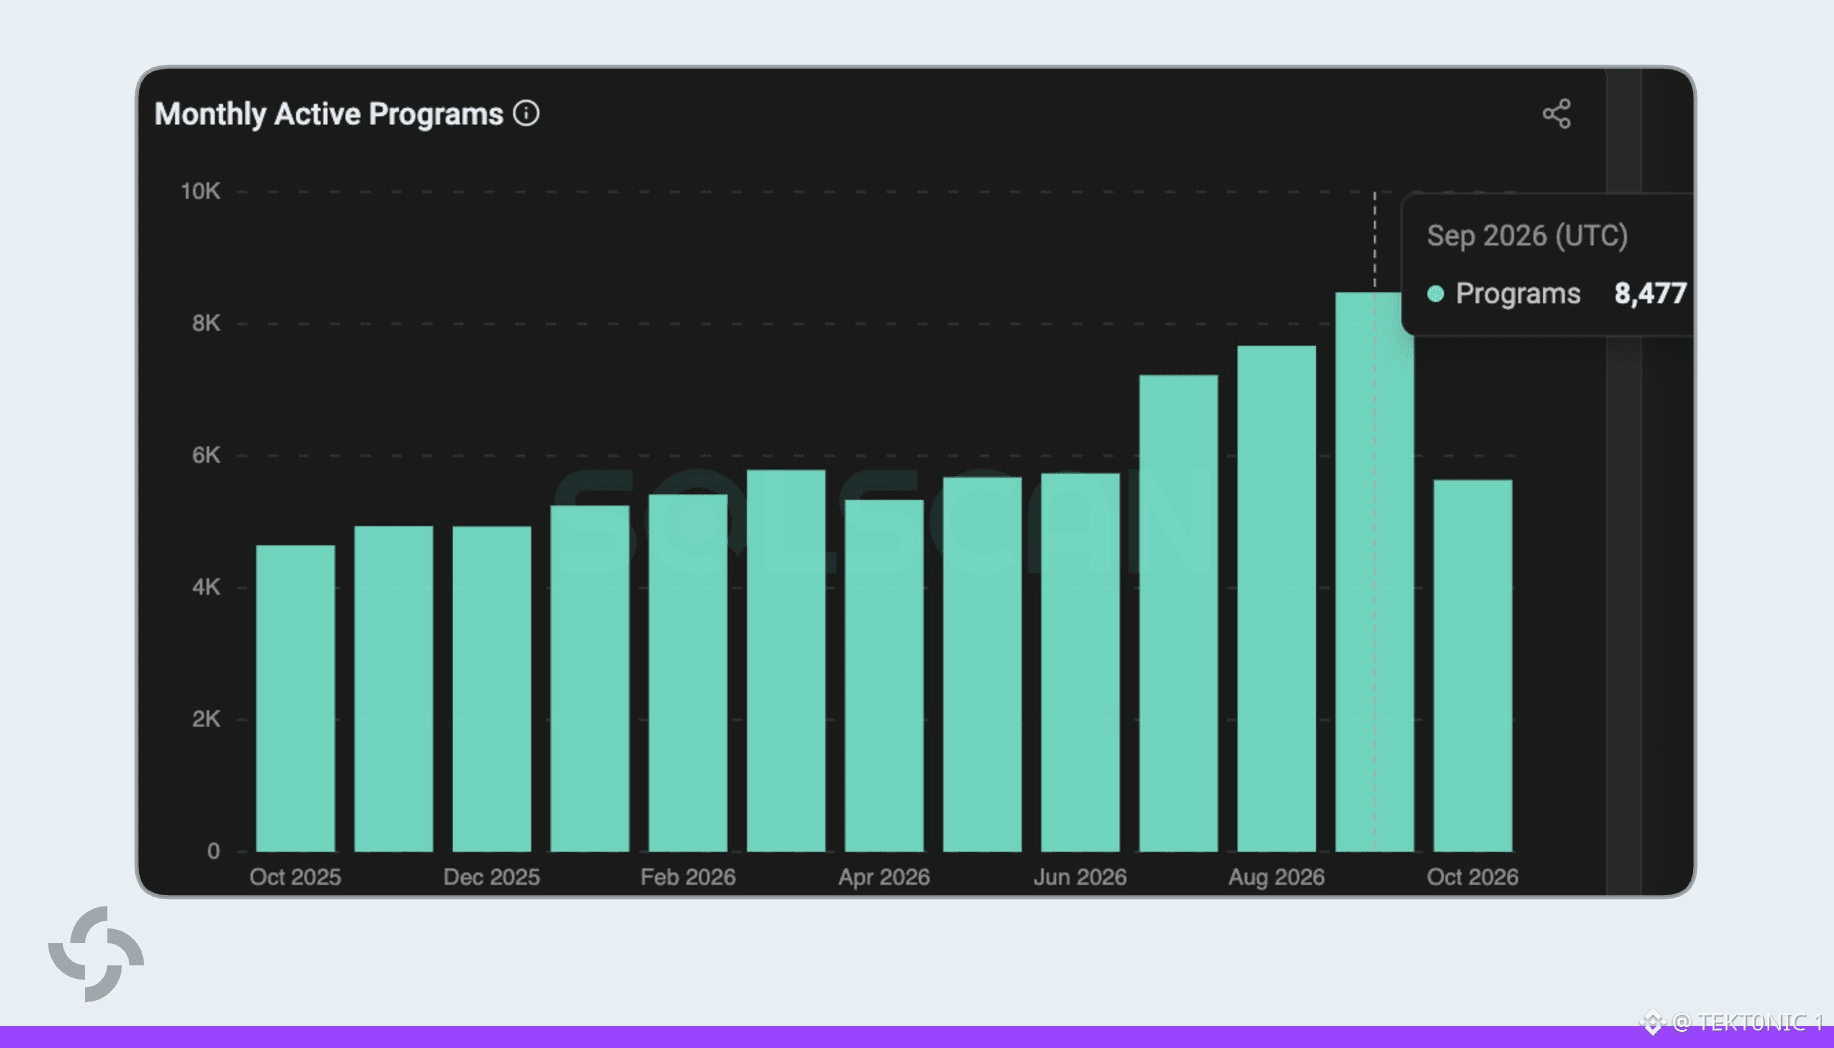
Solana ($SOL ) is seeing more programs actively used onchain. the latest data shows 8,477 monthly active programs in September, a new all-time high. these programs are the smart contracts powering swaps, DeFi apps, bridges, games, bots and other activity across the network. September also saw 16.1M funded wallets, up 38.5% month over month, while daily active stablecoin addresses reached 888K, up 269% year over year. Solana also processed a record 3.18B completed non-vote transactions during the month. the growth is showing up across multiple parts of the network. more active programs, more funded wallets and record transaction activity point to broader usage across Solana ($SOL ). #Bitcoin Price Prediction: What is Bitcoins next move?# #Solana flip Ethereum?# #Solana $BTC
Solana ($SOL ) is seeing more programs actively used onchain. the latest data shows 8,477 monthly active programs in September, a new all-time high. these programs are the smart contracts powering swaps, DeFi apps, bridges, games, bots and other activity across the network. September also saw 16.1M funded wallets, up 38.5% month over month, while daily active stablecoin addresses reached 888K, up 269% year over year. Solana also processed a record 3.18B completed non-vote transactions during the month. the growth is showing up across multiple parts of the network. more active programs, more funded wallets and record transaction activity point to broader usage across Solana ($SOL ). #Bitcoin Price Prediction: What is Bitcoins next move?# #Solana flip Ethereum?# #Solana $BTC
·
--
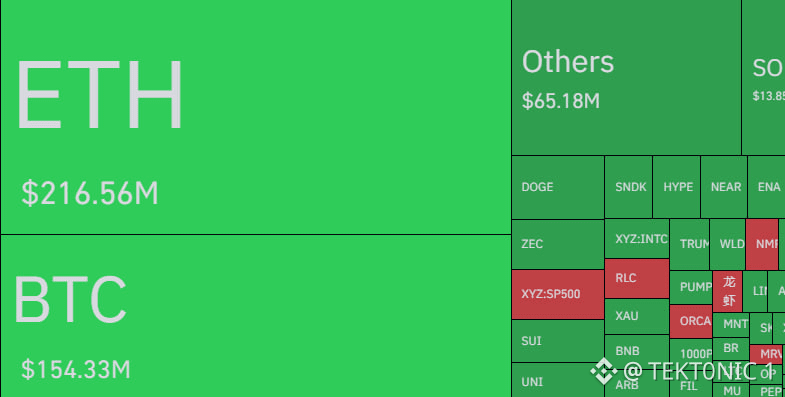
Crypto liquidations jumped to about $608 million. $ETH accounted for $216.56 million. $BTC accounted for $154.33 million. Other assets accounted for about $65 million, led by solana and dogecoin, with the smaller tokens making up the rest. most of the tokens are green, which is long positions being forcefully closed. A few are red, which is short positions being closed. The red ones include an S&P 500 contract and a handful of smaller tokens. the largest single order was a $26.64 million ETHUSDC liquidation on Binance. That is one leveraged position, not a spot sale. The other $582 million was spread across exchanges and pairs. a liquidation is a forced close. A long is sold when the margin runs out. A short is bought. The $608 million is the size of those forced trades, not cash walking out of the market. $ETH was the largest share. $BTC was second. The $26.64 million Binance order is the single biggest print. #Bitcoin Price Prediction: What is Bitcoins next move?# #BTC Price Analysis# #Macro Insights#
Crypto liquidations jumped to about $608 million. $ETH accounted for $216.56 million. $BTC accounted for $154.33 million. Other assets accounted for about $65 million, led by solana and dogecoin, with the smaller tokens making up the rest. most of the tokens are green, which is long positions being forcefully closed. A few are red, which is short positions being closed. The red ones include an S&P 500 contract and a handful of smaller tokens. the largest single order was a $26.64 million ETHUSDC liquidation on Binance. That is one leveraged position, not a spot sale. The other $582 million was spread across exchanges and pairs. a liquidation is a forced close. A long is sold when the margin runs out. A short is bought. The $608 million is the size of those forced trades, not cash walking out of the market. $ETH was the largest share. $BTC was second. The $26.64 million Binance order is the single biggest print. #Bitcoin Price Prediction: What is Bitcoins next move?# #BTC Price Analysis# #Macro Insights#
·
--
Metaplanet Wants to Fund a Carry Trade Between Its Own Bonds and Other Treasury Preferreds. The idea is simple. Borrow cheap in yen, buy higher-coupon dollar preferreds, and keep Bitcoin as the main asset. According to the company’s income plan, BitBonds sit next to preferred stock and Bitcoin-backed credit as a funding source. Part of that money would go into preferred shares issued by other Bitcoin treasury firms. $BTC stays about 85% to 90% of assets. The yen-dollar mismatch is the extra risk on a U.S. coupon. Key Details: > BitBonds: about 4.2% yield. First series were 4% to 4.3%. > Strive SATA: 13%. > Strategy STRC: 12%. > Use of funds: preferreds of other Bitcoin treasury firms. > Extra risk: yen funding, dollar assets. The coupon gap is wide enough to look attractive. Credit, $BTC price, and the exchange rate can take it away. Metaplanet: 4.2% BitBonds Against 13% SATA and 12% STRC. Would you take that carry, or only hold the coins? #BTC Price Analysis# #Bitcoin Price Prediction: What is Bitcoins next move?# $ETH #Macro Insights#
Metaplanet Wants to Fund a Carry Trade Between Its Own Bonds and Other Treasury Preferreds. The idea is simple. Borrow cheap in yen, buy higher-coupon dollar preferreds, and keep Bitcoin as the main asset. According to the company’s income plan, BitBonds sit next to preferred stock and Bitcoin-backed credit as a funding source. Part of that money would go into preferred shares issued by other Bitcoin treasury firms. $BTC stays about 85% to 90% of assets. The yen-dollar mismatch is the extra risk on a U.S. coupon. Key Details: > BitBonds: about 4.2% yield. First series were 4% to 4.3%. > Strive SATA: 13%. > Strategy STRC: 12%. > Use of funds: preferreds of other Bitcoin treasury firms. > Extra risk: yen funding, dollar assets. The coupon gap is wide enough to look attractive. Credit, $BTC price, and the exchange rate can take it away. Metaplanet: 4.2% BitBonds Against 13% SATA and 12% STRC. Would you take that carry, or only hold the coins? #BTC Price Analysis# #Bitcoin Price Prediction: What is Bitcoins next move?# $ETH #Macro Insights#

·
--
Robinhood bought $25 million of bitcoin for its own balance sheet. Johann Kerbrat, who runs crypto at the firm, told The Block the purchase is a commitment signal. He said the company cares about bitcoin and wanted the treasury aligned with that. He also said $25 million is small next to a market cap near $100 billion, and will not change the company’s path. at about $85,000, the buy is roughly 295 $BTC . Strategy bought 334 BTC for $28.7 million between October 1 and October 4, and holds 848,000. Robinhood’s entire position is a fraction of one of those weekly adds. the purchase sits next to a wider crypto push, including its own chain and plans for perpetual futures. A brokerage holding the asset it lists is a different step from a customer buying it on the app. $25 million is the signal. 295 $BTC is the size. The stack that moves the market is still the one at 848,000. #Bitcoin Price Prediction: What is Bitcoins next move?# #BTC Price Analysis# $XRP #Bullish
Robinhood bought $25 million of bitcoin for its own balance sheet. Johann Kerbrat, who runs crypto at the firm, told The Block the purchase is a commitment signal. He said the company cares about bitcoin and wanted the treasury aligned with that. He also said $25 million is small next to a market cap near $100 billion, and will not change the company’s path. at about $85,000, the buy is roughly 295 $BTC . Strategy bought 334 BTC for $28.7 million between October 1 and October 4, and holds 848,000. Robinhood’s entire position is a fraction of one of those weekly adds. the purchase sits next to a wider crypto push, including its own chain and plans for perpetual futures. A brokerage holding the asset it lists is a different step from a customer buying it on the app. $25 million is the signal. 295 $BTC is the size. The stack that moves the market is still the one at 848,000. #Bitcoin Price Prediction: What is Bitcoins next move?# #BTC Price Analysis# $XRP #Bullish

29
·
--
Eric Trump says crypto has already beaten the big banks. at TOKEN2049 in Singapore on October 7, the World Liberty Financial co-founder said AI will be the fastest driver of digital-asset growth. He said capital left crypto for AI over the past year and weighed on bitcoin, and that the money is starting to come back. His example was an agent booking travel and paying from a crypto wallet, not from a bank account. he also backed tokenization of real estate, art, and music, and said stablecoin growth could lift demand for U.S. debt. Stablecoins already hold a large share of Treasury bills. A bigger float is more bill demand. It is not a new buyer of the long bond, which is the one at 5.2%. the bank line is the claim. The part with a mechanism is the agent paying from a wallet. That use is still a forecast. The stablecoin bid for bills is the one already in the market. #BTC Price Analysis# #Bitcoin Price Prediction: What is Bitcoins next move?# #AI Agents 🤖# $BTC $XRP
Eric Trump says crypto has already beaten the big banks. at TOKEN2049 in Singapore on October 7, the World Liberty Financial co-founder said AI will be the fastest driver of digital-asset growth. He said capital left crypto for AI over the past year and weighed on bitcoin, and that the money is starting to come back. His example was an agent booking travel and paying from a crypto wallet, not from a bank account. he also backed tokenization of real estate, art, and music, and said stablecoin growth could lift demand for U.S. debt. Stablecoins already hold a large share of Treasury bills. A bigger float is more bill demand. It is not a new buyer of the long bond, which is the one at 5.2%. the bank line is the claim. The part with a mechanism is the agent paying from a wallet. That use is still a forecast. The stablecoin bid for bills is the one already in the market. #BTC Price Analysis# #Bitcoin Price Prediction: What is Bitcoins next move?# #AI Agents 🤖# $BTC $XRP

29
·
--
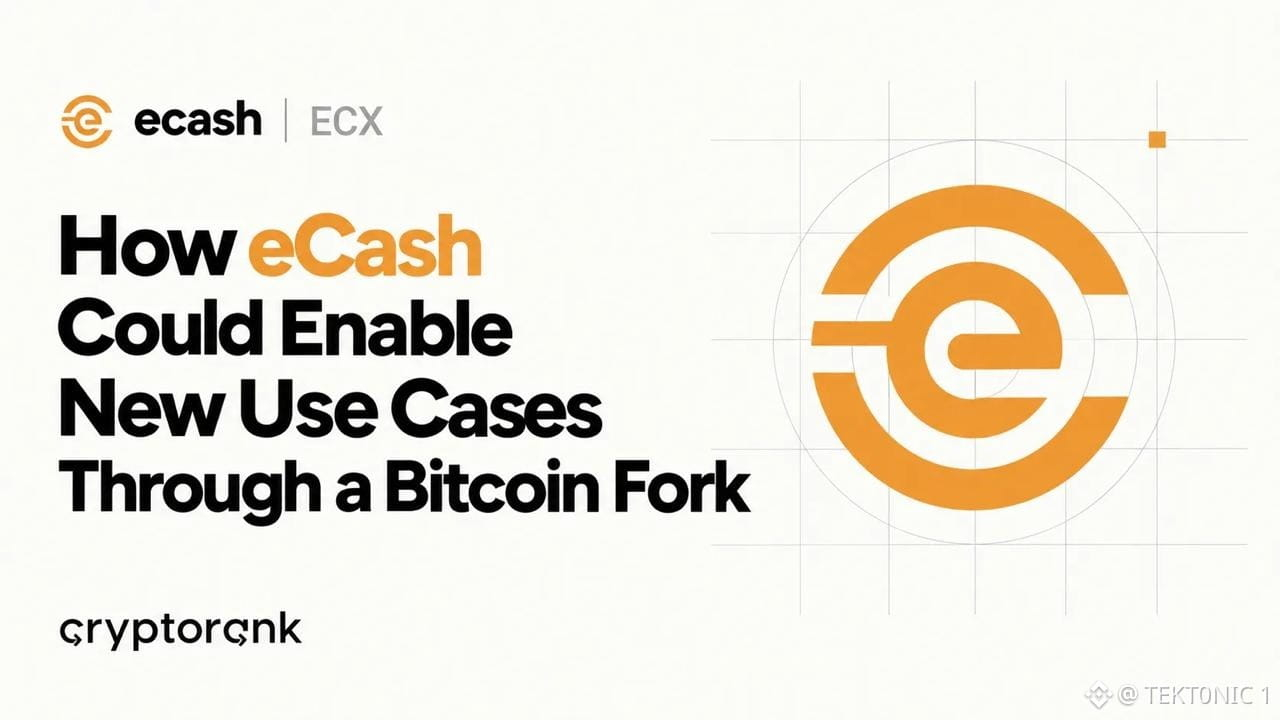
eCash is trying to make a programmable bitcoin without changing bitcoin. the project is a hard fork, planned for around October 31 at block 973,728. At that block, every bitcoin address is credited 1 ECX for 1 $BTC . The bitcoin stays where it is. No claim form. This ECX is not the existing eCash token, XEC. the add is drivechains, BIP 300 and BIP 301. eCash says seven sidechains will carry what the base chain does not: prediction markets, private payments, token issuance, and the rest. Blind merged mining ties a sidechain block to a main-chain block. Miners have to choose a chain. the fork has not happened. Alpha ran in August and Beta in September, both with practice coins, not the permanent 1:1 balance. Earlier notes still had the final fork hash and replay protection unpublished. Without replay protection, holders have to split coins themselves. October 31 is the target. ECX is the new coin. Bitcoin is unchanged unless a holder moves it on the wrong chain. #BTC Price Analysis# #Bitcoin Price Prediction: What is Bitcoins next move?# $BTC $ETH
eCash is trying to make a programmable bitcoin without changing bitcoin. the project is a hard fork, planned for around October 31 at block 973,728. At that block, every bitcoin address is credited 1 ECX for 1 $BTC . The bitcoin stays where it is. No claim form. This ECX is not the existing eCash token, XEC. the add is drivechains, BIP 300 and BIP 301. eCash says seven sidechains will carry what the base chain does not: prediction markets, private payments, token issuance, and the rest. Blind merged mining ties a sidechain block to a main-chain block. Miners have to choose a chain. the fork has not happened. Alpha ran in August and Beta in September, both with practice coins, not the permanent 1:1 balance. Earlier notes still had the final fork hash and replay protection unpublished. Without replay protection, holders have to split coins themselves. October 31 is the target. ECX is the new coin. Bitcoin is unchanged unless a holder moves it on the wrong chain. #BTC Price Analysis# #Bitcoin Price Prediction: What is Bitcoins next move?# $BTC $ETH
42
·
--
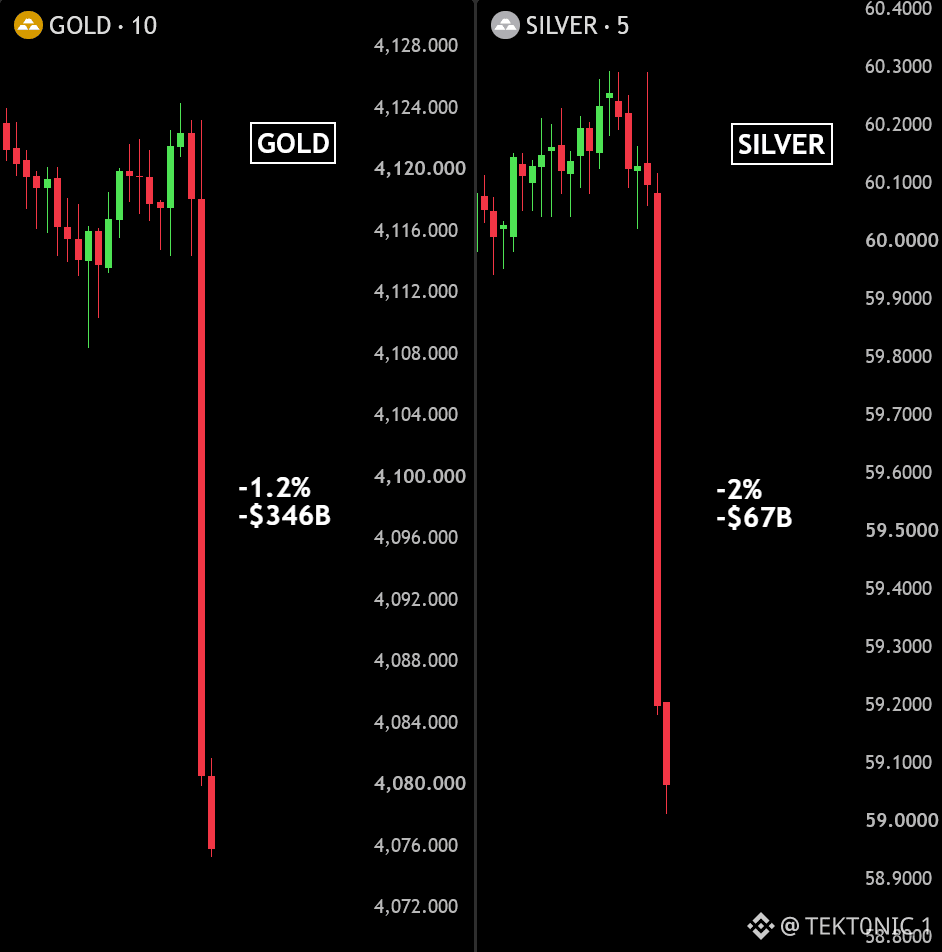
Gold and silver just lost hundreds of billions in a matter of minutes. the number going around is more than $400 billion in about 10 minutes. A larger drop is already on the books. On September 28, the two metals lost about $1.05 trillion in a single day, gold about $871 billion and silver about $180 billion. Gold fell about 3%. Silver fell about 5%. the dollar amount looks huge because the market is huge. Gold’s above-ground value is near $30 trillion, so a 3% day clears about $1 trillion. The 2013 drop was closer to 9%, on a much smaller base. the pressure is the yield. The 10-year has been near 5.2%. Since the Iran war began on February 28, gold is still about 19% lower and silver about 34% lower. Bitcoin is about 27% higher over that span. today gold is near $4,120, down about 1%. September 28 is the day with the full trillion-dollar loss. The 10-minute figure still needs a trade print behind it. #BTC Price Analysis# #Bitcoin Price Prediction: What is Bitcoins next move?# $BTC $XAUt #Macro Insights#
Gold and silver just lost hundreds of billions in a matter of minutes. the number going around is more than $400 billion in about 10 minutes. A larger drop is already on the books. On September 28, the two metals lost about $1.05 trillion in a single day, gold about $871 billion and silver about $180 billion. Gold fell about 3%. Silver fell about 5%. the dollar amount looks huge because the market is huge. Gold’s above-ground value is near $30 trillion, so a 3% day clears about $1 trillion. The 2013 drop was closer to 9%, on a much smaller base. the pressure is the yield. The 10-year has been near 5.2%. Since the Iran war began on February 28, gold is still about 19% lower and silver about 34% lower. Bitcoin is about 27% higher over that span. today gold is near $4,120, down about 1%. September 28 is the day with the full trillion-dollar loss. The 10-minute figure still needs a trade print behind it. #BTC Price Analysis# #Bitcoin Price Prediction: What is Bitcoins next move?# $BTC $XAUt #Macro Insights#
71
·
--
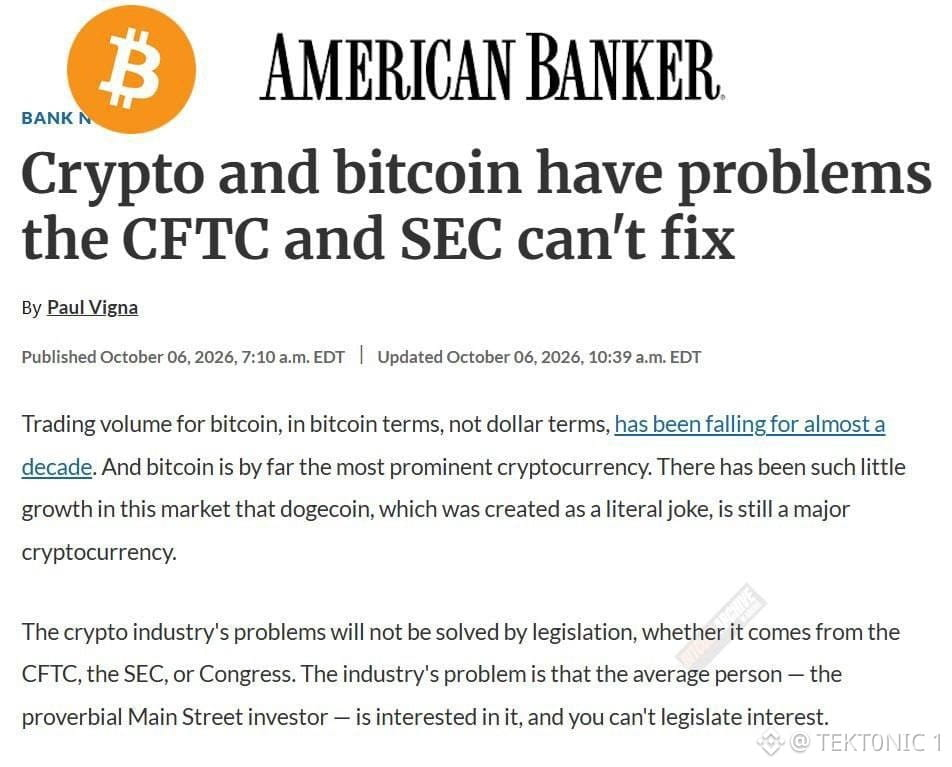
American Banker says bitcoin’s problems are not the ones the SEC and CFTC can fix. The volume line is the one that needs a unit. Paul Vigna wrote on October 6 that trading volume in bitcoin terms, not dollars, has been falling for almost a decade. That can be true and still miss the market. A coin at $86,000 needs fewer coins to clear the same trade it cleared at $600. Dollar volume is the number desks use. Coin volume falls when price rises and when coins leave exchanges. the use is not the meme comparison. U.S. spot bitcoin ETFs hold about 1.29 million $BTC , roughly $108 billion, about 6% of supply. Strategy holds another 848,000. Exchange reserves are near 2.7 million, down from about 3.15 million in mid-2024. That is coins sitting, not coins not used. dogecoin still ranking is a market-cap list. It is not a measure of settlement, ETF holdings, or corporate treasuries. Interest is not legislated. Holdings are reported. the decade decline is in coins per trade. The $108 billion is in the ETFs. Those are different facts. #BTC Price Analysis# #Bitcoin Price Prediction: What is Bitcoins next move?# $BTC $ETH
American Banker says bitcoin’s problems are not the ones the SEC and CFTC can fix. The volume line is the one that needs a unit. Paul Vigna wrote on October 6 that trading volume in bitcoin terms, not dollars, has been falling for almost a decade. That can be true and still miss the market. A coin at $86,000 needs fewer coins to clear the same trade it cleared at $600. Dollar volume is the number desks use. Coin volume falls when price rises and when coins leave exchanges. the use is not the meme comparison. U.S. spot bitcoin ETFs hold about 1.29 million $BTC , roughly $108 billion, about 6% of supply. Strategy holds another 848,000. Exchange reserves are near 2.7 million, down from about 3.15 million in mid-2024. That is coins sitting, not coins not used. dogecoin still ranking is a market-cap list. It is not a measure of settlement, ETF holdings, or corporate treasuries. Interest is not legislated. Holdings are reported. the decade decline is in coins per trade. The $108 billion is in the ETFs. Those are different facts. #BTC Price Analysis# #Bitcoin Price Prediction: What is Bitcoins next move?# $BTC $ETH
65
·
--
Since the U.S.-Iran war began on February 28, crypto is up and the metals are down. bitcoin is about +27%. Ether is about +40%. Total crypto market cap is about +26%. Gold is about −19%. Silver is about −34%. Late September had bitcoin nearer +24% and gold nearer −21%, so the gap has widened a little into October. the split is not a pure safety trade. Stocks rose too. The Nasdaq-tracking QQQ was about +22% by late September, and the S&P 500 about +11%. Gold’s drop lined up with higher rate expectations, not only with the war. A metal that pays no yield loses ground when the long bond sells off. bitcoin started the period near $67,000 and is near $86,000. That is a recovery from the first-half low as much as a war bid. Ether’s +40% is the larger move of the two. the metals are down. Crypto is up. The rate path is the other variable in the gold number. The war is the date. It is not the only cause. #BTC Price Analysis# #Bitcoin Price Prediction: What is Bitcoins next move?# #Macro Insights# $BTC $XAUt
Since the U.S.-Iran war began on February 28, crypto is up and the metals are down. bitcoin is about +27%. Ether is about +40%. Total crypto market cap is about +26%. Gold is about −19%. Silver is about −34%. Late September had bitcoin nearer +24% and gold nearer −21%, so the gap has widened a little into October. the split is not a pure safety trade. Stocks rose too. The Nasdaq-tracking QQQ was about +22% by late September, and the S&P 500 about +11%. Gold’s drop lined up with higher rate expectations, not only with the war. A metal that pays no yield loses ground when the long bond sells off. bitcoin started the period near $67,000 and is near $86,000. That is a recovery from the first-half low as much as a war bid. Ether’s +40% is the larger move of the two. the metals are down. Crypto is up. The rate path is the other variable in the gold number. The war is the date. It is not the only cause. #BTC Price Analysis# #Bitcoin Price Prediction: What is Bitcoins next move?# #Macro Insights# $BTC $XAUt


·
--
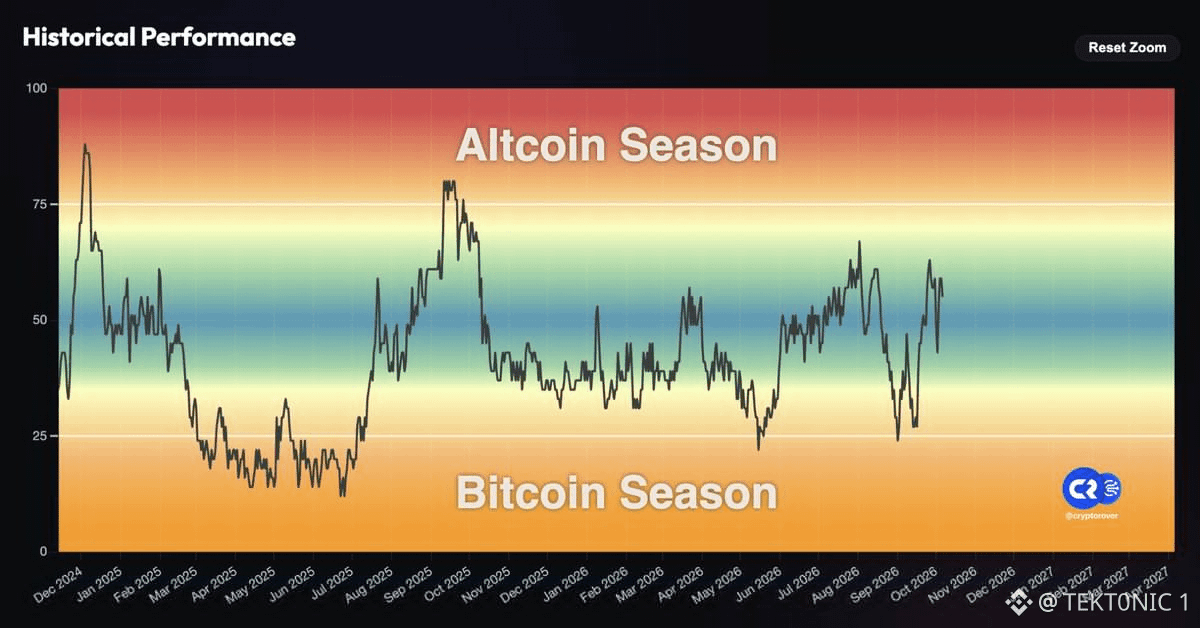
The altcoin season index is back near 60. That is not altseason. on this chart, 75 and above is the altcoin zone. 25 and below is $BTC season. The index touched about 80 in October 2025, then spent most of 2026 between 30 and 55. It dipped to about 25 in September and has bounced into the middle of the band. a reading of 60 means more altcoins have beaten bitcoin over the lookback than not. It does not mean the rotation is on. The last time the index held above 75 was brief, and it failed. The December 2024 spike near 85 was the last clear altcoin season on this chart. October is the month traders mark for a turn. The index is rising. It is still short of the line that has defined the prior altcoin seasons. 60 is a bounce. 75 is the level. It has not crossed it. #BTC Price Analysis# #Bitcoin Price Prediction: What is Bitcoins next move?# #Altcoin Season# $BTC $XRP
The altcoin season index is back near 60. That is not altseason. on this chart, 75 and above is the altcoin zone. 25 and below is $BTC season. The index touched about 80 in October 2025, then spent most of 2026 between 30 and 55. It dipped to about 25 in September and has bounced into the middle of the band. a reading of 60 means more altcoins have beaten bitcoin over the lookback than not. It does not mean the rotation is on. The last time the index held above 75 was brief, and it failed. The December 2024 spike near 85 was the last clear altcoin season on this chart. October is the month traders mark for a turn. The index is rising. It is still short of the line that has defined the prior altcoin seasons. 60 is a bounce. 75 is the level. It has not crossed it. #BTC Price Analysis# #Bitcoin Price Prediction: What is Bitcoins next move?# #Altcoin Season# $BTC $XRP
·
--
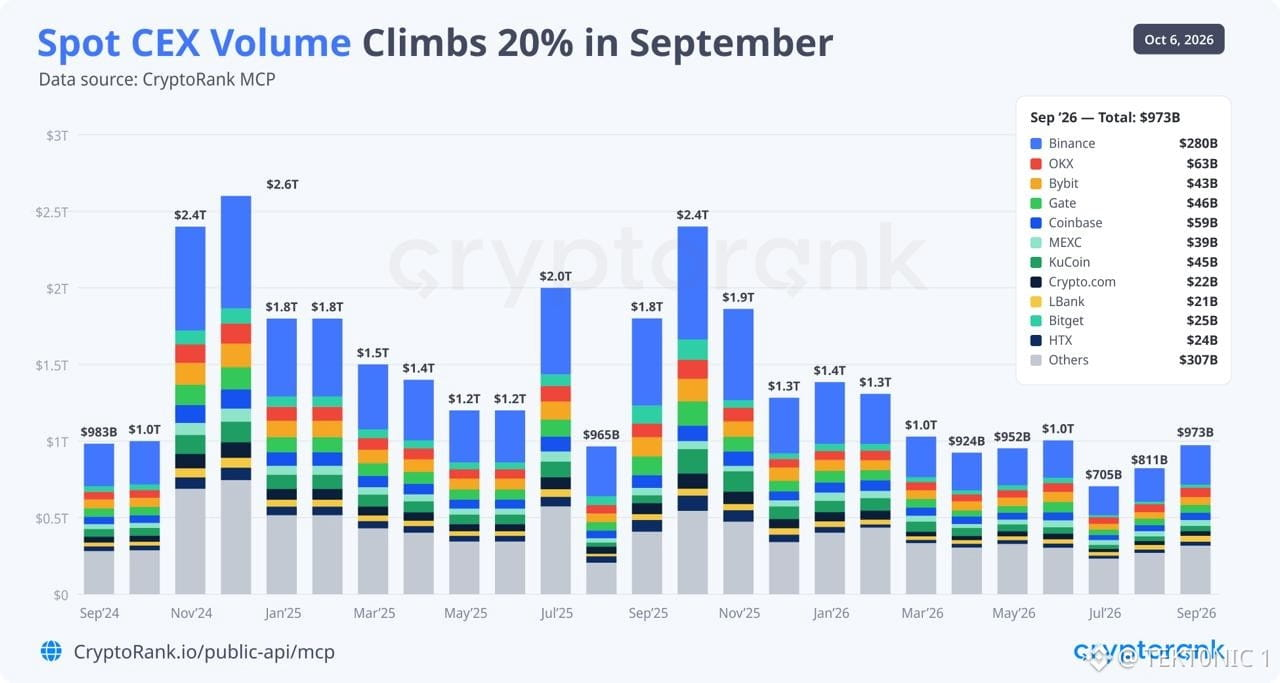
Spot volume climbed 20% in September, even as the quarter closed lower. CryptoRank puts centralized spot trading at $973 billion in September 2026, the second monthly gain after August. Q3 as a whole still finished below the prior quarter. The rebound was the last two months, not the full three. Binance took the largest share of that September volume. New listings also picked up, 517 assets in Q3, about 47% more than the quarter before. About a quarter of spot trading is now on decentralized markets, so the $973 billion is the centralized number, not the whole market. volume is turnover. The same coin can trade many times. A 20% monthly gain after a weak quarter is activity coming back, not a new high for the year. $973 billion is the month. The quarter still closed lower. October is the test of whether the two-month rebound holds. #BTC Price Analysis# #Bitcoin Price Prediction: What is Bitcoins next move?# $BTC $ETH #Macro Insights#
Spot volume climbed 20% in September, even as the quarter closed lower. CryptoRank puts centralized spot trading at $973 billion in September 2026, the second monthly gain after August. Q3 as a whole still finished below the prior quarter. The rebound was the last two months, not the full three. Binance took the largest share of that September volume. New listings also picked up, 517 assets in Q3, about 47% more than the quarter before. About a quarter of spot trading is now on decentralized markets, so the $973 billion is the centralized number, not the whole market. volume is turnover. The same coin can trade many times. A 20% monthly gain after a weak quarter is activity coming back, not a new high for the year. $973 billion is the month. The quarter still closed lower. October is the test of whether the two-month rebound holds. #BTC Price Analysis# #Bitcoin Price Prediction: What is Bitcoins next move?# $BTC $ETH #Macro Insights#
·
--
Tom Lee says Ethereum can make a new high this year. The $25,000 to $50,000 figure is a longer call, not the 2026 close. in a late-September interview he said a new all-time high this year was “absolutely” possible. He put $3,000 as the near-term level and “well above $5,000” after that. The prior high is about $4,950, from August 2025. $ETH was near $2,700 when he said it. the larger number is the multi-year one. He said a 10x to 12x move above the old high, over a couple of years, would land near $60,000. A separate May framework, using a 0.048 $ETH /$BTC ratio against a $250,000 bitcoin, pointed to about $22,000. Coverage of an October appearance has used $50,000 as the cycle case. he chairs BitMine, which has been buying ether toward a 5% supply target. The year-end call is a new high, about $5,000. The $25,000 to $50,000 range is the later scenario. Those are not the same trade. #BTC Price Analysis# #Bitcoin Price Prediction: What is Bitcoins next move?# $BTC #Ethereum
Tom Lee says Ethereum can make a new high this year. The $25,000 to $50,000 figure is a longer call, not the 2026 close. in a late-September interview he said a new all-time high this year was “absolutely” possible. He put $3,000 as the near-term level and “well above $5,000” after that. The prior high is about $4,950, from August 2025. $ETH was near $2,700 when he said it. the larger number is the multi-year one. He said a 10x to 12x move above the old high, over a couple of years, would land near $60,000. A separate May framework, using a 0.048 $ETH /$BTC ratio against a $250,000 bitcoin, pointed to about $22,000. Coverage of an October appearance has used $50,000 as the cycle case. he chairs BitMine, which has been buying ether toward a 5% supply target. The year-end call is a new high, about $5,000. The $25,000 to $50,000 range is the later scenario. Those are not the same trade. #BTC Price Analysis# #Bitcoin Price Prediction: What is Bitcoins next move?# $BTC #Ethereum

·
--
QTC is now entering the NEAR ecosystem through NEAR Intents. the integration gives users a way to swap into QTC from 180+ assets across 30+ networks, including $BTC , ETH, SOL and $ZEC . that matters because QTC is built around post-quantum security and privacy, using ML-DSA / Dilithium-5 for its core cryptography. NEAR Intents handles the cross-chain routing, so users don’t need to manually bridge assets between networks. NEAR currently supports 35 chains and 180+ assets through its intent-based infrastructure. QTC also runs as a standalone Layer 1 with a 21M supply cap and Proof-of-Work issuance. quantum-resistant money is getting a much easier path into the wider crypto market. #Bitcoin Price Prediction: What is Bitcoins next move?# #BTC Price Analysis# $BTC $ZEC
QTC is now entering the NEAR ecosystem through NEAR Intents. the integration gives users a way to swap into QTC from 180+ assets across 30+ networks, including $BTC , ETH, SOL and $ZEC . that matters because QTC is built around post-quantum security and privacy, using ML-DSA / Dilithium-5 for its core cryptography. NEAR Intents handles the cross-chain routing, so users don’t need to manually bridge assets between networks. NEAR currently supports 35 chains and 180+ assets through its intent-based infrastructure. QTC also runs as a standalone Layer 1 with a 21M supply cap and Proof-of-Work issuance. quantum-resistant money is getting a much easier path into the wider crypto market. #Bitcoin Price Prediction: What is Bitcoins next move?# #BTC Price Analysis# $BTC $ZEC

·
--
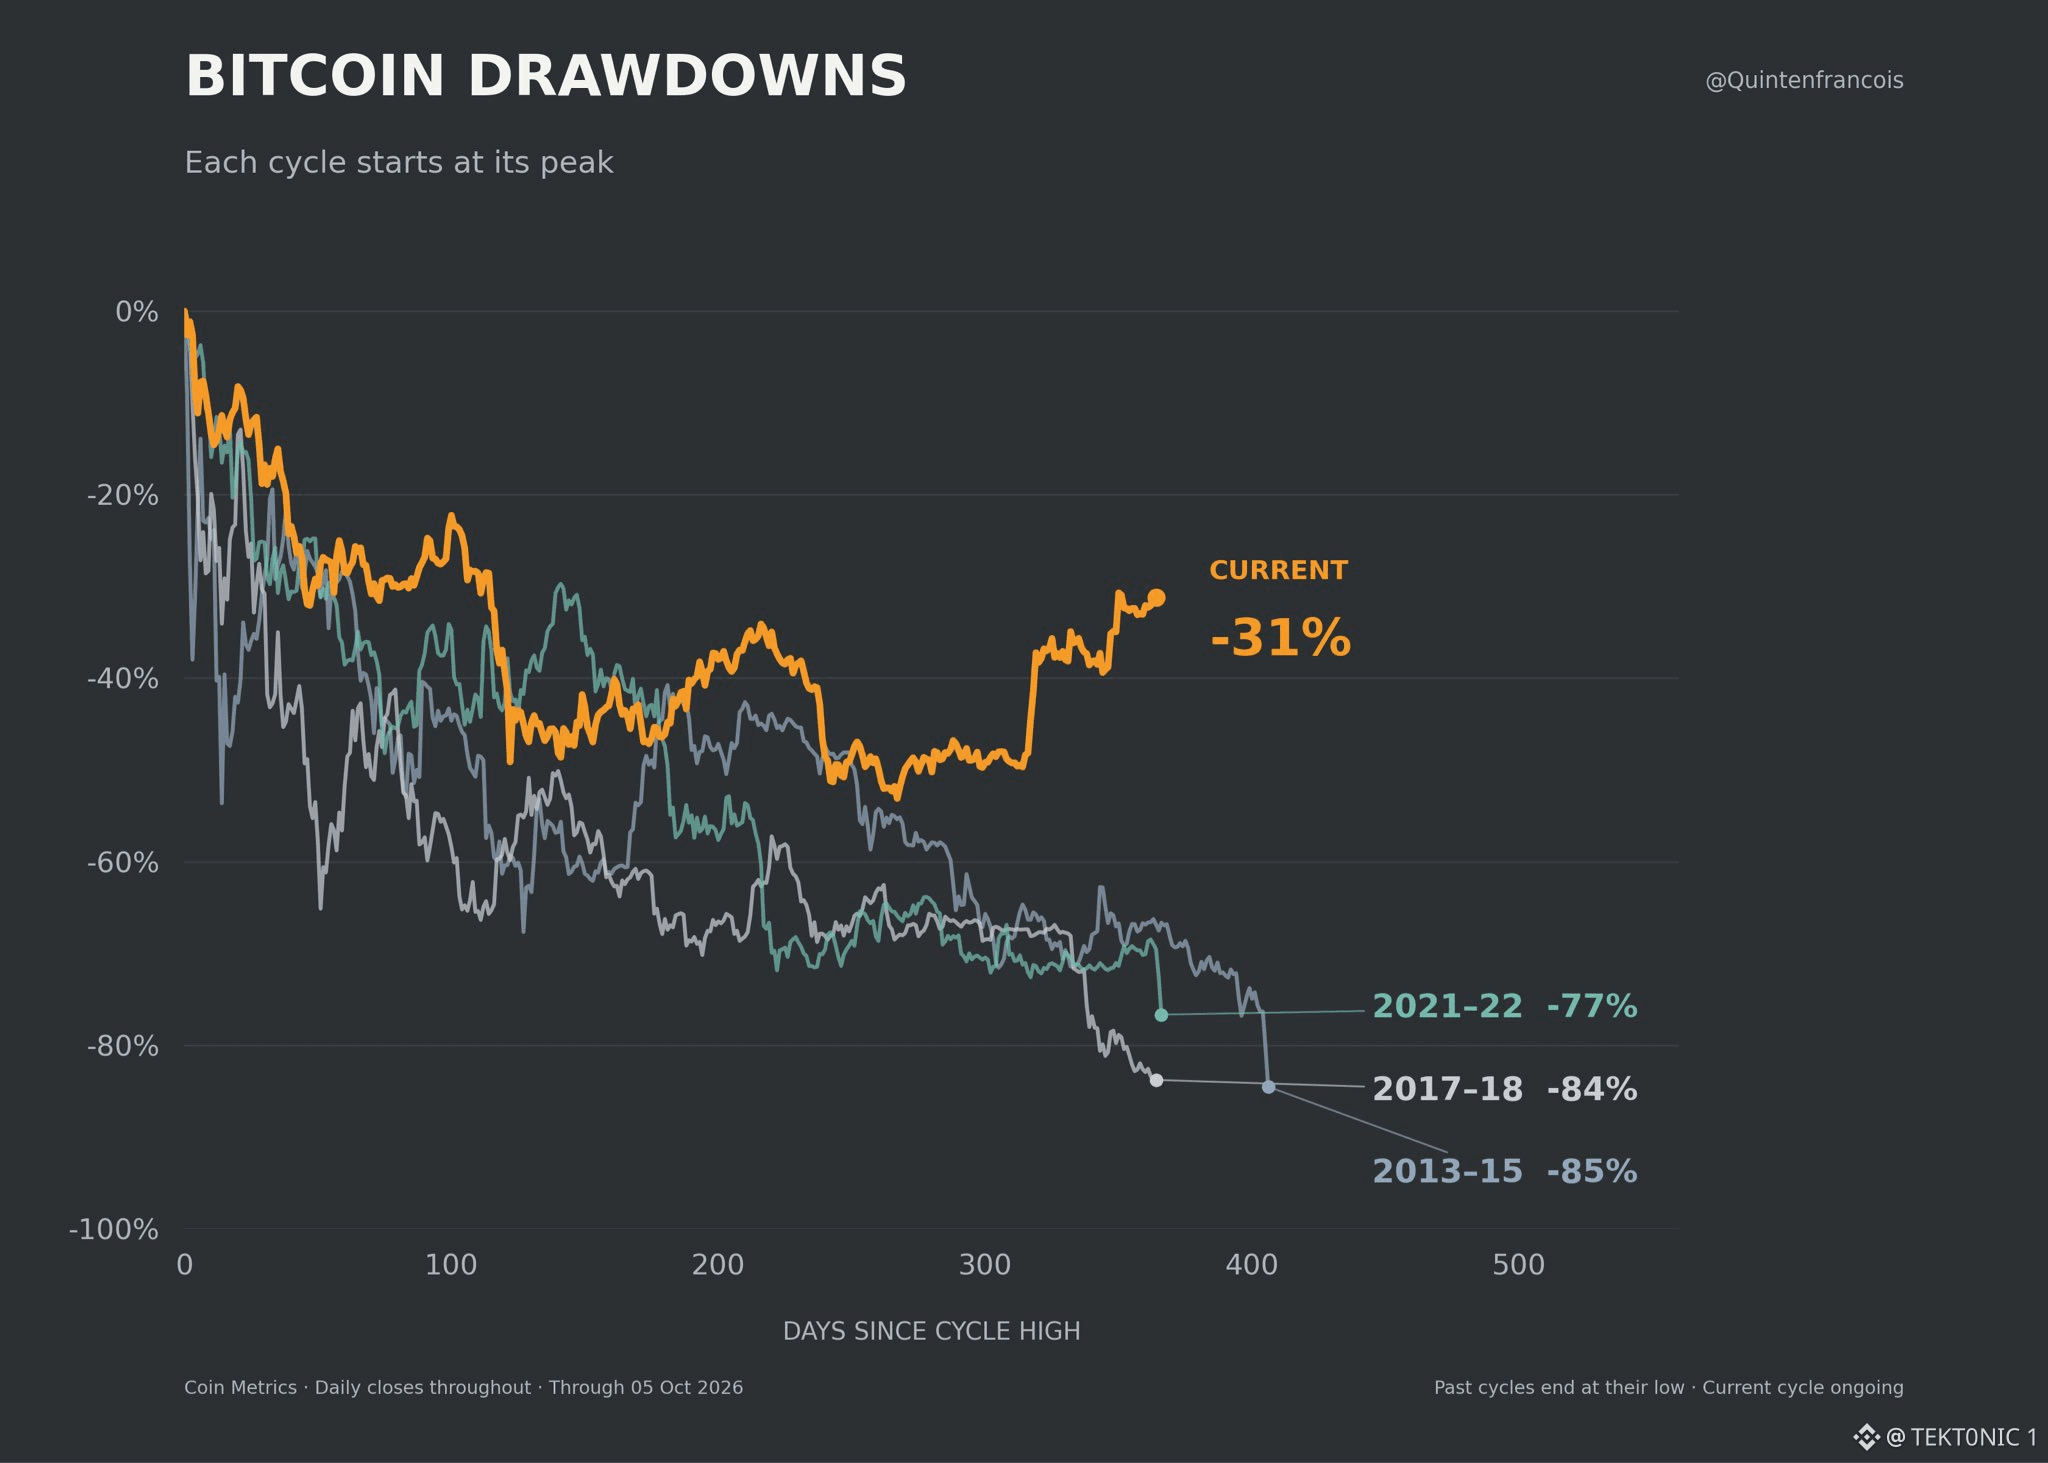
This $BTC cycle is still only 31% under its high. the chart, from Coin Metrics through October 5, starts each cycle at its peak. The current drawdown is −31%, about a year on. The last three finished much deeper: 2021–22 at −77%, 2017–18 at −84%, and 2013–15 at −85%. a −31% drawdown from the October 2025 high near $125,000 puts price around $86,000. That matches where Bitcoin is trading. The prior cycles did not stop at −30%. They kept falling for 300 to 400 days and ended at the low. this one has not ended. The chart says the past cycles are closed at their lows, and the current one is ongoing. A shallower path so far is the ETF and corporate bid. It is not a finished cycle. −31% is the number. −77% is what the last one did. The difference holds only if this low is already in. #BTC Price Analysis# #Bitcoin Price Prediction: What is Bitcoins next move?# $BTC $ETH
This $BTC cycle is still only 31% under its high. the chart, from Coin Metrics through October 5, starts each cycle at its peak. The current drawdown is −31%, about a year on. The last three finished much deeper: 2021–22 at −77%, 2017–18 at −84%, and 2013–15 at −85%. a −31% drawdown from the October 2025 high near $125,000 puts price around $86,000. That matches where Bitcoin is trading. The prior cycles did not stop at −30%. They kept falling for 300 to 400 days and ended at the low. this one has not ended. The chart says the past cycles are closed at their lows, and the current one is ongoing. A shallower path so far is the ETF and corporate bid. It is not a finished cycle. −31% is the number. −77% is what the last one did. The difference holds only if this low is already in. #BTC Price Analysis# #Bitcoin Price Prediction: What is Bitcoins next move?# $BTC $ETH
32
·
--
The U.S. government wallet just moved 264.863 $BTC seized in the Bitfinex case. the transaction is in block 970191, at 15:28 UTC on October 6. Two inputs left the labeled government address. One output sent 0.00115539 BTC to Coinbase Prime. The other sent 264.86266831 BTC to a new address, bc1q2khlx. The fee was 630 sats, about 3 sats per virtual byte. at roughly $86,000, the transfer is about $22.8 million. A small output to Coinbase Prime next to a large output to a fresh address is the pattern traders read as a test. It is not a confirmed sale. Coinbase Prime also custodies forfeited assets for the U.S. Marshals. A deposit and a liquidation are different events. forfeited bitcoin is supposed to stay in the Strategic Bitcoin Reserve under the March 2025 order, not be sold. A prior Coinbase Prime transfer, 57.5 BTC from the Samourai forfeiture, was later confirmed unsold. the 0.001 BTC is the piece on Coinbase Prime. The 264.86 $BTC is still unspent at a new address. Watch that address. A move into Coinbase Prime would be the next step. This one is not that. #Bitcoin Price Prediction: What is Bitcoins next move?# #BTC Price Analysis# $ZEC
The U.S. government wallet just moved 264.863 $BTC seized in the Bitfinex case. the transaction is in block 970191, at 15:28 UTC on October 6. Two inputs left the labeled government address. One output sent 0.00115539 BTC to Coinbase Prime. The other sent 264.86266831 BTC to a new address, bc1q2khlx. The fee was 630 sats, about 3 sats per virtual byte. at roughly $86,000, the transfer is about $22.8 million. A small output to Coinbase Prime next to a large output to a fresh address is the pattern traders read as a test. It is not a confirmed sale. Coinbase Prime also custodies forfeited assets for the U.S. Marshals. A deposit and a liquidation are different events. forfeited bitcoin is supposed to stay in the Strategic Bitcoin Reserve under the March 2025 order, not be sold. A prior Coinbase Prime transfer, 57.5 BTC from the Samourai forfeiture, was later confirmed unsold. the 0.001 BTC is the piece on Coinbase Prime. The 264.86 $BTC is still unspent at a new address. Watch that address. A move into Coinbase Prime would be the next step. This one is not that. #Bitcoin Price Prediction: What is Bitcoins next move?# #BTC Price Analysis# $ZEC

28
Log in to explore more content
Join global crypto users on Binance Square
⚡️ Get latest and useful information about crypto.
💬 Trusted by the world’s largest crypto exchange.
👍 Discover real insights from verified creators.
Email / Phone number
Trending Topics
FedMinutesFocusOnOctoberPause
49,381 views
731 Discussing
#fedminutesfocusonoctoberpause
🚨 OCTOBER FED HIKE ODDS COLLAPSE TO 21.6%… Is $BTC About to React? 👀
The Fed is about to give markets another major clue.
Investors are waiting for today’s FOMC minutes — and the biggest question is whether October brings another rate hike… or a pause.
Right now, the odds of a 25-basis-point October hike have fallen to just 21.6%.
That’s a huge shift in expectations.
But here’s what makes this interesting… 👀
The Fed raised rates to 3.75%–4.00% in September, but recent weakness in jobs data and softer inflation have made another immediate hike look less certain.
And for crypto, this matters.
A Fed pause could reduce pressure on financial conditions and potentially improve risk appetite.
That could become a tailwind for BTC
But there’s a catch…
Bitcoin is already under pressure as the dollar and Treasury yields move higher.
So tonight’s minutes could become a volatility trigger.
Dovish Fed → liquidity hopes → bullish .
BTC narrative?
Hawkish Fed → higher-rate fears → more pressure on risk assets?
The real question:
Is October becoming the pause Bitcoin bulls have been waiting for… or could the Fed surprise the market again? 👀
Watch BTC + Fed expectations + Treasury yields closely.
#FederalReserve #Fed #Crypto #InterestRates
$ETH
$SOL
Shae Cassler Sw9r
·23 Likes
·45.9k views
BinanceLaunchesBinanceIntelligence
992,602 views
6,004 Discussing
EvernorthDelaysNasdaqDebutToOct12
2,096 views
106 Discussing