
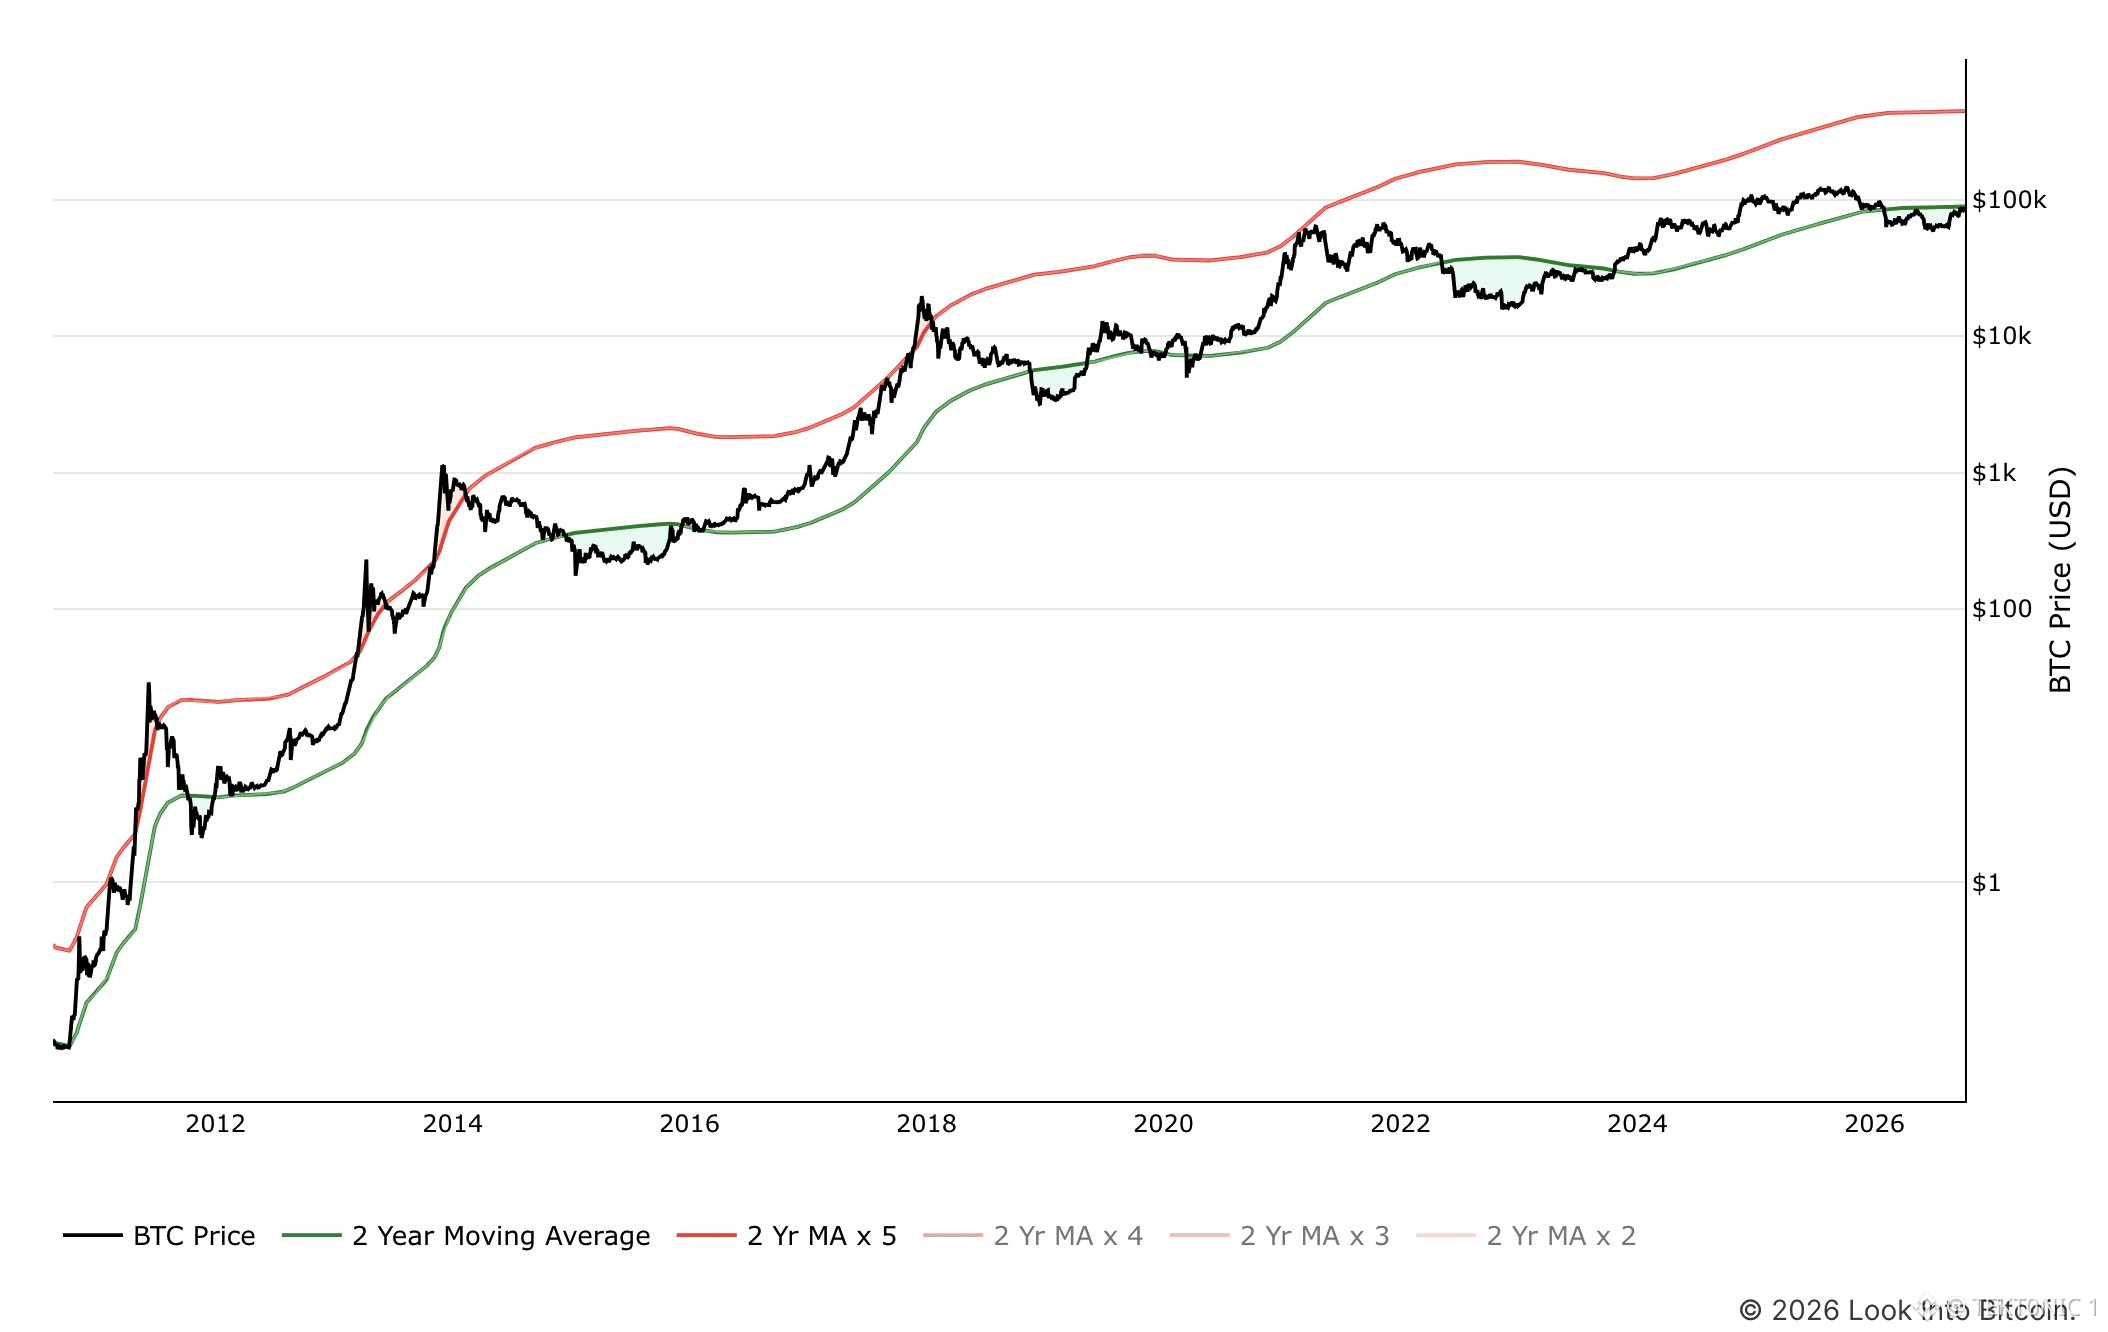
Bitcoin is back at its 2-year moving average. on the Look Into $BTC chart, the green line is that average, and price is sitting on it near $85,000. The red line is the same average multiplied by five. That band has marked the last cycle highs, in 2013, 2017, and 2021. Price is well under it. buying below the 2-year average has lined up with the better entries. It did in 2015, in 2019, and again in 2022. Each of those was followed by a move back above the average and, later, toward the 5x band. The average is a long mean. It is not a floor that holds on the first test. the hurdle is a hold above it. A weekly close back through the green line keeps the long trend intact ON THE $BTC chart. A close under it puts price where the last two recoveries started, not where they finished. $85,000 is the test. The 5x band is the old top zone. Price has not reached it. #BTC Price Analysis# #Bitcoin Price Prediction: What is Bitcoins next move?# $ETH


Post
Disclaimer: Includes third-party opinions. No advice. Binance AI may be used without guarantee. See T&Cs.