
Spectre BTC 1
27 Posts

Spectre BTC 1
Report
Block User
Verified KOL | Binance, X and CMC Top Creator | Early $BTC | Market analyst
0 Following
1 Followers
1 Liked
Posts
$BTC is reclaiming the $80K area mainly because buying pressure has returned after a major macro-driven selloff.
Key drivers right now:
ETF demand: U.S. spot Bitcoin ETFs have seen inflows return, signaling renewed institutional demand.
Short covering: A large amount of bearish leverage was flushed during the previous volatility, allowing BTC to move higher faster once buyers returned.
Liquidity expectations: U.S. Treasury buybacks previously pushed long-term yields lower and improved risk appetite, helping BTC's recovery.
BTC resilience: Despite the Fed hiking rates and the CLARITY Act setback this week, Bitcoin has held relatively strongly, suggesting sellers have not been able to regain control.
The important part: $80K is now a major psychological and technical zone. Holding above it with sustained ETF inflows would provide stronger confirmation of the move. A rejection back below it would mean the breakout is still unconfirmed.
So, this isn't just retail FOMO. ETF demand + short covering + liquidity/macro positioning are the main forces behind the move.
#BTC Price Analysis#
$BTC is reclaiming the $80K area mainly because buying pressure has returned after a major macro-driven selloff.
Key drivers right now:
ETF demand: U.S. spot Bitcoin ETFs have seen inflows return, signaling renewed institutional demand.
Short covering: A large amount of bearish leverage was flushed during the previous volatility, allowing BTC to move higher faster once buyers returned.
Liquidity expectations: U.S. Treasury buybacks previously pushed long-term yields lower and improved risk appetite, helping BTC's recovery.
BTC resilience: Despite the Fed hiking rates and the CLARITY Act setback this week, Bitcoin has held relatively strongly, suggesting sellers have not been able to regain control.
The important part: $80K is now a major psychological and technical zone. Holding above it with sustained ETF inflows would provide stronger confirmation of the move. A rejection back below it would mean the breakout is still unconfirmed.
So, this isn't just retail FOMO. ETF demand + short covering + liquidity/macro positioning are the main forces behind the move.
#BTC Price Analysis#
Key drivers right now:
ETF demand: U.S. spot Bitcoin ETFs have seen inflows return, signaling renewed institutional demand.
Short covering: A large amount of bearish leverage was flushed during the previous volatility, allowing BTC to move higher faster once buyers returned.
Liquidity expectations: U.S. Treasury buybacks previously pushed long-term yields lower and improved risk appetite, helping BTC's recovery.
BTC resilience: Despite the Fed hiking rates and the CLARITY Act setback this week, Bitcoin has held relatively strongly, suggesting sellers have not been able to regain control.
The important part: $80K is now a major psychological and technical zone. Holding above it with sustained ETF inflows would provide stronger confirmation of the move. A rejection back below it would mean the breakout is still unconfirmed.
So, this isn't just retail FOMO. ETF demand + short covering + liquidity/macro positioning are the main forces behind the move.
#BTC Price Analysis#

36
Solana's Bitwise BSOL crossed $1B in assets in early September, yet SOL closed at $101.57 on September 17, still about 65% below its $293.31 ATH. The complication: SOL is not collapsing either, up 2.7% over seven days, with the September 12 to 17 range sitting between $98.54 and $106.49.
That's the gap: institutional access is expanding faster than price is validating it. This is a watch, not a confident long or short. On September 16, Solana launched Project Harmonia with Allfunds, connecting a distribution network representing roughly €1.9T in assets under administration to tokenized funds on Solana.
The tokenomics story is less settled. SIMD-0550, proposed June 2, would accelerate disinflation from -15% to -30%, potentially reducing six-year emissions by 18.9M SOL, but it remains under discussion and has not been approved.
For SOL/USDT, $106.49 is the confirmation line. A close above it would reclaim this week's high. $98.54 is immediate support. Below that, $90 becomes the next reference zone.
Timeframe: next 1-2 weeks, with Alpenglow activation targeted for September 28 and Harmonia submissions closing October 24.
A confirmed close below $98.54 weakens this thesis. The asymmetric risk is that broader crypto strength lifts SOL while token-specific demand remains unchanged.
$SOL
Solana's Bitwise BSOL crossed $1B in assets in early September, yet SOL closed at $101.57 on September 17, still about 65% below its $293.31 ATH. The complication: SOL is not collapsing either, up 2.7% over seven days, with the September 12 to 17 range sitting between $98.54 and $106.49.
That's the gap: institutional access is expanding faster than price is validating it. This is a watch, not a confident long or short. On September 16, Solana launched Project Harmonia with Allfunds, connecting a distribution network representing roughly €1.9T in assets under administration to tokenized funds on Solana.
The tokenomics story is less settled. SIMD-0550, proposed June 2, would accelerate disinflation from -15% to -30%, potentially reducing six-year emissions by 18.9M SOL, but it remains under discussion and has not been approved.
For SOL/USDT, $106.49 is the confirmation line. A close above it would reclaim this week's high. $98.54 is immediate support. Below that, $90 becomes the next reference zone.
Timeframe: next 1-2 weeks, with Alpenglow activation targeted for September 28 and Harmonia submissions closing October 24.
A confirmed close below $98.54 weakens this thesis. The asymmetric risk is that broader crypto strength lifts SOL while token-specific demand remains unchanged.
$SOL
That's the gap: institutional access is expanding faster than price is validating it. This is a watch, not a confident long or short. On September 16, Solana launched Project Harmonia with Allfunds, connecting a distribution network representing roughly €1.9T in assets under administration to tokenized funds on Solana.
The tokenomics story is less settled. SIMD-0550, proposed June 2, would accelerate disinflation from -15% to -30%, potentially reducing six-year emissions by 18.9M SOL, but it remains under discussion and has not been approved.
For SOL/USDT, $106.49 is the confirmation line. A close above it would reclaim this week's high. $98.54 is immediate support. Below that, $90 becomes the next reference zone.
Timeframe: next 1-2 weeks, with Alpenglow activation targeted for September 28 and Harmonia submissions closing October 24.
A confirmed close below $98.54 weakens this thesis. The asymmetric risk is that broader crypto strength lifts SOL while token-specific demand remains unchanged.
$SOL

52
XRP Ledger released "xrpld" 3.4.0 on September 16, adding LendingProtocolV1_1 with closed-ended vaults and cash-basis accounting, yet XRP is still around $1.3198, versus $1.4895 on September 14 and a September 16 low of $1.2516. Meanwhile, U.S. spot XRP ETFs had accumulated more than $1.5B of inflows by early March, with over 769M XRP in custody, but XRP remains down about 6.6% over seven days.
That divergence is the tell: network functionality and institutional access are advancing faster than price confirmation. This is a watch, not a confident long or short. Ripple also stated on September 15 that the failed Senate vote on the Clarity Act did not change XRP's established legal status, separating that regulatory development from the current price weakness.
For XRP/USDT, $1.4909 is the confirmation level, reclaiming this week's high. $1.2516 is the immediate support, defined by the September 16 low. A confirmed break below it puts $1.20 back on the line, a level that previously acted as a major breakout reference in June.
Timeframe: next 1-2 weeks, while 3.4.0 adoption develops following the September 16 release.
A daily close below $1.2516 invalidates this watch setup. Broad-market strength could lift XRP without improving XRP-specific demand.
$XRP
XRP Ledger released "xrpld" 3.4.0 on September 16, adding LendingProtocolV1_1 with closed-ended vaults and cash-basis accounting, yet XRP is still around $1.3198, versus $1.4895 on September 14 and a September 16 low of $1.2516. Meanwhile, U.S. spot XRP ETFs had accumulated more than $1.5B of inflows by early March, with over 769M XRP in custody, but XRP remains down about 6.6% over seven days.
That divergence is the tell: network functionality and institutional access are advancing faster than price confirmation. This is a watch, not a confident long or short. Ripple also stated on September 15 that the failed Senate vote on the Clarity Act did not change XRP's established legal status, separating that regulatory development from the current price weakness.
For XRP/USDT, $1.4909 is the confirmation level, reclaiming this week's high. $1.2516 is the immediate support, defined by the September 16 low. A confirmed break below it puts $1.20 back on the line, a level that previously acted as a major breakout reference in June.
Timeframe: next 1-2 weeks, while 3.4.0 adoption develops following the September 16 release.
A daily close below $1.2516 invalidates this watch setup. Broad-market strength could lift XRP without improving XRP-specific demand.
$XRP
That divergence is the tell: network functionality and institutional access are advancing faster than price confirmation. This is a watch, not a confident long or short. Ripple also stated on September 15 that the failed Senate vote on the Clarity Act did not change XRP's established legal status, separating that regulatory development from the current price weakness.
For XRP/USDT, $1.4909 is the confirmation level, reclaiming this week's high. $1.2516 is the immediate support, defined by the September 16 low. A confirmed break below it puts $1.20 back on the line, a level that previously acted as a major breakout reference in June.
Timeframe: next 1-2 weeks, while 3.4.0 adoption develops following the September 16 release.
A daily close below $1.2516 invalidates this watch setup. Broad-market strength could lift XRP without improving XRP-specific demand.
$XRP

75
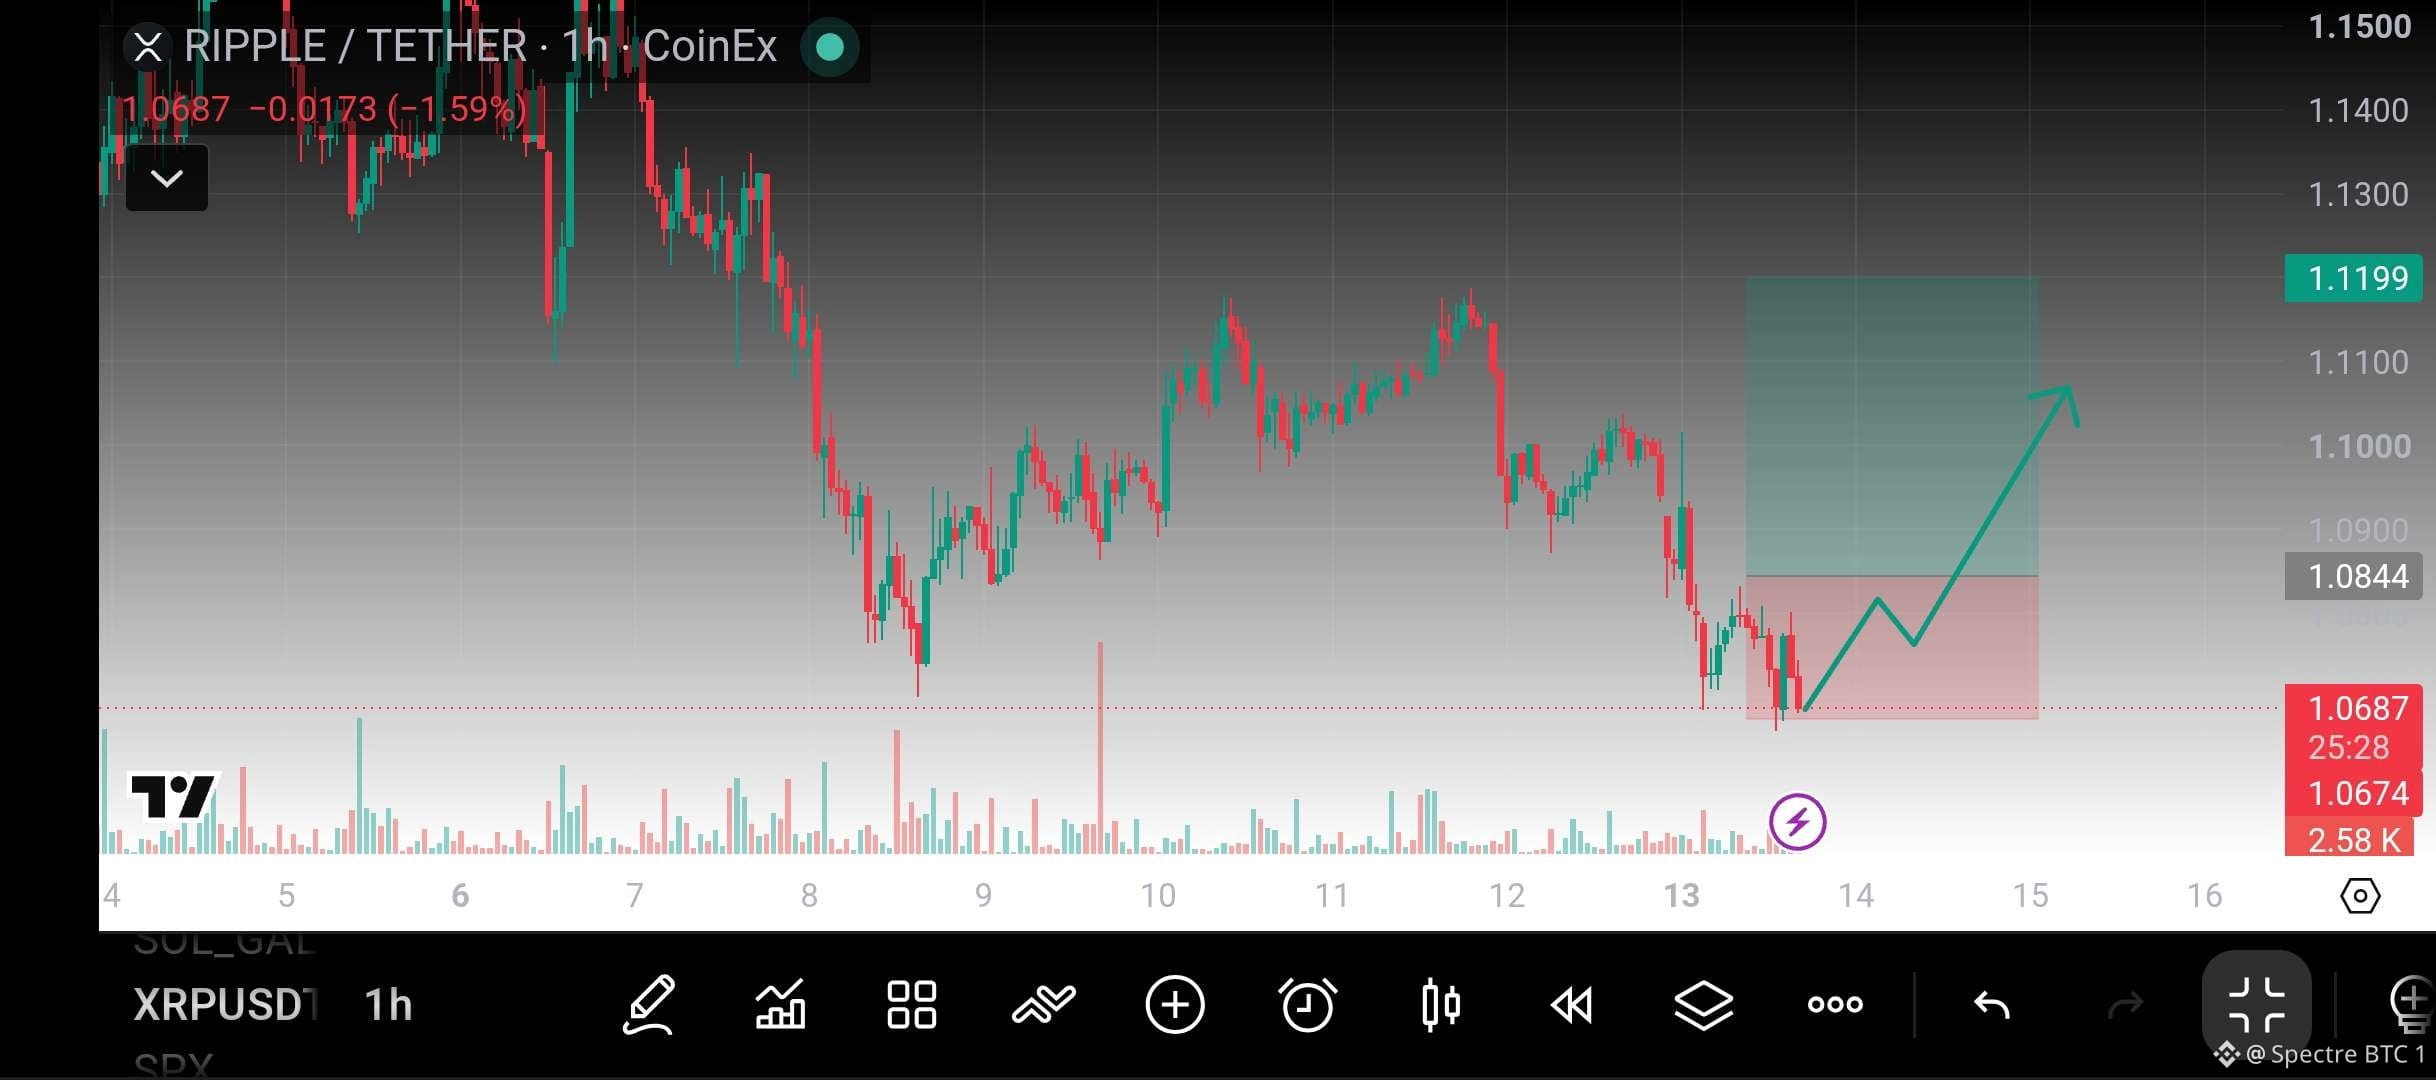
$XRP is holding a key demand zone after a sharp selloff.
Bulls need to reclaim $1.084 to regain momentum, while a strong bounce from current levels could fuel a move toward $1.11. If support fails, expect more downside.
#XRP
$XRP is holding a key demand zone after a sharp selloff.
Bulls need to reclaim $1.084 to regain momentum, while a strong bounce from current levels could fuel a move toward $1.11. If support fails, expect more downside.
#XRP
Bulls need to reclaim $1.084 to regain momentum, while a strong bounce from current levels could fuel a move toward $1.11. If support fails, expect more downside.
#XRP
54
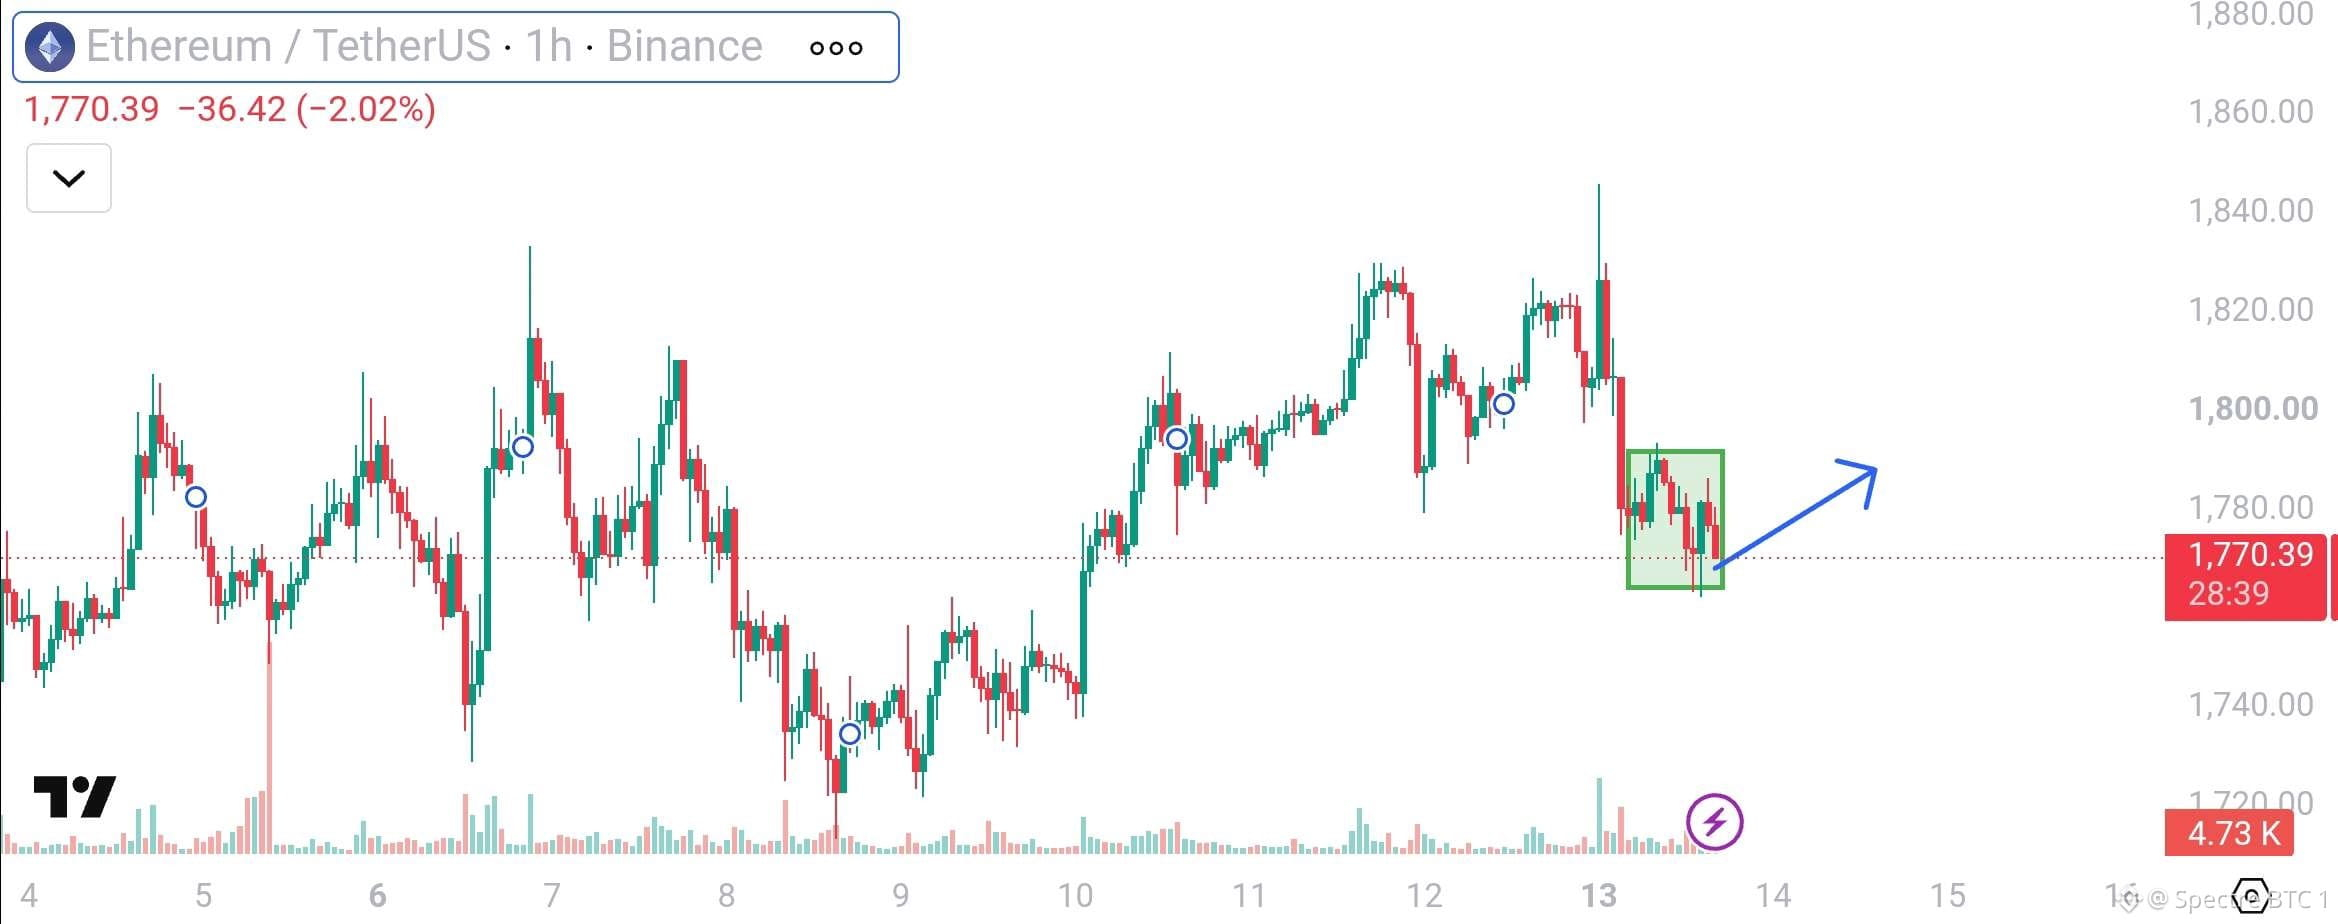
$ETH is struggling below resistance after a strong rally, with momentum fading on the 1H chart.
A breakdown from the current range could trigger a move toward lower support before buyers step back in. Watch for confirmation, not predictions.
#ETH
$ETH is struggling below resistance after a strong rally, with momentum fading on the 1H chart.
A breakdown from the current range could trigger a move toward lower support before buyers step back in. Watch for confirmation, not predictions.
#ETH
A breakdown from the current range could trigger a move toward lower support before buyers step back in. Watch for confirmation, not predictions.
#ETH
60
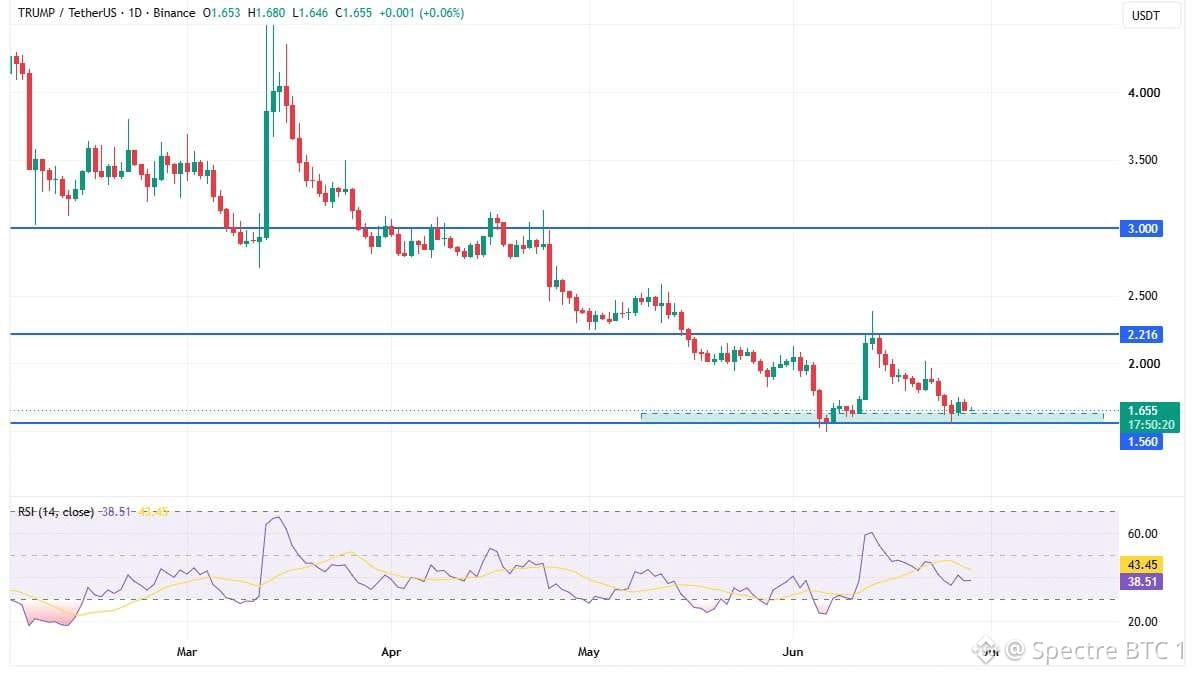
$TRUMP continues to defend the $1.56 support, with buyers stepping in every time price tests the zone.
That's keeping the broader downtrend from accelerating, but the real test is still ahead. A move above $2.22 could shift momentum, while losing $1.56 would likely invite fresh selling.
#TRUMP
$TRUMP continues to defend the $1.56 support, with buyers stepping in every time price tests the zone.
That's keeping the broader downtrend from accelerating, but the real test is still ahead. A move above $2.22 could shift momentum, while losing $1.56 would likely invite fresh selling.
#TRUMP
That's keeping the broader downtrend from accelerating, but the real test is still ahead. A move above $2.22 could shift momentum, while losing $1.56 would likely invite fresh selling.
#TRUMP
67
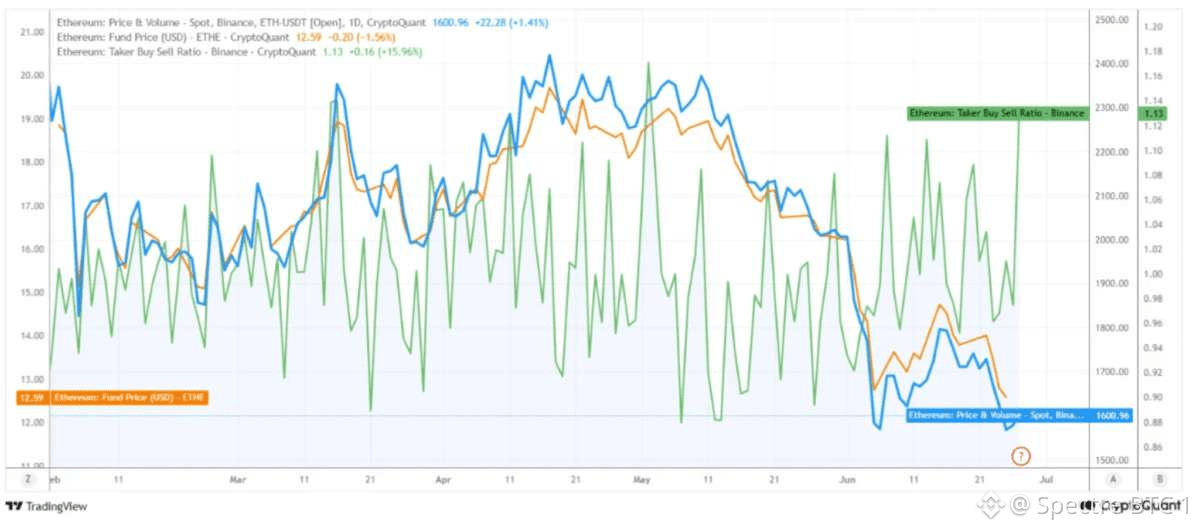
Ethereum is facing pressure from both sides. Spot $ETH ETFs just saw another $12.85M in outflows, while demand for leveraged long positions continues to fade.
Until spot inflows and derivatives sentiment improve together, bears remain in control and rallies may struggle to gain momentum.
#ETH
Ethereum is facing pressure from both sides. Spot $ETH ETFs just saw another $12.85M in outflows, while demand for leveraged long positions continues to fade.
Until spot inflows and derivatives sentiment improve together, bears remain in control and rallies may struggle to gain momentum.
#ETH
Until spot inflows and derivatives sentiment improve together, bears remain in control and rallies may struggle to gain momentum.
#ETH
83
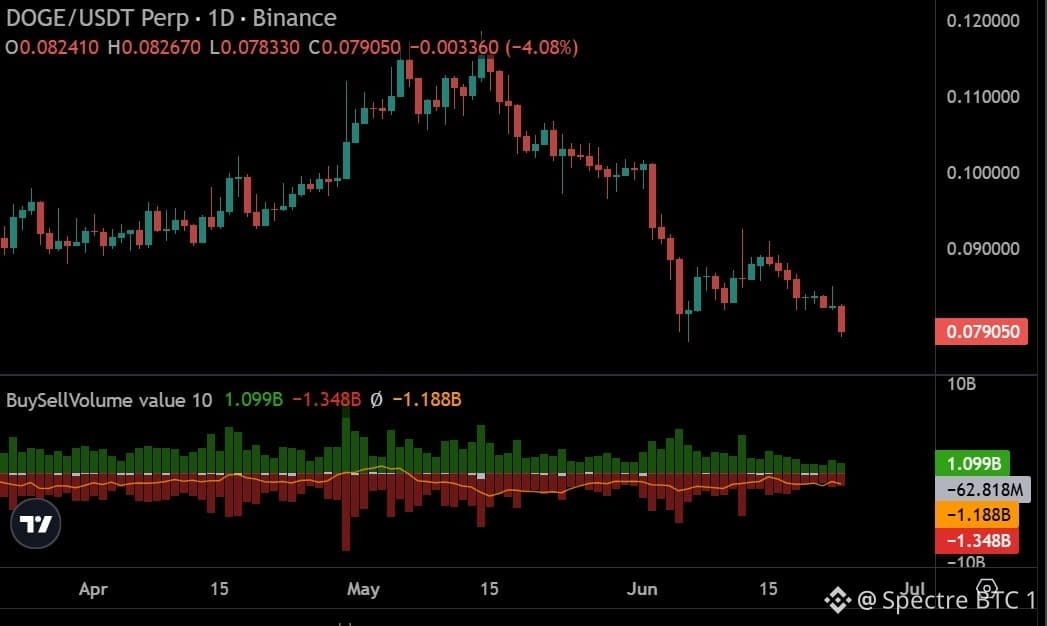
$DOGE lost the $0.08 support and sellers quickly took control.
With sell volume leading buy volume and price trading below key moving averages, bears remain in charge for now.
#DOGE
$DOGE lost the $0.08 support and sellers quickly took control.
With sell volume leading buy volume and price trading below key moving averages, bears remain in charge for now.
#DOGE
With sell volume leading buy volume and price trading below key moving averages, bears remain in charge for now.
#DOGE
62
Whales in action
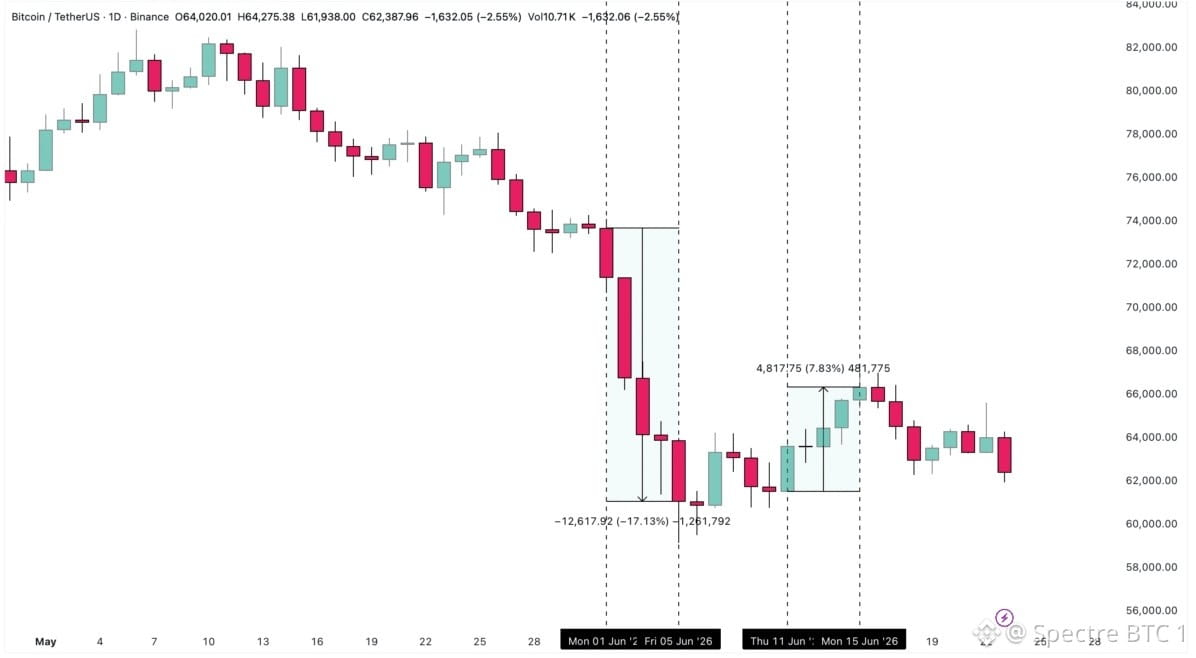
$BTC dropped 17.1% in early June, and despite a brief 7.8% recovery mid-month, it still sat over 15% below its June 1 level.
Whale activity remains dominant, and without a stronger bullish shift from them, downside pressure may continue.
#BTC Price Analysis#
Whales in action
$BTC dropped 17.1% in early June, and despite a brief 7.8% recovery mid-month, it still sat over 15% below its June 1 level.
Whale activity remains dominant, and without a stronger bullish shift from them, downside pressure may continue.
#BTC Price Analysis#
$BTC dropped 17.1% in early June, and despite a brief 7.8% recovery mid-month, it still sat over 15% below its June 1 level.
Whale activity remains dominant, and without a stronger bullish shift from them, downside pressure may continue.
#BTC Price Analysis#
86
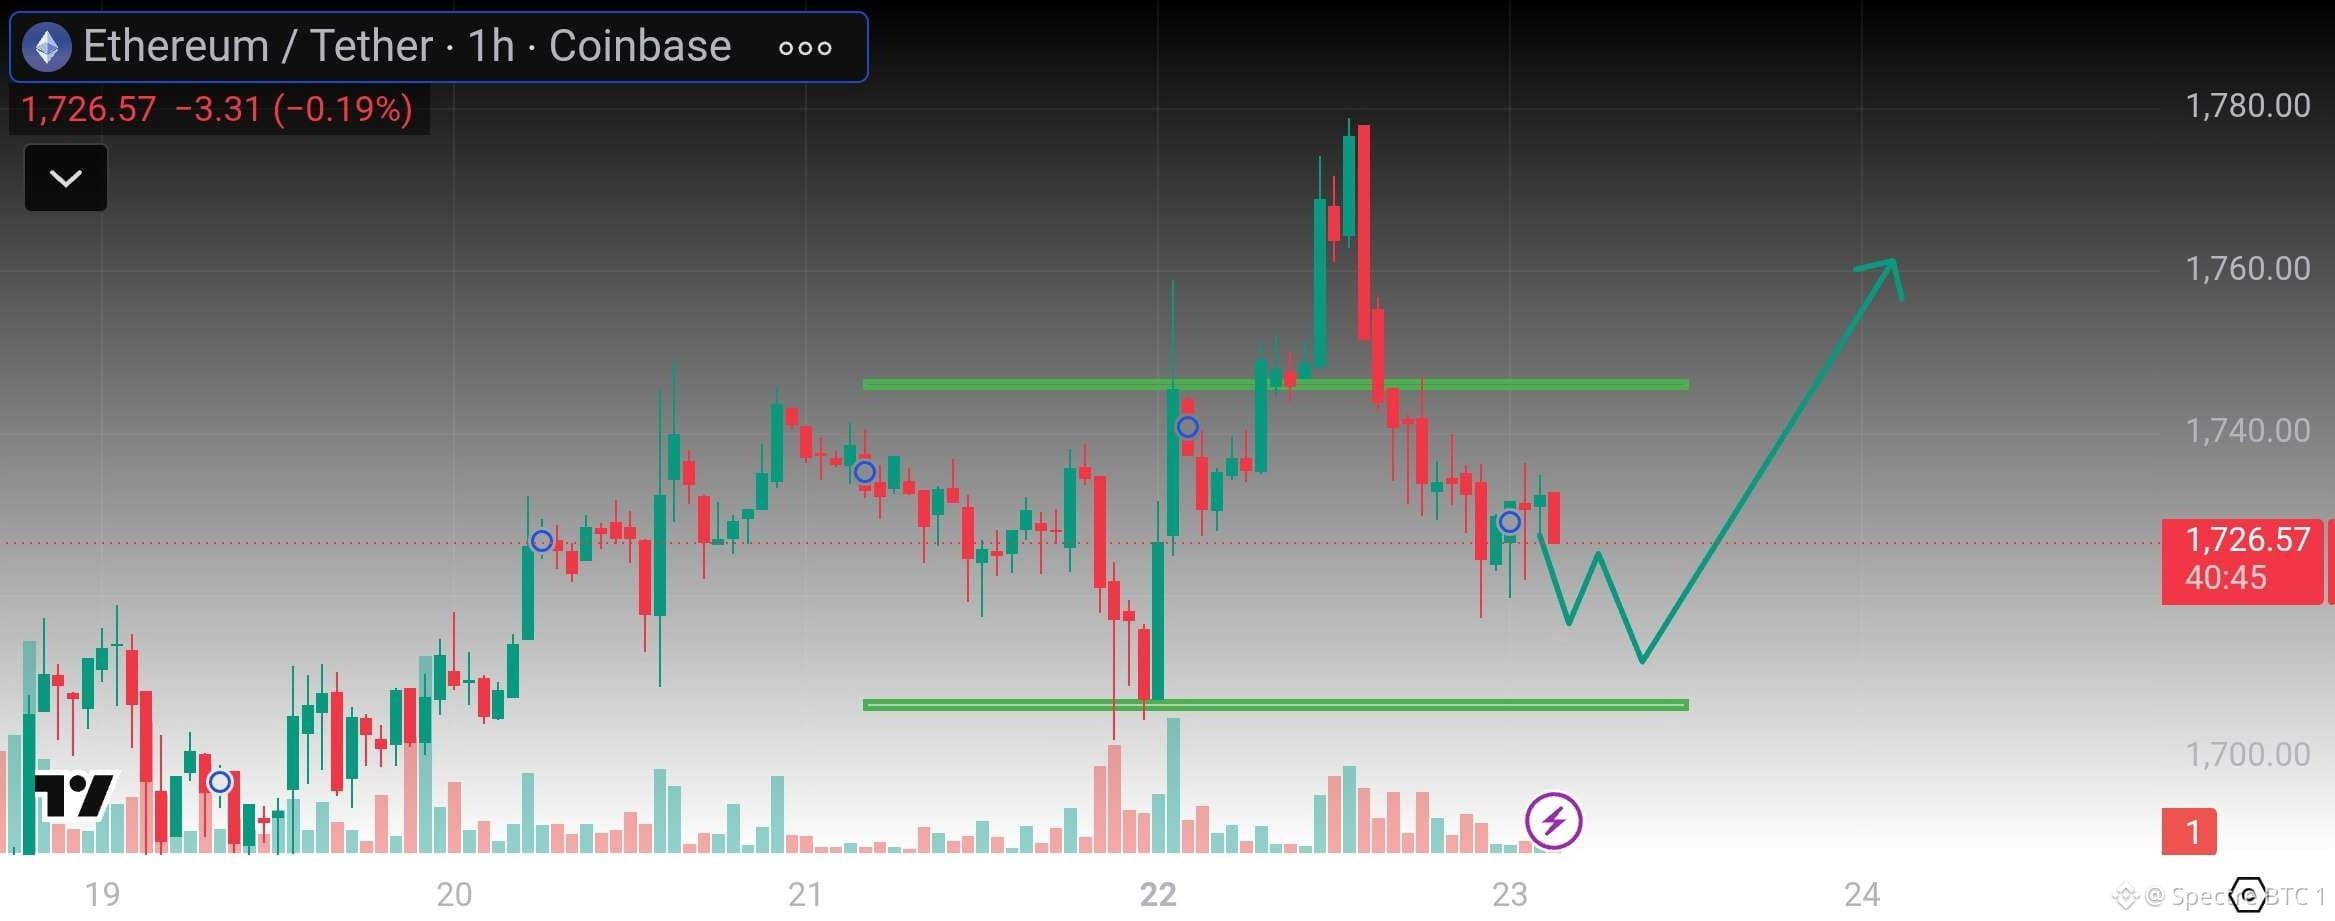
$ETH is trading inside a clear range on the 1H chart, holding above key support after a sharp pullback.
A bounce from support could send price high, and potentially higher if buyers step in. As long as support holds, the structure remain constructive.
#ETH
$ETH is trading inside a clear range on the 1H chart, holding above key support after a sharp pullback.
A bounce from support could send price high, and potentially higher if buyers step in. As long as support holds, the structure remain constructive.
#ETH
A bounce from support could send price high, and potentially higher if buyers step in. As long as support holds, the structure remain constructive.
#ETH
78
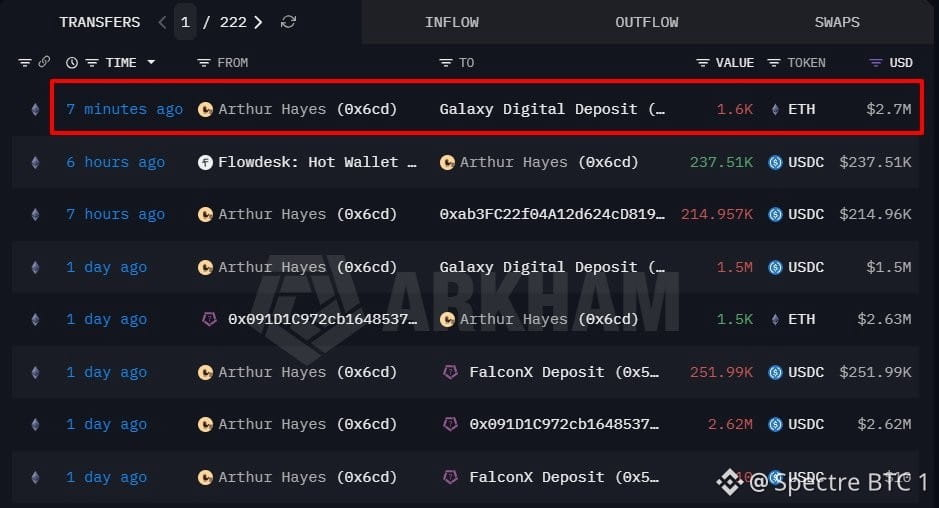
Arthur Hayes just moved 6,000 $ETH (~$10.4M) from cold storage to FalconX & Galaxy Digital.
Wallet-to-exchange transfers like this usually precede selling pressure.
$ETH exchange reserves are already up ~80k ETH since June 9, and +$2.62B since June 5.
Arthur Hayes just moved 6,000 $ETH (~$10.4M) from cold storage to FalconX & Galaxy Digital.
Wallet-to-exchange transfers like this usually precede selling pressure.
$ETH exchange reserves are already up ~80k ETH since June 9, and +$2.62B since June 5.
Wallet-to-exchange transfers like this usually precede selling pressure.
$ETH exchange reserves are already up ~80k ETH since June 9, and +$2.62B since June 5.
56
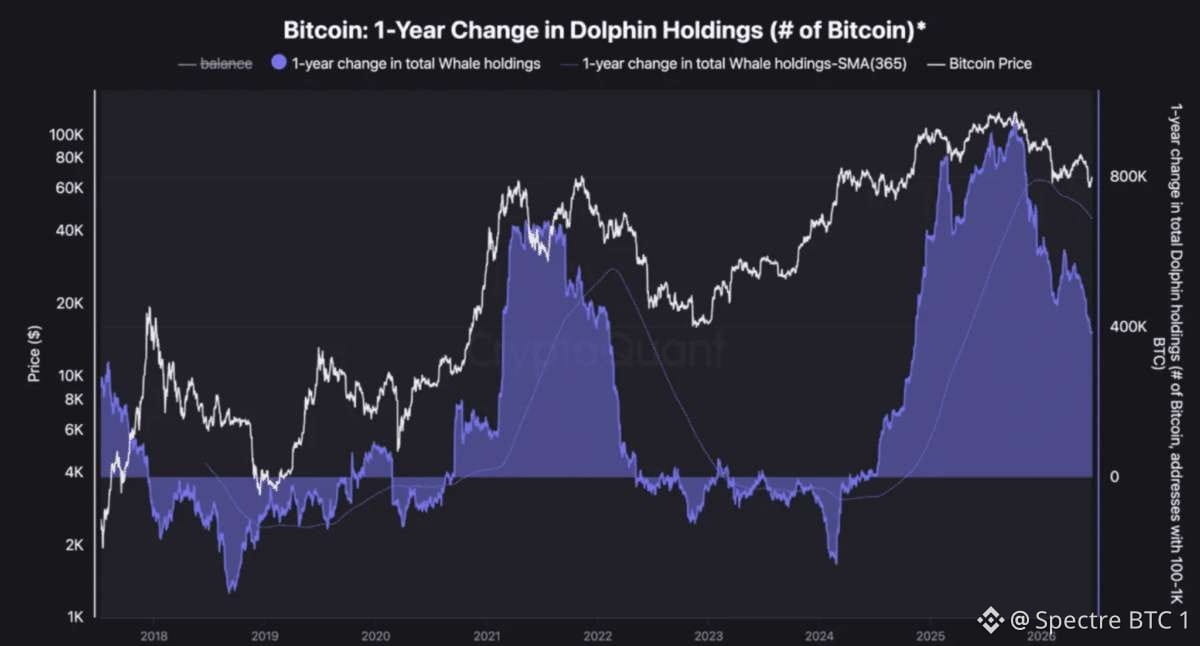
$BTC on-chain activity is climbing, but price isn't following yet. Fund premium clawed back from -6 to -0.6 still negative.
The 30D EMA keeps sliding. Dolphins (100-1k BTC) are still accumulating, but their pace is cooling fast. Adoption's up.
$BTC on-chain activity is climbing, but price isn't following yet. Fund premium clawed back from -6 to -0.6 still negative.
The 30D EMA keeps sliding. Dolphins (100-1k BTC) are still accumulating, but their pace is cooling fast. Adoption's up.
The 30D EMA keeps sliding. Dolphins (100-1k BTC) are still accumulating, but their pace is cooling fast. Adoption's up.
89
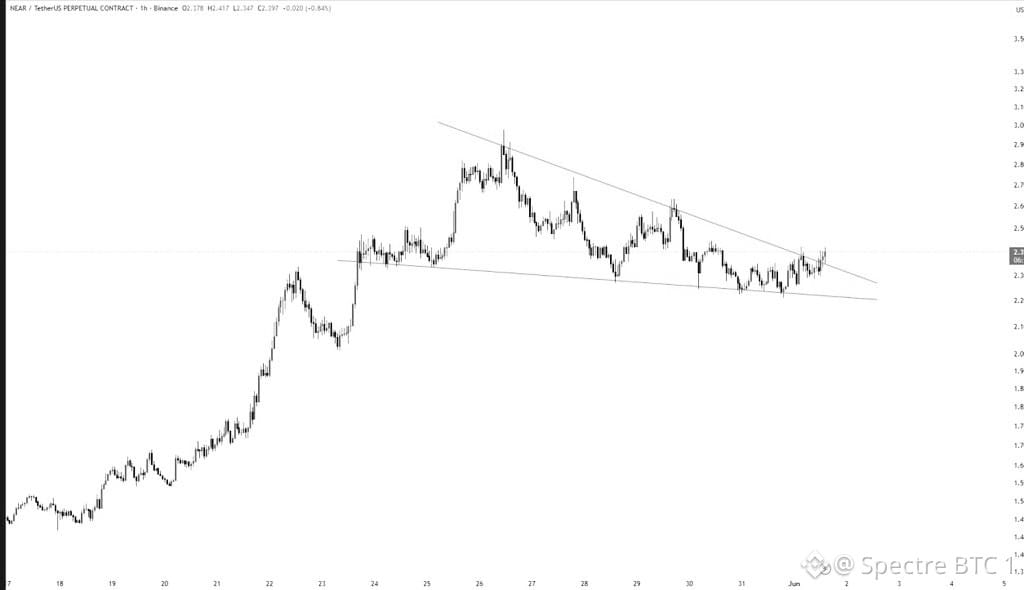
$NEAR waking up.
Order flow looks better than it has in weeks.
Seeing it pop up on my feed more.
When attention and momentum line up, I listen.
Not chasing, just watching.
#NEAR
$NEAR waking up.
Order flow looks better than it has in weeks.
Seeing it pop up on my feed more.
When attention and momentum line up, I listen.
Not chasing, just watching.
#NEAR
Order flow looks better than it has in weeks.
Seeing it pop up on my feed more.
When attention and momentum line up, I listen.
Not chasing, just watching.
#NEAR
49
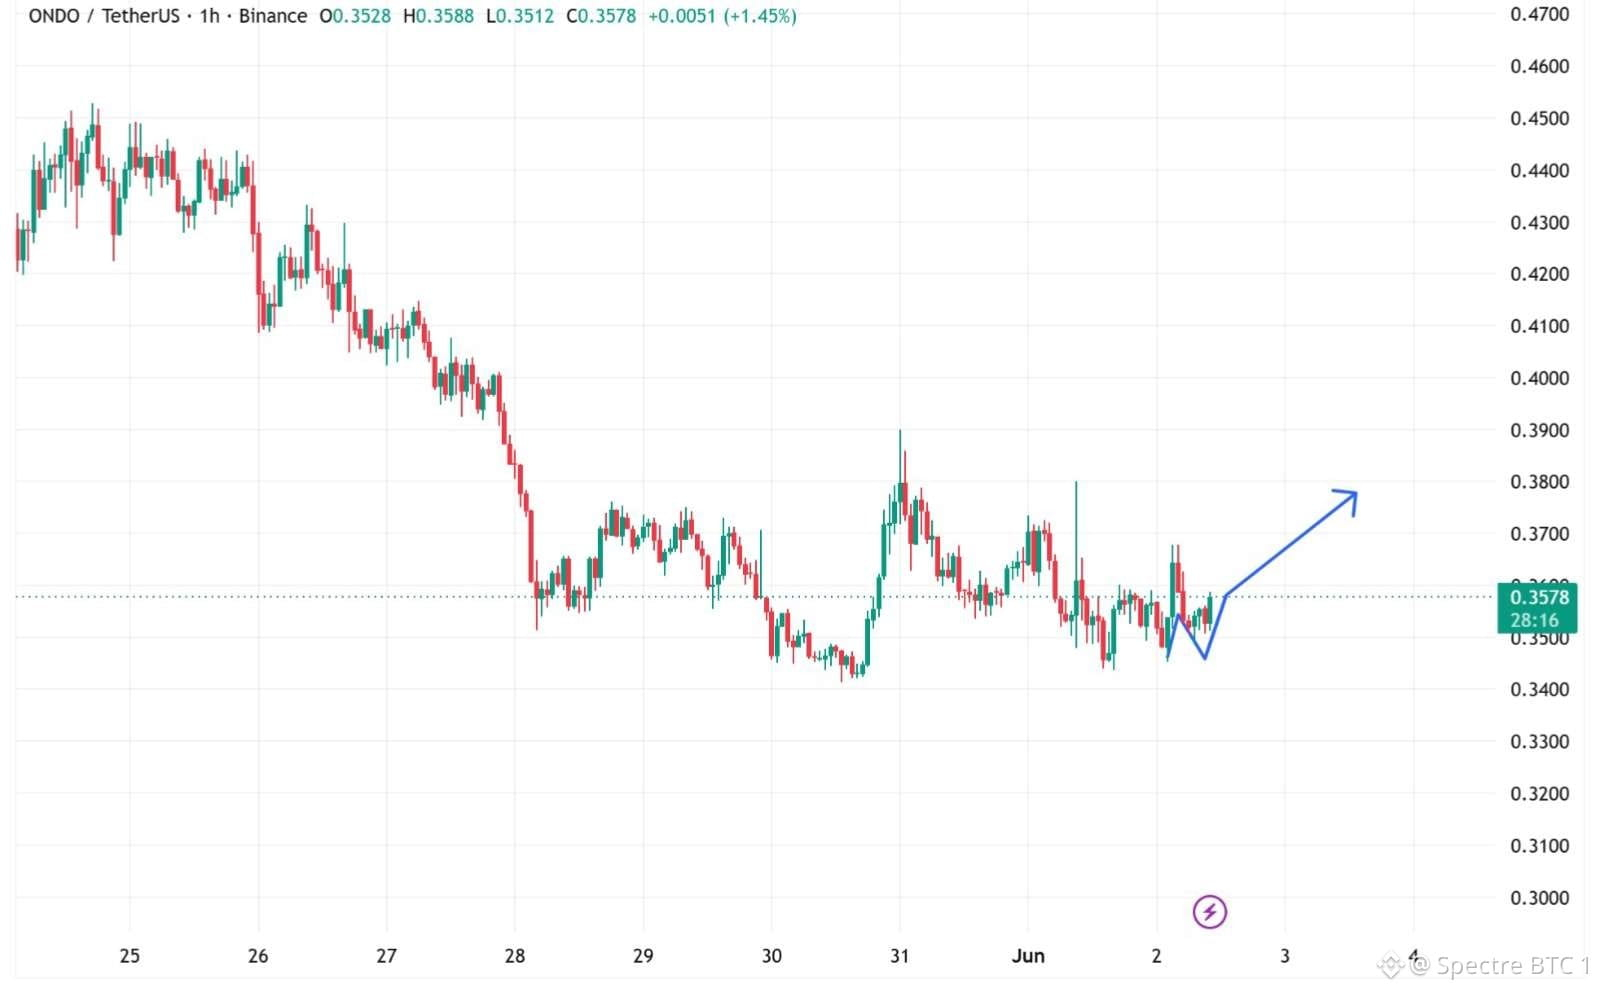
$ONDO is holding the $0.35 support zone and forming a potential double bottom on the 1H chart.
A breakout from the current range could trigger a move toward $0.38 as buyers attempt to reverse short-term momentum.
#ONDO
$ONDO is holding the $0.35 support zone and forming a potential double bottom on the 1H chart.
A breakout from the current range could trigger a move toward $0.38 as buyers attempt to reverse short-term momentum.
#ONDO
A breakout from the current range could trigger a move toward $0.38 as buyers attempt to reverse short-term momentum.
#ONDO
62
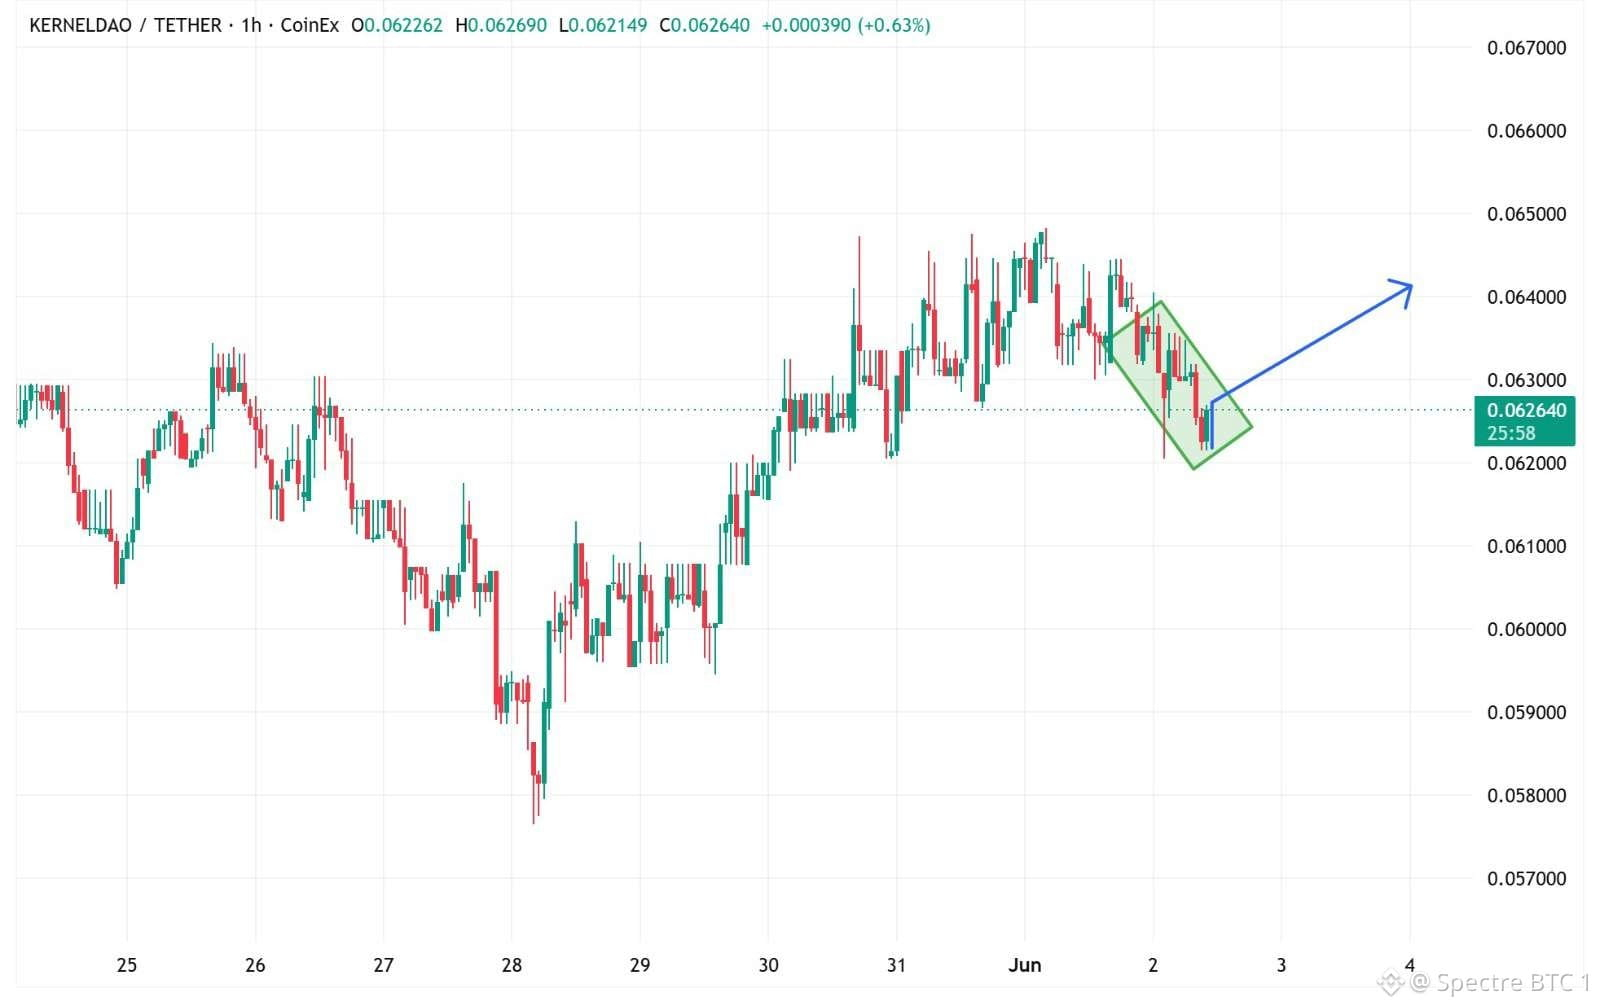
$KERNEL is bouncing from a falling wedge structure, a pattern often associated with bullish reversals.
If price breaks above local resistance, the next target sits near the $0.064-$0.065 area.
$KERNEL is bouncing from a falling wedge structure, a pattern often associated with bullish reversals.
If price breaks above local resistance, the next target sits near the $0.064-$0.065 area.
If price breaks above local resistance, the next target sits near the $0.064-$0.065 area.
63
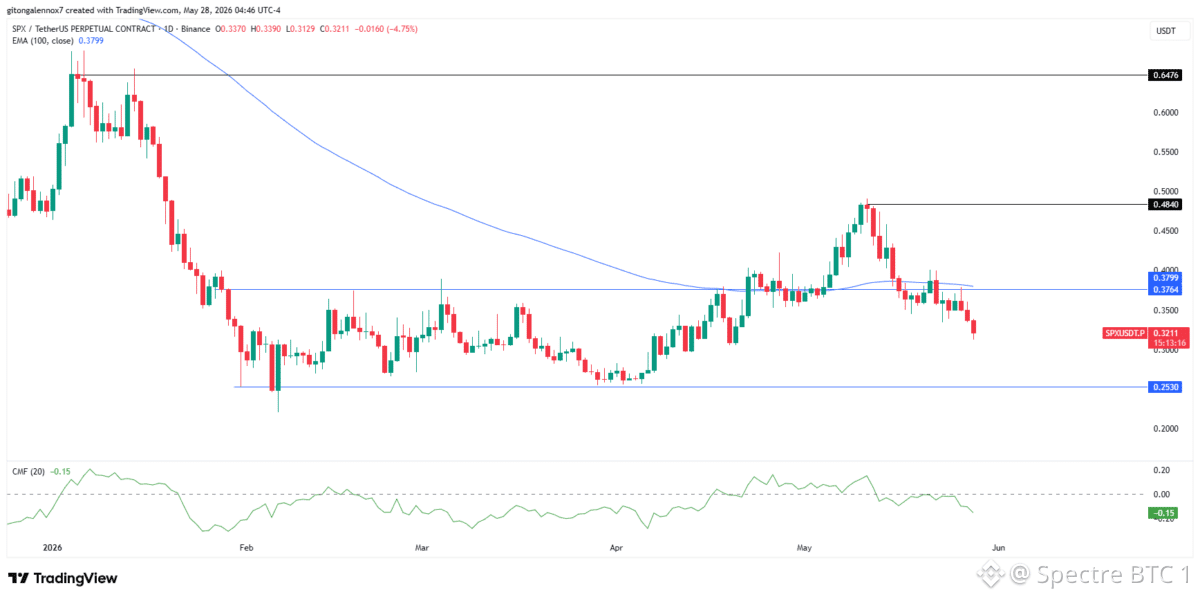
$SPX has slipped below key support at $0.3764, losing its 100-day moving average and weakening its mid-term structure.
CMF at -0.15 confirms steady selling pressure and ongoing outflows.
If broader memecoin weakness continues, price could drift toward $0.2530 support. However, reclaiming lost levels would shift sentiment quickly and reopen the early May bullish trend.
#MemeCoin
$SPX has slipped below key support at $0.3764, losing its 100-day moving average and weakening its mid-term structure.
CMF at -0.15 confirms steady selling pressure and ongoing outflows.
If broader memecoin weakness continues, price could drift toward $0.2530 support. However, reclaiming lost levels would shift sentiment quickly and reopen the early May bullish trend.
#MemeCoin
CMF at -0.15 confirms steady selling pressure and ongoing outflows.
If broader memecoin weakness continues, price could drift toward $0.2530 support. However, reclaiming lost levels would shift sentiment quickly and reopen the early May bullish trend.
#MemeCoin
33
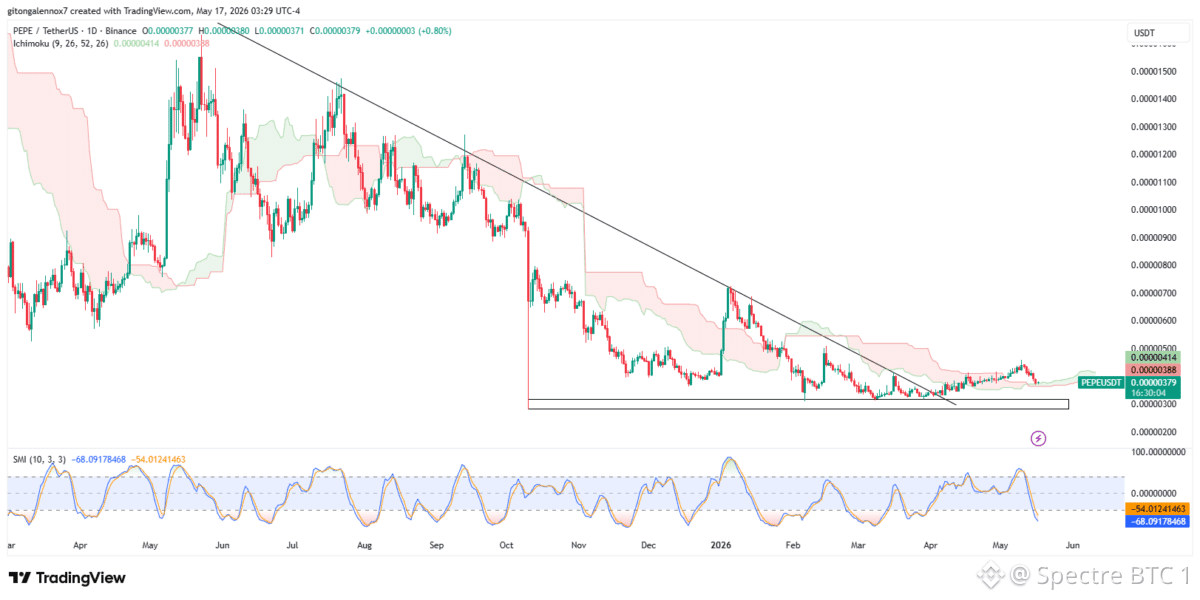
$SHIB and $PEPE are showing gradual improvement in structure and participation. SHIB holders rose slightly, while whale dominance remains high at 95% of supply.
Both memecoins have broken key descending resistance levels, with PEPE now retesting its breakout zone near $0.00000371. If momentum holds, it could stabilize, but a drop toward $0.00000300 remains possible if selling pressure continues.
$SHIB and $PEPE are showing gradual improvement in structure and participation. SHIB holders rose slightly, while whale dominance remains high at 95% of supply.
Both memecoins have broken key descending resistance levels, with PEPE now retesting its breakout zone near $0.00000371. If momentum holds, it could stabilize, but a drop toward $0.00000300 remains possible if selling pressure continues.
Both memecoins have broken key descending resistance levels, with PEPE now retesting its breakout zone near $0.00000371. If momentum holds, it could stabilize, but a drop toward $0.00000300 remains possible if selling pressure continues.
55
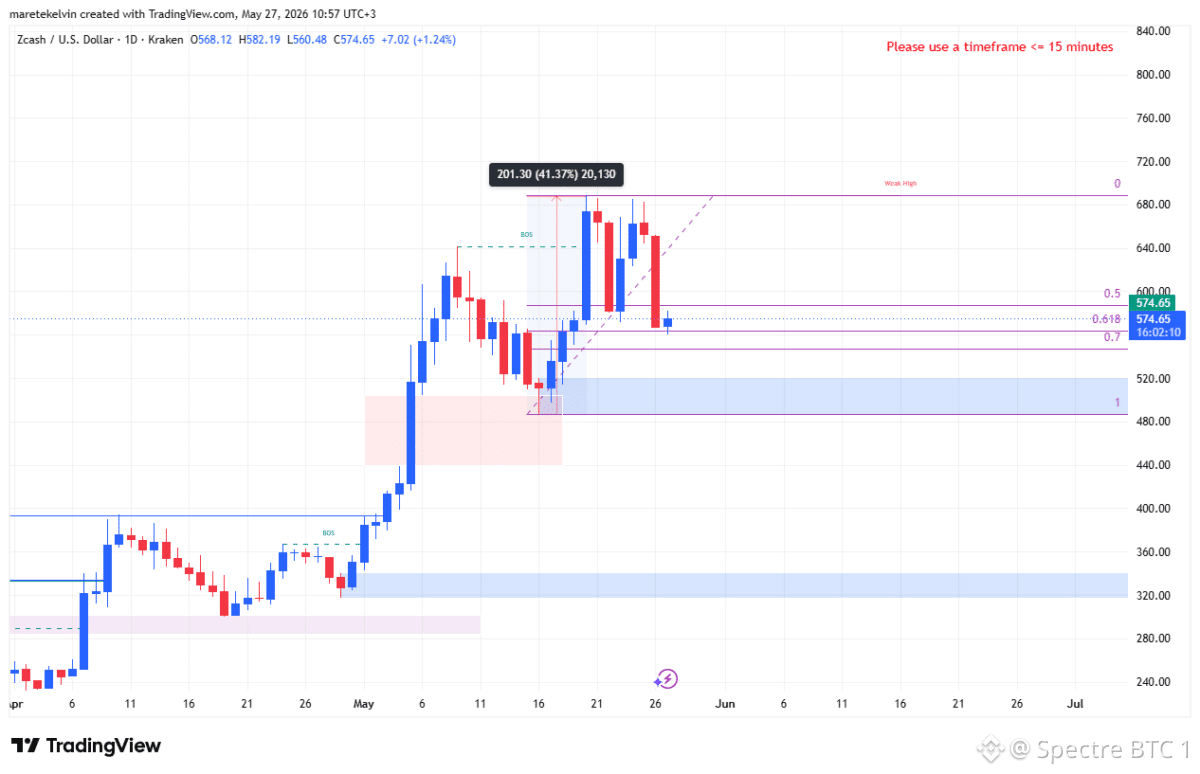
$ZEC has pulled back into the Fibonacci Golden Zone after a strong rally, a level often associated with potential reversals. The correction appears driven by profit-taking rather than a major shift in trend.
Meanwhile, Futures activity is showing signs of renewed interest. Buyers are stepping in, and Funding Rates have turned positive, reflecting growing long exposure.
The focus now is on whether buyers can defend this support area. Holding it could support a rebound, while a breakdown may trigger another liquidity sweep lower.
$ZEC has pulled back into the Fibonacci Golden Zone after a strong rally, a level often associated with potential reversals. The correction appears driven by profit-taking rather than a major shift in trend.
Meanwhile, Futures activity is showing signs of renewed interest. Buyers are stepping in, and Funding Rates have turned positive, reflecting growing long exposure.
The focus now is on whether buyers can defend this support area. Holding it could support a rebound, while a breakdown may trigger another liquidity sweep lower.
Meanwhile, Futures activity is showing signs of renewed interest. Buyers are stepping in, and Funding Rates have turned positive, reflecting growing long exposure.
The focus now is on whether buyers can defend this support area. Holding it could support a rebound, while a breakdown may trigger another liquidity sweep lower.
67
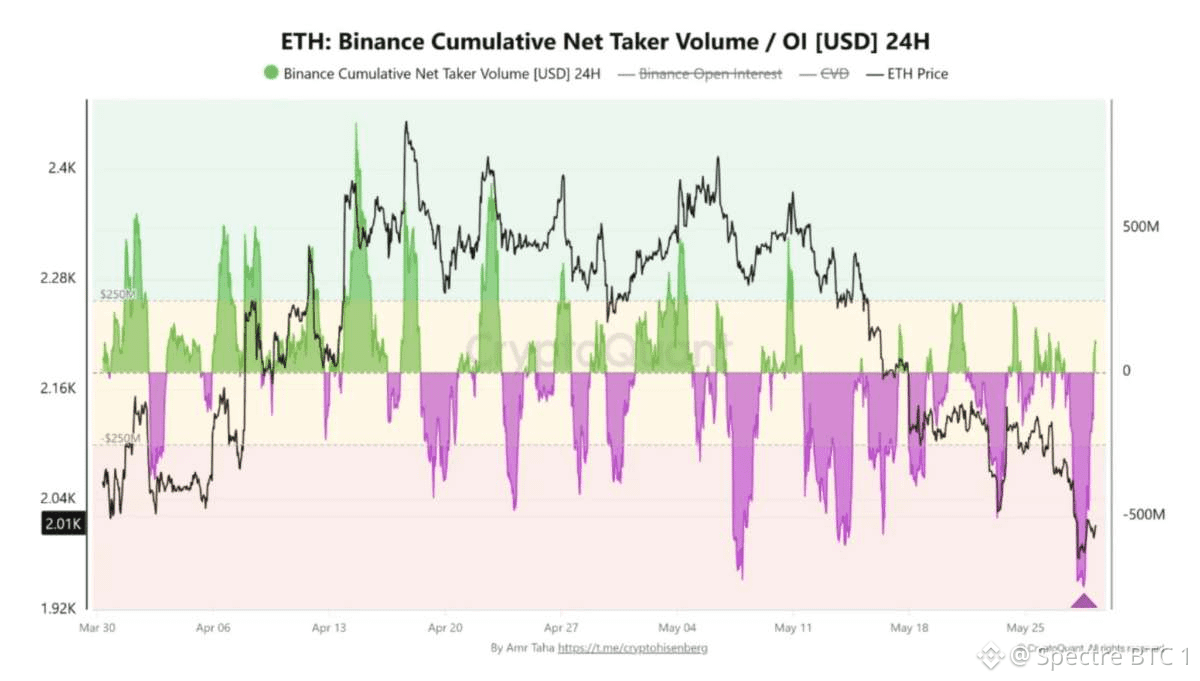
$ETH leverage is rising, but the flow behind it tells a different story.
Binance Open Interest added 336,000 $ETH, showing traders are increasing exposure. Yet Binance Cumulative Net Taker Volume just dropped to around -$744M, its weakest level since April 6.
More leverage + aggressive selling pressure is rarely a bullish combination. For now, bears still appear to have control of the market.
$ETH leverage is rising, but the flow behind it tells a different story.
Binance Open Interest added 336,000 $ETH, showing traders are increasing exposure. Yet Binance Cumulative Net Taker Volume just dropped to around -$744M, its weakest level since April 6.
More leverage + aggressive selling pressure is rarely a bullish combination. For now, bears still appear to have control of the market.
Binance Open Interest added 336,000 $ETH, showing traders are increasing exposure. Yet Binance Cumulative Net Taker Volume just dropped to around -$744M, its weakest level since April 6.
More leverage + aggressive selling pressure is rarely a bullish combination. For now, bears still appear to have control of the market.
59
Log in to explore more content
Join global crypto users on Binance Square
⚡️ Get latest and useful information about crypto.
💬 Trusted by the world’s largest crypto exchange.
👍 Discover real insights from verified creators.
Email / Phone number
Trending Topics
BOJRaisesRatesTo31YearHigh
72,770 views
1,177 Discussing
#bojraisesratesto31yearhigh
🌏 BOJ JUST SHOCKED MARKETS: RATES HIT A 31-YEAR HIGH 🌏
For decades, Japan was the land of cheap money.
Now the tide is turning, and global capital is listening.
The Bank of Japan raised its policy rate from 1% to 1.25%, the highest level since 1995. The 7-2 decision reflects growing concern that inflation could move above the BOJ’s 2% target.
The bigger story is not the 25-basis-point hike itself. Japan is moving further away from the ultra-low-rate environment that made the yen a major global funding currency.
My Take: This matters beyond Japan. Higher Japanese yields can gradually change where capital seeks returns, potentially affecting global bonds, currencies, equities and risk assets, including crypto.
Yet the immediate reaction was unusual. Instead of strengthening, the yen weakened after the decision, partly because two policymakers opposed the hike and markets saw the move as less aggressive than some had expected.
That distinction matters. A rate hike does not automatically mean tighter financial conditions everywhere overnight. The pace of future increases, inflation, oil prices and the yen’s response may matter more than this single decision.
The era of effortless cheap money is slowly becoming a different story.
❓Could Japan’s tightening cycle become an overlooked driver of global crypto liquidity?
Disclaimer: This is market analysis, not financial advice.
#BOJ #CryptoMarket #GrowWithSAC $AR $G $STRK
#BOJRaisesRatesTo31YearHigh
SAC-King-你真棒-带我走
·4 Likes
·3k views
BuffettStepsDownAsBerkshireChairman
32,494 views
553 Discussing
XRPExchangeReservesHitSevenYearLow
37,886 views
518 Discussing