

丽盈聊币
1k Posts

丽盈聊币
Report
Block User
全职交易员,交易到最后都是回归生活,感谢关注,公众号:丽盈88 从事金融十几年目前稳定增值6年,每日分享盘面日记,记录实时数据
31 Following
1.0K+ Followers
2.3K+ Liked
Posts
All
Quotes
Videos
PINNED
·
--
You can chat with me directly by DM on Binance ✨
In the search bar, type “Chat Room”
Tap the plus icon in the top-right corner, then choose Add Contact
Search ID: 958413716
Send a friend request and you can add me to chat
You can chat with me directly by DM on Binance ✨
In the search bar, type “Chat Room”
Tap the plus icon in the top-right corner, then choose Add Contact
Search ID: 958413716
Send a friend request and you can add me to chat
In the search bar, type “Chat Room”
Tap the plus icon in the top-right corner, then choose Add Contact
Search ID: 958413716
Send a friend request and you can add me to chat
8
255
·
--
Bullish
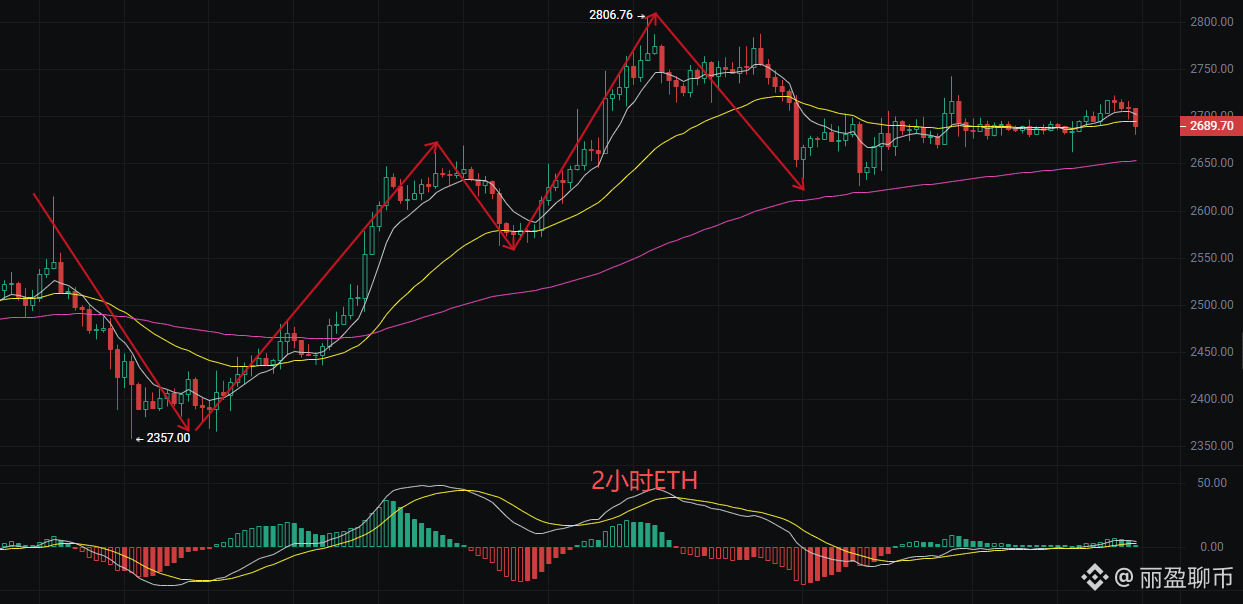
$ETH brothers, Ethereum is currently at 2691. To put it simply, it’s gone up a lot and needs a breather. After rallying from 2357 to 2806, it pulled back and then went sideways—like climbing a mountain and getting tired, so you find a landing spot to catch your breath. In the short term, it’s oscillating between 2650-2750. The bigger trend is still in the bulls’ hands, so don’t rush to chase or panic-sell; patience and waiting for the direction to become clear is the way to go.
Technically, the EMA moving averages are sticking together in the short term, and the MACD green histogram shrinking suggests a turning point is near. The Bollinger Bands have tightened to the extreme; price is sticking close to the midline, and it’s about to choose a direction. The KDJ is hovering in the middle—overall, it’s just waiting for the breakout.
Trading suggestions:
For long positions, enter in batches at 2670-2680, set stop-loss at 2640, and target 2720-2750.
For short positions, wait for a rebound to 2720-2730 where it meets resistance, then consider selling short, set stop-loss at 2760, and target 2680.
Right now, it’s suitable for selling the highs and buying the dips. Break above 2750 to go long; if it breaks below 2650, flip to a short—trade with the trend!
{future}(ETHUSDT)
#ETH走势分析 #ETH🔥🔥🔥🔥🔥🔥
$ETH brothers, Ethereum is currently at 2691. To put it simply, it’s gone up a lot and needs a breather. After rallying from 2357 to 2806, it pulled back and then went sideways—like climbing a mountain and getting tired, so you find a landing spot to catch your breath. In the short term, it’s oscillating between 2650-2750. The bigger trend is still in the bulls’ hands, so don’t rush to chase or panic-sell; patience and waiting for the direction to become clear is the way to go.
Technically, the EMA moving averages are sticking together in the short term, and the MACD green histogram shrinking suggests a turning point is near. The Bollinger Bands have tightened to the extreme; price is sticking close to the midline, and it’s about to choose a direction. The KDJ is hovering in the middle—overall, it’s just waiting for the breakout.
Trading suggestions:
For long positions, enter in batches at 2670-2680, set stop-loss at 2640, and target 2720-2750.
For short positions, wait for a rebound to 2720-2730 where it meets resistance, then consider selling short, set stop-loss at 2760, and target 2680.
Right now, it’s suitable for selling the highs and buying the dips. Break above 2750 to go long; if it breaks below 2650, flip to a short—trade with the trend!
#ETH走势分析 #ETH🔥🔥🔥🔥🔥🔥
Technically, the EMA moving averages are sticking together in the short term, and the MACD green histogram shrinking suggests a turning point is near. The Bollinger Bands have tightened to the extreme; price is sticking close to the midline, and it’s about to choose a direction. The KDJ is hovering in the middle—overall, it’s just waiting for the breakout.
Trading suggestions:
For long positions, enter in batches at 2670-2680, set stop-loss at 2640, and target 2720-2750.
For short positions, wait for a rebound to 2720-2730 where it meets resistance, then consider selling short, set stop-loss at 2760, and target 2680.
Right now, it’s suitable for selling the highs and buying the dips. Break above 2750 to go long; if it breaks below 2650, flip to a short—trade with the trend!
#ETH走势分析 #ETH🔥🔥🔥🔥🔥🔥
1
5
1k
·
--
Bullish
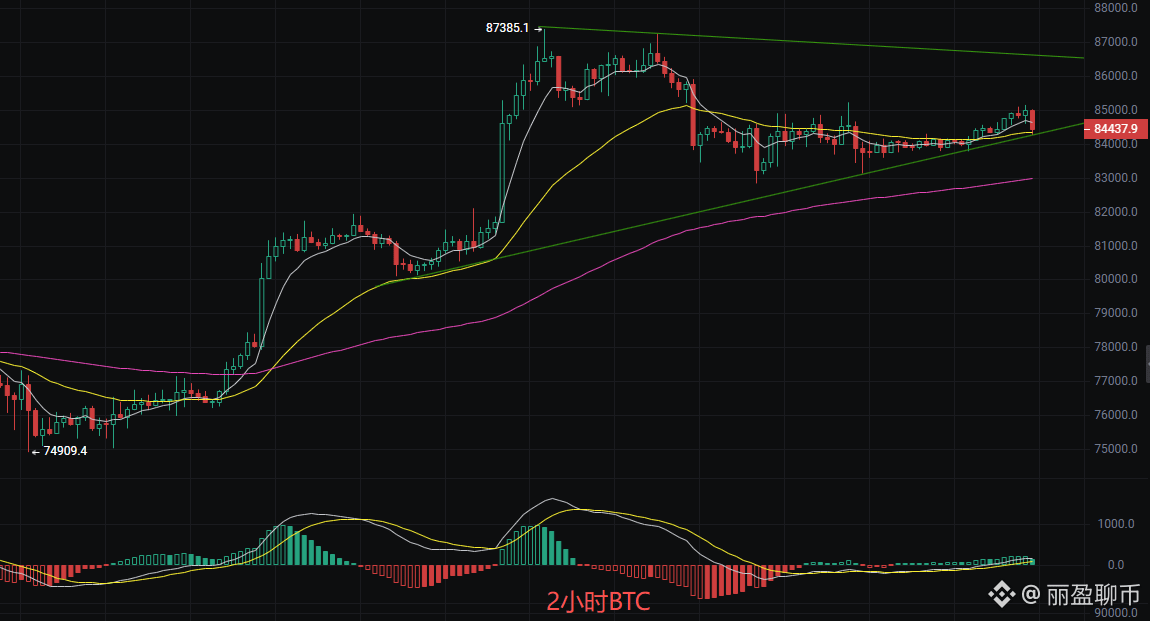
$BTC Bitcoin current price 84540, don’t be scared off by the sideways trading of the past two days! This is a typical uptrend continuation. The main players are washing the market and building momentum so it can surge higher later.
As long as it doesn’t break the key level, the big direction remains bullish.
Technical analysis:
The EMA moving averages are perfectly aligned to the upside, and the price is holding steadily above the Bollinger midline at 84297. The MACD is in a pullback but hasn’t fallen below the zero line—this is a strong corrective phase. The “fueling in the air” pattern is clearly visible.
Strategy:
Go long mainly on pullbacks in the direction of the trend!
Entry: Go long in the 83800–84100 range
Stop loss: Exit if it breaks below 83200
Targets: First look at 86500; if it breaks through, then 87500
Hold your positions firmly—don’t get off the train too easily. Wait for the wind to come! If you need real-time trading signals, message me.
{future}(BTCUSDT)
#BTC走势分析 #BTC突破7万大关
$BTC Bitcoin current price 84540, don’t be scared off by the sideways trading of the past two days! This is a typical uptrend continuation. The main players are washing the market and building momentum so it can surge higher later.
As long as it doesn’t break the key level, the big direction remains bullish.
Technical analysis:
The EMA moving averages are perfectly aligned to the upside, and the price is holding steadily above the Bollinger midline at 84297. The MACD is in a pullback but hasn’t fallen below the zero line—this is a strong corrective phase. The “fueling in the air” pattern is clearly visible.
Strategy:
Go long mainly on pullbacks in the direction of the trend!
Entry: Go long in the 83800–84100 range
Stop loss: Exit if it breaks below 83200
Targets: First look at 86500; if it breaks through, then 87500
Hold your positions firmly—don’t get off the train too easily. Wait for the wind to come! If you need real-time trading signals, message me.
#BTC走势分析 #BTC突破7万大关
As long as it doesn’t break the key level, the big direction remains bullish.
Technical analysis:
The EMA moving averages are perfectly aligned to the upside, and the price is holding steadily above the Bollinger midline at 84297. The MACD is in a pullback but hasn’t fallen below the zero line—this is a strong corrective phase. The “fueling in the air” pattern is clearly visible.
Strategy:
Go long mainly on pullbacks in the direction of the trend!
Entry: Go long in the 83800–84100 range
Stop loss: Exit if it breaks below 83200
Targets: First look at 86500; if it breaks through, then 87500
Hold your positions firmly—don’t get off the train too easily. Wait for the wind to come! If you need real-time trading signals, message me.
#BTC走势分析 #BTC突破7万大关
8
1.5k
·
--
Bullish
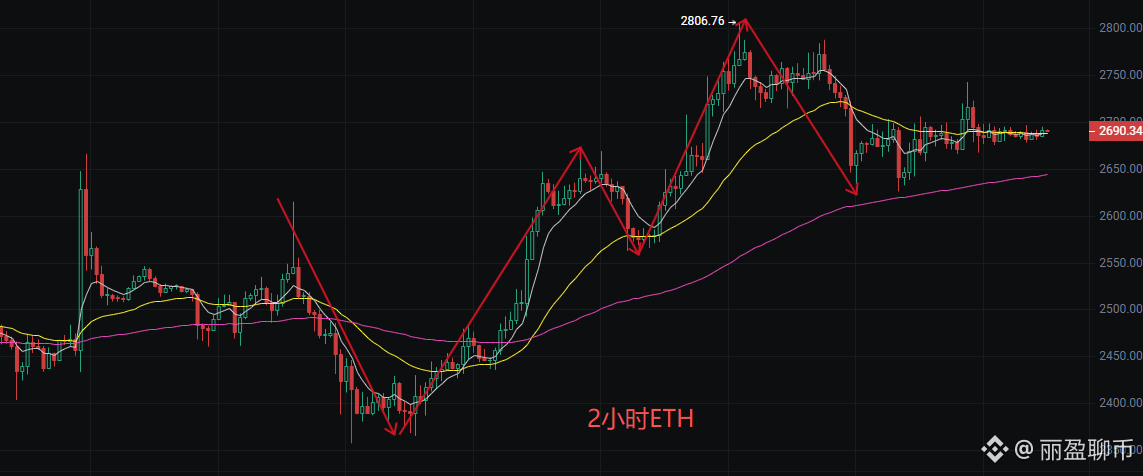
$ETH Ethereum is stuck at 2690; the moving averages are sticking and clumping like a twisted spiral. The MACD green histogram bars are shrinking but there’s no golden cross yet. The Bollinger Bands are tightening so narrow it’s suffocating—this is a pre-breakout signal! Don’t rush to jump in; wait until the direction becomes clear before acting.
Conservative traders: wait and observe.
Aggressive traders: you may try range trading.
A breakout above 2706: go long with a light position; stop loss at 2680.
A breakdown below 2669: go short with a light position; stop loss at 2695.
Keep position size within 5%. Better to miss than to make a wrong move.
Protect your principal—this is the way to go long-term.
{future}(ETHUSDT)
#ETH走势分析 #ETH contract
$ETH Ethereum is stuck at 2690; the moving averages are sticking and clumping like a twisted spiral. The MACD green histogram bars are shrinking but there’s no golden cross yet. The Bollinger Bands are tightening so narrow it’s suffocating—this is a pre-breakout signal! Don’t rush to jump in; wait until the direction becomes clear before acting.
Conservative traders: wait and observe.
Aggressive traders: you may try range trading.
A breakout above 2706: go long with a light position; stop loss at 2680.
A breakdown below 2669: go short with a light position; stop loss at 2695.
Keep position size within 5%. Better to miss than to make a wrong move.
Protect your principal—this is the way to go long-term.
#ETH走势分析 #ETH contract
Conservative traders: wait and observe.
Aggressive traders: you may try range trading.
A breakout above 2706: go long with a light position; stop loss at 2680.
A breakdown below 2669: go short with a light position; stop loss at 2695.
Keep position size within 5%. Better to miss than to make a wrong move.
Protect your principal—this is the way to go long-term.
#ETH走势分析 #ETH contract
5
560
·
--
Bullish
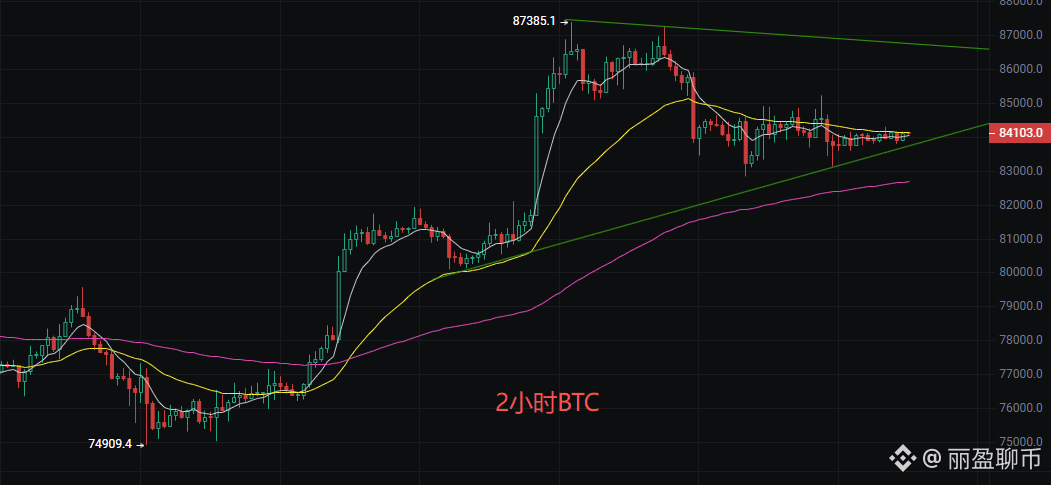
$BTC BTC current price 84000. After spiking to 87385, it entered a high-level sideways consolidation. Many friends get repeatedly stopped out due to the back-and-forth moves.
A consolidation after a big rally is essentially long and short funds rotating and swapping positions. False breakouts are frequent, so don’t open positions blindly in the middle range.
2-hour chart
EMA short-term moving averages are sticking together, with long and short power fairly balanced.
MACD red histogram is shrinking, and bullish momentum is weakening.
The Bollinger Bands are tightening, locking the range at 83617-84454; volatility is about to expand.
Trading plan:
When price pulls back and stabilizes near 83600, go long. Stop loss: 83400. Target: 84450. If it breaks, watch the previous high.
If it rebounds and meets resistance near 84450, consider shorting. Stop loss: 84750. Target: 83600. If it breaks, watch 82700.
Current price is in the middle of the consolidation range, and the risk-reward ratio is not favorable. Be patient and wait for boundary signals. Manage position size carefully and place stop losses.
{future}(BTCUSDT)
#BTC走势分析 #BTC contract
$BTC BTC current price 84000. After spiking to 87385, it entered a high-level sideways consolidation. Many friends get repeatedly stopped out due to the back-and-forth moves.
A consolidation after a big rally is essentially long and short funds rotating and swapping positions. False breakouts are frequent, so don’t open positions blindly in the middle range.
2-hour chart
EMA short-term moving averages are sticking together, with long and short power fairly balanced.
MACD red histogram is shrinking, and bullish momentum is weakening.
The Bollinger Bands are tightening, locking the range at 83617-84454; volatility is about to expand.
Trading plan:
When price pulls back and stabilizes near 83600, go long. Stop loss: 83400. Target: 84450. If it breaks, watch the previous high.
If it rebounds and meets resistance near 84450, consider shorting. Stop loss: 84750. Target: 83600. If it breaks, watch 82700.
Current price is in the middle of the consolidation range, and the risk-reward ratio is not favorable. Be patient and wait for boundary signals. Manage position size carefully and place stop losses.
#BTC走势分析 #BTC contract
A consolidation after a big rally is essentially long and short funds rotating and swapping positions. False breakouts are frequent, so don’t open positions blindly in the middle range.
2-hour chart
EMA short-term moving averages are sticking together, with long and short power fairly balanced.
MACD red histogram is shrinking, and bullish momentum is weakening.
The Bollinger Bands are tightening, locking the range at 83617-84454; volatility is about to expand.
Trading plan:
When price pulls back and stabilizes near 83600, go long. Stop loss: 83400. Target: 84450. If it breaks, watch the previous high.
If it rebounds and meets resistance near 84450, consider shorting. Stop loss: 84750. Target: 83600. If it breaks, watch 82700.
Current price is in the middle of the consolidation range, and the risk-reward ratio is not favorable. Be patient and wait for boundary signals. Manage position size carefully and place stop losses.
#BTC走势分析 #BTC contract
5
380
·
--
Bullish
$BTC Liying Talks About Coins: Latest Market Analysis of Bitcoin (BTC) and Ethereum (ETH) on 9.26
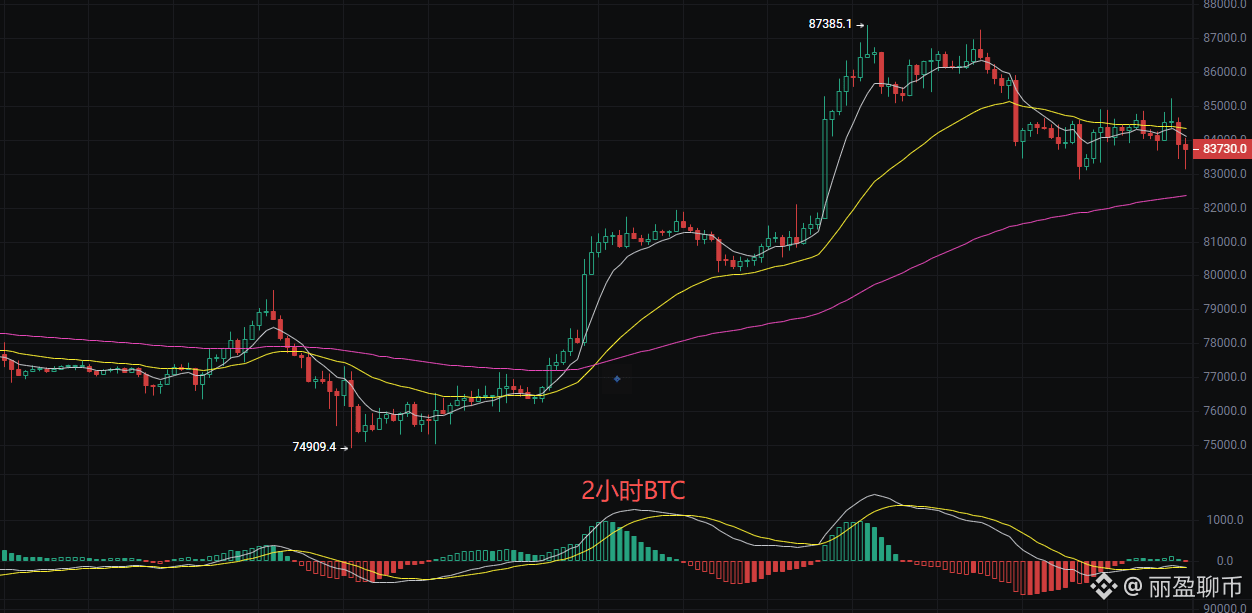
Family members! Bitcoin’s current price is 83,730. Those moving averages—while the short-term moving averages show a slight downward turn—still have the long-term moving averages holding steady below, which suggests the main trend hasn’t turned bad. It only means the short-term rise is running out of steam and needs a breather. In the EMA moving averages, the long-to-medium term bullish trend remains unchanged. The MACD indicator’s DIF and DEA both move downward, showing that bearish momentum is strengthening and the correction isn’t finished yet. The price has broken below the mid-band at 84,123 and is probing support at the lower band. The band opening shows signs of contracting, which indicates volatility is decreasing and the market is entering a period of sideways consolidation. In the short term, it will most likely continue to swing and fight within the 83,000–85,000 range.
Short-term reference:
Buy at 83,000 (or “do-duo”), defend at 82,500, stop loss 400 points, aiming for 84,000 with a target around 84,500.
Sell at 84,500 (or “do-kong”), defend at 85,000, stop loss 400 points, aiming for 83,500 with a target around 83,000.
Ethereum
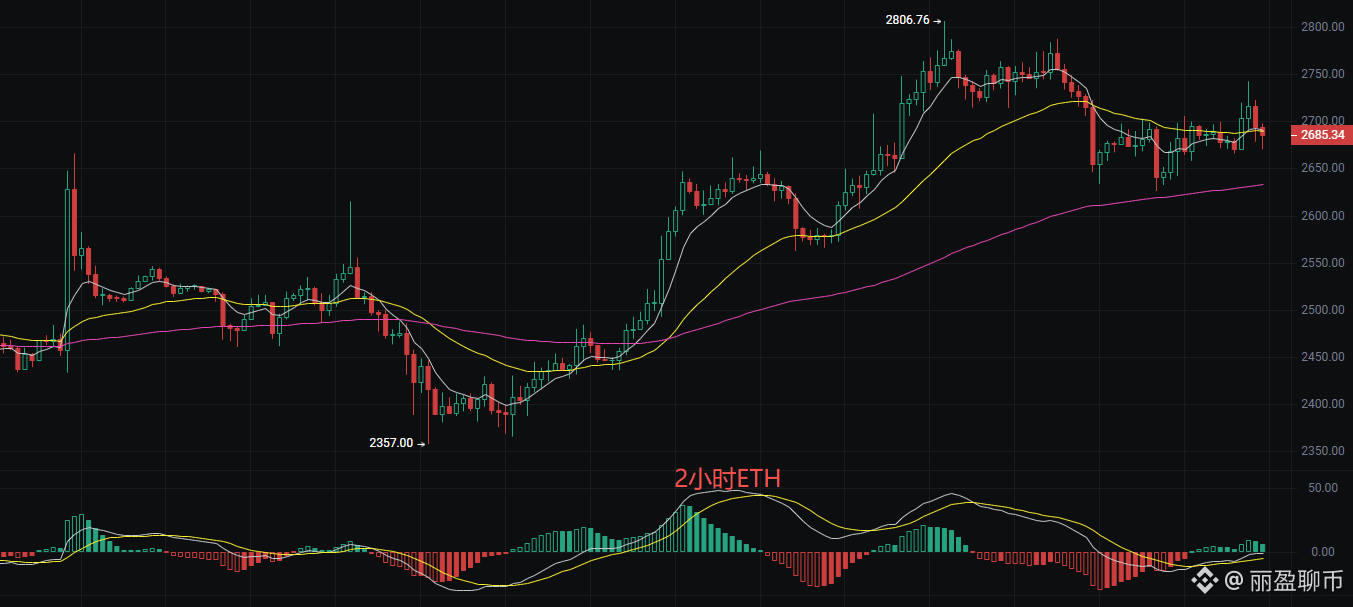
Family members! Ethereum’s current price is 2,685. This is a typical uptrend continuation or top-range consolidation. The direction hasn’t been chosen completely yet, but the big-picture trend hasn’t turned bad. The EMA moving average at 2,690 is a key level; if it breaks, the price may test the strong support at 2,633. The bearish power on the MACD hasn’t fully been released, so there is still downward adjustment pressure in the short term. Regarding the Bollinger Bands, the price has already broken below the mid-band at 2,680 and is testing how strong the lower-band support at 2,647 is. The band opening has started to tighten and a breakout is likely approaching. Overall, the indicators lean toward range-bound and slightly weak conditions. We need to wait for the MACD to form a golden cross again, or for the price to hold above the mid-band, to confirm that the bullish move is back.
Short-term price level reference
Buy at 2,660 (or “do-duo”), defend at 2,630, stop loss 40 points, target 2,720 aiming for 2,760.
Sell at 2,740 (or “do-kong”), defend at 2,750, stop loss 40 points, target 2,700 aiming for 2,650.
The above content is an exclusive original by Liying. If you repost, please注明出处. The article release may be subject to review delays. Market conditions change rapidly; the above suggestions are for reference only—risk is your own responsibility.
{future}(BTCUSDT)
$ETH
{future}(ETHUSDT)
#ETH走势分析 #BTC走势分析
$BTC Liying Talks About Coins: Latest Market Analysis of Bitcoin (BTC) and Ethereum (ETH) on 9.26
Family members! Bitcoin’s current price is 83,730. Those moving averages—while the short-term moving averages show a slight downward turn—still have the long-term moving averages holding steady below, which suggests the main trend hasn’t turned bad. It only means the short-term rise is running out of steam and needs a breather. In the EMA moving averages, the long-to-medium term bullish trend remains unchanged. The MACD indicator’s DIF and DEA both move downward, showing that bearish momentum is strengthening and the correction isn’t finished yet. The price has broken below the mid-band at 84,123 and is probing support at the lower band. The band opening shows signs of contracting, which indicates volatility is decreasing and the market is entering a period of sideways consolidation. In the short term, it will most likely continue to swing and fight within the 83,000–85,000 range.
Short-term reference:
Buy at 83,000 (or “do-duo”), defend at 82,500, stop loss 400 points, aiming for 84,000 with a target around 84,500.
Sell at 84,500 (or “do-kong”), defend at 85,000, stop loss 400 points, aiming for 83,500 with a target around 83,000.
Ethereum
Family members! Ethereum’s current price is 2,685. This is a typical uptrend continuation or top-range consolidation. The direction hasn’t been chosen completely yet, but the big-picture trend hasn’t turned bad. The EMA moving average at 2,690 is a key level; if it breaks, the price may test the strong support at 2,633. The bearish power on the MACD hasn’t fully been released, so there is still downward adjustment pressure in the short term. Regarding the Bollinger Bands, the price has already broken below the mid-band at 2,680 and is testing how strong the lower-band support at 2,647 is. The band opening has started to tighten and a breakout is likely approaching. Overall, the indicators lean toward range-bound and slightly weak conditions. We need to wait for the MACD to form a golden cross again, or for the price to hold above the mid-band, to confirm that the bullish move is back.
Short-term price level reference
Buy at 2,660 (or “do-duo”), defend at 2,630, stop loss 40 points, target 2,720 aiming for 2,760.
Sell at 2,740 (or “do-kong”), defend at 2,750, stop loss 40 points, target 2,700 aiming for 2,650.
The above content is an exclusive original by Liying. If you repost, please注明出处. The article release may be subject to review delays. Market conditions change rapidly; the above suggestions are for reference only—risk is your own responsibility.
$ETH
#ETH走势分析 #BTC走势分析
Family members! Bitcoin’s current price is 83,730. Those moving averages—while the short-term moving averages show a slight downward turn—still have the long-term moving averages holding steady below, which suggests the main trend hasn’t turned bad. It only means the short-term rise is running out of steam and needs a breather. In the EMA moving averages, the long-to-medium term bullish trend remains unchanged. The MACD indicator’s DIF and DEA both move downward, showing that bearish momentum is strengthening and the correction isn’t finished yet. The price has broken below the mid-band at 84,123 and is probing support at the lower band. The band opening shows signs of contracting, which indicates volatility is decreasing and the market is entering a period of sideways consolidation. In the short term, it will most likely continue to swing and fight within the 83,000–85,000 range.
Short-term reference:
Buy at 83,000 (or “do-duo”), defend at 82,500, stop loss 400 points, aiming for 84,000 with a target around 84,500.
Sell at 84,500 (or “do-kong”), defend at 85,000, stop loss 400 points, aiming for 83,500 with a target around 83,000.
Ethereum
Family members! Ethereum’s current price is 2,685. This is a typical uptrend continuation or top-range consolidation. The direction hasn’t been chosen completely yet, but the big-picture trend hasn’t turned bad. The EMA moving average at 2,690 is a key level; if it breaks, the price may test the strong support at 2,633. The bearish power on the MACD hasn’t fully been released, so there is still downward adjustment pressure in the short term. Regarding the Bollinger Bands, the price has already broken below the mid-band at 2,680 and is testing how strong the lower-band support at 2,647 is. The band opening has started to tighten and a breakout is likely approaching. Overall, the indicators lean toward range-bound and slightly weak conditions. We need to wait for the MACD to form a golden cross again, or for the price to hold above the mid-band, to confirm that the bullish move is back.
Short-term price level reference
Buy at 2,660 (or “do-duo”), defend at 2,630, stop loss 40 points, target 2,720 aiming for 2,760.
Sell at 2,740 (or “do-kong”), defend at 2,750, stop loss 40 points, target 2,700 aiming for 2,650.
The above content is an exclusive original by Liying. If you repost, please注明出处. The article release may be subject to review delays. Market conditions change rapidly; the above suggestions are for reference only—risk is your own responsibility.
$ETH
#ETH走势分析 #BTC走势分析
3
258
·
--
Bullish
$BTC big pancake open multi-target 90,000+
{future}(BTCUSDT)
#BTC contracts
$BTC big pancake open multi-target 90,000+
#BTC contracts
#BTC contracts

1
95
·
--
Bullish
$BTC Liying chats about coins: Latest BTC and ETH market analysis for 9.25
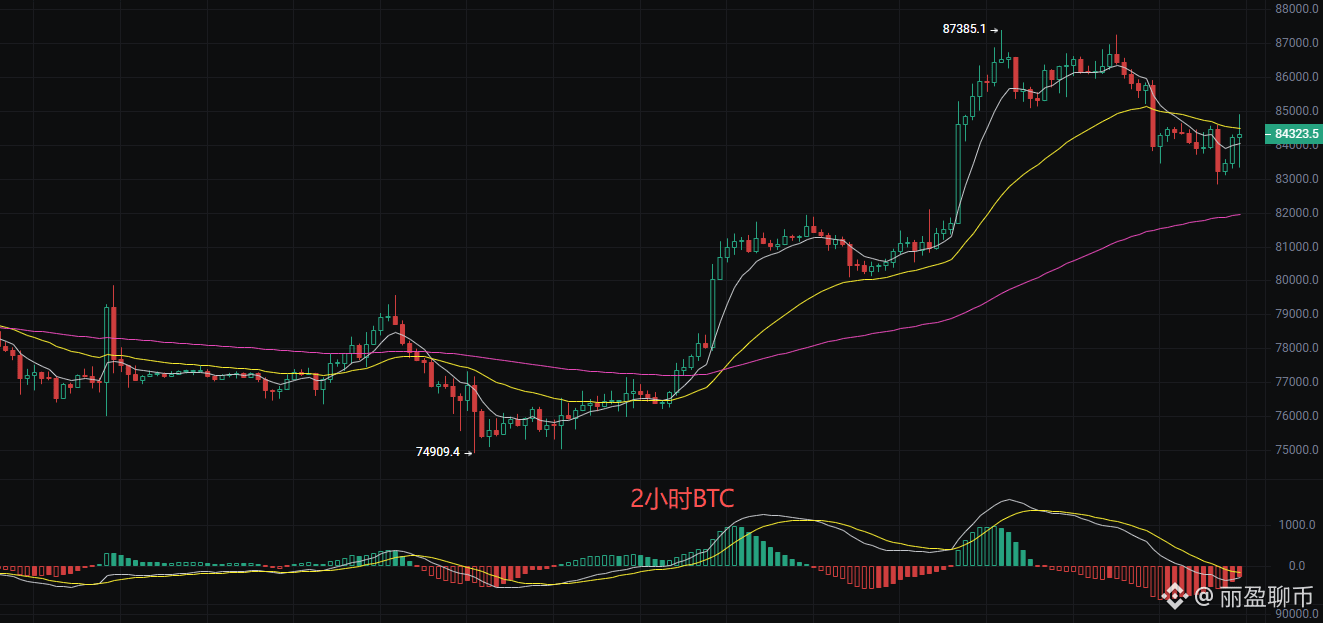
Family members! Bitcoin’s current price is 84,300, and the market really leaves people a bit baffled. Let’s look at this 2-hour chart—just a few days ago it made a strong push and surged to a high of 87,385. But then, it turned around and a big “plunge” came, smashing down to around 84,250 now. The EMA moving averages’ medium- to long-term bullish trend hasn’t changed, but on the short term there’s significant suppression and resistance to rebounds. The MACD indicator’s bearish momentum is still in control, and the momentum hasn’t yet exhausted. For now, there’s no sign of a bottom divergence signal. The Bollinger Bands suggest a potential turning point is imminent. If it can’t quickly reclaim the area above the middle band, it will likely test the lower band to seek support.
Short-term references:
Go long around 83,000, hold with defense at 82,500, stop loss 400 points, target 84,000 with an eye on 84,500
Go short around 84,500, defend at 85,000, stop loss 400 points, target 83,500 with an eye on 83,000
Ethereum
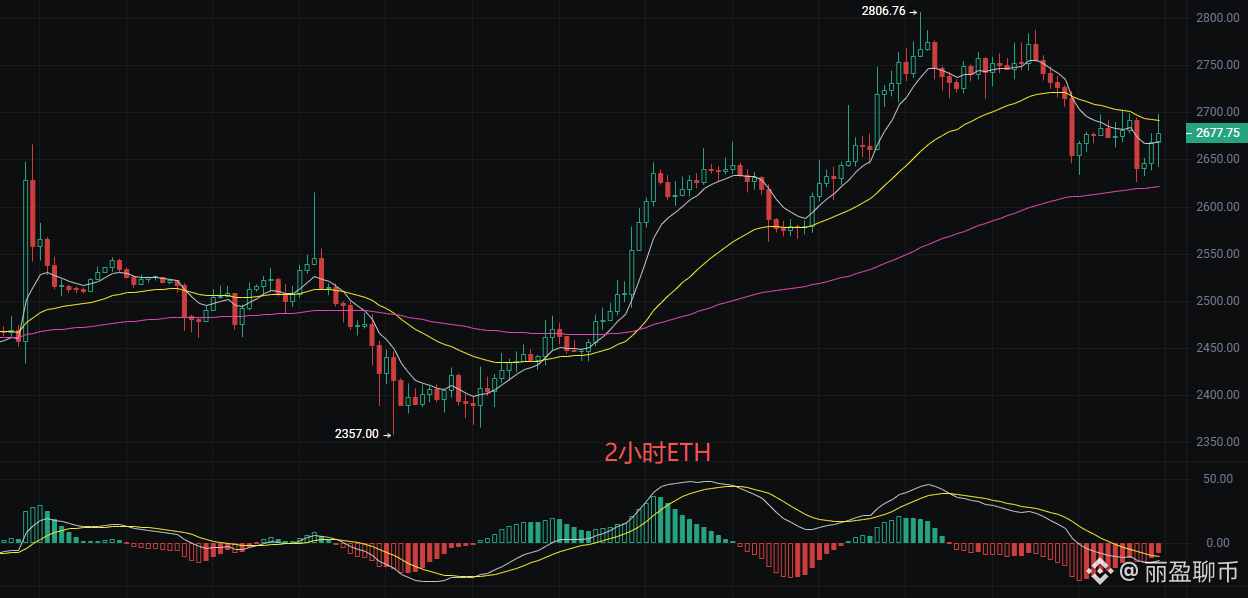
Family members! Ethereum’s current price is 2,680, and it really is a bit confusing stuck at this level. Look at the chart—recently it surged above 2,800, but it couldn’t hold and then dropped back down. Now it’s exactly caught in the “gap” between several moving averages. It’s like climbing a mountain and getting tired during the ascent: taking a rest midway—now do you rest and then push upward again, or do you lack the strength and slide back down? This market right now is a typical consolidation and shakeout period: pressure above and support below. Direction is unclear, and it’s currently choosing whether to turn. But as long as it doesn’t break below the lower band at 2,620, the overall uptrend hasn’t been completely broken.
Short-term level references (holding at 2,630 normally with stop loss set properly is fine):
Go long around 2,660, defend at 2,630, stop loss 40 points, target 2,720 with an eye on 2,760
Go short around 2,740, defend at 2,750, stop loss 40 points, target 2,700 with an eye on 2,650
The above content is an exclusive original by Liying. If you reprint it, please indicate the source! There may be a delay in the article’s publication review. The market changes instantly; the above suggestions are for reference only—risk is on you.
{future}(BTCUSDT)
$ETH
{future}(ETHUSDT)
$BTC Liying chats about coins: Latest BTC and ETH market analysis for 9.25
Family members! Bitcoin’s current price is 84,300, and the market really leaves people a bit baffled. Let’s look at this 2-hour chart—just a few days ago it made a strong push and surged to a high of 87,385. But then, it turned around and a big “plunge” came, smashing down to around 84,250 now. The EMA moving averages’ medium- to long-term bullish trend hasn’t changed, but on the short term there’s significant suppression and resistance to rebounds. The MACD indicator’s bearish momentum is still in control, and the momentum hasn’t yet exhausted. For now, there’s no sign of a bottom divergence signal. The Bollinger Bands suggest a potential turning point is imminent. If it can’t quickly reclaim the area above the middle band, it will likely test the lower band to seek support.
Short-term references:
Go long around 83,000, hold with defense at 82,500, stop loss 400 points, target 84,000 with an eye on 84,500
Go short around 84,500, defend at 85,000, stop loss 400 points, target 83,500 with an eye on 83,000
Ethereum
Family members! Ethereum’s current price is 2,680, and it really is a bit confusing stuck at this level. Look at the chart—recently it surged above 2,800, but it couldn’t hold and then dropped back down. Now it’s exactly caught in the “gap” between several moving averages. It’s like climbing a mountain and getting tired during the ascent: taking a rest midway—now do you rest and then push upward again, or do you lack the strength and slide back down? This market right now is a typical consolidation and shakeout period: pressure above and support below. Direction is unclear, and it’s currently choosing whether to turn. But as long as it doesn’t break below the lower band at 2,620, the overall uptrend hasn’t been completely broken.
Short-term level references (holding at 2,630 normally with stop loss set properly is fine):
Go long around 2,660, defend at 2,630, stop loss 40 points, target 2,720 with an eye on 2,760
Go short around 2,740, defend at 2,750, stop loss 40 points, target 2,700 with an eye on 2,650
The above content is an exclusive original by Liying. If you reprint it, please indicate the source! There may be a delay in the article’s publication review. The market changes instantly; the above suggestions are for reference only—risk is on you.
$ETH
Family members! Bitcoin’s current price is 84,300, and the market really leaves people a bit baffled. Let’s look at this 2-hour chart—just a few days ago it made a strong push and surged to a high of 87,385. But then, it turned around and a big “plunge” came, smashing down to around 84,250 now. The EMA moving averages’ medium- to long-term bullish trend hasn’t changed, but on the short term there’s significant suppression and resistance to rebounds. The MACD indicator’s bearish momentum is still in control, and the momentum hasn’t yet exhausted. For now, there’s no sign of a bottom divergence signal. The Bollinger Bands suggest a potential turning point is imminent. If it can’t quickly reclaim the area above the middle band, it will likely test the lower band to seek support.
Short-term references:
Go long around 83,000, hold with defense at 82,500, stop loss 400 points, target 84,000 with an eye on 84,500
Go short around 84,500, defend at 85,000, stop loss 400 points, target 83,500 with an eye on 83,000
Ethereum
Family members! Ethereum’s current price is 2,680, and it really is a bit confusing stuck at this level. Look at the chart—recently it surged above 2,800, but it couldn’t hold and then dropped back down. Now it’s exactly caught in the “gap” between several moving averages. It’s like climbing a mountain and getting tired during the ascent: taking a rest midway—now do you rest and then push upward again, or do you lack the strength and slide back down? This market right now is a typical consolidation and shakeout period: pressure above and support below. Direction is unclear, and it’s currently choosing whether to turn. But as long as it doesn’t break below the lower band at 2,620, the overall uptrend hasn’t been completely broken.
Short-term level references (holding at 2,630 normally with stop loss set properly is fine):
Go long around 2,660, defend at 2,630, stop loss 40 points, target 2,720 with an eye on 2,760
Go short around 2,740, defend at 2,750, stop loss 40 points, target 2,700 with an eye on 2,650
The above content is an exclusive original by Liying. If you reprint it, please indicate the source! There may be a delay in the article’s publication review. The market changes instantly; the above suggestions are for reference only—risk is on you.
$ETH
2
1.3k
·
--
Bullish
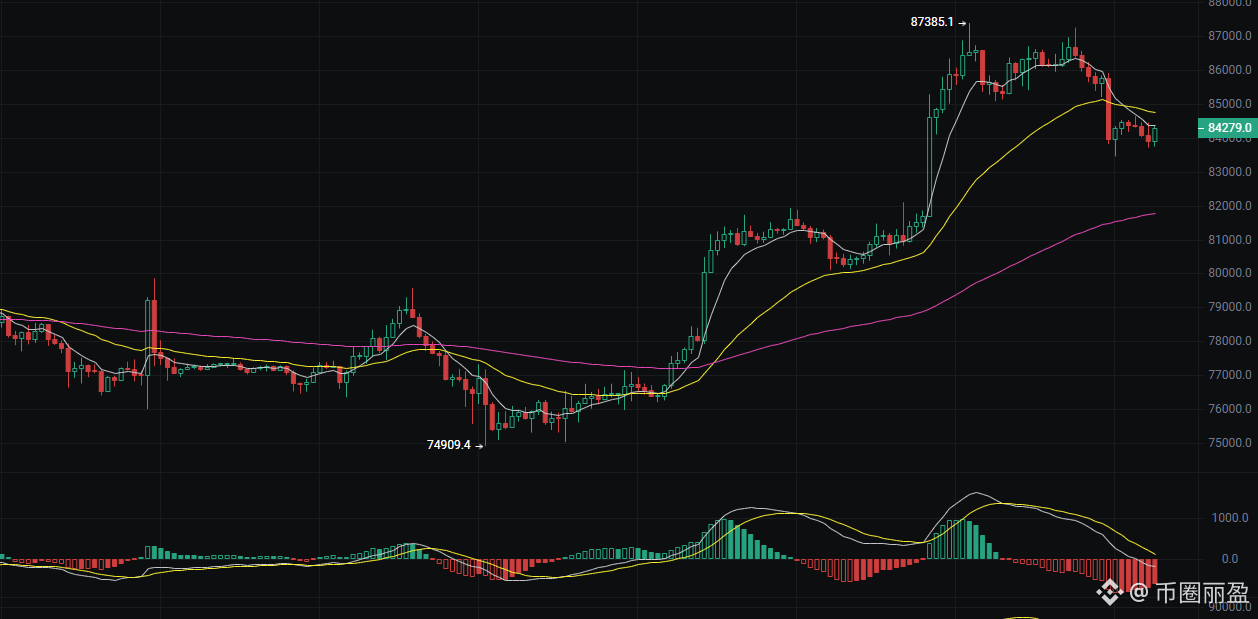
$BTC The current market is “mutually calling each other idiots” time—buyers don’t have the strength, and sellers can’t smash it down. This is only a low-volume shakeout. Don’t scare yourself! But the MACD fast line is approaching the zero axis; if you can’t hold 82,000, be careful—pullbacks could turn into a reversal!
Key points:
The volume hasn’t expanded, which means it’s not panic selling. EMA120 (the purple line) is around 81,800—this is the last line of defense for the bulls! The Bollinger Bands are tightening, and direction is about to be chosen.
Trading plan:
Short on weakness: If the current price closes red, try a small short position. Stop-loss: 84,800. Target: 82,500.
Golden buy zone: Place orders to buy between 81,800–82,200. Stop-loss: 80,800. Target: 85,000.
Note: If there’s a breakout above 85,500 on strong volume, all short positions are invalid—reverse and chase longs! Like and follow if you’re on board!
{future}(BTCUSDT)
#BTC走势分析
$BTC The current market is “mutually calling each other idiots” time—buyers don’t have the strength, and sellers can’t smash it down. This is only a low-volume shakeout. Don’t scare yourself! But the MACD fast line is approaching the zero axis; if you can’t hold 82,000, be careful—pullbacks could turn into a reversal!
Key points:
The volume hasn’t expanded, which means it’s not panic selling. EMA120 (the purple line) is around 81,800—this is the last line of defense for the bulls! The Bollinger Bands are tightening, and direction is about to be chosen.
Trading plan:
Short on weakness: If the current price closes red, try a small short position. Stop-loss: 84,800. Target: 82,500.
Golden buy zone: Place orders to buy between 81,800–82,200. Stop-loss: 80,800. Target: 85,000.
Note: If there’s a breakout above 85,500 on strong volume, all short positions are invalid—reverse and chase longs! Like and follow if you’re on board!
#BTC走势分析
Key points:
The volume hasn’t expanded, which means it’s not panic selling. EMA120 (the purple line) is around 81,800—this is the last line of defense for the bulls! The Bollinger Bands are tightening, and direction is about to be chosen.
Trading plan:
Short on weakness: If the current price closes red, try a small short position. Stop-loss: 84,800. Target: 82,500.
Golden buy zone: Place orders to buy between 81,800–82,200. Stop-loss: 80,800. Target: 85,000.
Note: If there’s a breakout above 85,500 on strong volume, all short positions are invalid—reverse and chase longs! Like and follow if you’re on board!
#BTC走势分析
1
317
·
--
Bullish
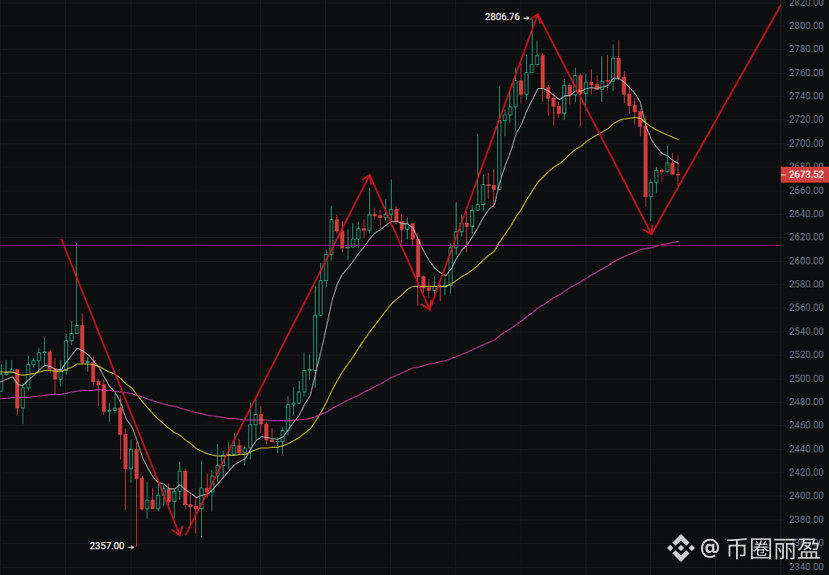
$ETH Ethereum current price 2673—don't panic! This pullback is a normal shakeout, not the end of the trend
As long as you hold the key support, odds are we'll still see a push higher later. This is a good time to look for an entry!
From a technical perspective: the long-term EMA moving average at 2616 is steadily trending upward, and the larger trend remains bullish
The MACD green histogram bars are shrinking, indicating weakening bearish momentum—it's approaching a fast golden cross
The Bollinger lower band at 2645 is strong support. As long as price hasn't broken below it, waiting for a breakout above the middle band at 2720 can confirm the return of the uptrend
Trading suggestions:
For longs: you can enter around 2645-2650, with a stop loss placed below 2620
For shorts: wait for a rebound to around 2720-2730, with a stop loss above 2750
Follow the trend while controlling risk—it's also manageable for beginners
{future}(ETHUSDT)
{future}(BTCUSDT)
#ETH走势分析
$ETH Ethereum current price 2673—don't panic! This pullback is a normal shakeout, not the end of the trend
As long as you hold the key support, odds are we'll still see a push higher later. This is a good time to look for an entry!
From a technical perspective: the long-term EMA moving average at 2616 is steadily trending upward, and the larger trend remains bullish
The MACD green histogram bars are shrinking, indicating weakening bearish momentum—it's approaching a fast golden cross
The Bollinger lower band at 2645 is strong support. As long as price hasn't broken below it, waiting for a breakout above the middle band at 2720 can confirm the return of the uptrend
Trading suggestions:
For longs: you can enter around 2645-2650, with a stop loss placed below 2620
For shorts: wait for a rebound to around 2720-2730, with a stop loss above 2750
Follow the trend while controlling risk—it's also manageable for beginners
#ETH走势分析
As long as you hold the key support, odds are we'll still see a push higher later. This is a good time to look for an entry!
From a technical perspective: the long-term EMA moving average at 2616 is steadily trending upward, and the larger trend remains bullish
The MACD green histogram bars are shrinking, indicating weakening bearish momentum—it's approaching a fast golden cross
The Bollinger lower band at 2645 is strong support. As long as price hasn't broken below it, waiting for a breakout above the middle band at 2720 can confirm the return of the uptrend
Trading suggestions:
For longs: you can enter around 2645-2650, with a stop loss placed below 2620
For shorts: wait for a rebound to around 2720-2730, with a stop loss above 2750
Follow the trend while controlling risk—it's also manageable for beginners
#ETH走势分析
1
215
·
--
Bullish
$BTC Liying Talks on Coins: 9.24 Latest Market Analysis of Bitcoin (BTC) and Ethereum (ETH)
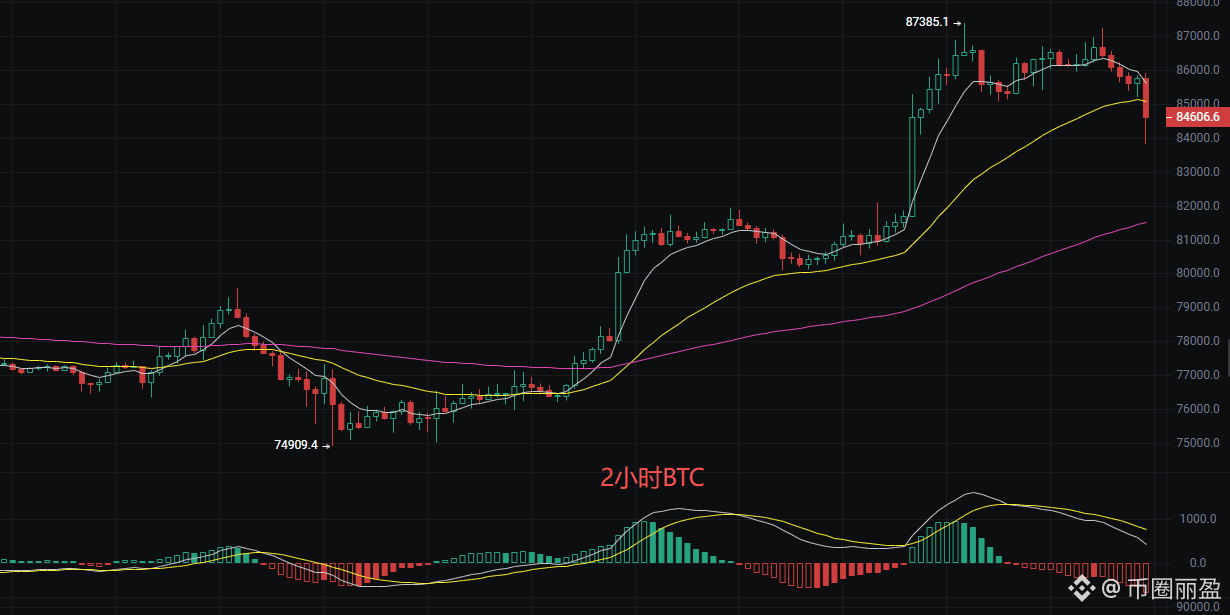
Family members! Bitcoin is currently at 84,700. Just now, that sudden drop smashed the price down to around 84,700. In a bull market, even sharp pullbacks can happen quickly. The trend hasn’t broken—this is your chance to get on board. The technical indicator moving averages are weakening in the short term; the bigger direction is still under the control of the bulls. The MACD is releasing bearish momentum, and the correction may not be fully over yet. The price has already fallen below the mid band at 85,959 and is probing the support strength of the lower band at 85,020. If it can stop falling around 85,000 and print a long lower wick, that would be a very classic pullback confirmation signal.
Short-term reference: Buy on dips, and be cautious about topping out.
Long trade at 84,500, defense at 84,000, stop loss of 400 points; target 86,000, aiming for 87,300.
Short trade at 86,000, defense at 86,500, stop loss of 400 points; target 85,000, aiming for 84,500.
Ethereum
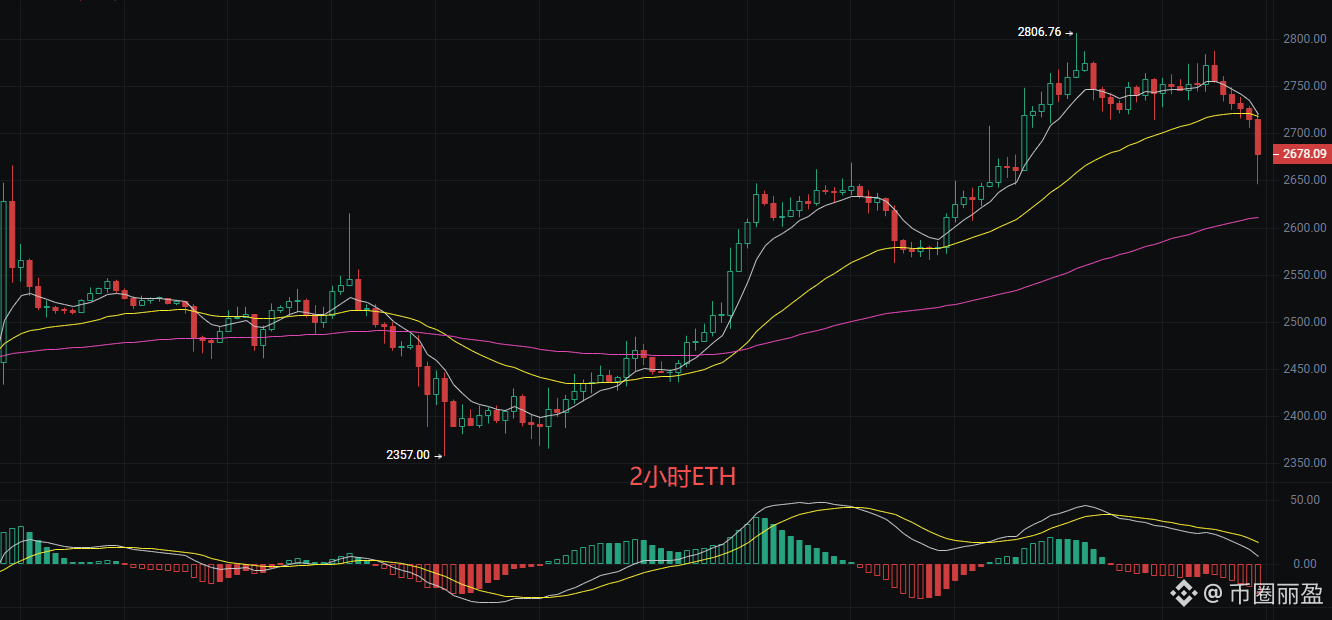
Family members! Ethereum is currently at 2,679. After a big surge, a pullback like this is completely normal—like when you’re climbing a mountain and need to catch your breath. Right now it’s at a support level for the short-term moving averages and the mid band. If it can hold, there’s still a chance to make another push higher later; if it breaks, then it may need to look for more solid support lower down. EMA7 and EMA30 are still above EMA120, which means the medium- to long-term trend remains bullish, though there is short-term adjustment pressure. As for MACD, the DIF and DEA momentum still haven’t turned positive. The Bollinger mid band at 2,740 has become a pressure level, while the lower band at 2,702 is the key near-term support. If it breaks, it may test the 2,650 area. Overall, the market is in a pullback phase within an uptrend; wait for stabilization signals before taking action.
Short-term reference levels
Long trade at 2,660, defense at 2,630, stop loss of 40 points; target 2,720, aiming for 2,760.
Short trade at 2,740, defense at 2,750, stop loss of 40 points; target 2,700, aiming for 2,650.
The above content is exclusively original by Liying. If you转载 (reprint), please注明来源! There is a delay in the article’s approval process. The market moves rapidly and the above suggestions are for reference only—risk is your own responsibility.
{future}(BTCUSDT)
$ETH
{future}(ETHUSDT)
#BTC走势分析 #ETH走势分析
$BTC Liying Talks on Coins: 9.24 Latest Market Analysis of Bitcoin (BTC) and Ethereum (ETH)
Family members! Bitcoin is currently at 84,700. Just now, that sudden drop smashed the price down to around 84,700. In a bull market, even sharp pullbacks can happen quickly. The trend hasn’t broken—this is your chance to get on board. The technical indicator moving averages are weakening in the short term; the bigger direction is still under the control of the bulls. The MACD is releasing bearish momentum, and the correction may not be fully over yet. The price has already fallen below the mid band at 85,959 and is probing the support strength of the lower band at 85,020. If it can stop falling around 85,000 and print a long lower wick, that would be a very classic pullback confirmation signal.
Short-term reference: Buy on dips, and be cautious about topping out.
Long trade at 84,500, defense at 84,000, stop loss of 400 points; target 86,000, aiming for 87,300.
Short trade at 86,000, defense at 86,500, stop loss of 400 points; target 85,000, aiming for 84,500.
Ethereum
Family members! Ethereum is currently at 2,679. After a big surge, a pullback like this is completely normal—like when you’re climbing a mountain and need to catch your breath. Right now it’s at a support level for the short-term moving averages and the mid band. If it can hold, there’s still a chance to make another push higher later; if it breaks, then it may need to look for more solid support lower down. EMA7 and EMA30 are still above EMA120, which means the medium- to long-term trend remains bullish, though there is short-term adjustment pressure. As for MACD, the DIF and DEA momentum still haven’t turned positive. The Bollinger mid band at 2,740 has become a pressure level, while the lower band at 2,702 is the key near-term support. If it breaks, it may test the 2,650 area. Overall, the market is in a pullback phase within an uptrend; wait for stabilization signals before taking action.
Short-term reference levels
Long trade at 2,660, defense at 2,630, stop loss of 40 points; target 2,720, aiming for 2,760.
Short trade at 2,740, defense at 2,750, stop loss of 40 points; target 2,700, aiming for 2,650.
The above content is exclusively original by Liying. If you转载 (reprint), please注明来源! There is a delay in the article’s approval process. The market moves rapidly and the above suggestions are for reference only—risk is your own responsibility.
$ETH
#BTC走势分析 #ETH走势分析
Family members! Bitcoin is currently at 84,700. Just now, that sudden drop smashed the price down to around 84,700. In a bull market, even sharp pullbacks can happen quickly. The trend hasn’t broken—this is your chance to get on board. The technical indicator moving averages are weakening in the short term; the bigger direction is still under the control of the bulls. The MACD is releasing bearish momentum, and the correction may not be fully over yet. The price has already fallen below the mid band at 85,959 and is probing the support strength of the lower band at 85,020. If it can stop falling around 85,000 and print a long lower wick, that would be a very classic pullback confirmation signal.
Short-term reference: Buy on dips, and be cautious about topping out.
Long trade at 84,500, defense at 84,000, stop loss of 400 points; target 86,000, aiming for 87,300.
Short trade at 86,000, defense at 86,500, stop loss of 400 points; target 85,000, aiming for 84,500.
Ethereum
Family members! Ethereum is currently at 2,679. After a big surge, a pullback like this is completely normal—like when you’re climbing a mountain and need to catch your breath. Right now it’s at a support level for the short-term moving averages and the mid band. If it can hold, there’s still a chance to make another push higher later; if it breaks, then it may need to look for more solid support lower down. EMA7 and EMA30 are still above EMA120, which means the medium- to long-term trend remains bullish, though there is short-term adjustment pressure. As for MACD, the DIF and DEA momentum still haven’t turned positive. The Bollinger mid band at 2,740 has become a pressure level, while the lower band at 2,702 is the key near-term support. If it breaks, it may test the 2,650 area. Overall, the market is in a pullback phase within an uptrend; wait for stabilization signals before taking action.
Short-term reference levels
Long trade at 2,660, defense at 2,630, stop loss of 40 points; target 2,720, aiming for 2,760.
Short trade at 2,740, defense at 2,750, stop loss of 40 points; target 2,700, aiming for 2,650.
The above content is exclusively original by Liying. If you转载 (reprint), please注明来源! There is a delay in the article’s approval process. The market moves rapidly and the above suggestions are for reference only—risk is your own responsibility.
$ETH
#BTC走势分析 #ETH走势分析
1
4
2k
·
--
Bullish
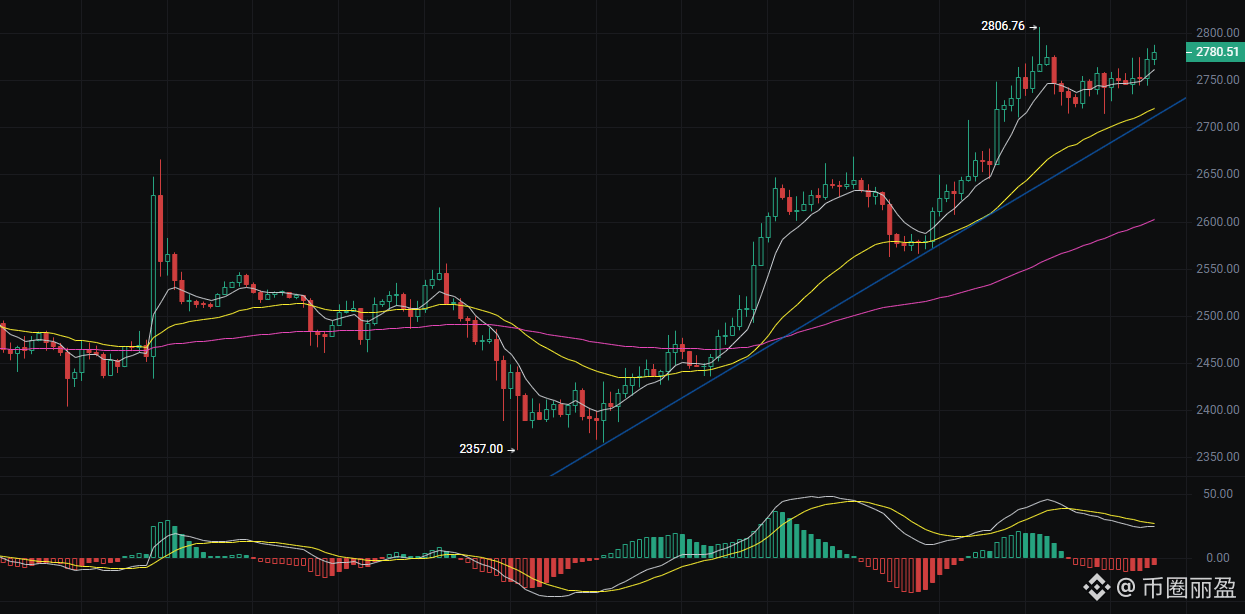
$ETH ETH gets stuck at 2781 while playing with heartbeat! Just got pulled up from 2357, and now it’s ranging and consolidating— the main force is trying to shake people out of the train.
If you can’t hold 2750, you’ll likely see a pullback; if you can stand firm at 2800, you may be able to push to a new high. In times like this, betting correctly on the direction lets you take a bite of profit—betting wrong just means getting hit!
MACD has a dead cross at a high level, but there isn’t a sell-off with heavy volume, which suggests the bulls haven’t given up yet.
The Bollinger Bands are tightening— a breakout/breakdown is imminent. EMA7 (2761) and EMA30 (2721) are lifelines. As long as they aren’t broken, there’s still a chance.
Strategy:
Go long on a pullback at 2760–2765, stop-loss 2745, target 2806.
If price rebounds to 2800 and gets rejected, consider a short; stop-loss 2815, target 2760.
Don’t go all-in. Keep some ammo in case of a wick/poke-through. If you win, add to your position; if you lose, accept it!
{future}(ETHUSDT)
#ETH走势分析
$ETH ETH gets stuck at 2781 while playing with heartbeat! Just got pulled up from 2357, and now it’s ranging and consolidating— the main force is trying to shake people out of the train.
If you can’t hold 2750, you’ll likely see a pullback; if you can stand firm at 2800, you may be able to push to a new high. In times like this, betting correctly on the direction lets you take a bite of profit—betting wrong just means getting hit!
MACD has a dead cross at a high level, but there isn’t a sell-off with heavy volume, which suggests the bulls haven’t given up yet.
The Bollinger Bands are tightening— a breakout/breakdown is imminent. EMA7 (2761) and EMA30 (2721) are lifelines. As long as they aren’t broken, there’s still a chance.
Strategy:
Go long on a pullback at 2760–2765, stop-loss 2745, target 2806.
If price rebounds to 2800 and gets rejected, consider a short; stop-loss 2815, target 2760.
Don’t go all-in. Keep some ammo in case of a wick/poke-through. If you win, add to your position; if you lose, accept it!
#ETH走势分析
If you can’t hold 2750, you’ll likely see a pullback; if you can stand firm at 2800, you may be able to push to a new high. In times like this, betting correctly on the direction lets you take a bite of profit—betting wrong just means getting hit!
MACD has a dead cross at a high level, but there isn’t a sell-off with heavy volume, which suggests the bulls haven’t given up yet.
The Bollinger Bands are tightening— a breakout/breakdown is imminent. EMA7 (2761) and EMA30 (2721) are lifelines. As long as they aren’t broken, there’s still a chance.
Strategy:
Go long on a pullback at 2760–2765, stop-loss 2745, target 2806.
If price rebounds to 2800 and gets rejected, consider a short; stop-loss 2815, target 2760.
Don’t go all-in. Keep some ammo in case of a wick/poke-through. If you win, add to your position; if you lose, accept it!
#ETH走势分析
6
1.5k
·
--
Bullish
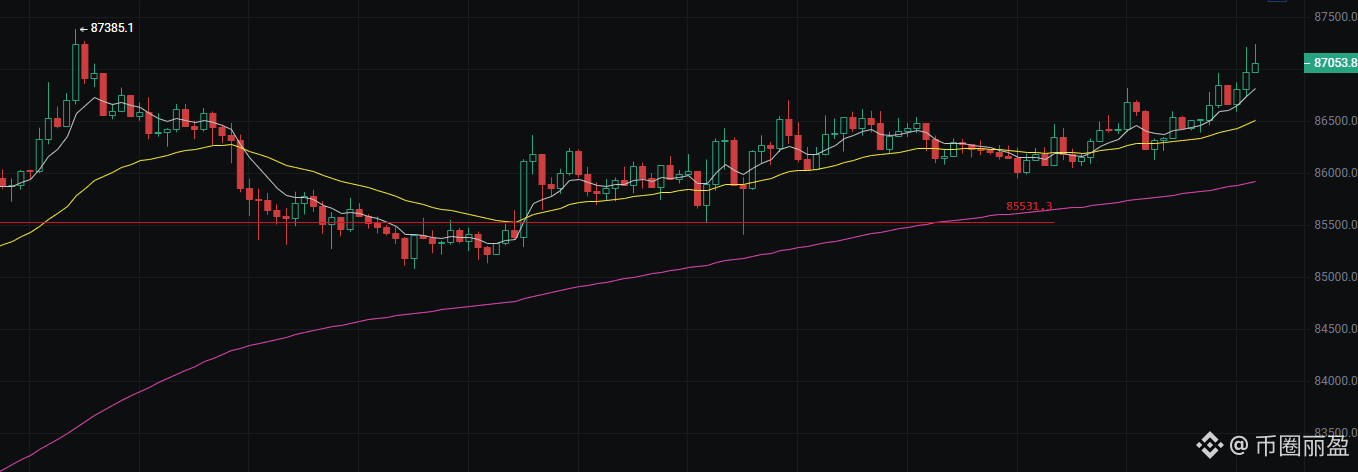
$BTC Bitcoin 87169 — this trend looks like it’s taking off! From grinding at 75,000 up to a violent surge, once the trend forms, don’t get off too easily. A lot of people are afraid of chasing the price high—actually, as long as the moving averages are in a bullish alignment, pullbacks are your chance to get on board. Hold tight—better than messing around! Yesterday, with Liying, the friends who went long at 85,500 can start reducing their holdings. If it pulls back, keep watching—
On the technical side: the EMA moving averages are perfectly aligned in bullish order. The MACD red histogram is still strong, though its slope is slowing down. The Bollinger Bands show price riding along the upper band, indicating strength, but it’s also overbought. In the short term, there may be a need to revisit the mid-band near 86,168. But the bigger picture still points upward—so it’s suitable for buying dips in line with the trend.
Practical suggestions:
• Patient approach: wait for a pullback to 86,200–86,400, then enter once it stabilizes; set stop-loss at 85,500.
• Aggressive approach: at around 87,500, try a small position; set stop-loss at 88,000.
Short-term: enter fast and exit fast. Hold your swing trades to stay with the trend. Follow me—I'll help you precisely catch every fluctuation! #BTC走势分析
{future}(BTCUSDT)
$BTC Bitcoin 87169 — this trend looks like it’s taking off! From grinding at 75,000 up to a violent surge, once the trend forms, don’t get off too easily. A lot of people are afraid of chasing the price high—actually, as long as the moving averages are in a bullish alignment, pullbacks are your chance to get on board. Hold tight—better than messing around! Yesterday, with Liying, the friends who went long at 85,500 can start reducing their holdings. If it pulls back, keep watching—
On the technical side: the EMA moving averages are perfectly aligned in bullish order. The MACD red histogram is still strong, though its slope is slowing down. The Bollinger Bands show price riding along the upper band, indicating strength, but it’s also overbought. In the short term, there may be a need to revisit the mid-band near 86,168. But the bigger picture still points upward—so it’s suitable for buying dips in line with the trend.
Practical suggestions:
• Patient approach: wait for a pullback to 86,200–86,400, then enter once it stabilizes; set stop-loss at 85,500.
• Aggressive approach: at around 87,500, try a small position; set stop-loss at 88,000.
Short-term: enter fast and exit fast. Hold your swing trades to stay with the trend. Follow me—I'll help you precisely catch every fluctuation! #BTC走势分析
On the technical side: the EMA moving averages are perfectly aligned in bullish order. The MACD red histogram is still strong, though its slope is slowing down. The Bollinger Bands show price riding along the upper band, indicating strength, but it’s also overbought. In the short term, there may be a need to revisit the mid-band near 86,168. But the bigger picture still points upward—so it’s suitable for buying dips in line with the trend.
Practical suggestions:
• Patient approach: wait for a pullback to 86,200–86,400, then enter once it stabilizes; set stop-loss at 85,500.
• Aggressive approach: at around 87,500, try a small position; set stop-loss at 88,000.
Short-term: enter fast and exit fast. Hold your swing trades to stay with the trend. Follow me—I'll help you precisely catch every fluctuation! #BTC走势分析

5
649
·
--
Bullish
$BTC Liying Discusses Coin: Latest BTC (Bitcoin) and ETH (Ethereum) Market Analysis for 9.23
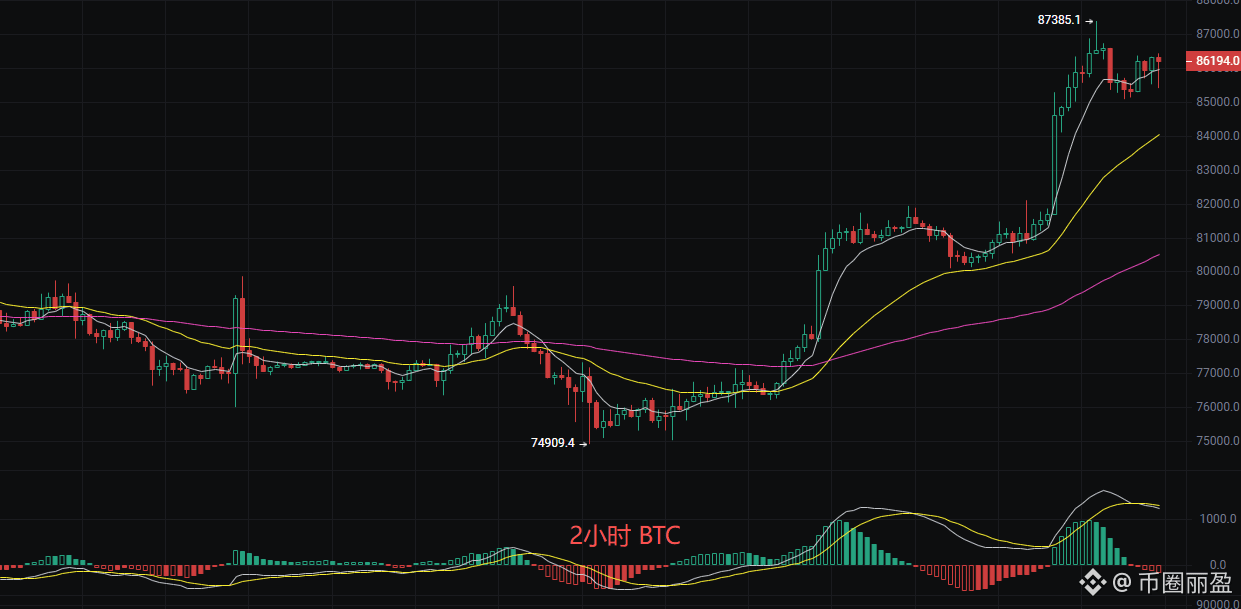
Family members! Bitcoin is currently at 86,200. After a sharp surge, the overall major trend is still upward. The moving average system is opened like a fan, showing strong bullish power. The current pullback looks more like the main force shaking out weak hands. As long as it doesn’t break the key support level, this rally trend remains intact. The EMA moving average system shows a perfect bullish alignment. The MACD indicator’s short-term upward momentum is weakening, and price is moving between the middle band and the upper band; the middle band is an extremely strong defensive line. Overall, the indicators suggest there’s a need for short-term correction, but the medium-term trend is still positive.
Short-term reference: Buy on dips, be cautious about topping.
Long at around 86,000; defense at 85,500; stop-loss 400 points; targets 87,300, then 88,000.
Long at around 87,000; defense at 87,500; stop-loss 400 points; target 86,000, then 85,500.
Ethereum
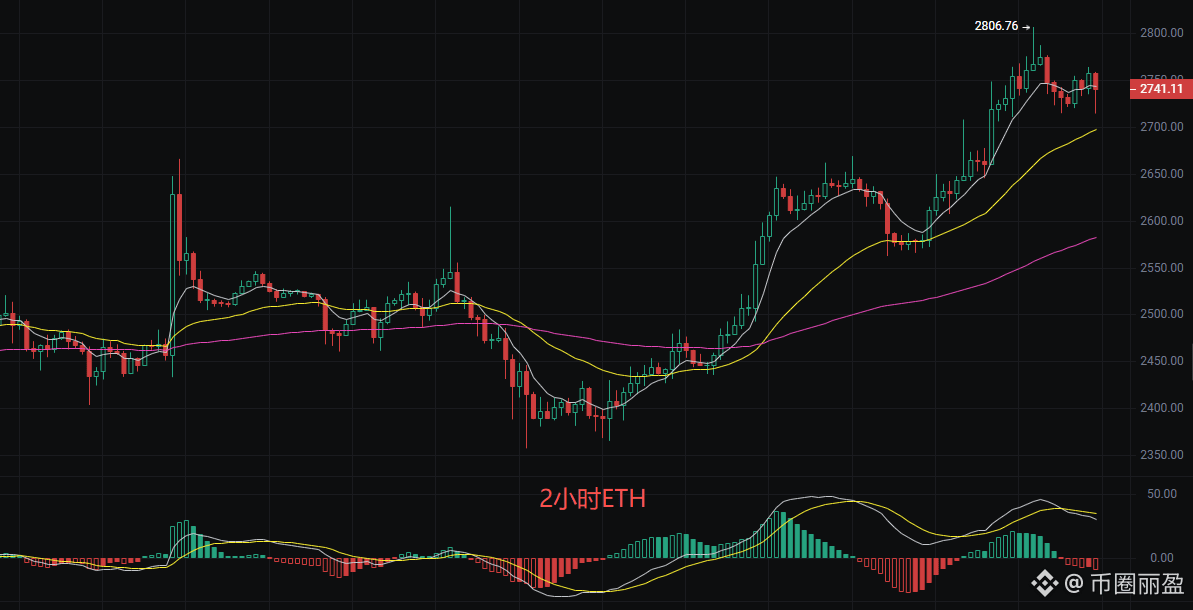
Family members! Ethereum is currently at 2,740. It’s taking a brief breather with a pullback, but the big trend is still not broken. When prices have surged too much and then retrace, it often gives an opportunity to those who haven’t gotten in yet. The EMA moving average system is in a bullish configuration. MACD short-term momentum is weakening, but the two lines are still above the zero axis—this is a strong correction. The Bollinger Bands price has fallen back to around the middle band at 2,727; this is the key line dividing bulls and bears. If the middle band stabilizes, there’s a chance to challenge the upper band again at 2,800. If it breaks below, the lower band at 2,653 will be a strong support. Overall, the trend is still intact, but remain alert that the short-term pullback may deepen.
Short-term level references
Long at around 2,725; defense at 2,700; stop-loss 40 points; target 2,750, then 2,820.
No short positions are recommended for now. Only if the price effectively breaks below 2,650 and does so with increased volume, then a short-term sell could target around 2,600, with a stop-loss at 2,680. The current main strategy is still to follow the trend and buy on dips, control position size, and don’t heavily bet on direction.
The above content is exclusively original by Liying. Please注明出处 when reposting! There may be a delay in the article’s market review; as conditions change rapidly, the above suggestions are for reference only—risk is yours to bear.
{future}(BTCUSDT)
$ETH
{future}(ETHUSDT)
#BTC走势分析 #ETH走势分析
$BTC Liying Discusses Coin: Latest BTC (Bitcoin) and ETH (Ethereum) Market Analysis for 9.23
Family members! Bitcoin is currently at 86,200. After a sharp surge, the overall major trend is still upward. The moving average system is opened like a fan, showing strong bullish power. The current pullback looks more like the main force shaking out weak hands. As long as it doesn’t break the key support level, this rally trend remains intact. The EMA moving average system shows a perfect bullish alignment. The MACD indicator’s short-term upward momentum is weakening, and price is moving between the middle band and the upper band; the middle band is an extremely strong defensive line. Overall, the indicators suggest there’s a need for short-term correction, but the medium-term trend is still positive.
Short-term reference: Buy on dips, be cautious about topping.
Long at around 86,000; defense at 85,500; stop-loss 400 points; targets 87,300, then 88,000.
Long at around 87,000; defense at 87,500; stop-loss 400 points; target 86,000, then 85,500.
Ethereum
Family members! Ethereum is currently at 2,740. It’s taking a brief breather with a pullback, but the big trend is still not broken. When prices have surged too much and then retrace, it often gives an opportunity to those who haven’t gotten in yet. The EMA moving average system is in a bullish configuration. MACD short-term momentum is weakening, but the two lines are still above the zero axis—this is a strong correction. The Bollinger Bands price has fallen back to around the middle band at 2,727; this is the key line dividing bulls and bears. If the middle band stabilizes, there’s a chance to challenge the upper band again at 2,800. If it breaks below, the lower band at 2,653 will be a strong support. Overall, the trend is still intact, but remain alert that the short-term pullback may deepen.
Short-term level references
Long at around 2,725; defense at 2,700; stop-loss 40 points; target 2,750, then 2,820.
No short positions are recommended for now. Only if the price effectively breaks below 2,650 and does so with increased volume, then a short-term sell could target around 2,600, with a stop-loss at 2,680. The current main strategy is still to follow the trend and buy on dips, control position size, and don’t heavily bet on direction.
The above content is exclusively original by Liying. Please注明出处 when reposting! There may be a delay in the article’s market review; as conditions change rapidly, the above suggestions are for reference only—risk is yours to bear.
$ETH
#BTC走势分析 #ETH走势分析
Family members! Bitcoin is currently at 86,200. After a sharp surge, the overall major trend is still upward. The moving average system is opened like a fan, showing strong bullish power. The current pullback looks more like the main force shaking out weak hands. As long as it doesn’t break the key support level, this rally trend remains intact. The EMA moving average system shows a perfect bullish alignment. The MACD indicator’s short-term upward momentum is weakening, and price is moving between the middle band and the upper band; the middle band is an extremely strong defensive line. Overall, the indicators suggest there’s a need for short-term correction, but the medium-term trend is still positive.
Short-term reference: Buy on dips, be cautious about topping.
Long at around 86,000; defense at 85,500; stop-loss 400 points; targets 87,300, then 88,000.
Long at around 87,000; defense at 87,500; stop-loss 400 points; target 86,000, then 85,500.
Ethereum
Family members! Ethereum is currently at 2,740. It’s taking a brief breather with a pullback, but the big trend is still not broken. When prices have surged too much and then retrace, it often gives an opportunity to those who haven’t gotten in yet. The EMA moving average system is in a bullish configuration. MACD short-term momentum is weakening, but the two lines are still above the zero axis—this is a strong correction. The Bollinger Bands price has fallen back to around the middle band at 2,727; this is the key line dividing bulls and bears. If the middle band stabilizes, there’s a chance to challenge the upper band again at 2,800. If it breaks below, the lower band at 2,653 will be a strong support. Overall, the trend is still intact, but remain alert that the short-term pullback may deepen.
Short-term level references
Long at around 2,725; defense at 2,700; stop-loss 40 points; target 2,750, then 2,820.
No short positions are recommended for now. Only if the price effectively breaks below 2,650 and does so with increased volume, then a short-term sell could target around 2,600, with a stop-loss at 2,680. The current main strategy is still to follow the trend and buy on dips, control position size, and don’t heavily bet on direction.
The above content is exclusively original by Liying. Please注明出处 when reposting! There may be a delay in the article’s market review; as conditions change rapidly, the above suggestions are for reference only—risk is yours to bear.
$ETH
#BTC走势分析 #ETH走势分析
5
262
·
--
Bullish
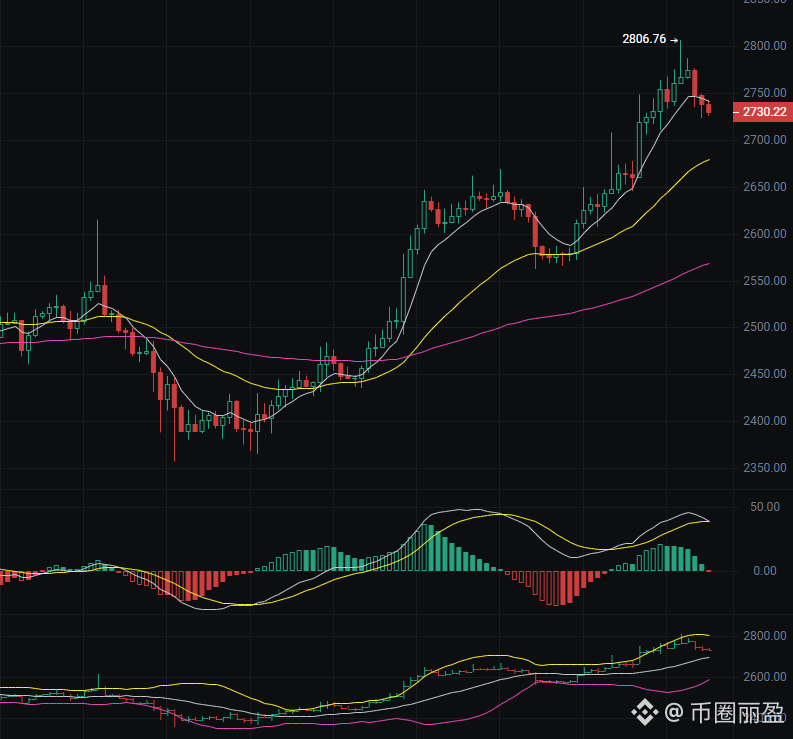
$ETH ETH current price 2727. The big-picture trend is bullish, but there may be a short-term pullback—don’t chase. Wait for a confirmed pullback and then enter.
The moving averages are in a bullish alignment, and the overall trend is intact.
MACD shows a dead cross at a high level, with weakening momentum.
Price has broken below the Bollinger middle band, so the short term may be range-bound.
Recommendation: wait for a pullback into the 2680–2700 zone to go long. Stop loss: 2640. Targets: 2800–2850.
If the rebound fails to break 2760–2780, you may try a small short position. Stop loss: 2810. Target: 2690.
Prefer going long on dips in line with the trend, and always keep a strict stop loss.
{future}(ETHUSDT)
#ETH走势分析
$ETH ETH current price 2727. The big-picture trend is bullish, but there may be a short-term pullback—don’t chase. Wait for a confirmed pullback and then enter.
The moving averages are in a bullish alignment, and the overall trend is intact.
MACD shows a dead cross at a high level, with weakening momentum.
Price has broken below the Bollinger middle band, so the short term may be range-bound.
Recommendation: wait for a pullback into the 2680–2700 zone to go long. Stop loss: 2640. Targets: 2800–2850.
If the rebound fails to break 2760–2780, you may try a small short position. Stop loss: 2810. Target: 2690.
Prefer going long on dips in line with the trend, and always keep a strict stop loss.
#ETH走势分析
The moving averages are in a bullish alignment, and the overall trend is intact.
MACD shows a dead cross at a high level, with weakening momentum.
Price has broken below the Bollinger middle band, so the short term may be range-bound.
Recommendation: wait for a pullback into the 2680–2700 zone to go long. Stop loss: 2640. Targets: 2800–2850.
If the rebound fails to break 2760–2780, you may try a small short position. Stop loss: 2810. Target: 2690.
Prefer going long on dips in line with the trend, and always keep a strict stop loss.
#ETH走势分析
6
491
·
--
Bullish
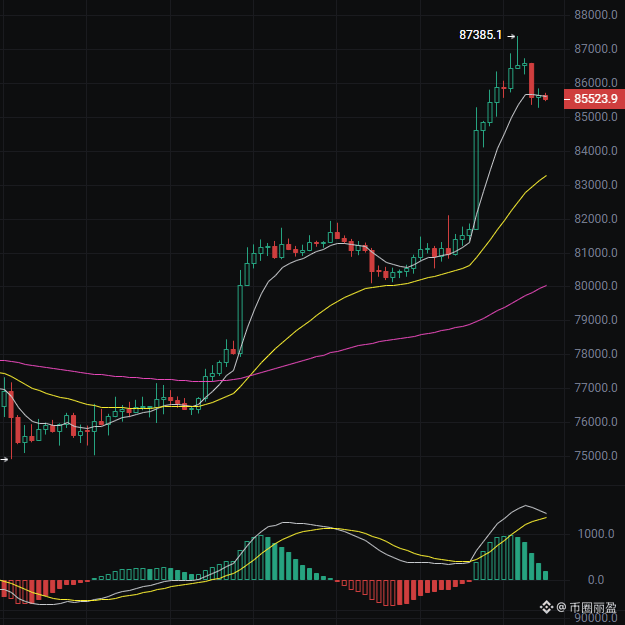
$BTC BTC holds at 85500—Is the bull market still on?
Brothers, don’t get scared off by a short-term pullback! From 74900 to 87385, this bullish trend has been absolutely perfect. Now the correction is just a continuation during the uptrend. As long as it doesn’t break below the key support, the bigger picture remains bullish!
Technical breakdown:
The EMA moving averages are in a bullish arrangement, with price staying above the EMA7. MACD is running above the zero line and momentum hasn’t faded. The Bollinger Bands are opening upward, and price/volume are in good alignment. This is a classic case of the strong staying strong!
Trading strategy:
Go with the trend—pullbacks are opportunities!
Long: Enter at the current price 85500, or on a pullback to 83300 (EMA30).
Stop loss: Below 82800.
Targets: Previous high 87385; if it breaks through, watch for 90000!
Short: Only consider shorting if it meets resistance around 88300. The risk is relatively high—beginners, be cautious and don’t touch it.
{future}(BTCUSDT)
$BTC BTC holds at 85500—Is the bull market still on?
Brothers, don’t get scared off by a short-term pullback! From 74900 to 87385, this bullish trend has been absolutely perfect. Now the correction is just a continuation during the uptrend. As long as it doesn’t break below the key support, the bigger picture remains bullish!
Technical breakdown:
The EMA moving averages are in a bullish arrangement, with price staying above the EMA7. MACD is running above the zero line and momentum hasn’t faded. The Bollinger Bands are opening upward, and price/volume are in good alignment. This is a classic case of the strong staying strong!
Trading strategy:
Go with the trend—pullbacks are opportunities!
Long: Enter at the current price 85500, or on a pullback to 83300 (EMA30).
Stop loss: Below 82800.
Targets: Previous high 87385; if it breaks through, watch for 90000!
Short: Only consider shorting if it meets resistance around 88300. The risk is relatively high—beginners, be cautious and don’t touch it.
Brothers, don’t get scared off by a short-term pullback! From 74900 to 87385, this bullish trend has been absolutely perfect. Now the correction is just a continuation during the uptrend. As long as it doesn’t break below the key support, the bigger picture remains bullish!
Technical breakdown:
The EMA moving averages are in a bullish arrangement, with price staying above the EMA7. MACD is running above the zero line and momentum hasn’t faded. The Bollinger Bands are opening upward, and price/volume are in good alignment. This is a classic case of the strong staying strong!
Trading strategy:
Go with the trend—pullbacks are opportunities!
Long: Enter at the current price 85500, or on a pullback to 83300 (EMA30).
Stop loss: Below 82800.
Targets: Previous high 87385; if it breaks through, watch for 90000!
Short: Only consider shorting if it meets resistance around 88300. The risk is relatively high—beginners, be cautious and don’t touch it.
6
319
·
--
Bullish
$BTC Liying discusses coins: 9.22 latest market analysis of Bitcoin (BTC) and Ethereum (ETH)
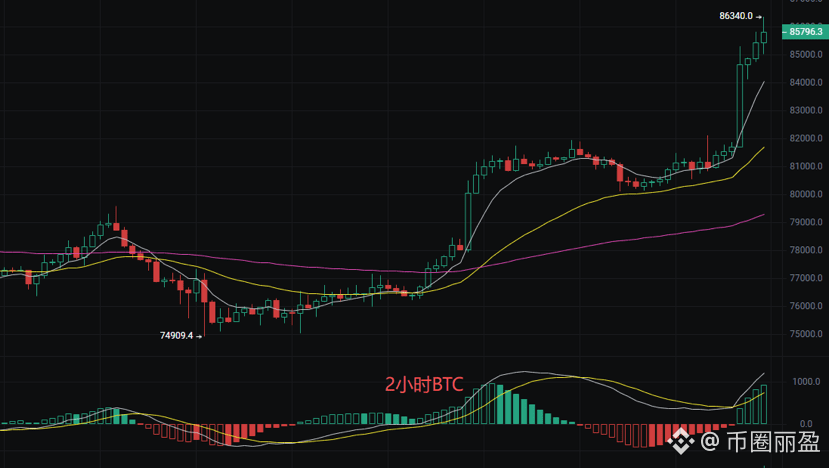
Family members! Bitcoin is currently at 85,800, and the main-position shakeout has ended—now it’s taking off. The current candlestick pattern is very beautiful: a continuous series of big bullish candles has surged, completely breaking away from the bottom’s sideways range. This move is like a sports car that’s been filled with fuel and is now on the highway—there’s huge inertia. As long as the trend doesn’t break, every pullback could be a chance to get on board; the short-term moving averages have extremely strong breakout power. The MACD indicator shows an “in-air refueling” formation. The price has already broken above the upper rail at 85,352, and the Bollinger Bands are opening like a megaphone—this is a classic signal of a one-way explosive surge.
Short-term reference: buy on dips, be cautious when touching the top
Go for “duo” at 84,300; defend at 84,000; stop loss 400 points; target 86,500, aiming for 87,000
Go for “kong” at 87,000; defend at 87,500; stop loss 400 points; target 86,000, aiming for 85,500
Ethereum
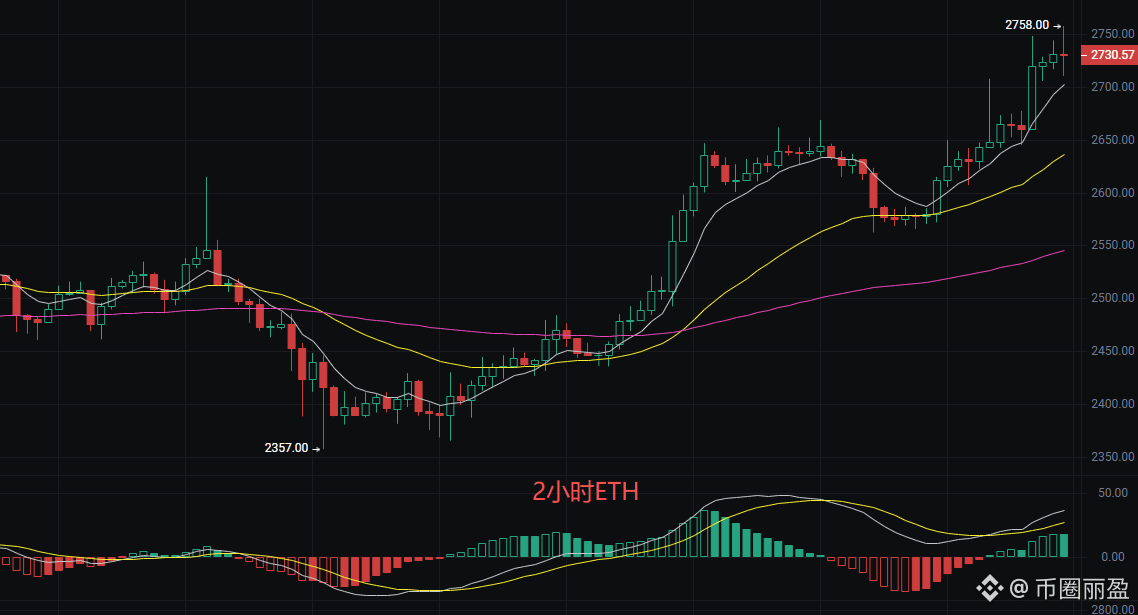
Family members! Ethereum is at 2,730 right now, and the increase over just a few days has been quite significant. Many old friends may have been shaken out during the consolidation earlier, or didn’t dare to chase when prices were high—their minds are itching. Now the price has already risen above all moving averages. This kind of bullish alignment is the strongest signal. The MACD shows no signs of divergence; the price is riding close to the upper rail at 2,747, and the Bollinger Bands’ opening has expanded violently—this is a typical characteristic of a one-way breakout and surge. As long as it doesn’t fall below the mid-band support, any pullback is just a technical correction, not a reversal signal.
Short-term level references
Go for “duo” at 2,700; defend at 2,680; stop loss 40 points; target 2,750, aiming for 2,820
Go for “kong” at 2,790; defend at 2,820; stop loss 40 points; target 2,730, aiming for 2,690
The above content is an original work exclusively by Liying. If you reprint, please indicate the source! The article release review may take some time; market conditions change in an instant. The above suggestions are for reference only—risk is your own responsibility.
{future}(BTCUSDT)
#BTC走势分析 $ETH
{future}(ETHUSDT)
#ETH走势分析
$BTC Liying discusses coins: 9.22 latest market analysis of Bitcoin (BTC) and Ethereum (ETH)
Family members! Bitcoin is currently at 85,800, and the main-position shakeout has ended—now it’s taking off. The current candlestick pattern is very beautiful: a continuous series of big bullish candles has surged, completely breaking away from the bottom’s sideways range. This move is like a sports car that’s been filled with fuel and is now on the highway—there’s huge inertia. As long as the trend doesn’t break, every pullback could be a chance to get on board; the short-term moving averages have extremely strong breakout power. The MACD indicator shows an “in-air refueling” formation. The price has already broken above the upper rail at 85,352, and the Bollinger Bands are opening like a megaphone—this is a classic signal of a one-way explosive surge.
Short-term reference: buy on dips, be cautious when touching the top
Go for “duo” at 84,300; defend at 84,000; stop loss 400 points; target 86,500, aiming for 87,000
Go for “kong” at 87,000; defend at 87,500; stop loss 400 points; target 86,000, aiming for 85,500
Ethereum
Family members! Ethereum is at 2,730 right now, and the increase over just a few days has been quite significant. Many old friends may have been shaken out during the consolidation earlier, or didn’t dare to chase when prices were high—their minds are itching. Now the price has already risen above all moving averages. This kind of bullish alignment is the strongest signal. The MACD shows no signs of divergence; the price is riding close to the upper rail at 2,747, and the Bollinger Bands’ opening has expanded violently—this is a typical characteristic of a one-way breakout and surge. As long as it doesn’t fall below the mid-band support, any pullback is just a technical correction, not a reversal signal.
Short-term level references
Go for “duo” at 2,700; defend at 2,680; stop loss 40 points; target 2,750, aiming for 2,820
Go for “kong” at 2,790; defend at 2,820; stop loss 40 points; target 2,730, aiming for 2,690
The above content is an original work exclusively by Liying. If you reprint, please indicate the source! The article release review may take some time; market conditions change in an instant. The above suggestions are for reference only—risk is your own responsibility.
#BTC走势分析 $ETH
#ETH走势分析
Family members! Bitcoin is currently at 85,800, and the main-position shakeout has ended—now it’s taking off. The current candlestick pattern is very beautiful: a continuous series of big bullish candles has surged, completely breaking away from the bottom’s sideways range. This move is like a sports car that’s been filled with fuel and is now on the highway—there’s huge inertia. As long as the trend doesn’t break, every pullback could be a chance to get on board; the short-term moving averages have extremely strong breakout power. The MACD indicator shows an “in-air refueling” formation. The price has already broken above the upper rail at 85,352, and the Bollinger Bands are opening like a megaphone—this is a classic signal of a one-way explosive surge.
Short-term reference: buy on dips, be cautious when touching the top
Go for “duo” at 84,300; defend at 84,000; stop loss 400 points; target 86,500, aiming for 87,000
Go for “kong” at 87,000; defend at 87,500; stop loss 400 points; target 86,000, aiming for 85,500
Ethereum
Family members! Ethereum is at 2,730 right now, and the increase over just a few days has been quite significant. Many old friends may have been shaken out during the consolidation earlier, or didn’t dare to chase when prices were high—their minds are itching. Now the price has already risen above all moving averages. This kind of bullish alignment is the strongest signal. The MACD shows no signs of divergence; the price is riding close to the upper rail at 2,747, and the Bollinger Bands’ opening has expanded violently—this is a typical characteristic of a one-way breakout and surge. As long as it doesn’t fall below the mid-band support, any pullback is just a technical correction, not a reversal signal.
Short-term level references
Go for “duo” at 2,700; defend at 2,680; stop loss 40 points; target 2,750, aiming for 2,820
Go for “kong” at 2,790; defend at 2,820; stop loss 40 points; target 2,730, aiming for 2,690
The above content is an original work exclusively by Liying. If you reprint, please indicate the source! The article release review may take some time; market conditions change in an instant. The above suggestions are for reference only—risk is your own responsibility.
#BTC走势分析 $ETH
#ETH走势分析
6
2.3k
·
--
Bullish
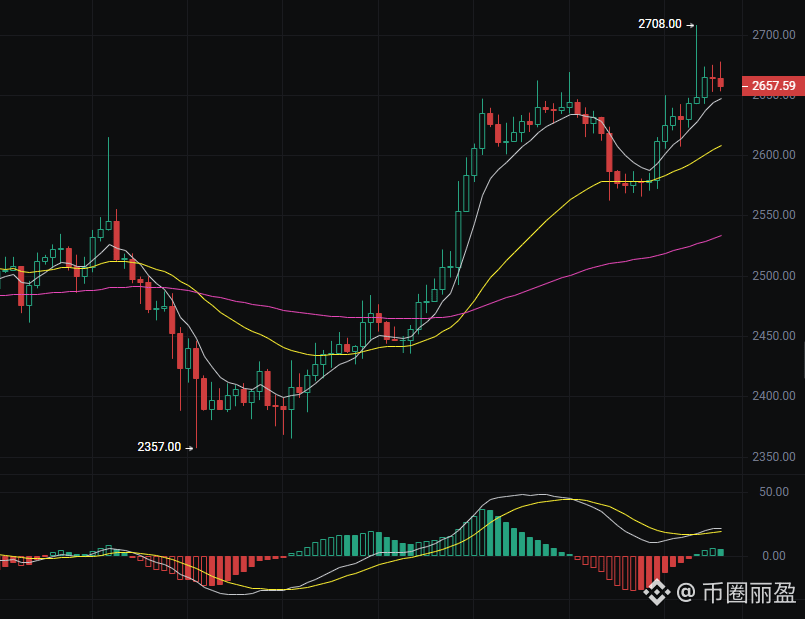
$ETH 多单止盈以后!ETH现价2658,冲高2708后横盘,别慌!
This is a typical “in-flight refueling” pattern.
The main players are shaking out positions to build up momentum, and the big direction remains upward.
From a technical perspective: the EMA moving averages are in a bullish alignment, and the price is holding above EMA7 (2647).
Although MACD’s momentum at high levels is weakening, it’s still within normal corrective behavior.
The Bollinger middle band at 2620 forms strong support—so long as it doesn’t break downward, this pullback remains healthy.
Trading plan:
Primarily go long on dips: enter after price stabilizes in the 2620–2630 range. Stop loss at 2600. Target is a break above 2700.
Minor short as a supplement: if price rebounds to 2700 and fails there, take a small-position short. Stop loss at 2715. Look for a move back to 2650.
What matters now is patience. Don’t blindly chase or panic-sell. Set your stop losses properly and steadily take profits.
{future}(ETHUSDT)
#ETH contract
$ETH 多单止盈以后!ETH现价2658,冲高2708后横盘,别慌!
This is a typical “in-flight refueling” pattern.
The main players are shaking out positions to build up momentum, and the big direction remains upward.
From a technical perspective: the EMA moving averages are in a bullish alignment, and the price is holding above EMA7 (2647).
Although MACD’s momentum at high levels is weakening, it’s still within normal corrective behavior.
The Bollinger middle band at 2620 forms strong support—so long as it doesn’t break downward, this pullback remains healthy.
Trading plan:
Primarily go long on dips: enter after price stabilizes in the 2620–2630 range. Stop loss at 2600. Target is a break above 2700.
Minor short as a supplement: if price rebounds to 2700 and fails there, take a small-position short. Stop loss at 2715. Look for a move back to 2650.
What matters now is patience. Don’t blindly chase or panic-sell. Set your stop losses properly and steadily take profits.
#ETH contract
This is a typical “in-flight refueling” pattern.
The main players are shaking out positions to build up momentum, and the big direction remains upward.
From a technical perspective: the EMA moving averages are in a bullish alignment, and the price is holding above EMA7 (2647).
Although MACD’s momentum at high levels is weakening, it’s still within normal corrective behavior.
The Bollinger middle band at 2620 forms strong support—so long as it doesn’t break downward, this pullback remains healthy.
Trading plan:
Primarily go long on dips: enter after price stabilizes in the 2620–2630 range. Stop loss at 2600. Target is a break above 2700.
Minor short as a supplement: if price rebounds to 2700 and fails there, take a small-position short. Stop loss at 2715. Look for a move back to 2650.
What matters now is patience. Don’t blindly chase or panic-sell. Set your stop losses properly and steadily take profits.
#ETH contract
6
771
·
--
Bullish
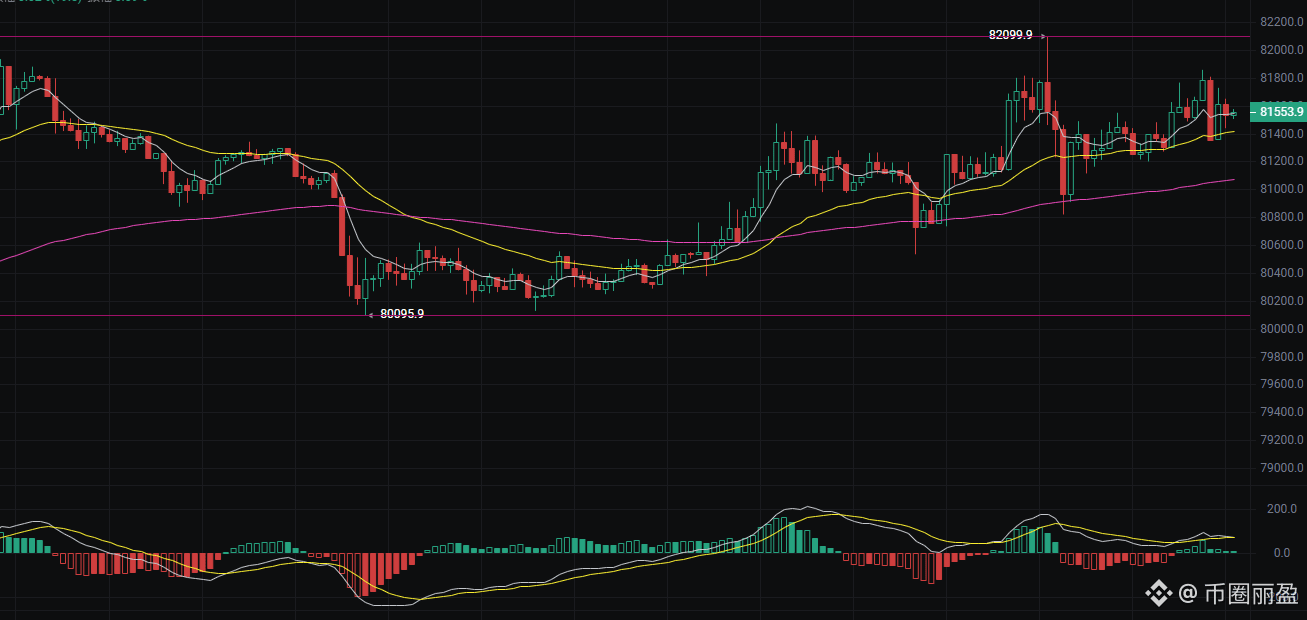
$BTC Liying 80500, after taking profit, what’s the next step? Bitcoin current price 81600
I just reversed V-shape from the 74,900 deep dip. Now the price is consolidating in a high range and building up energy. The bigger trend still looks bullish.
The EMA moving averages are in a bullish alignment, and the price has held above all moving averages.
The MACD red bars are shrinking, but the fast and slow lines have not crossed to bearish. This is a strong consolidation.
The Bollinger Bands show the price moving along the middle band, and the upper band at 81762 is short-term resistance.
In terms of trading:
Go long on a pullback to 81,000–81,200 (around the EMA7), stop loss below 80,500, target the previous high at 82,282.
If it breaks below 80,000, you can go long again at 79,200–79,500, stop loss 78,800.
For shorts: only the aggressive may try a light short position at 82,200–82,300, stop loss 82,600, target 81,000.
Trade with the trend, hold your positions firmly, and don’t get shaken out of the car.
{future}(BTCUSDT)
#BTC走势分析
$BTC Liying 80500, after taking profit, what’s the next step? Bitcoin current price 81600
I just reversed V-shape from the 74,900 deep dip. Now the price is consolidating in a high range and building up energy. The bigger trend still looks bullish.
The EMA moving averages are in a bullish alignment, and the price has held above all moving averages.
The MACD red bars are shrinking, but the fast and slow lines have not crossed to bearish. This is a strong consolidation.
The Bollinger Bands show the price moving along the middle band, and the upper band at 81762 is short-term resistance.
In terms of trading:
Go long on a pullback to 81,000–81,200 (around the EMA7), stop loss below 80,500, target the previous high at 82,282.
If it breaks below 80,000, you can go long again at 79,200–79,500, stop loss 78,800.
For shorts: only the aggressive may try a light short position at 82,200–82,300, stop loss 82,600, target 81,000.
Trade with the trend, hold your positions firmly, and don’t get shaken out of the car.
#BTC走势分析
I just reversed V-shape from the 74,900 deep dip. Now the price is consolidating in a high range and building up energy. The bigger trend still looks bullish.
The EMA moving averages are in a bullish alignment, and the price has held above all moving averages.
The MACD red bars are shrinking, but the fast and slow lines have not crossed to bearish. This is a strong consolidation.
The Bollinger Bands show the price moving along the middle band, and the upper band at 81762 is short-term resistance.
In terms of trading:
Go long on a pullback to 81,000–81,200 (around the EMA7), stop loss below 80,500, target the previous high at 82,282.
If it breaks below 80,000, you can go long again at 79,200–79,500, stop loss 78,800.
For shorts: only the aggressive may try a light short position at 82,200–82,300, stop loss 82,600, target 81,000.
Trade with the trend, hold your positions firmly, and don’t get shaken out of the car.
#BTC走势分析
6
272
·
--
Bullish
$BTC Liying Discusses Coin: BTC (Bitcoin) and ETH (Ethereum) latest market analysis for 9.21
Family members! Bitcoin is currently at 80,700, and it is right now hovering around the Bollinger Band midline. At times like this, it really tests your mindset: chasing higher risks getting trapped in a stop-out, while buying the dip risks buying halfway down. From the chart, the uptrend hasn’t actually broken—it's just that the price has risen too much and needs to pause. This current level is like an intersection: a breakout upward could trigger a new round of gains; if it breaks down below key support, it may lead to a deeper pullback. The EMA moving-average system shows a classic bullish alignment. The MACD indicator has shown a preliminary bearish divergence pattern—both DIF and DEA are above the zero line—yet overall the indicators suggest the market is in a strong consolidation phase: bulls haven’t lost control, but bears have started to test the waters with a counterattack. Be alert to the risk of range-bound volatility at high levels.
Short-term trading ideas for reference:
For “buy-the-dip” thinking, wait for the price to break below 80,200 and confirm that the rebound lacks strength. Place the stop loss above 80,800. Targets: look for 79,500–79,000.
For “buy-on-the-break” thinking, go at 81,000. Defend at 80,500. Stop loss: 400 points. Target 82,500, with an eye on 85,000.
Ethereum
Family members! Ethereum is at 2,600 right now—many people are asking: is this a “reverse parking and pick-up” move or standing guard at a high level? Don’t panic. The bigger trend is still in the hands of the bulls. Sure, it has pulled back, but it hasn’t broken key support. The moving-average system also hasn’t fully turned bearish, which suggests the main force hasn’t left. In the short term, the technical indicators still show a bullish moving-average alignment, but the MACD has formed a dead cross and the green histogram continues to expand, indicating that short-term momentum is weakening. The Bollinger Band midline at 2,613 creates overhead resistance, and the price is currently testing support at the lower band, 2,563. If the price can hold 2,563 and rebound with volume, the trend may continue; if it breaks below that level, it could probe further down toward the 2,500 area. Overall, it is in a “bullish continuation” consolidation pattern during an upward pause—be cautious about the risk of a false breakout.
Short-term level references
For “buy-on-dip” thinking: enter around 2,570. Defend at 2,560. Stop loss: 40 points. Target 2,600, aiming for 2,650.
For “buy-on-the-break” thinking: enter around 2,680. Defend at 2,700. Stop loss: 40 points. Target 2,640, aiming for 2,610.
The above content is exclusively original by Liying. If you repost it, please indicate the source. There may be a delay in the review/publishing of the article. Since market conditions change instantly, the suggestions above are for reference only—risks are yours to bear.
{future}(BTCUSDT)
$ETH
{future}(ETHUSDT)
#BTC走势分析 #ETH走势分析
$BTC Liying Discusses Coin: BTC (Bitcoin) and ETH (Ethereum) latest market analysis for 9.21
Family members! Bitcoin is currently at 80,700, and it is right now hovering around the Bollinger Band midline. At times like this, it really tests your mindset: chasing higher risks getting trapped in a stop-out, while buying the dip risks buying halfway down. From the chart, the uptrend hasn’t actually broken—it's just that the price has risen too much and needs to pause. This current level is like an intersection: a breakout upward could trigger a new round of gains; if it breaks down below key support, it may lead to a deeper pullback. The EMA moving-average system shows a classic bullish alignment. The MACD indicator has shown a preliminary bearish divergence pattern—both DIF and DEA are above the zero line—yet overall the indicators suggest the market is in a strong consolidation phase: bulls haven’t lost control, but bears have started to test the waters with a counterattack. Be alert to the risk of range-bound volatility at high levels.
Short-term trading ideas for reference:
For “buy-the-dip” thinking, wait for the price to break below 80,200 and confirm that the rebound lacks strength. Place the stop loss above 80,800. Targets: look for 79,500–79,000.
For “buy-on-the-break” thinking, go at 81,000. Defend at 80,500. Stop loss: 400 points. Target 82,500, with an eye on 85,000.
Ethereum
Family members! Ethereum is at 2,600 right now—many people are asking: is this a “reverse parking and pick-up” move or standing guard at a high level? Don’t panic. The bigger trend is still in the hands of the bulls. Sure, it has pulled back, but it hasn’t broken key support. The moving-average system also hasn’t fully turned bearish, which suggests the main force hasn’t left. In the short term, the technical indicators still show a bullish moving-average alignment, but the MACD has formed a dead cross and the green histogram continues to expand, indicating that short-term momentum is weakening. The Bollinger Band midline at 2,613 creates overhead resistance, and the price is currently testing support at the lower band, 2,563. If the price can hold 2,563 and rebound with volume, the trend may continue; if it breaks below that level, it could probe further down toward the 2,500 area. Overall, it is in a “bullish continuation” consolidation pattern during an upward pause—be cautious about the risk of a false breakout.
Short-term level references
For “buy-on-dip” thinking: enter around 2,570. Defend at 2,560. Stop loss: 40 points. Target 2,600, aiming for 2,650.
For “buy-on-the-break” thinking: enter around 2,680. Defend at 2,700. Stop loss: 40 points. Target 2,640, aiming for 2,610.
The above content is exclusively original by Liying. If you repost it, please indicate the source. There may be a delay in the review/publishing of the article. Since market conditions change instantly, the suggestions above are for reference only—risks are yours to bear.
$ETH
#BTC走势分析 #ETH走势分析
Family members! Bitcoin is currently at 80,700, and it is right now hovering around the Bollinger Band midline. At times like this, it really tests your mindset: chasing higher risks getting trapped in a stop-out, while buying the dip risks buying halfway down. From the chart, the uptrend hasn’t actually broken—it's just that the price has risen too much and needs to pause. This current level is like an intersection: a breakout upward could trigger a new round of gains; if it breaks down below key support, it may lead to a deeper pullback. The EMA moving-average system shows a classic bullish alignment. The MACD indicator has shown a preliminary bearish divergence pattern—both DIF and DEA are above the zero line—yet overall the indicators suggest the market is in a strong consolidation phase: bulls haven’t lost control, but bears have started to test the waters with a counterattack. Be alert to the risk of range-bound volatility at high levels.
Short-term trading ideas for reference:
For “buy-the-dip” thinking, wait for the price to break below 80,200 and confirm that the rebound lacks strength. Place the stop loss above 80,800. Targets: look for 79,500–79,000.
For “buy-on-the-break” thinking, go at 81,000. Defend at 80,500. Stop loss: 400 points. Target 82,500, with an eye on 85,000.
Ethereum
Family members! Ethereum is at 2,600 right now—many people are asking: is this a “reverse parking and pick-up” move or standing guard at a high level? Don’t panic. The bigger trend is still in the hands of the bulls. Sure, it has pulled back, but it hasn’t broken key support. The moving-average system also hasn’t fully turned bearish, which suggests the main force hasn’t left. In the short term, the technical indicators still show a bullish moving-average alignment, but the MACD has formed a dead cross and the green histogram continues to expand, indicating that short-term momentum is weakening. The Bollinger Band midline at 2,613 creates overhead resistance, and the price is currently testing support at the lower band, 2,563. If the price can hold 2,563 and rebound with volume, the trend may continue; if it breaks below that level, it could probe further down toward the 2,500 area. Overall, it is in a “bullish continuation” consolidation pattern during an upward pause—be cautious about the risk of a false breakout.
Short-term level references
For “buy-on-dip” thinking: enter around 2,570. Defend at 2,560. Stop loss: 40 points. Target 2,600, aiming for 2,650.
For “buy-on-the-break” thinking: enter around 2,680. Defend at 2,700. Stop loss: 40 points. Target 2,640, aiming for 2,610.
The above content is exclusively original by Liying. If you repost it, please indicate the source. There may be a delay in the review/publishing of the article. Since market conditions change instantly, the suggestions above are for reference only—risks are yours to bear.
$ETH
#BTC走势分析 #ETH走势分析
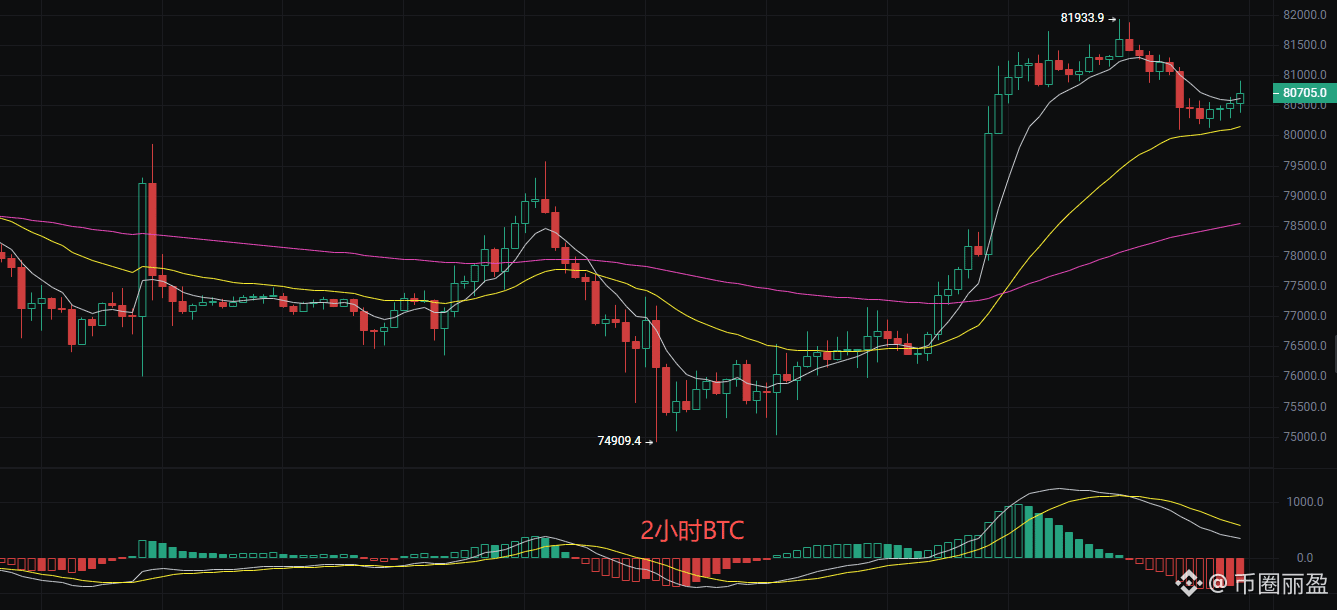
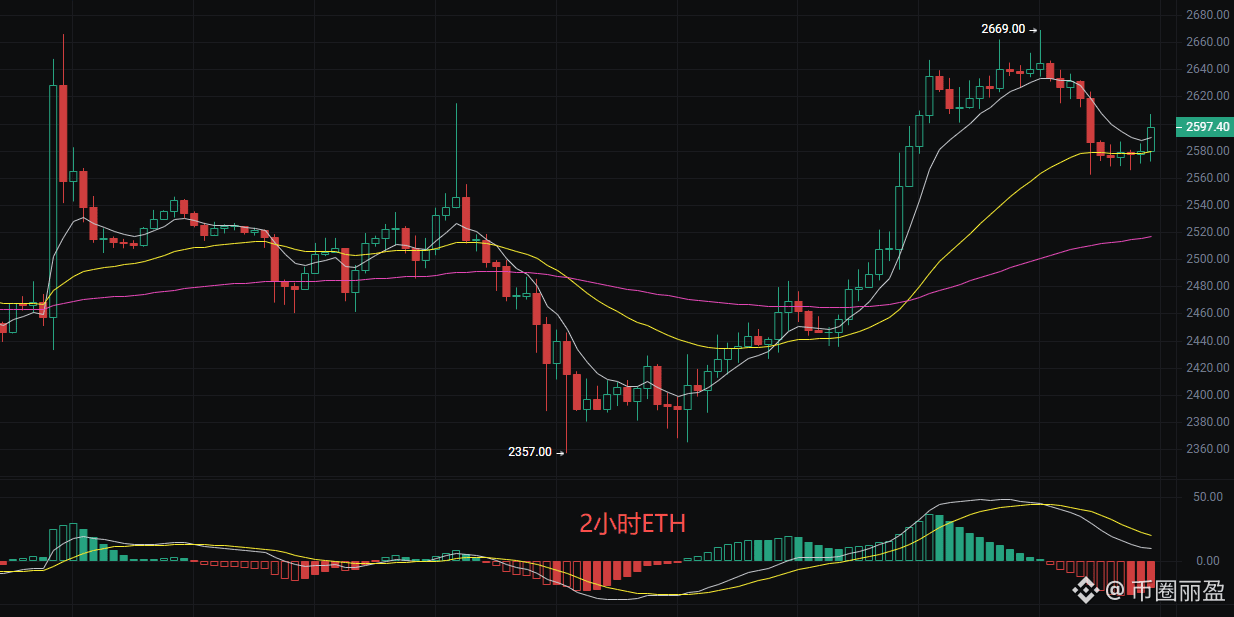
5
871
Log in to explore more content
Join global crypto users on Binance Square
⚡️ Get latest and useful information about crypto.
💬 Trusted by the world’s largest crypto exchange.
👍 Discover real insights from verified creators.
Email / Phone number
Trending Topics
BitwiseFilesFinalNEARSpotETFProspectus
79,167 views
1,341 Discussing
#bitwisefilesfinalnearspotetfprospectus
Can $NEAR REALLY reach $562 with an ETF approval? 🚀
The crypto market is buzzing as Bitwise files its final prospectus for a Spot NEAR ETF (Ticker: NRR on NYSE Arca)! 📊🔥
Is institutional money about to unleash the biggest pump in NEAR’s history? Analysts are throwing around mind-blowing price targets:
🎯 Intermediate Target: $155
🎯 2030 Long-Term Target: $562
💡 Let's do the math:
At $562, $NEAR would sit at roughly a $680 Billion market cap—putting it right up there with Ethereum's potential valuation. With NEAR leading the Chain Abstraction & AI crypto narrative, this might not be as crazy as it sounds!
With SEC regulations turning more crypto-friendly and Wall Street knocking on the door, are you Accumulating or Holding?
👇 Drop your realistic price prediction for $NEAR in the comments! 👇
#BitwiseFilesFinalNEARSpotETFProspectus #Altcoins #CryptoNews #ETF
Doomsday-Trader
·6 Likes
·3.6k views
BitgetHackerMoves$83MStolenXRP
31,254 views
159 Discussing
SOLSpotETFWeeklyInflow$188M
20,428 views
130 Discussing