$BTC Liying Discusses Coin: BTC (Bitcoin) and ETH (Ethereum) latest market analysis for 9.21
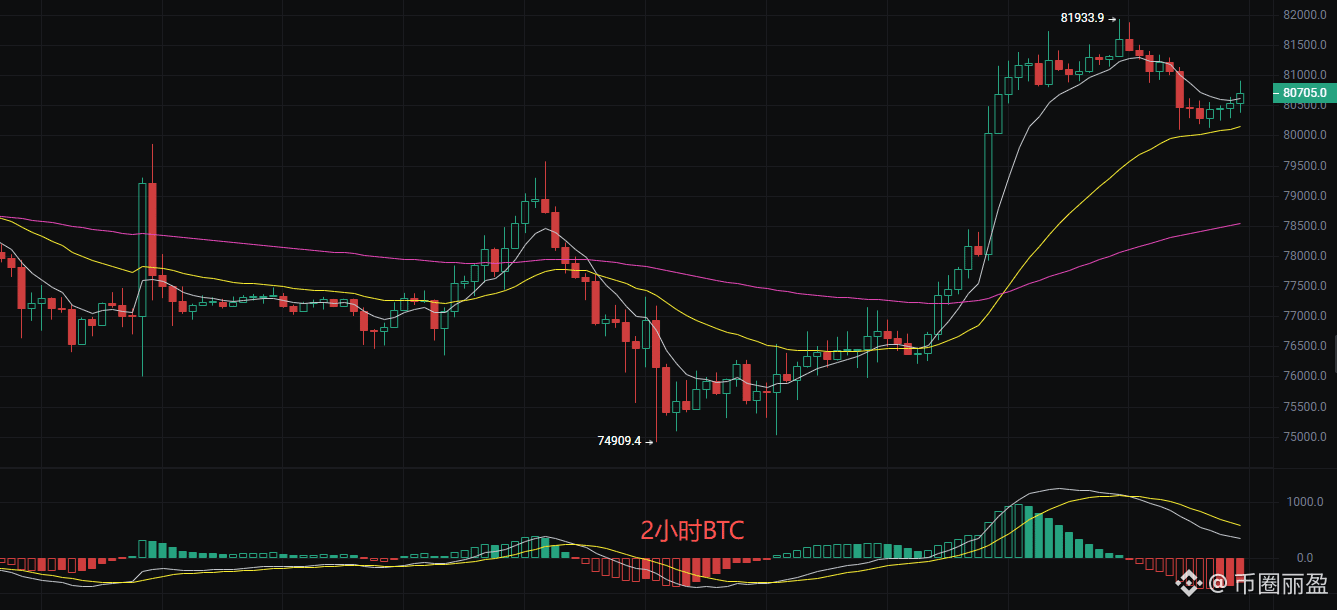
Family members! Bitcoin is currently at 80,700, and it is right now hovering around the Bollinger Band midline. At times like this, it really tests your mindset: chasing higher risks getting trapped in a stop-out, while buying the dip risks buying halfway down. From the chart, the uptrend hasn’t actually broken—it's just that the price has risen too much and needs to pause. This current level is like an intersection: a breakout upward could trigger a new round of gains; if it breaks down below key support, it may lead to a deeper pullback. The EMA moving-average system shows a classic bullish alignment. The MACD indicator has shown a preliminary bearish divergence pattern—both DIF and DEA are above the zero line—yet overall the indicators suggest the market is in a strong consolidation phase: bulls haven’t lost control, but bears have started to test the waters with a counterattack. Be alert to the risk of range-bound volatility at high levels.
Short-term trading ideas for reference:
For “buy-the-dip” thinking, wait for the price to break below 80,200 and confirm that the rebound lacks strength. Place the stop loss above 80,800. Targets: look for 79,500–79,000.
For “buy-on-the-break” thinking, go at 81,000. Defend at 80,500. Stop loss: 400 points. Target 82,500, with an eye on 85,000.
Ethereum
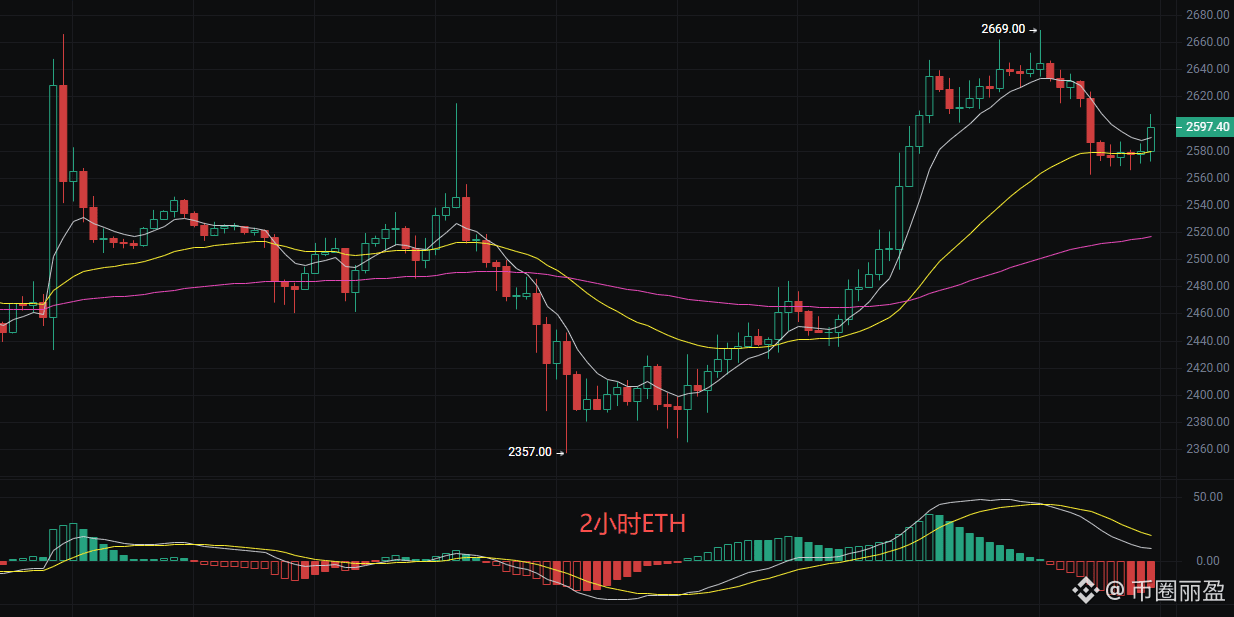
Family members! Ethereum is at 2,600 right now—many people are asking: is this a “reverse parking and pick-up” move or standing guard at a high level? Don’t panic. The bigger trend is still in the hands of the bulls. Sure, it has pulled back, but it hasn’t broken key support. The moving-average system also hasn’t fully turned bearish, which suggests the main force hasn’t left. In the short term, the technical indicators still show a bullish moving-average alignment, but the MACD has formed a dead cross and the green histogram continues to expand, indicating that short-term momentum is weakening. The Bollinger Band midline at 2,613 creates overhead resistance, and the price is currently testing support at the lower band, 2,563. If the price can hold 2,563 and rebound with volume, the trend may continue; if it breaks below that level, it could probe further down toward the 2,500 area. Overall, it is in a “bullish continuation” consolidation pattern during an upward pause—be cautious about the risk of a false breakout.
Short-term level references
For “buy-on-dip” thinking: enter around 2,570. Defend at 2,560. Stop loss: 40 points. Target 2,600, aiming for 2,650.
For “buy-on-the-break” thinking: enter around 2,680. Defend at 2,700. Stop loss: 40 points. Target 2,640, aiming for 2,610.
The above content is exclusively original by Liying. If you repost it, please indicate the source. There may be a delay in the review/publishing of the article. Since market conditions change instantly, the suggestions above are for reference only—risks are yours to bear.
$ETH
#BTC走势分析 #ETH走势分析
Family members! Bitcoin is currently at 80,700, and it is right now hovering around the Bollinger Band midline. At times like this, it really tests your mindset: chasing higher risks getting trapped in a stop-out, while buying the dip risks buying halfway down. From the chart, the uptrend hasn’t actually broken—it's just that the price has risen too much and needs to pause. This current level is like an intersection: a breakout upward could trigger a new round of gains; if it breaks down below key support, it may lead to a deeper pullback. The EMA moving-average system shows a classic bullish alignment. The MACD indicator has shown a preliminary bearish divergence pattern—both DIF and DEA are above the zero line—yet overall the indicators suggest the market is in a strong consolidation phase: bulls haven’t lost control, but bears have started to test the waters with a counterattack. Be alert to the risk of range-bound volatility at high levels.
Short-term trading ideas for reference:
For “buy-the-dip” thinking, wait for the price to break below 80,200 and confirm that the rebound lacks strength. Place the stop loss above 80,800. Targets: look for 79,500–79,000.
For “buy-on-the-break” thinking, go at 81,000. Defend at 80,500. Stop loss: 400 points. Target 82,500, with an eye on 85,000.
Ethereum
Family members! Ethereum is at 2,600 right now—many people are asking: is this a “reverse parking and pick-up” move or standing guard at a high level? Don’t panic. The bigger trend is still in the hands of the bulls. Sure, it has pulled back, but it hasn’t broken key support. The moving-average system also hasn’t fully turned bearish, which suggests the main force hasn’t left. In the short term, the technical indicators still show a bullish moving-average alignment, but the MACD has formed a dead cross and the green histogram continues to expand, indicating that short-term momentum is weakening. The Bollinger Band midline at 2,613 creates overhead resistance, and the price is currently testing support at the lower band, 2,563. If the price can hold 2,563 and rebound with volume, the trend may continue; if it breaks below that level, it could probe further down toward the 2,500 area. Overall, it is in a “bullish continuation” consolidation pattern during an upward pause—be cautious about the risk of a false breakout.
Short-term level references
For “buy-on-dip” thinking: enter around 2,570. Defend at 2,560. Stop loss: 40 points. Target 2,600, aiming for 2,650.
For “buy-on-the-break” thinking: enter around 2,680. Defend at 2,700. Stop loss: 40 points. Target 2,640, aiming for 2,610.
The above content is exclusively original by Liying. If you repost it, please indicate the source. There may be a delay in the review/publishing of the article. Since market conditions change instantly, the suggestions above are for reference only—risks are yours to bear.
$ETH
#BTC走势分析 #ETH走势分析