
Crypto Santara
33 Posts

Crypto Santara
🇲🇨
1 Following
72 Followers
57 Liked
Posts
Portfolio
All
Quotes
PINNED
"The market is an ever-evolving narrative. Our challenge is to read between the lines and uncover the untold story."
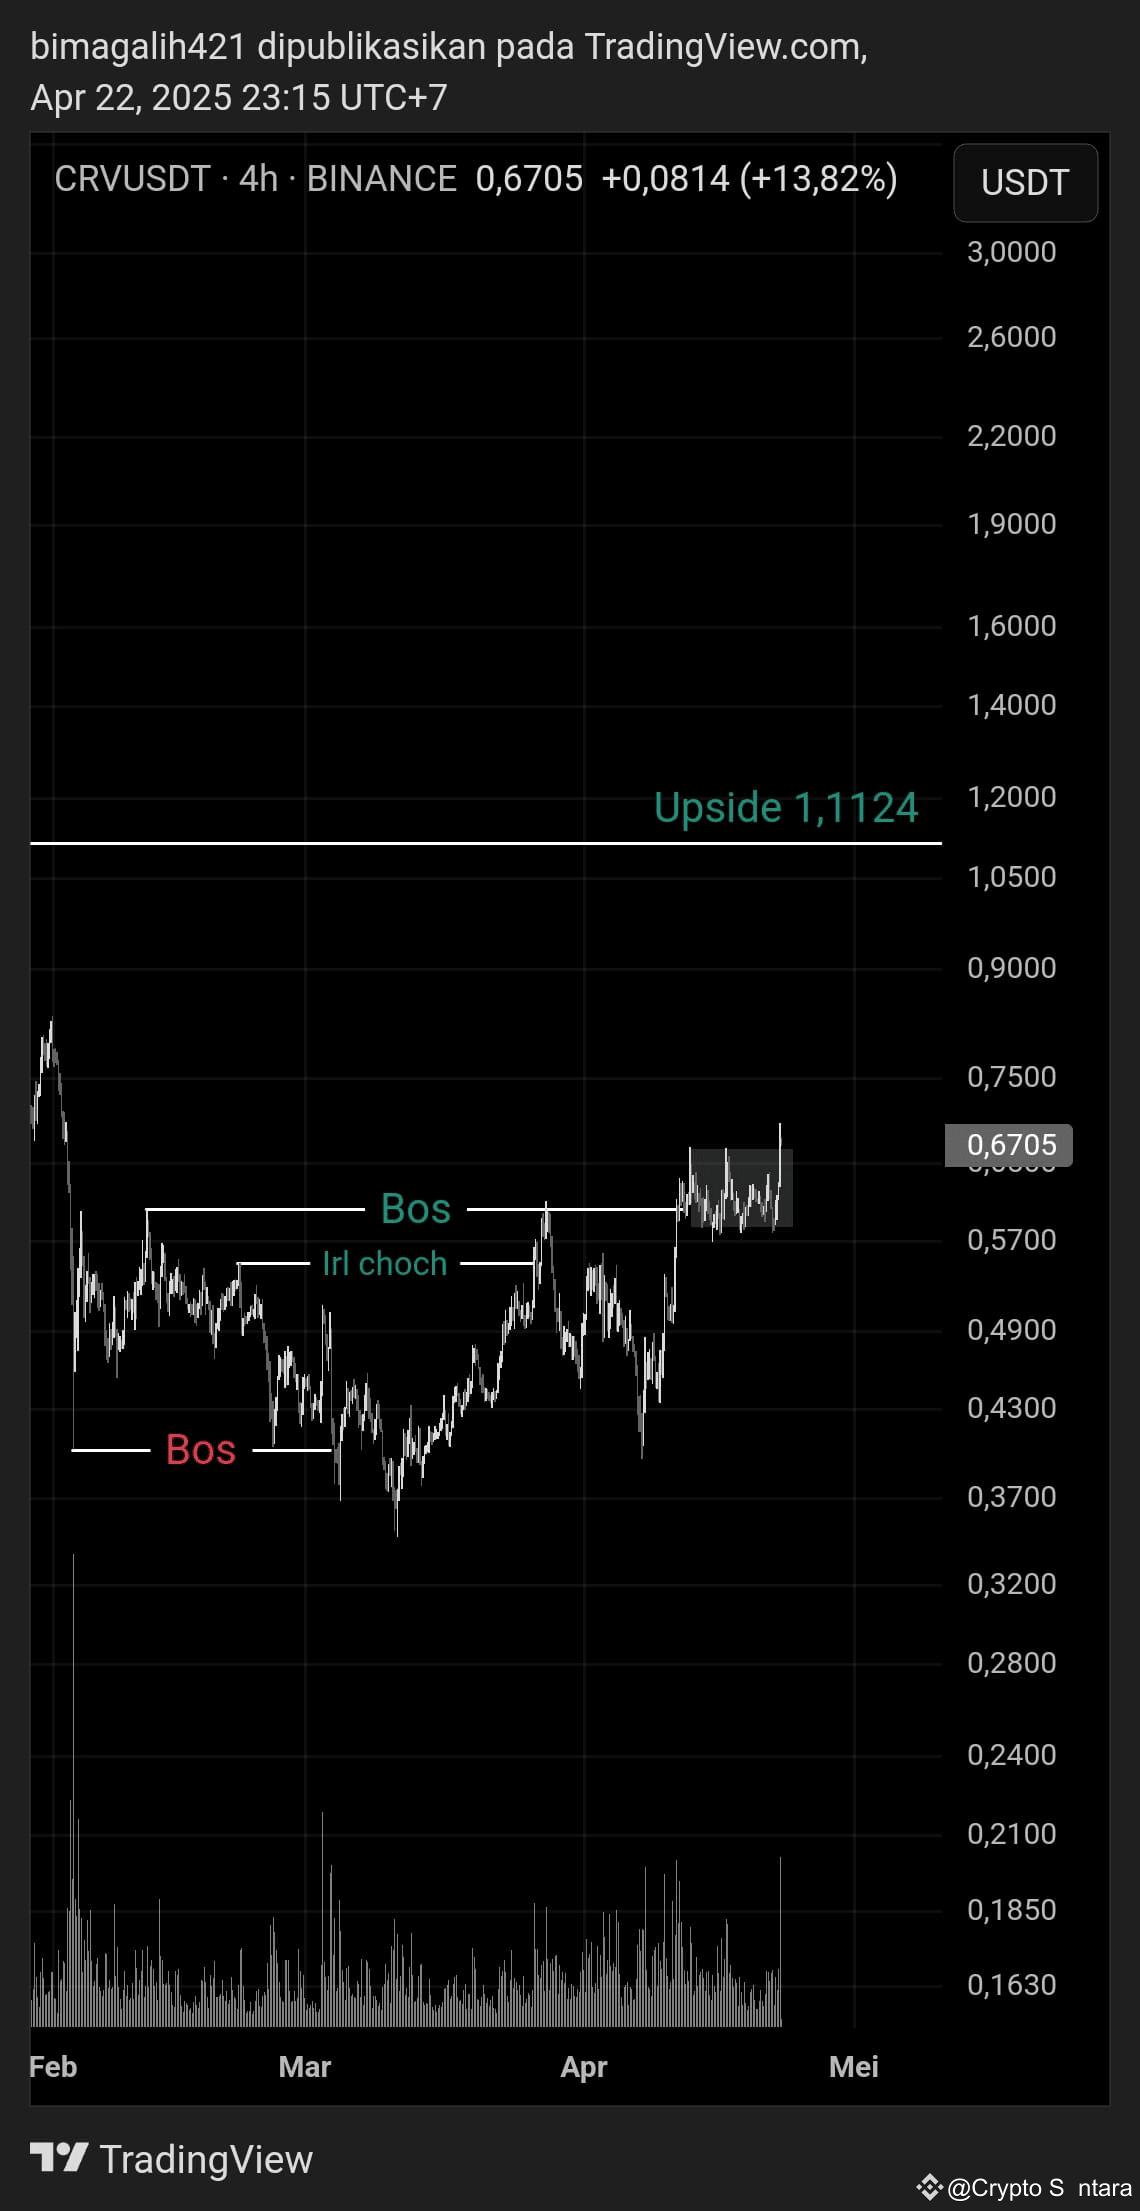
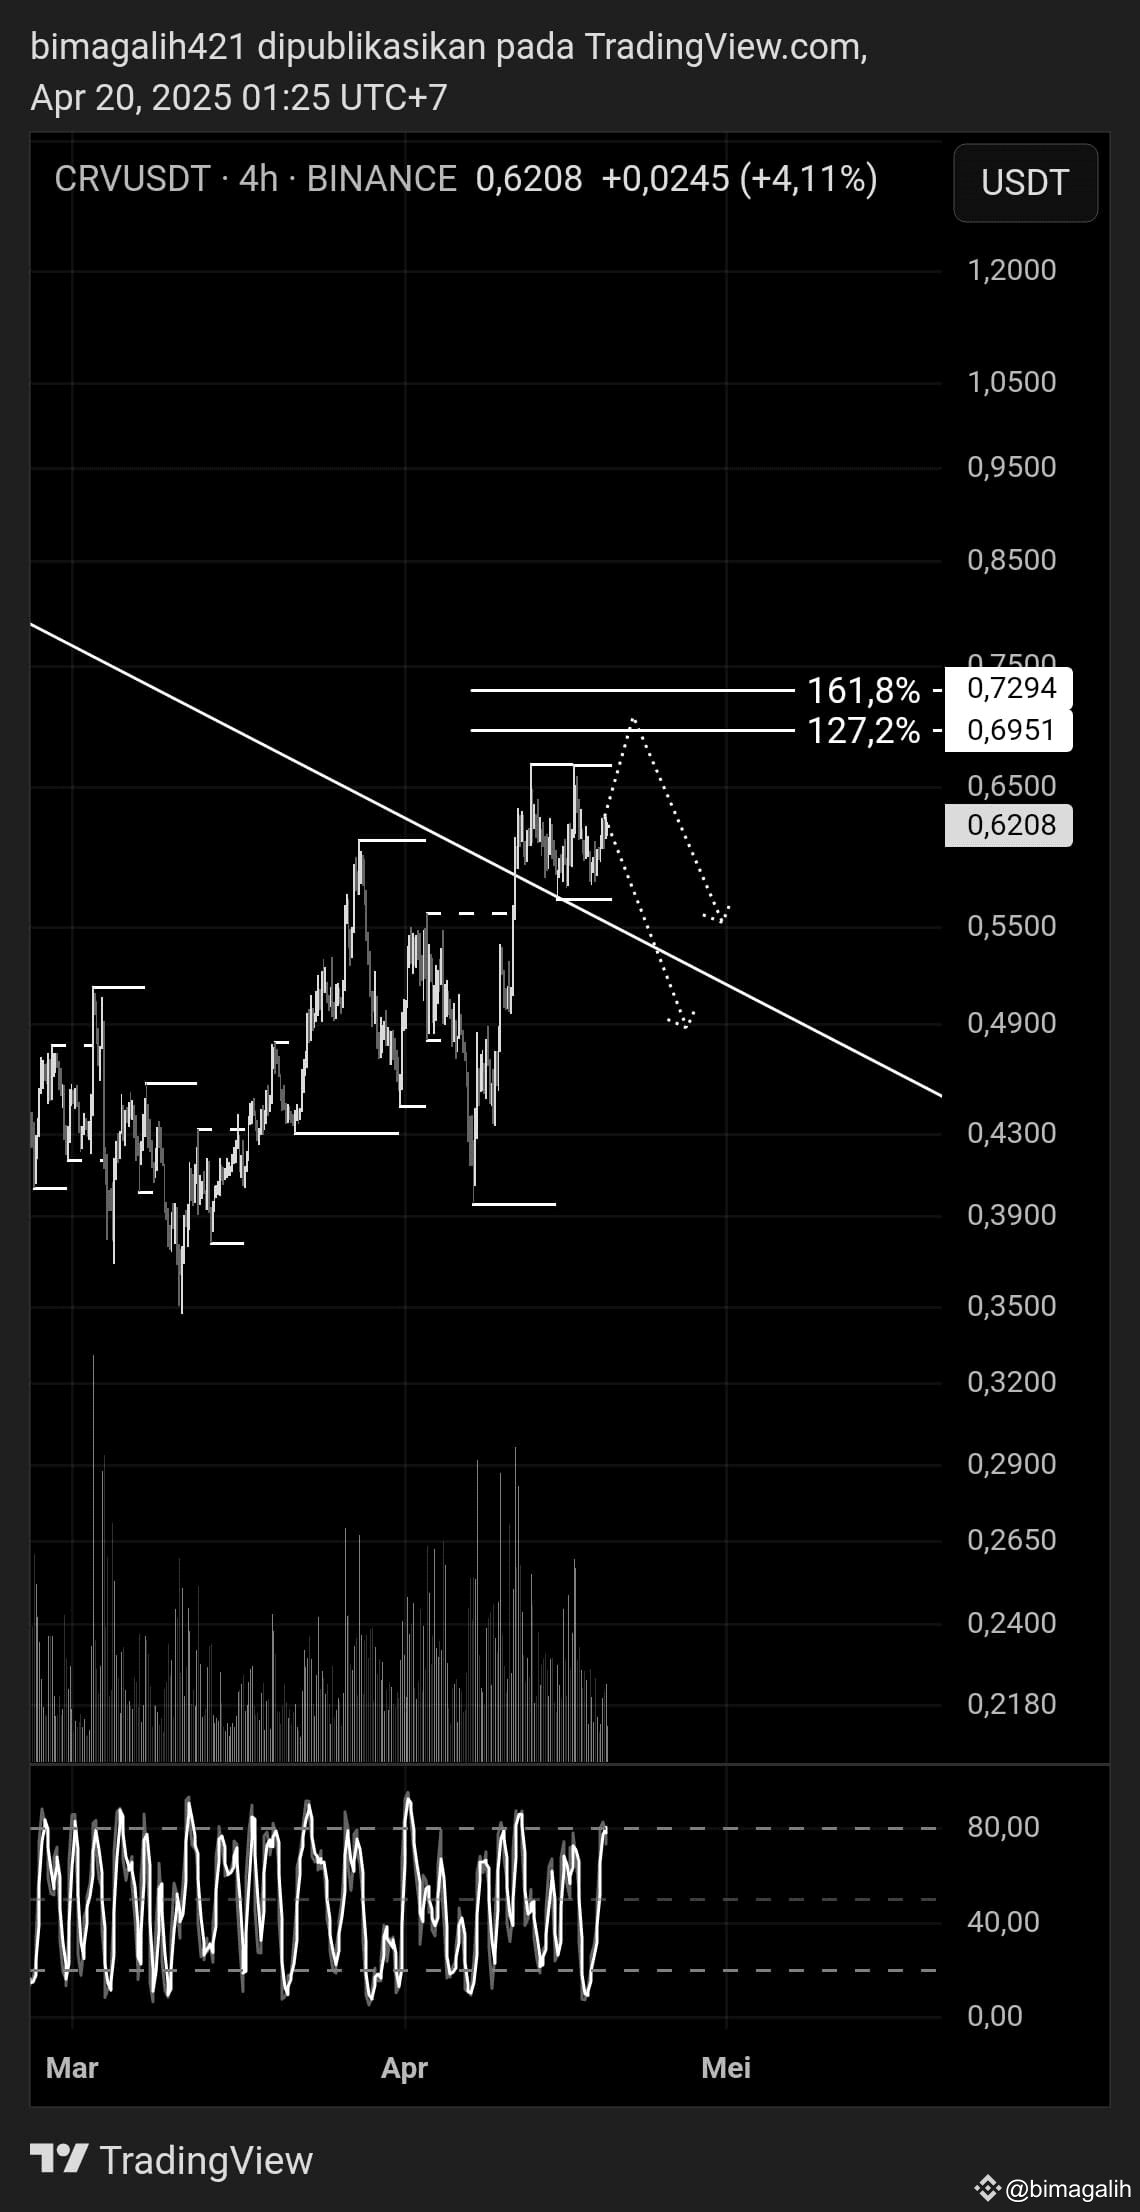
$CRV – Revised Analysis. The price structure of $CRV now appears bullish. Currently, $CRV has successfully broken out of its consolidation area. The potential upside is at the $1.1124 level.
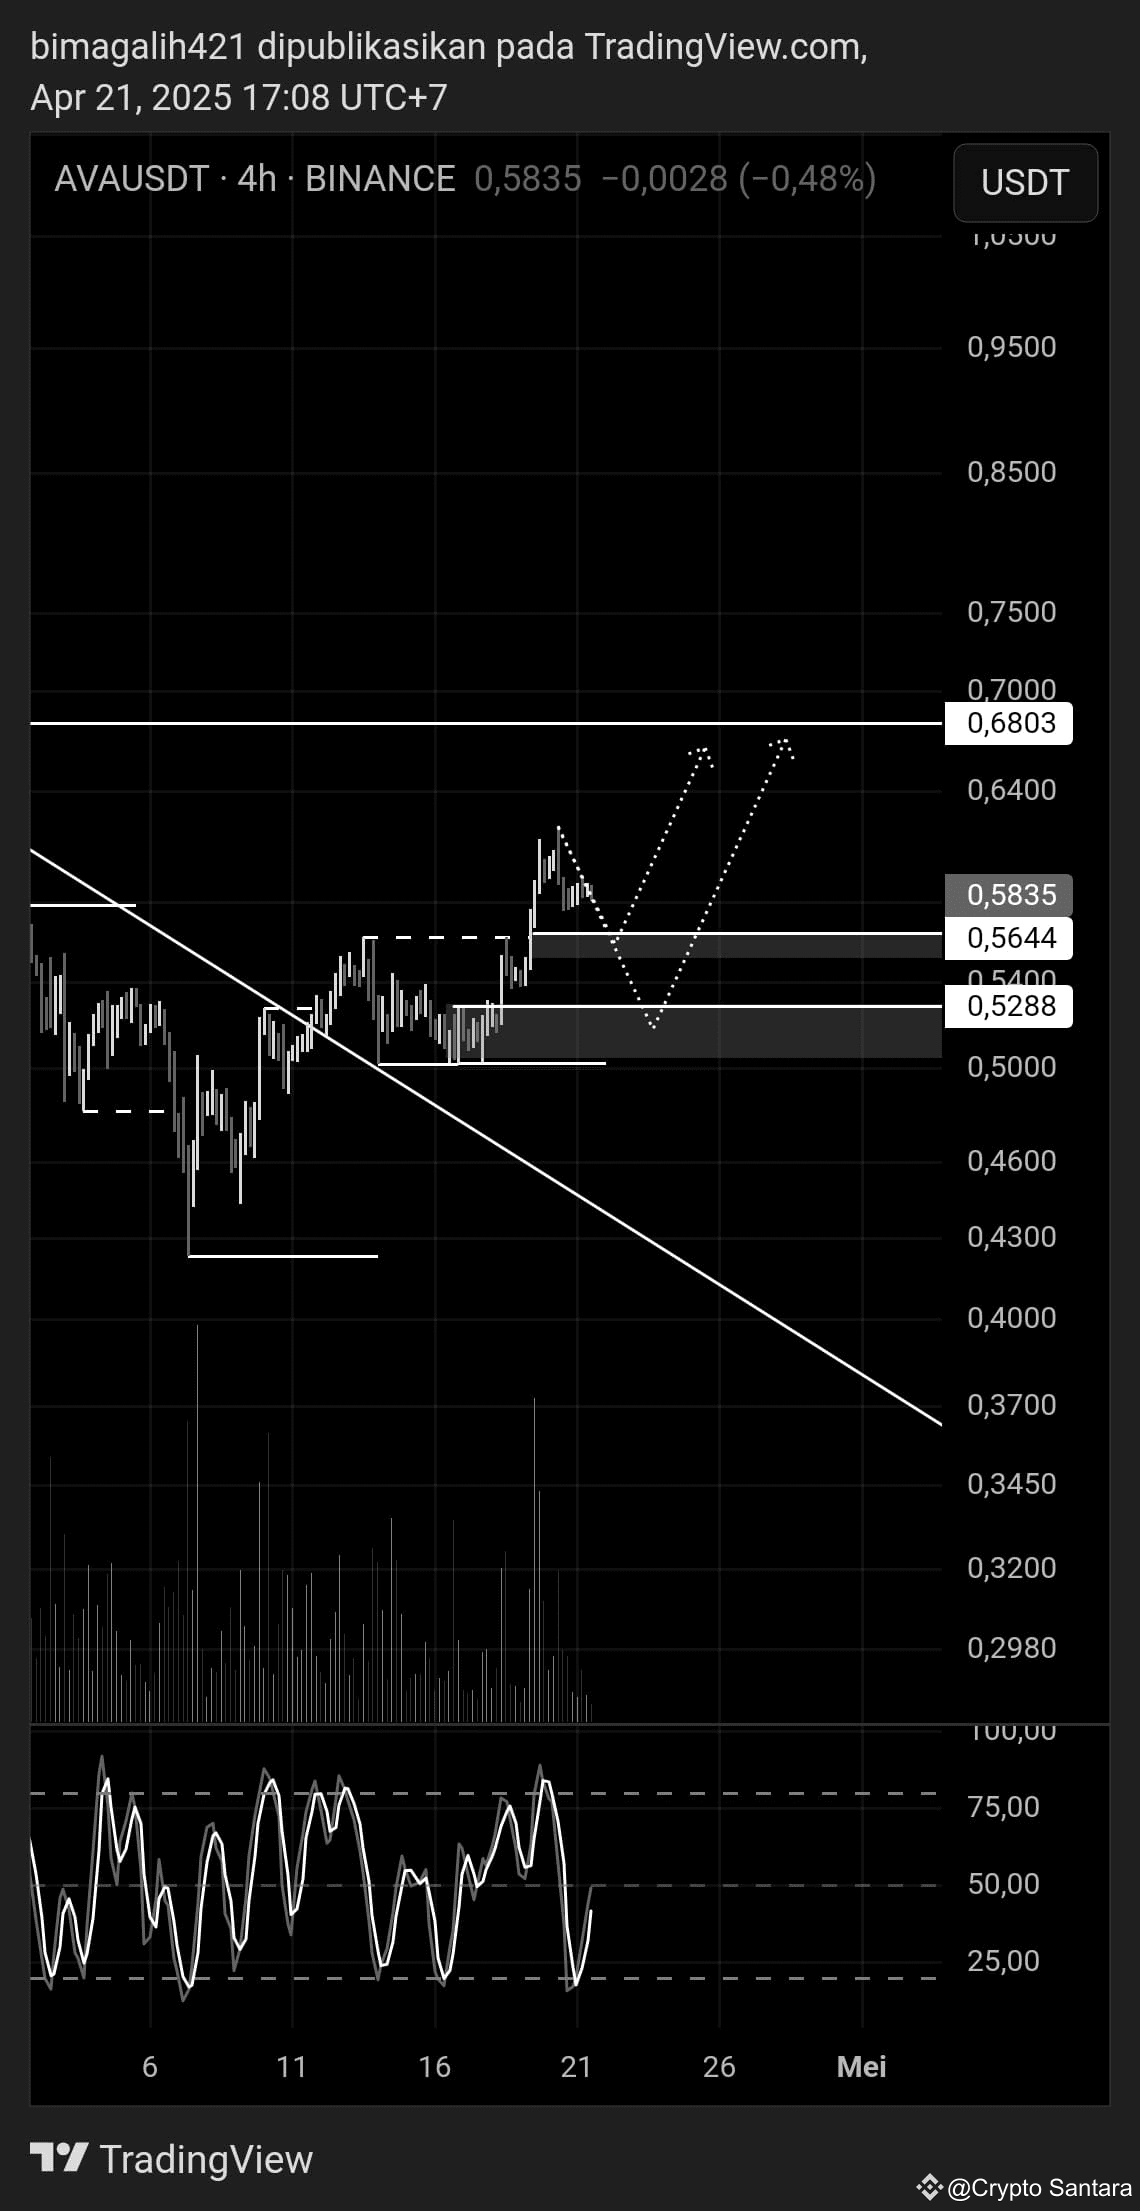
The bullish trend on $AVA has begun. Currently, the price has the potential to undergo a healthy correction before continuing its upward movement.
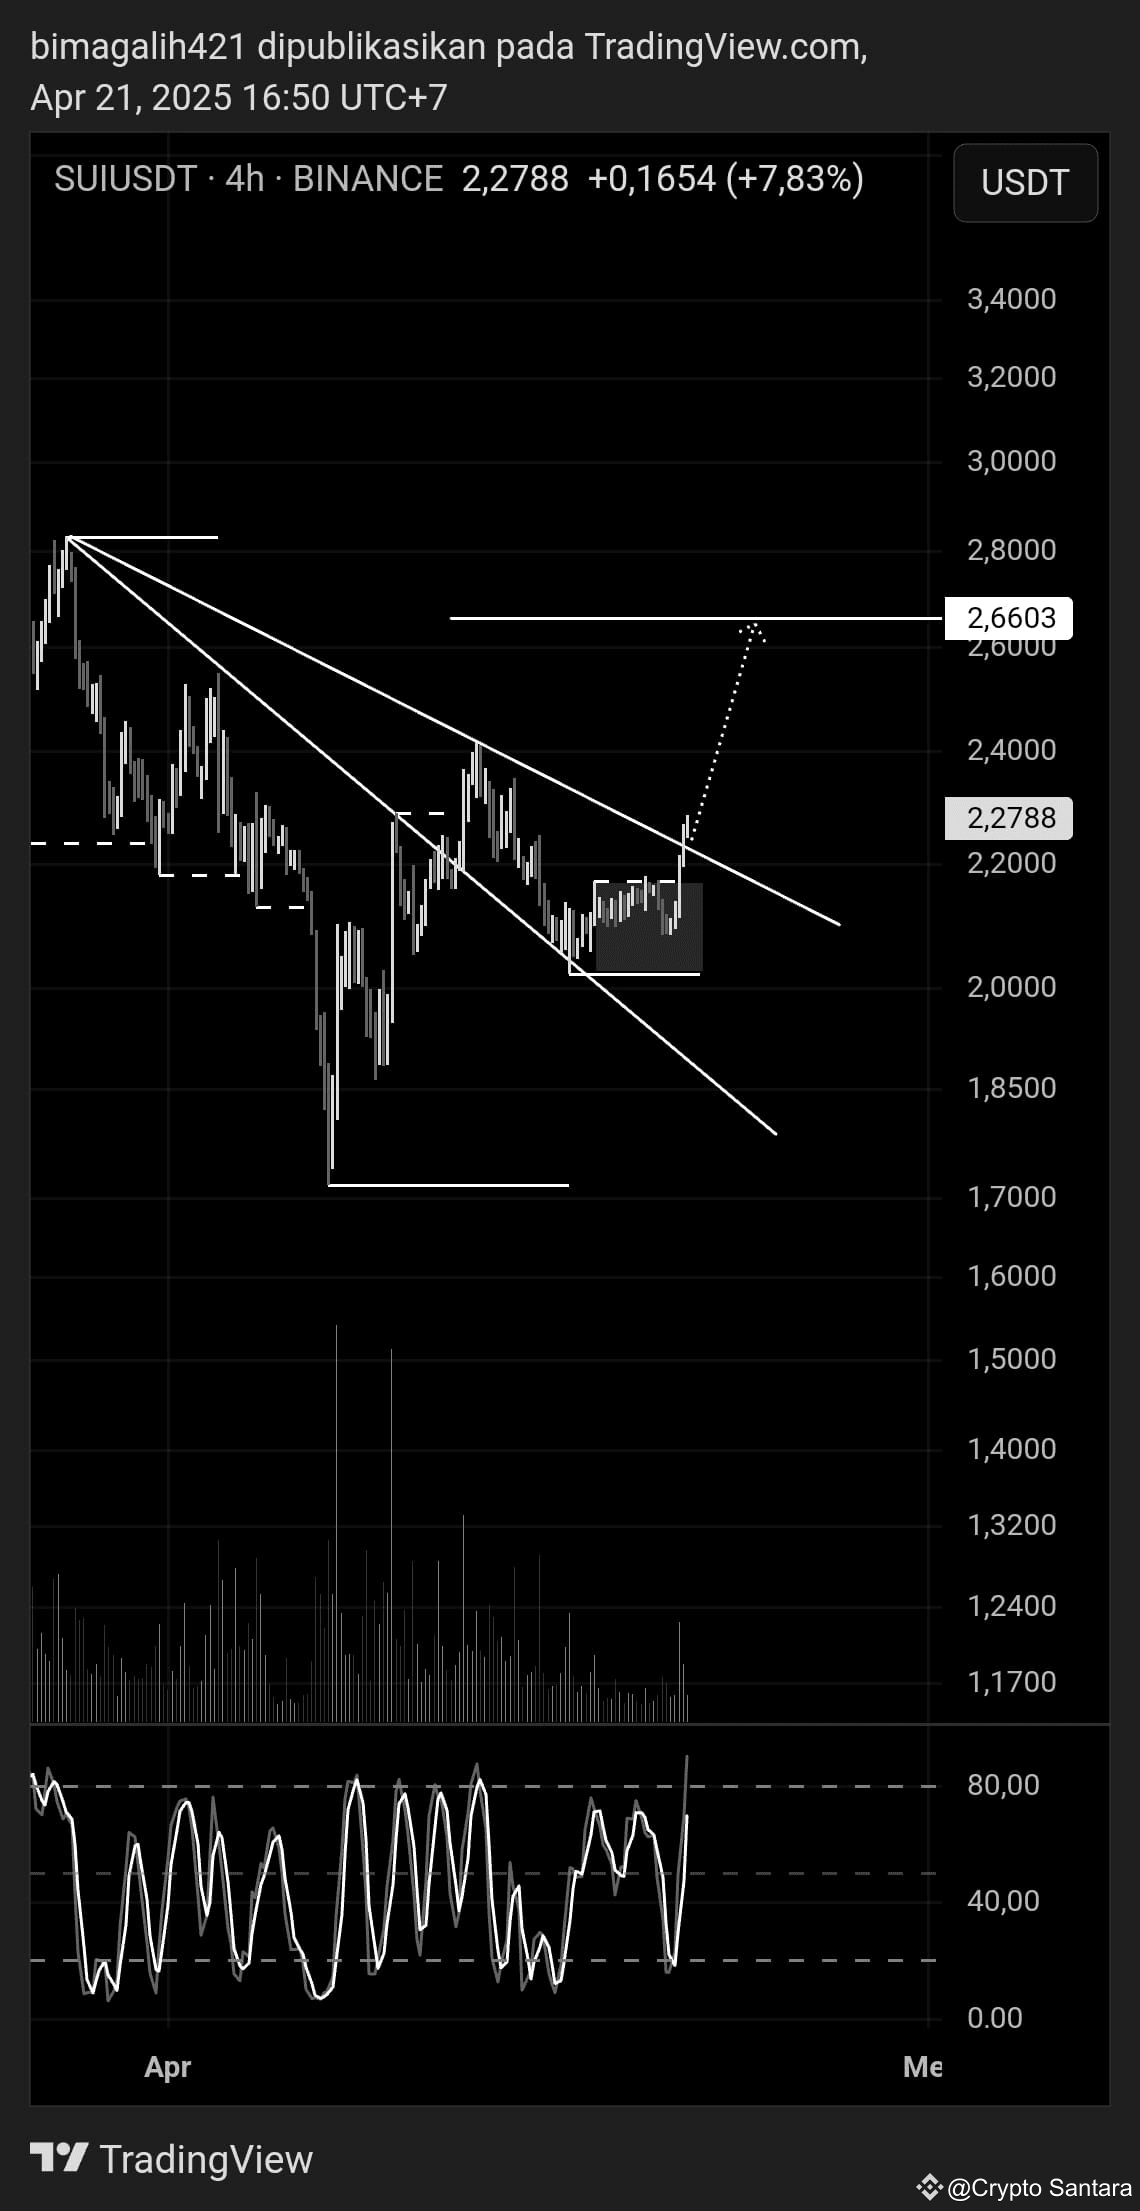
$SUI appears to have broken out of its consolidation area, confirmed by a trendline breakout. The next potential upside target is at $2.6603.
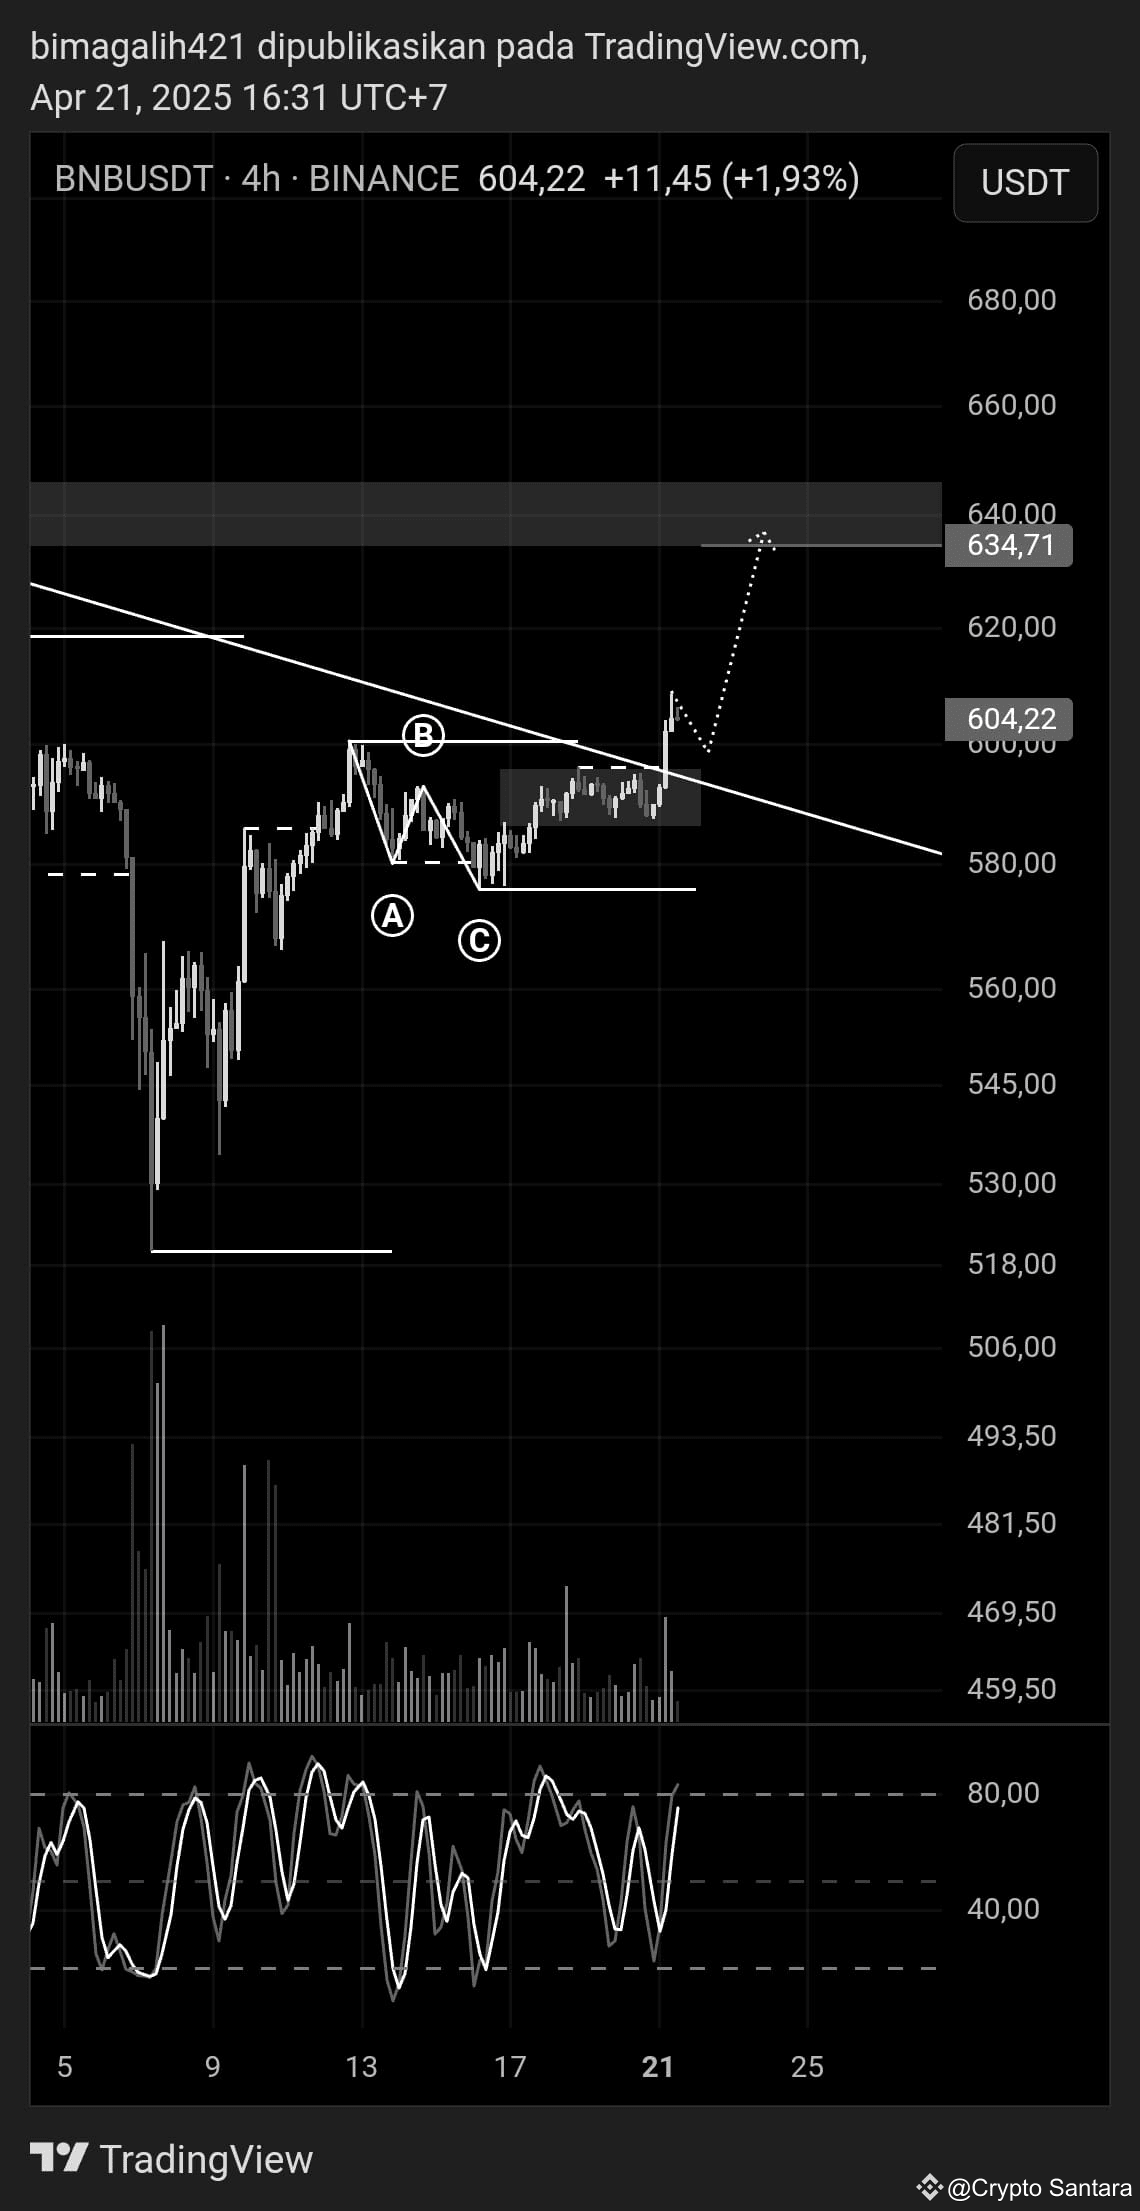
$BNB appears to have broken out of its consolidation area and successfully breached the trendline. The next potential upside target is at $634.71.
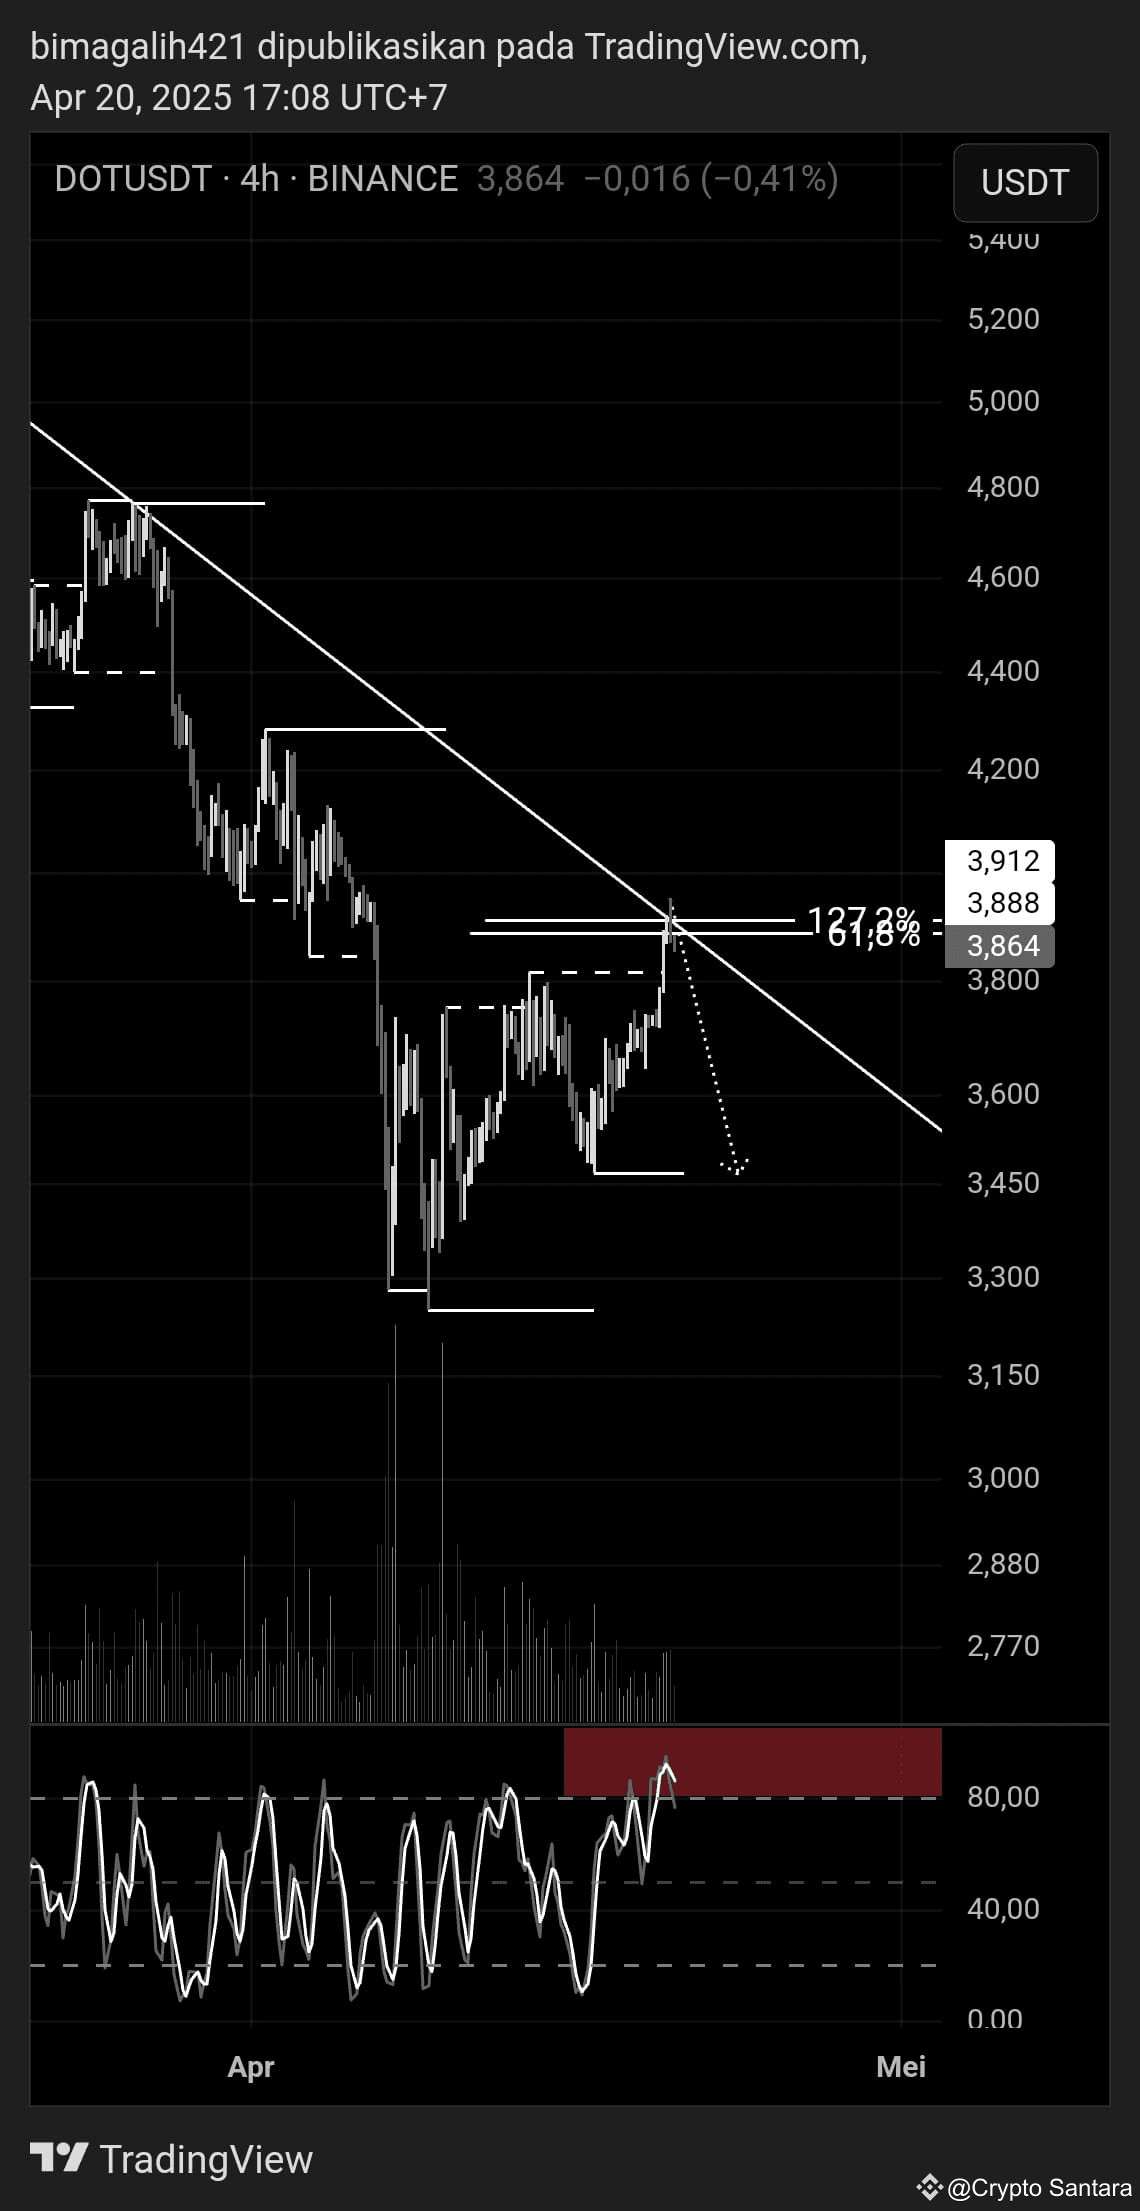
$DOT has the potential to decline, as the current price is right at the resistance line, which also aligns with the Fibonacci cluster of 127.2% and 61.8%.
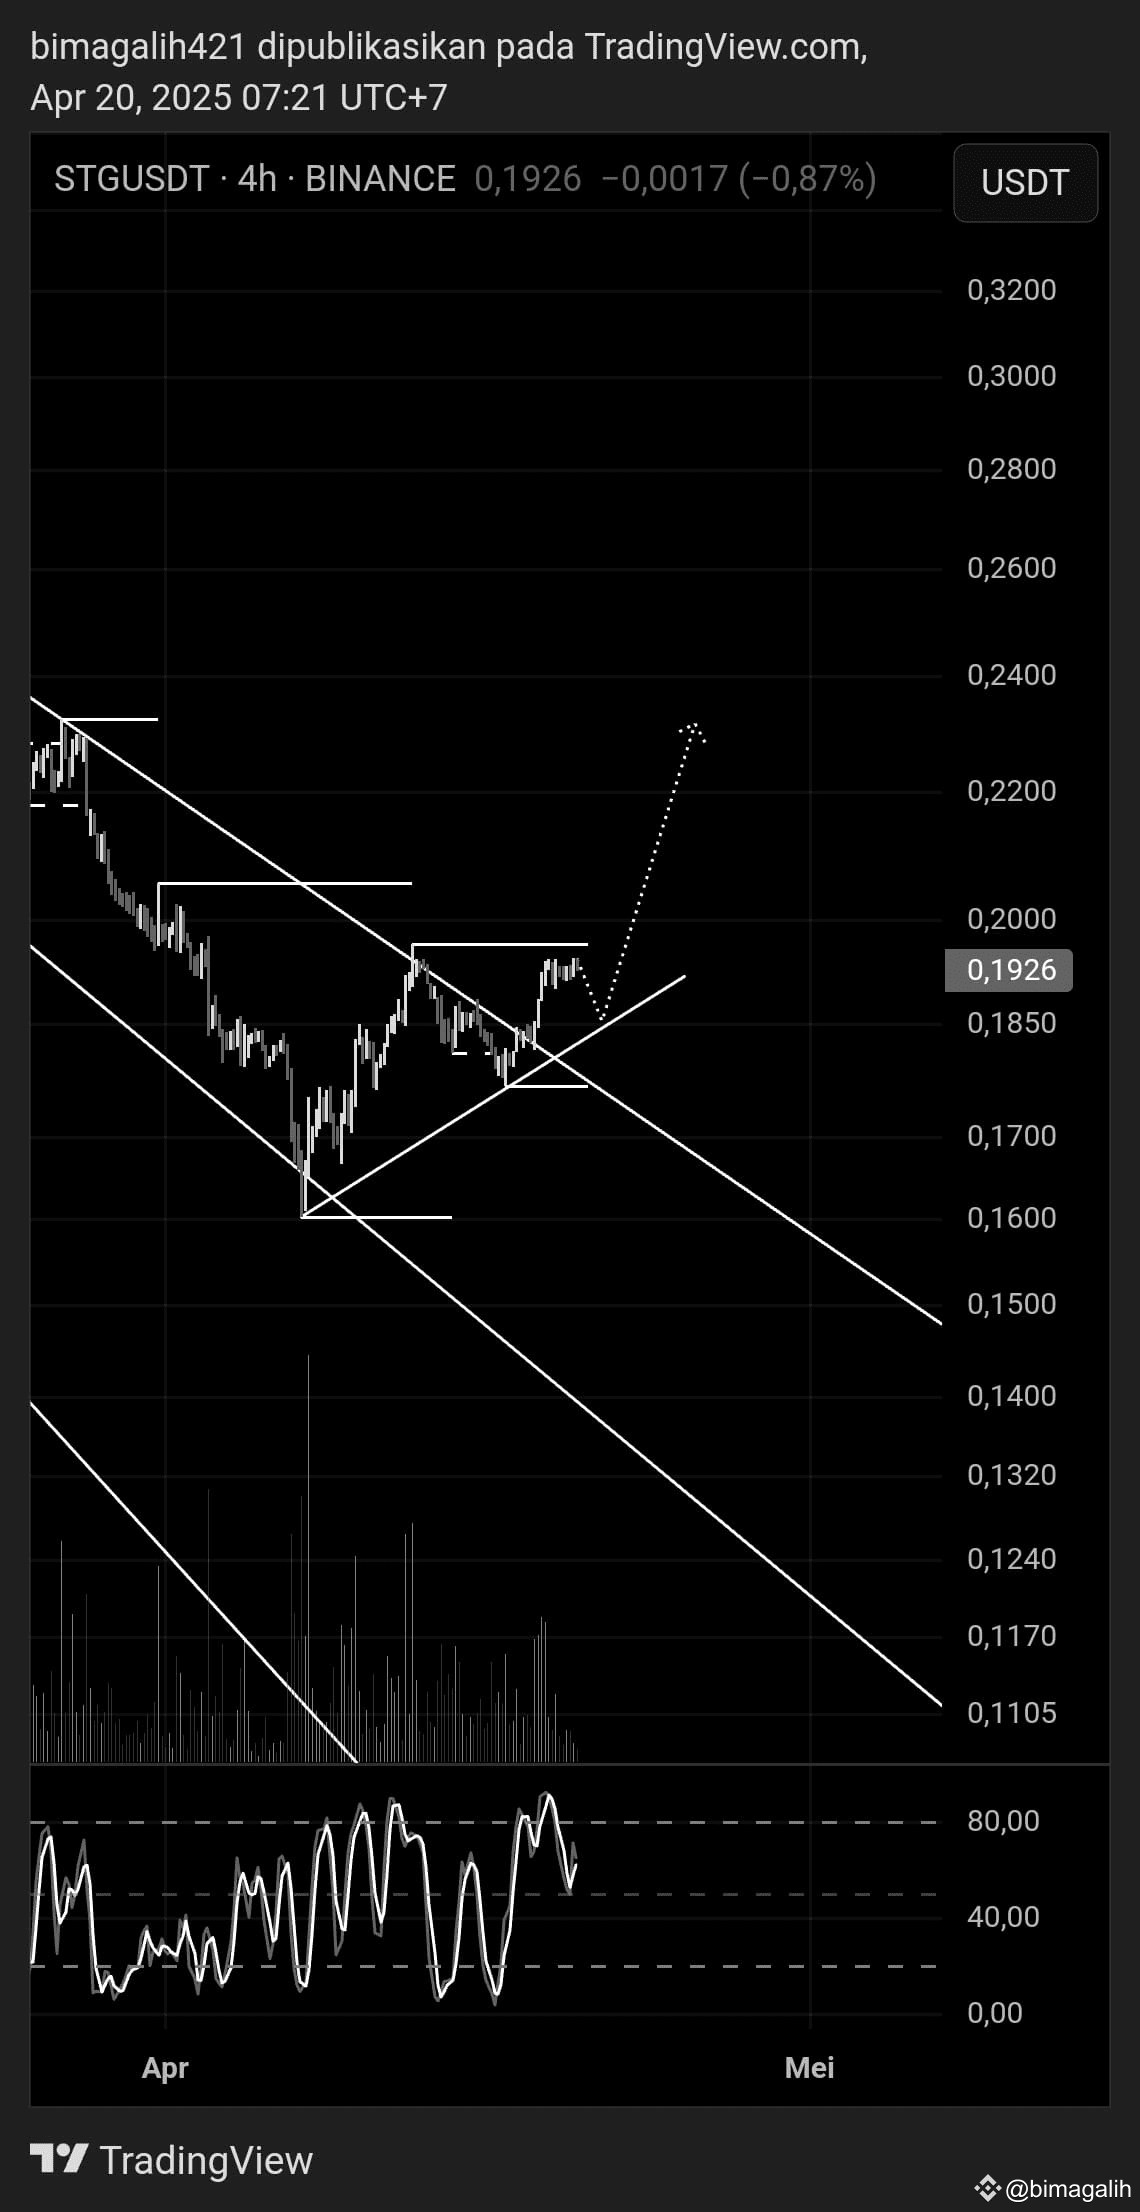
$STG indicates a confirmed bullish trend, making it very likely for the price to continue its upward movement.
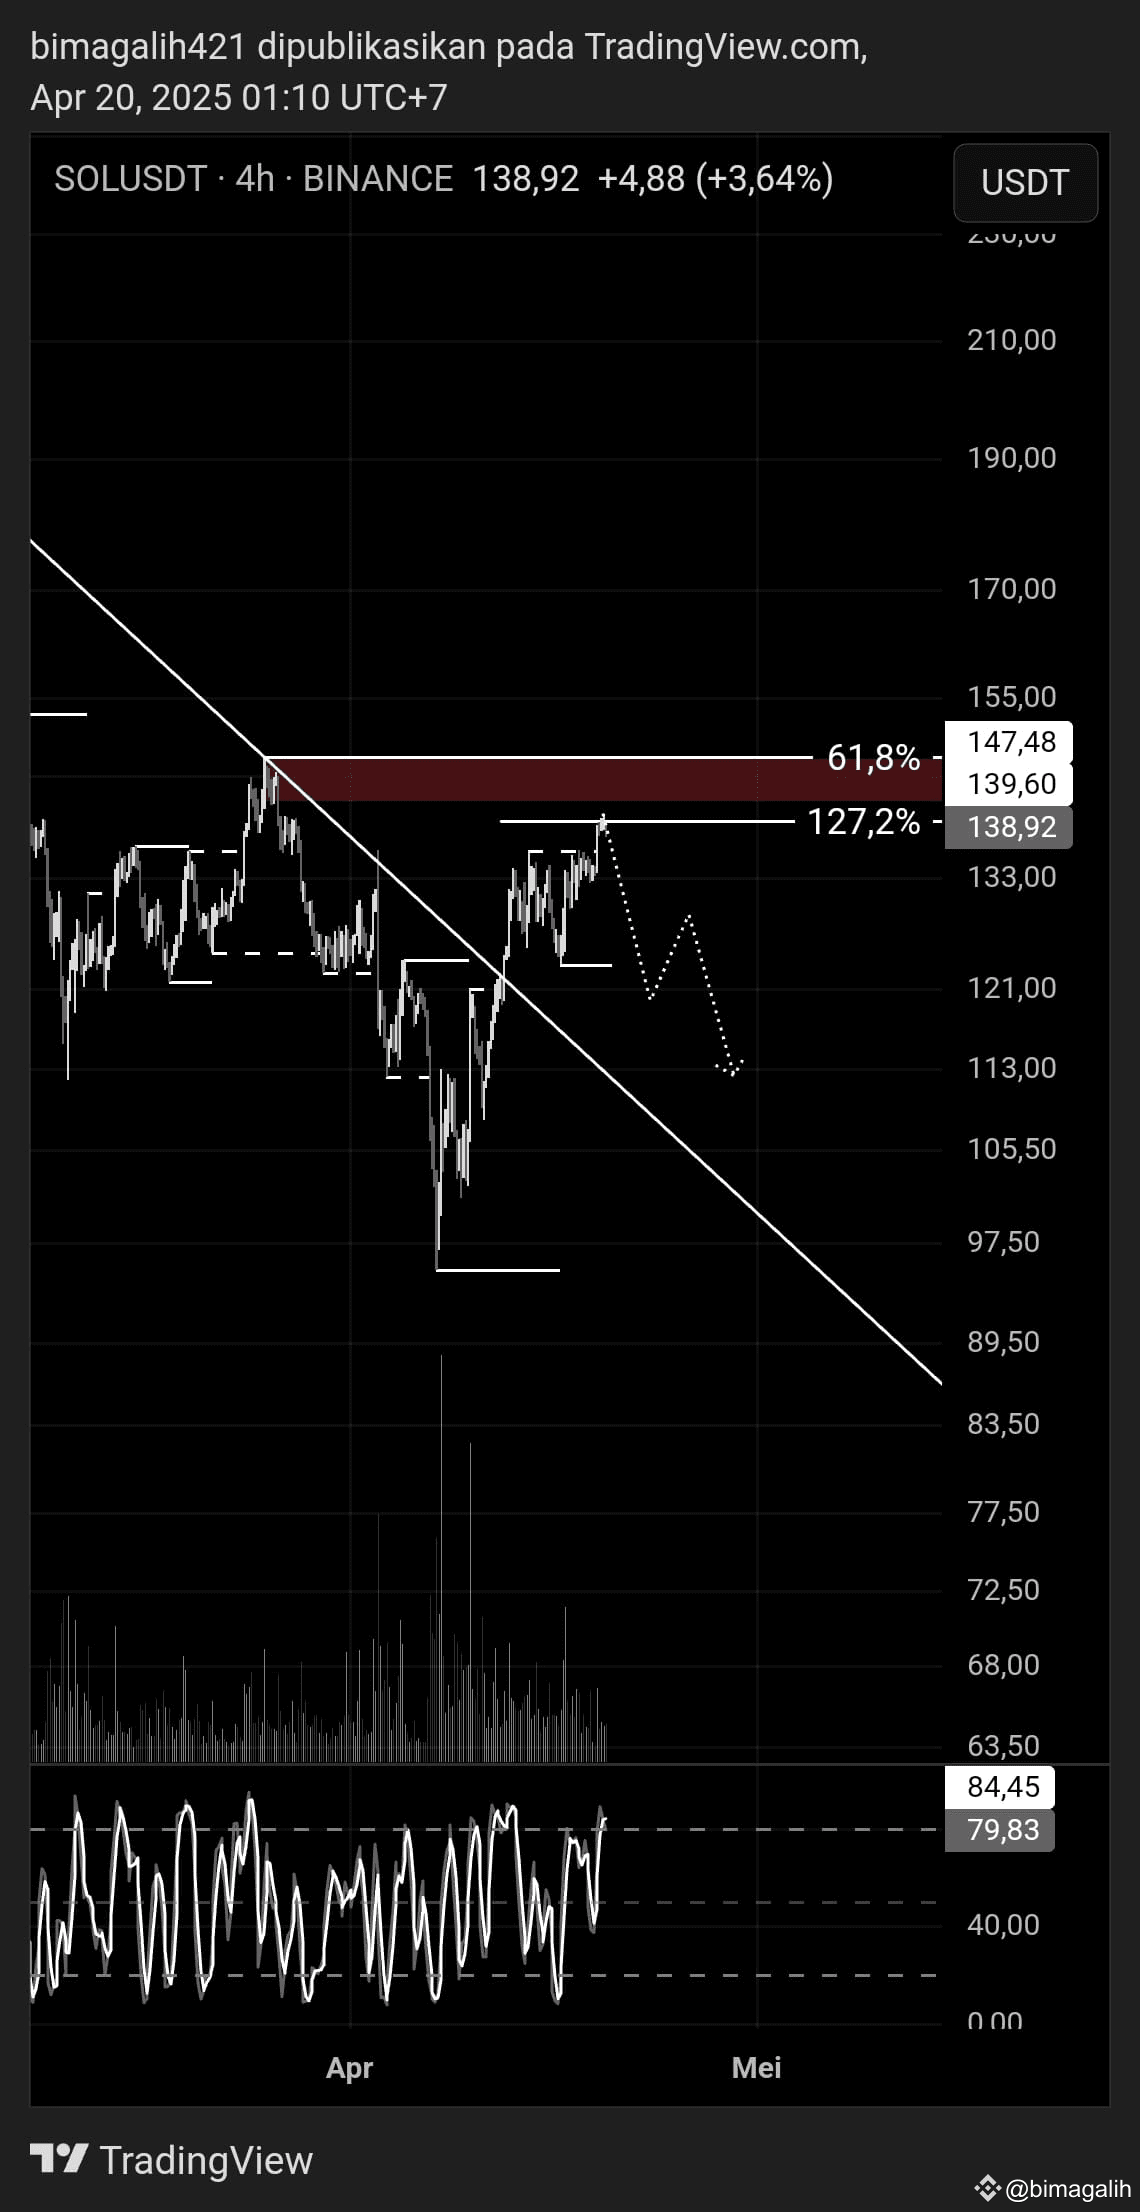
$GMT appears unlikely to continue its upward movement, as the current price is situated within a strong selling zone. This area includes a significant resistance level, an order block zone, and aligns with the 127.2% Fibonacci level.
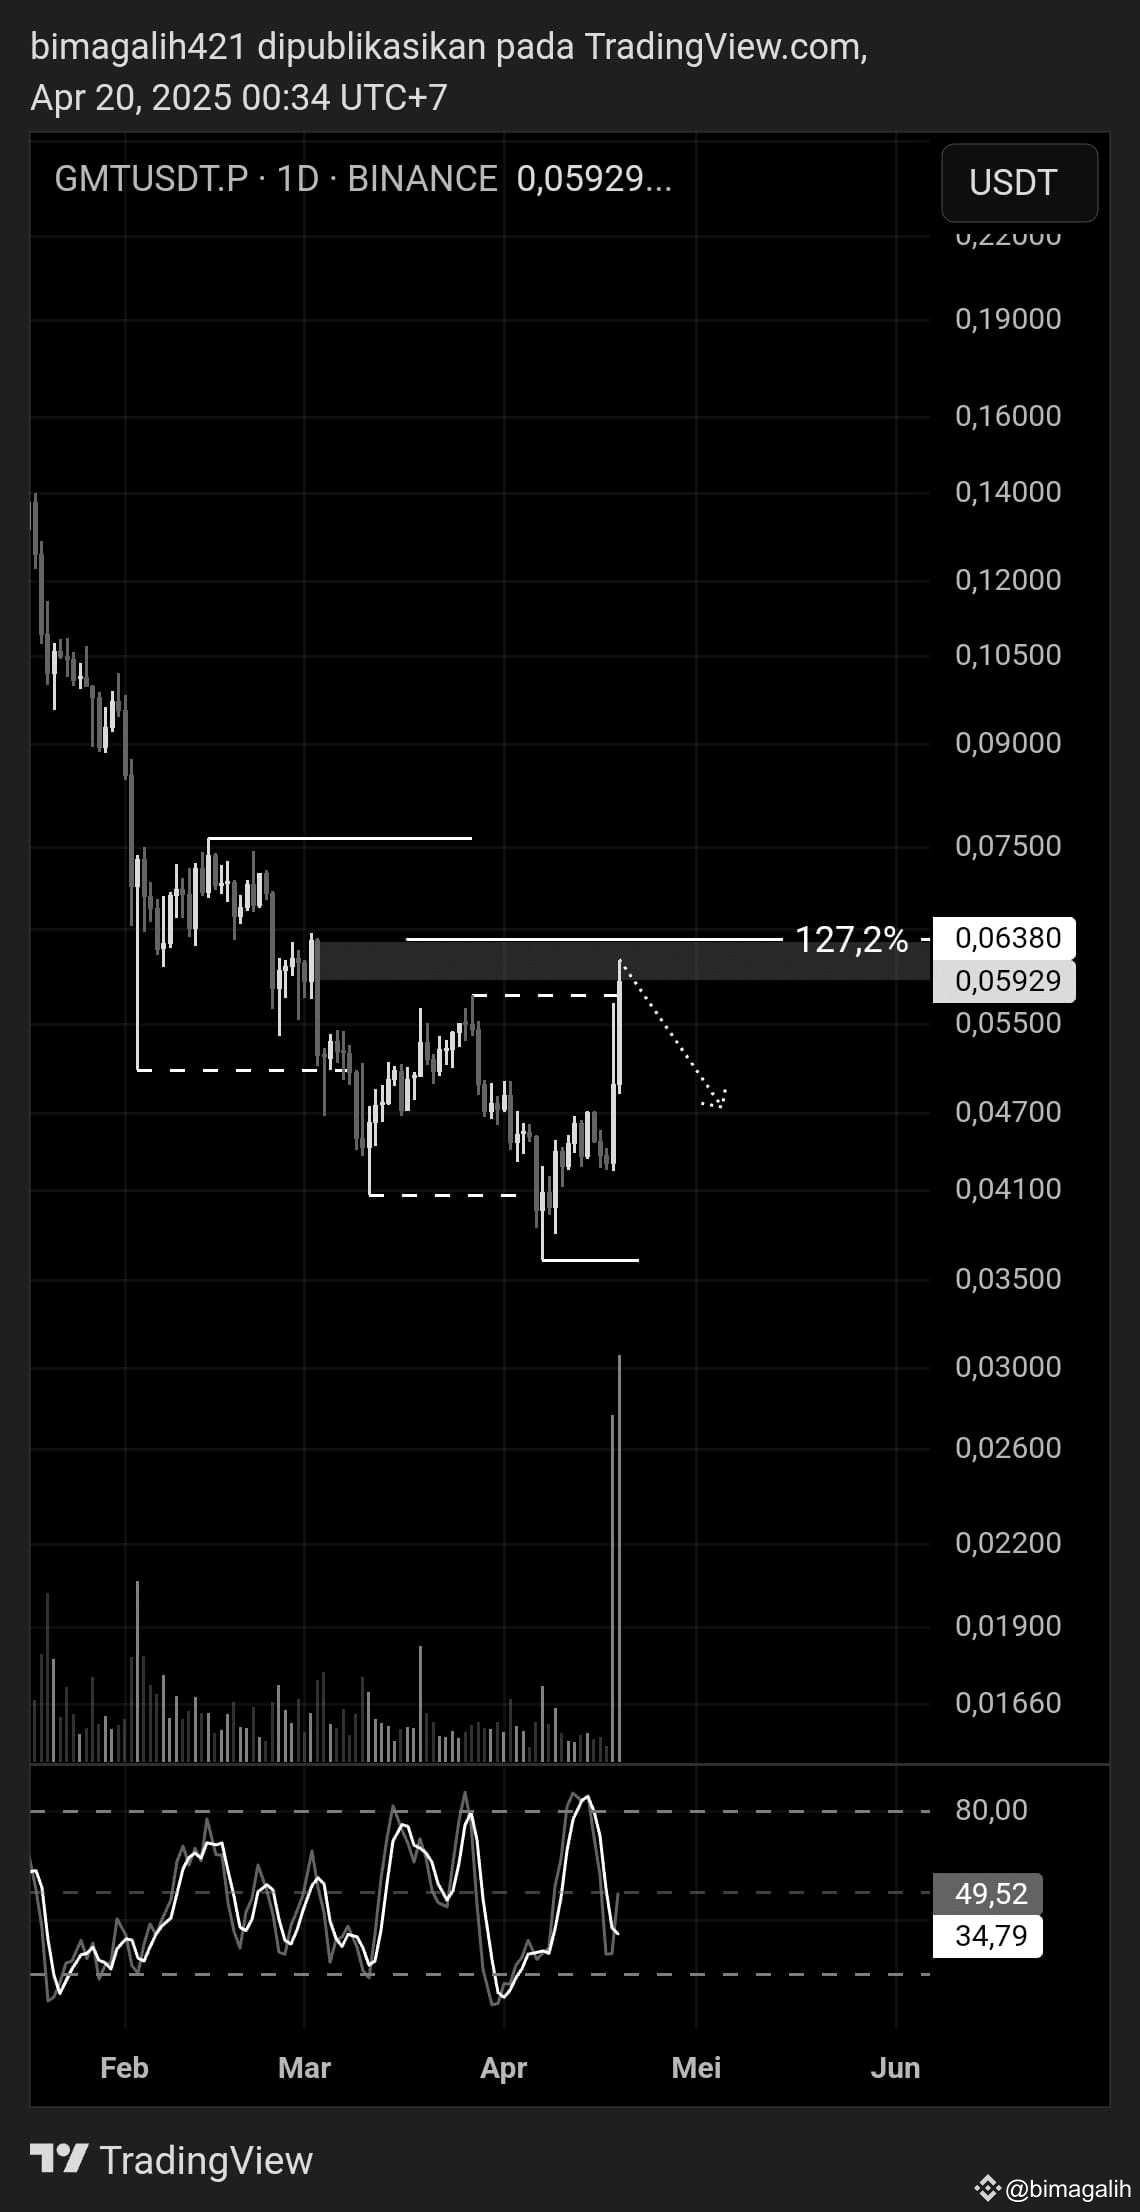
As I previously predicted, the price has corrected after reaching the Fibonacci cluster level.
$1MBABYDOGE
$1MBABYDOGE
Crypto Santara
·
--
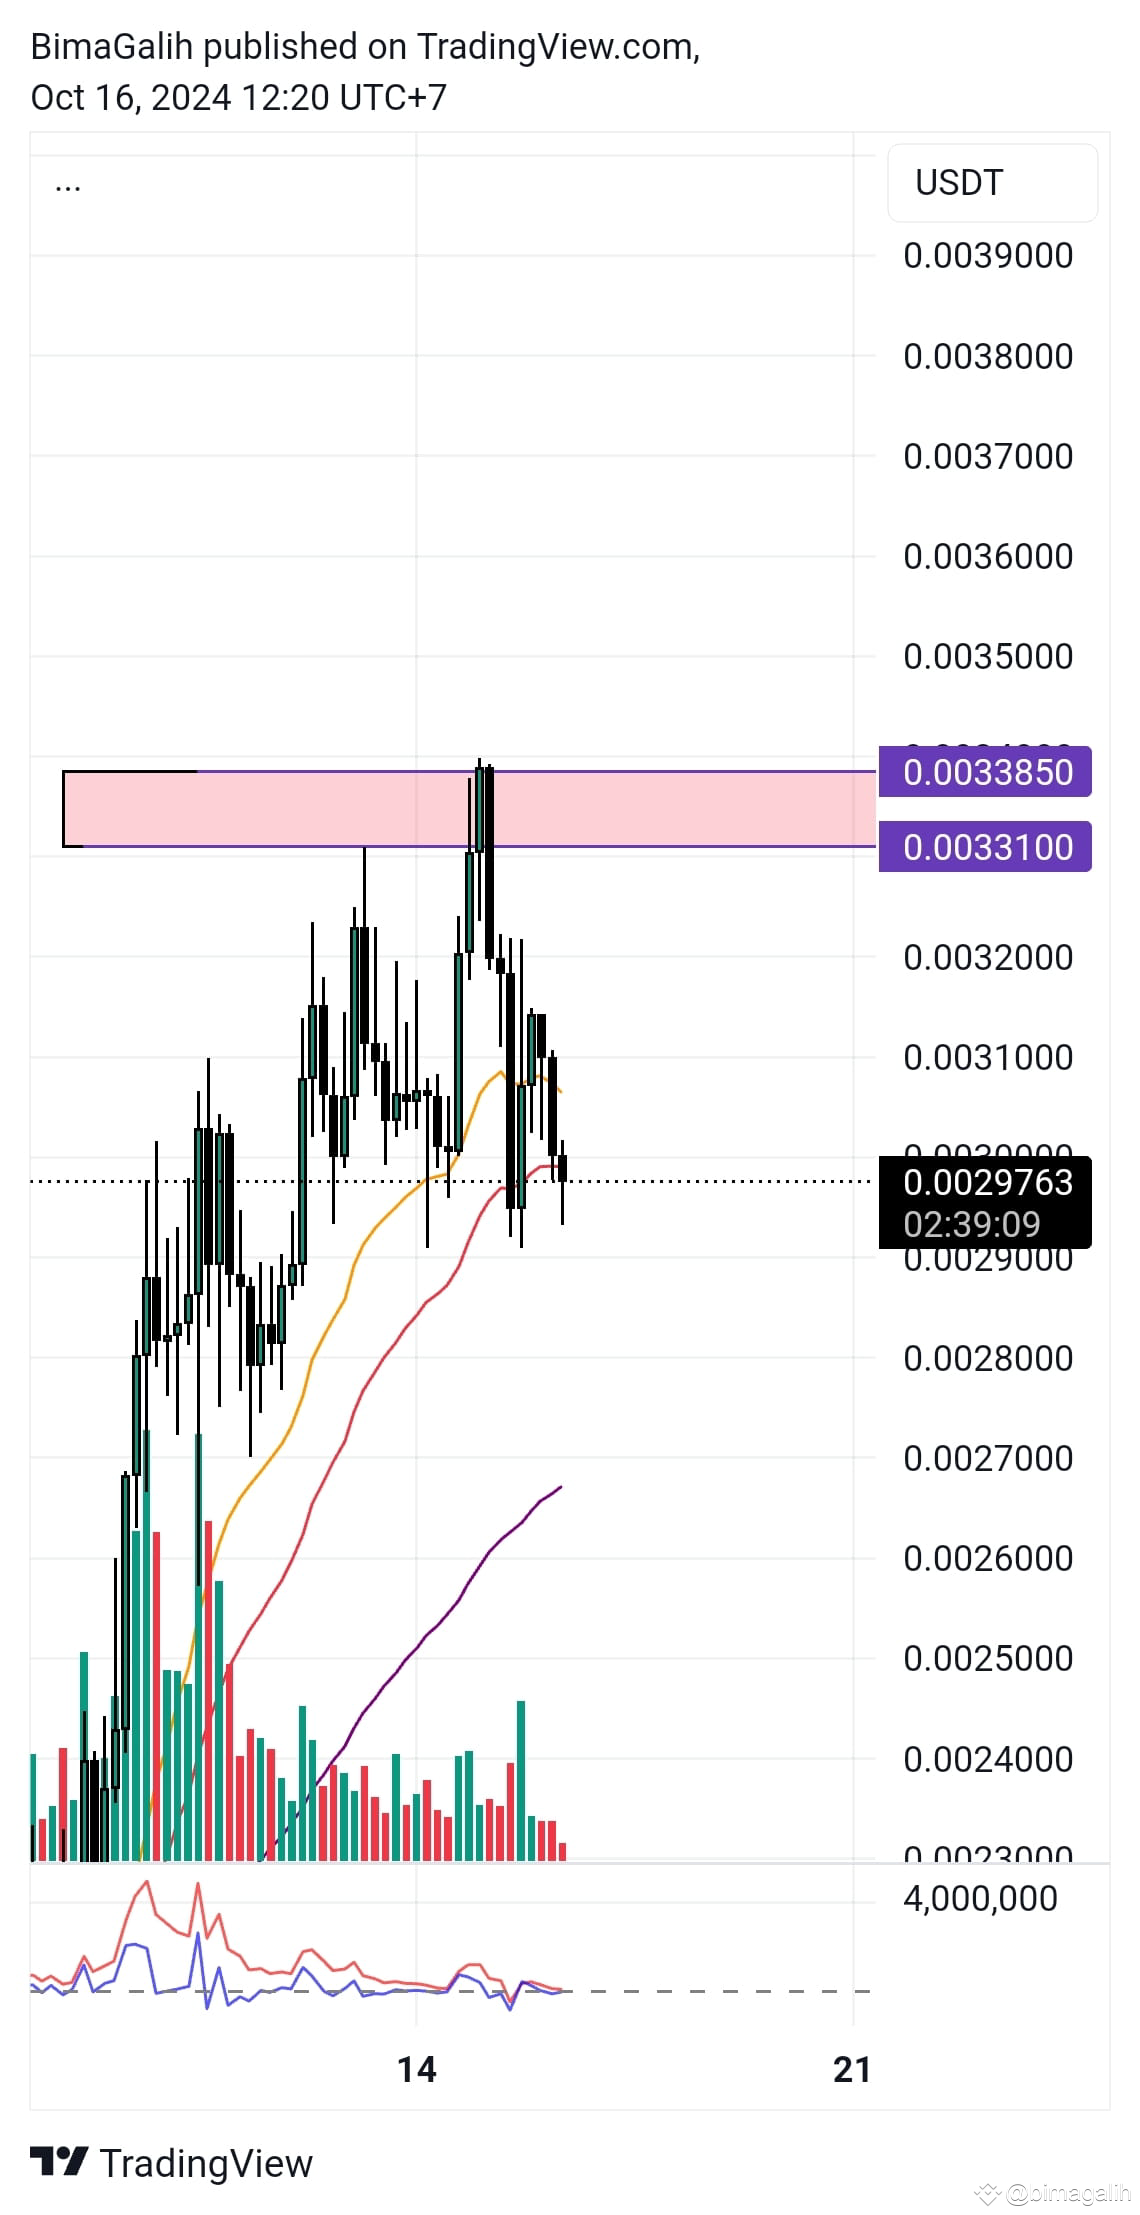
The 1MBABYDOGE coin is nearing the Fibonacci cluster area, which serves as a harmonic resistance. This area often marks the point where institutions take profits.
$1MBABYDOGE #moonbix #1MBABYDODGE
$1MBABYDOGE #moonbix #1MBABYDODGE
Since my analysis on October 12th, the price on the H4 timeframe has yet to break above the Fibonacci cluster level that I marked. The market is currently in a consolidation phase, where the trend direction is unclear. Therefore, I advise traders to exercise caution and consider refraining from overly aggressive trading.
$NEIRO
$NEIRO
Crypto Santara
·
--
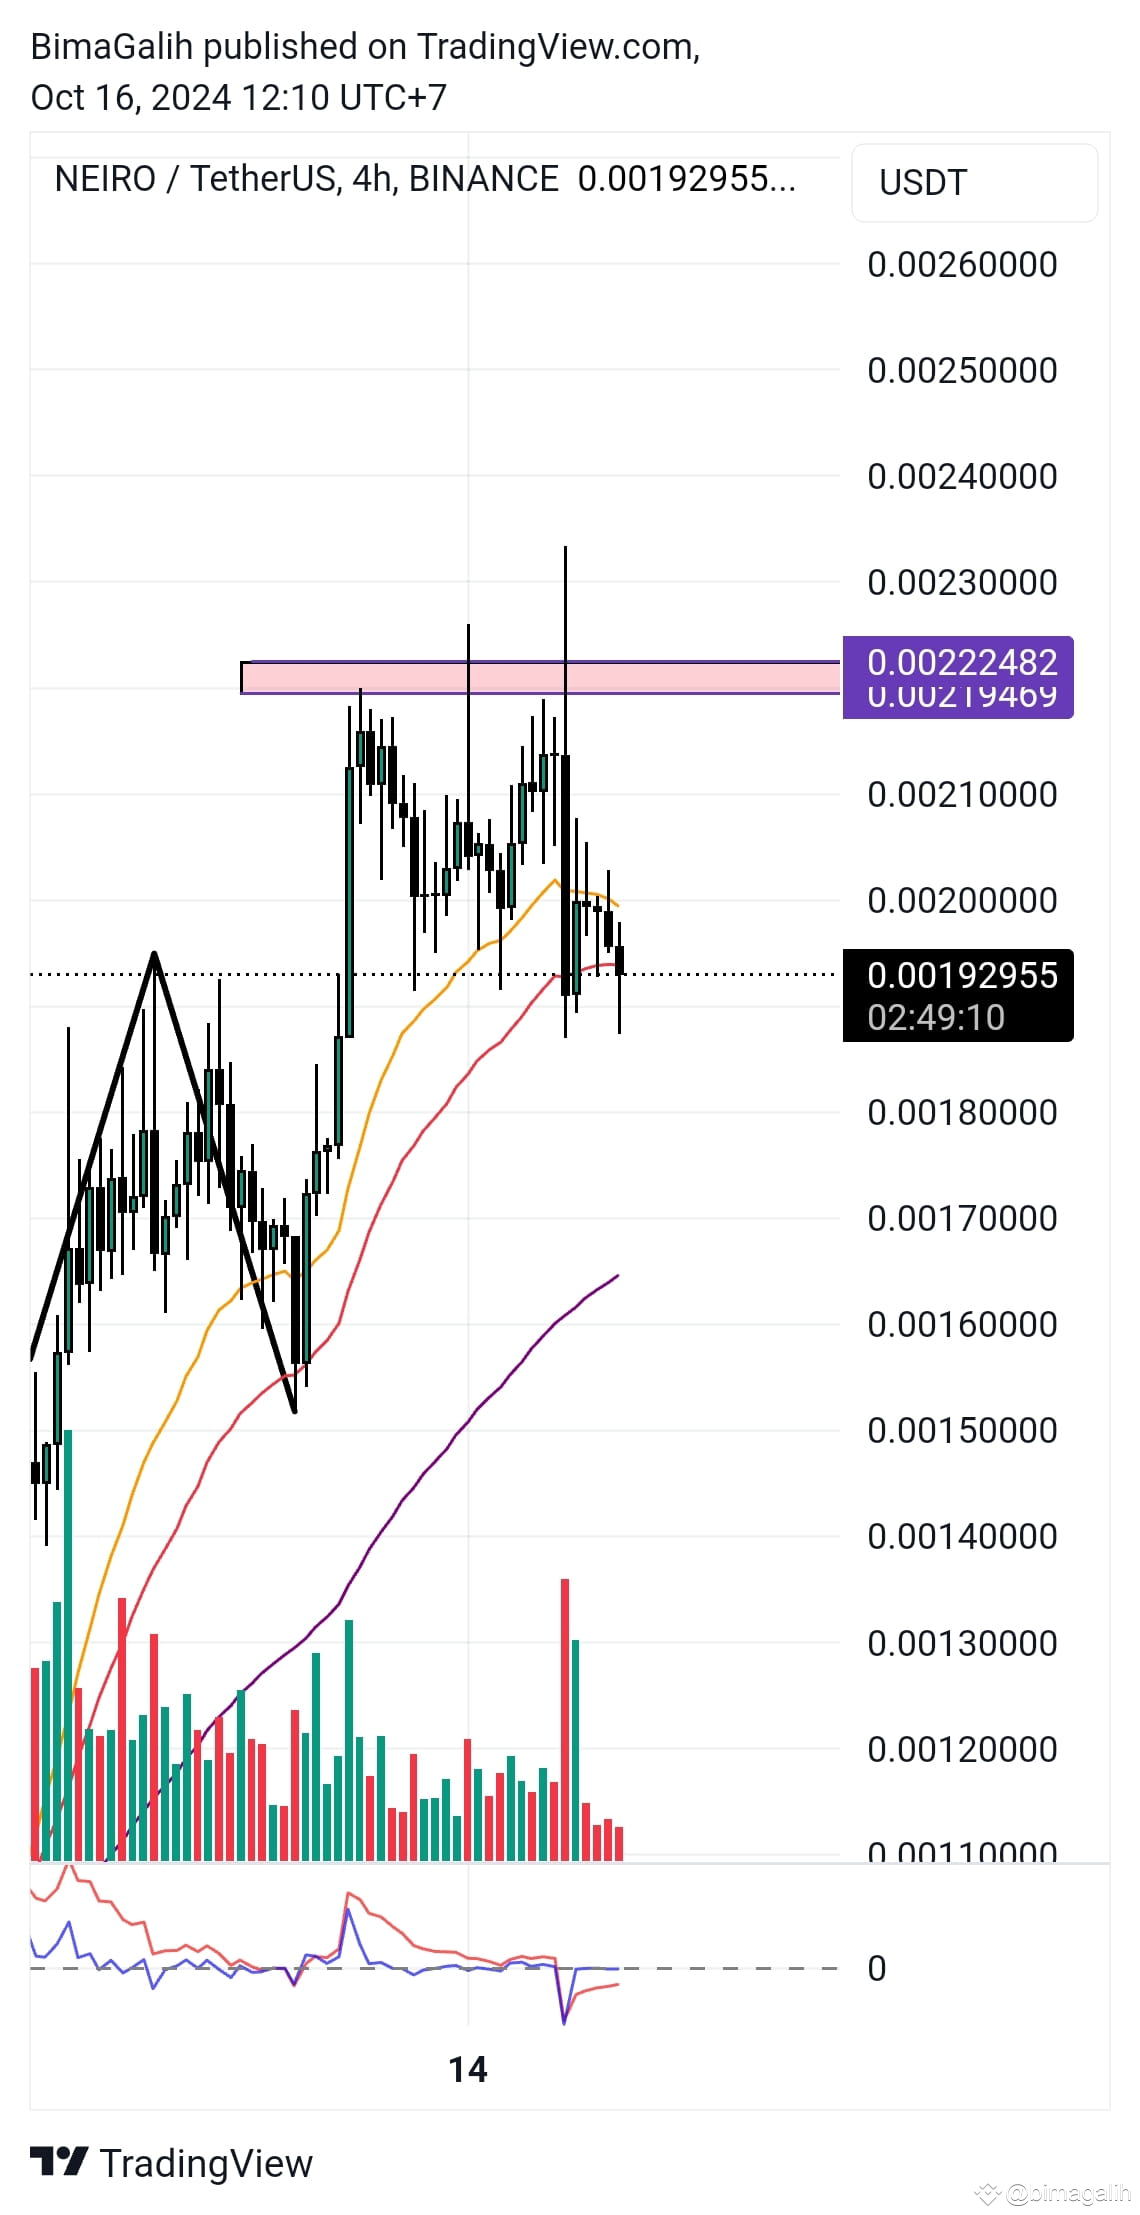
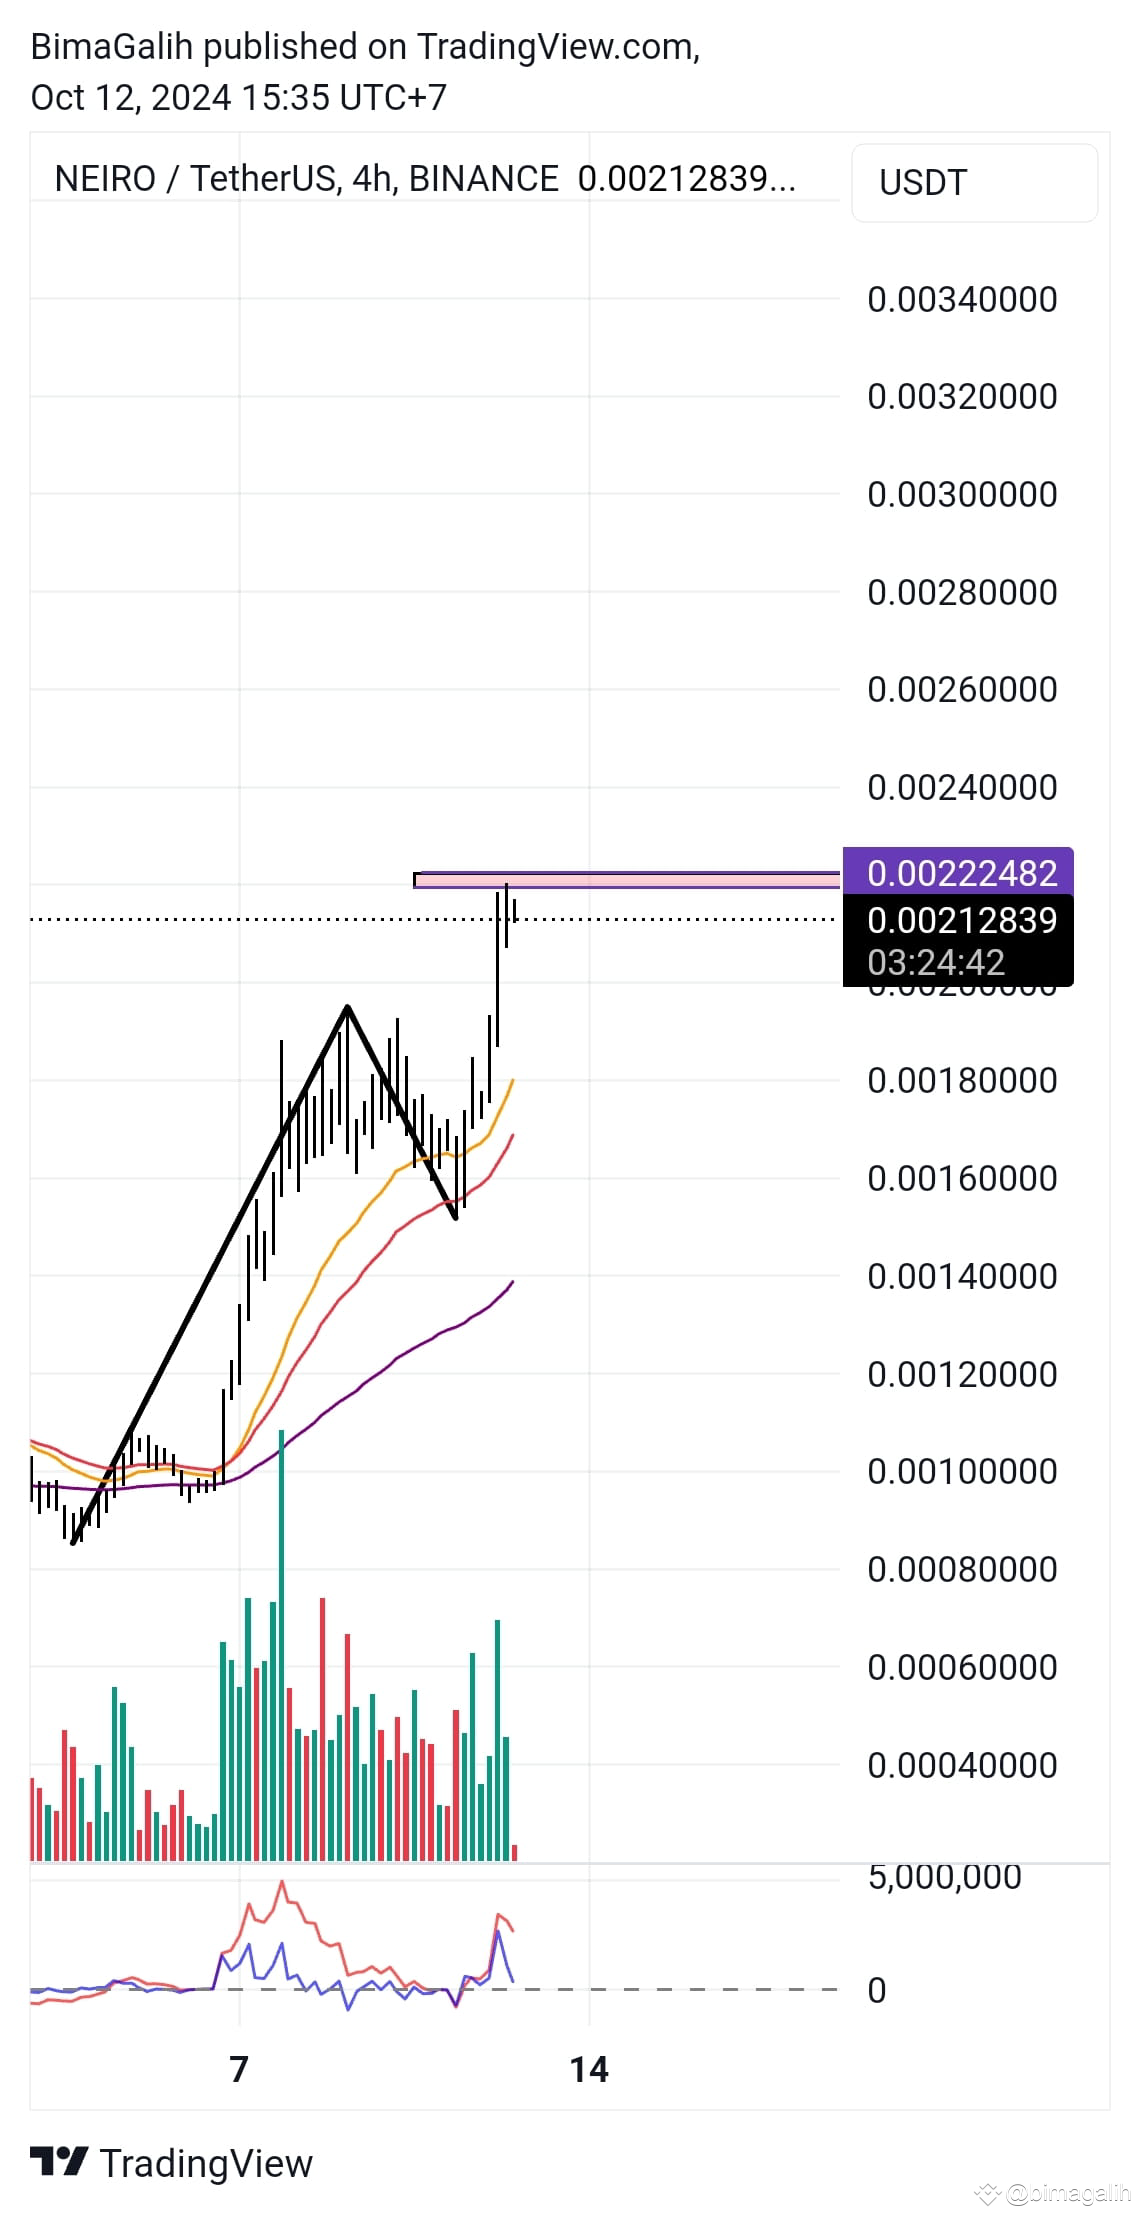
BearishThe current NEIRO coin price has entered the Fibonacci cluster zone, which often acts as a strong resistance level. Traders who have previously opened long positions should be cautious. There is a high probability of a massive sell-off (profit taking) by institutions (whales) in the near future.
Recommendation:
Immediately close all long positions to anticipate potential larger losses and wait for the next pattern.
$NEIRO #moonbix #NEIRO_Spot_Profits
Recommendation:
Immediately close all long positions to anticipate potential larger losses and wait for the next pattern.
$NEIRO #moonbix #NEIRO_Spot_Profits
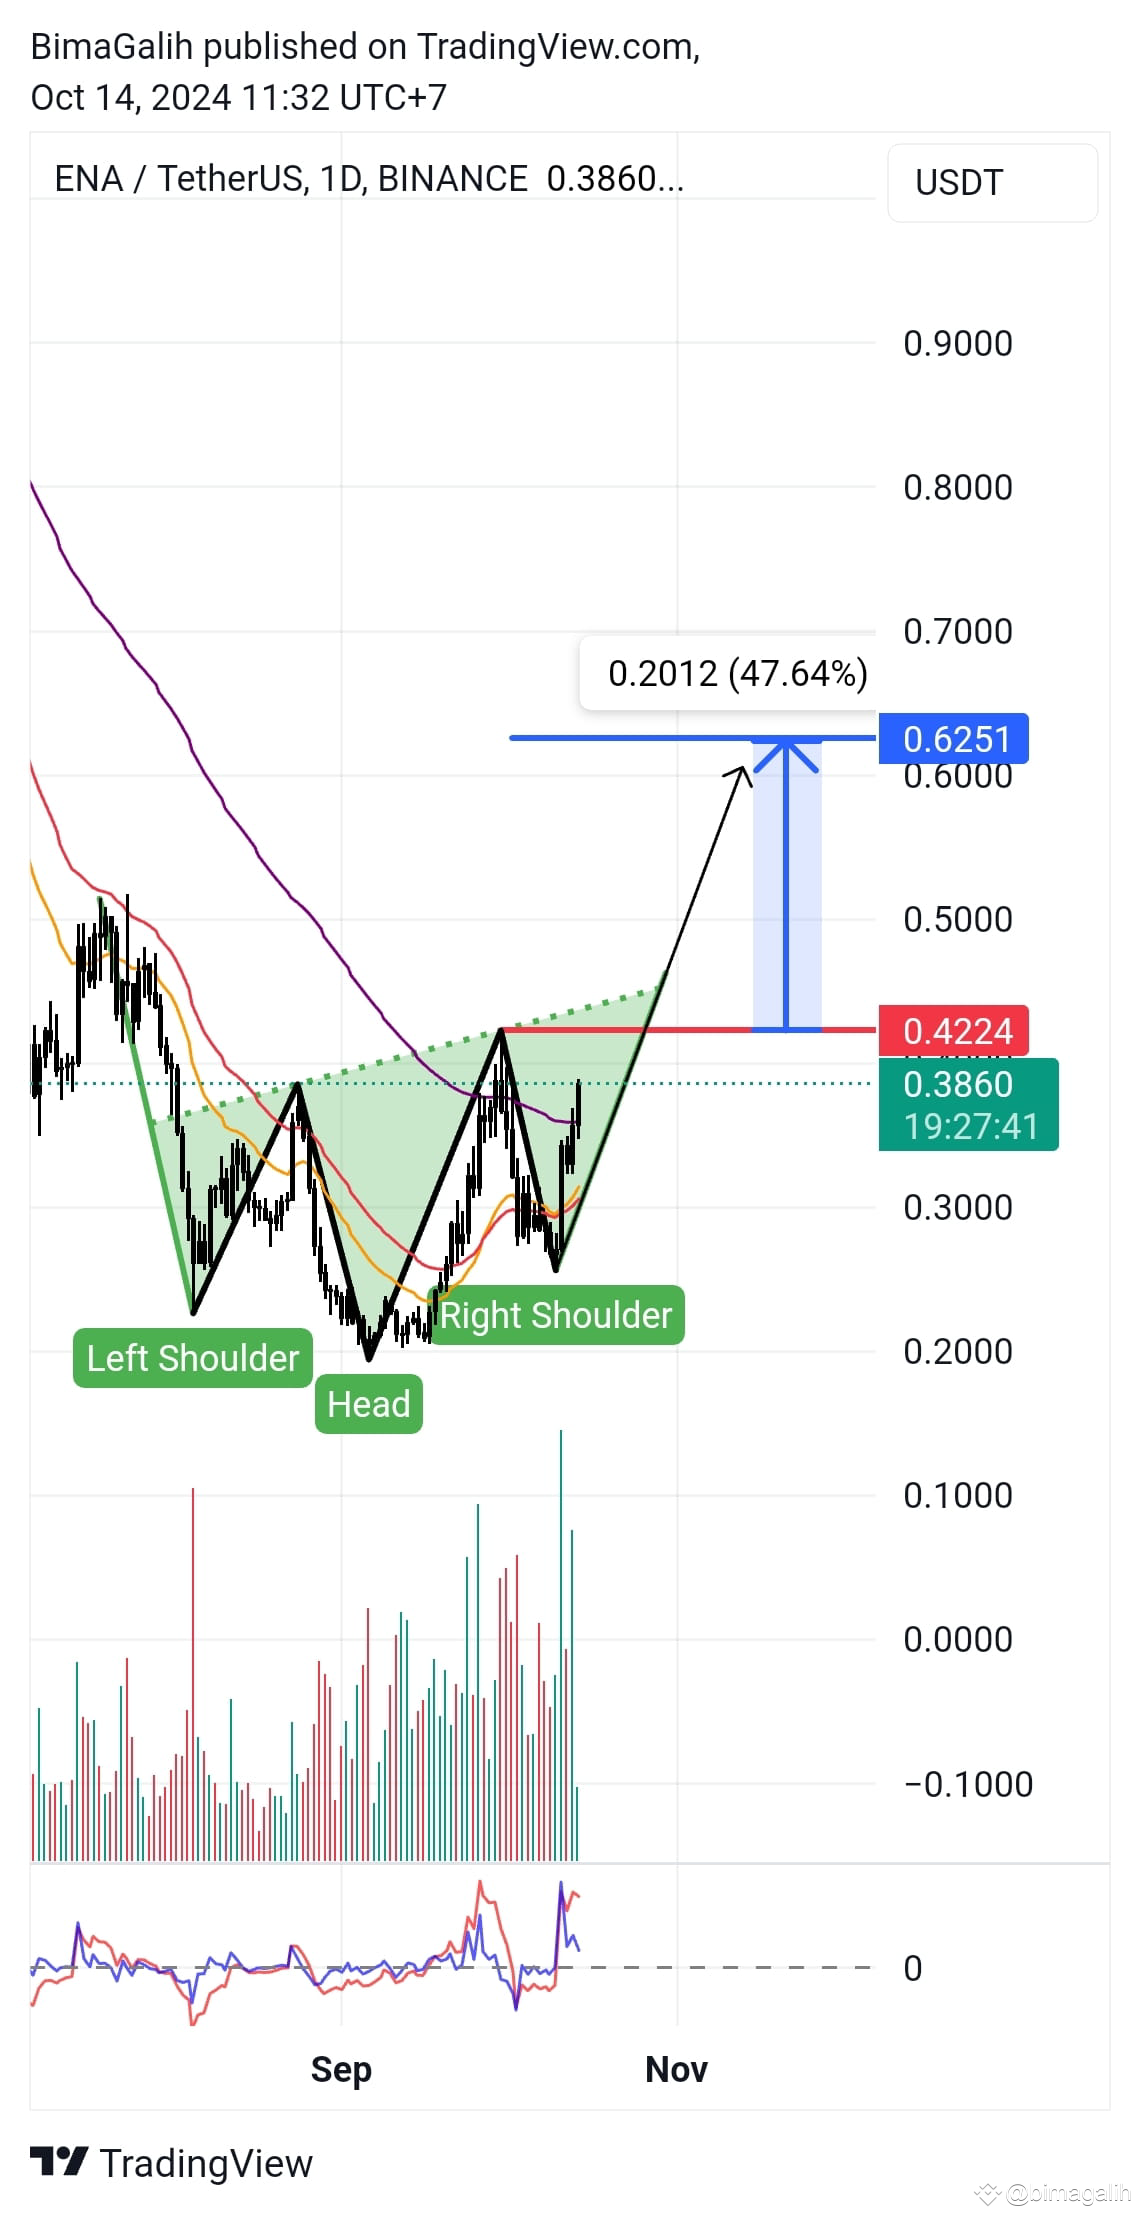
Technical analysis of the ENA coin indicates an 'inverted head and shoulders' chart pattern, supported by increasing trading volume. If the price successfully breaks through the resistance level at 0.4224, there is a strong potential for a significant price increase. The minimum target price that can be achieved is 0.6251.
$ENA #ENAUSDT🚨 #ENAonFire #moonbix
$ENA #ENAUSDT🚨 #ENAonFire #moonbix
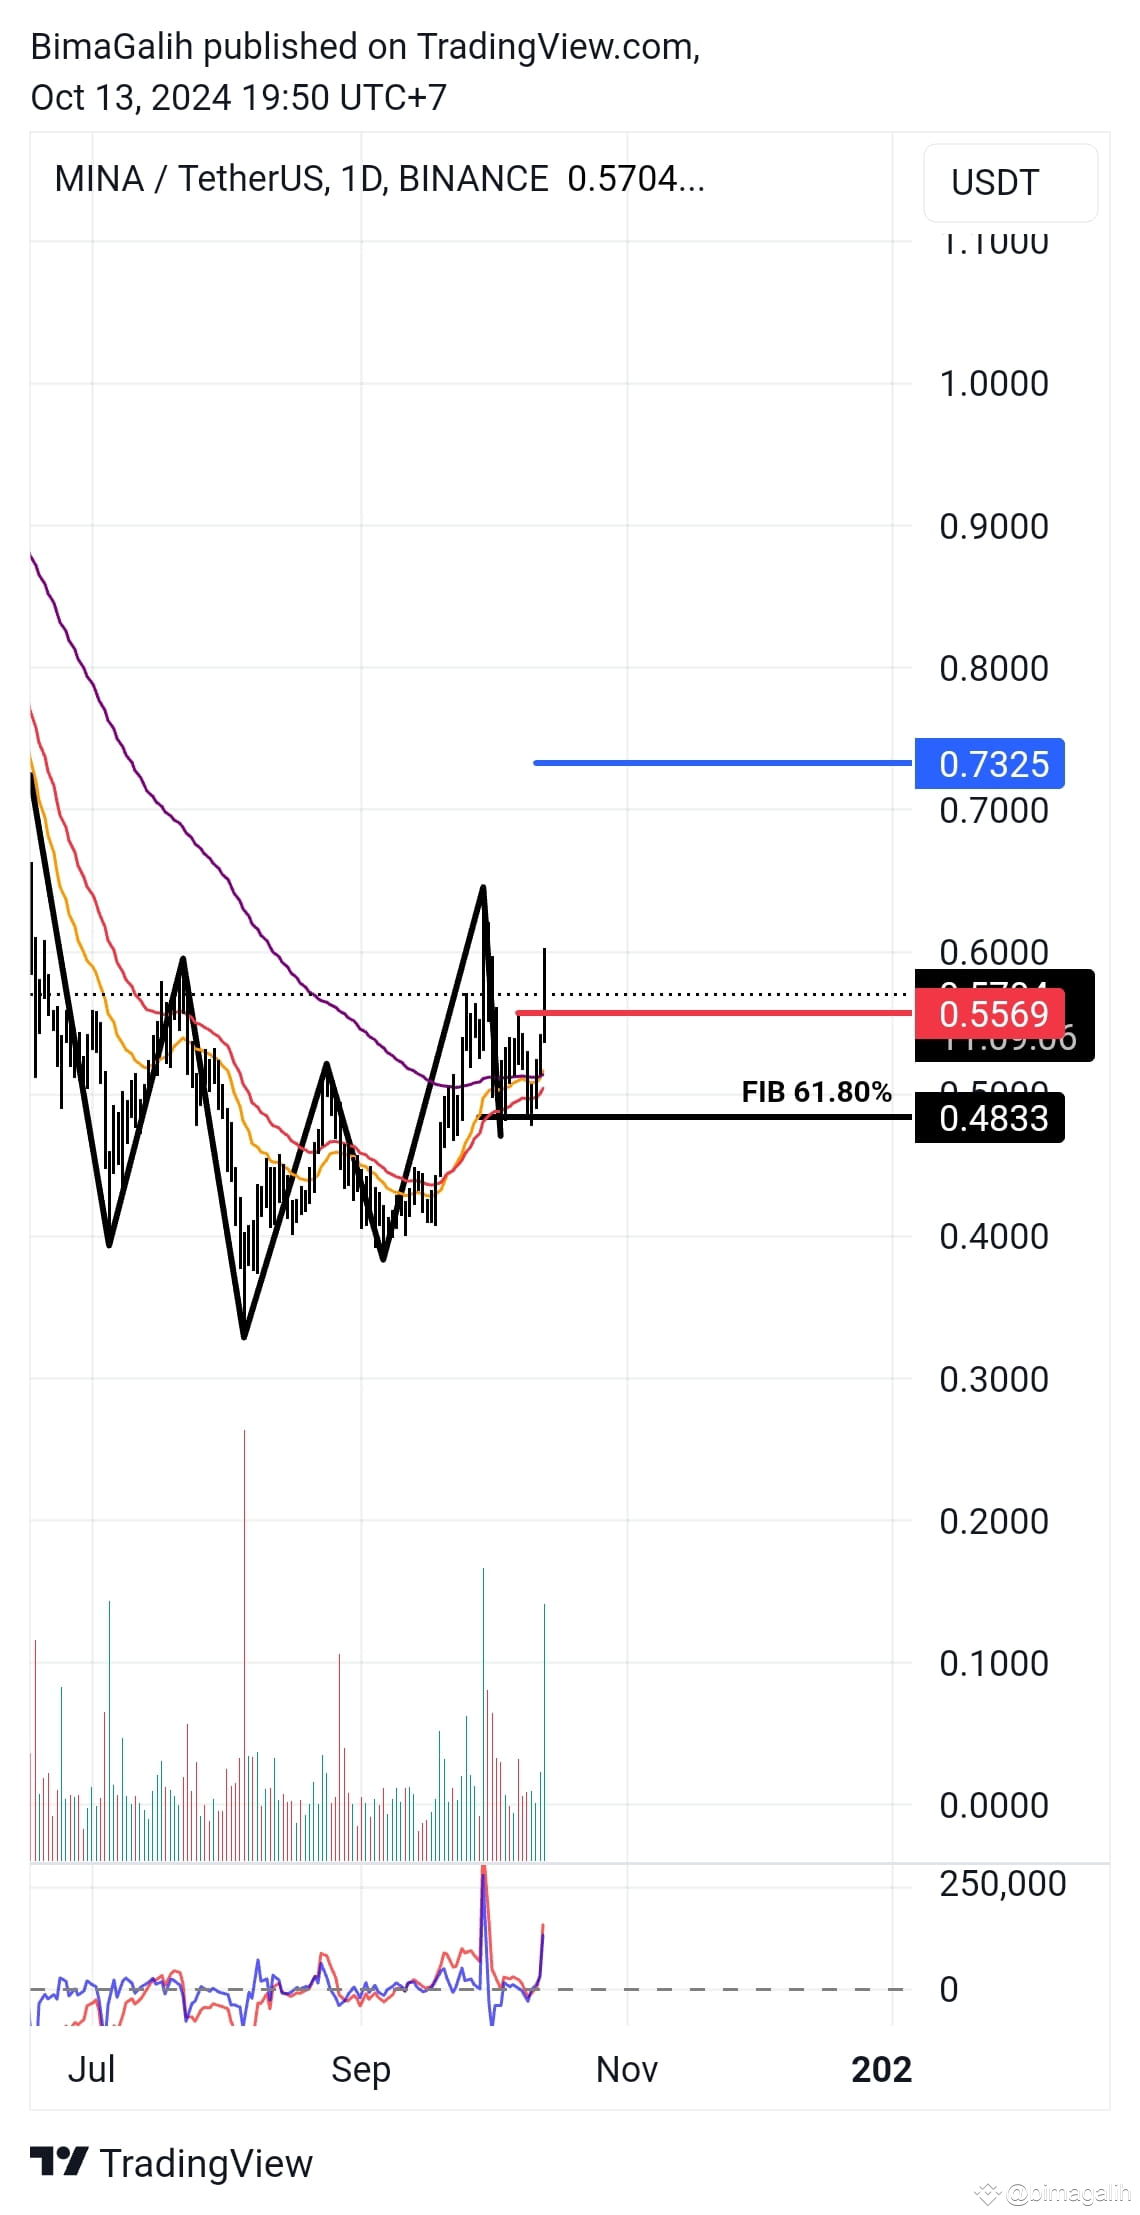
MINA coin has successfully broken through the resistance level of $0.5569. To confirm the continuation of the upward trend, it is recommended to wait for today's market close. If the closing price is above this level, then buying at the beginning of the next trading session can be considered. For more aggressive investors, more intensive monitoring on smaller timeframes, such as 1-hour (H1) or 30-minute (M30) charts, can be done to identify price patterns that emerge after the breakout. The next price target to watch is $0.7325.
$MINA #MINA/USDT #MinaProtocol
$MINA #MINA/USDT #MinaProtocol
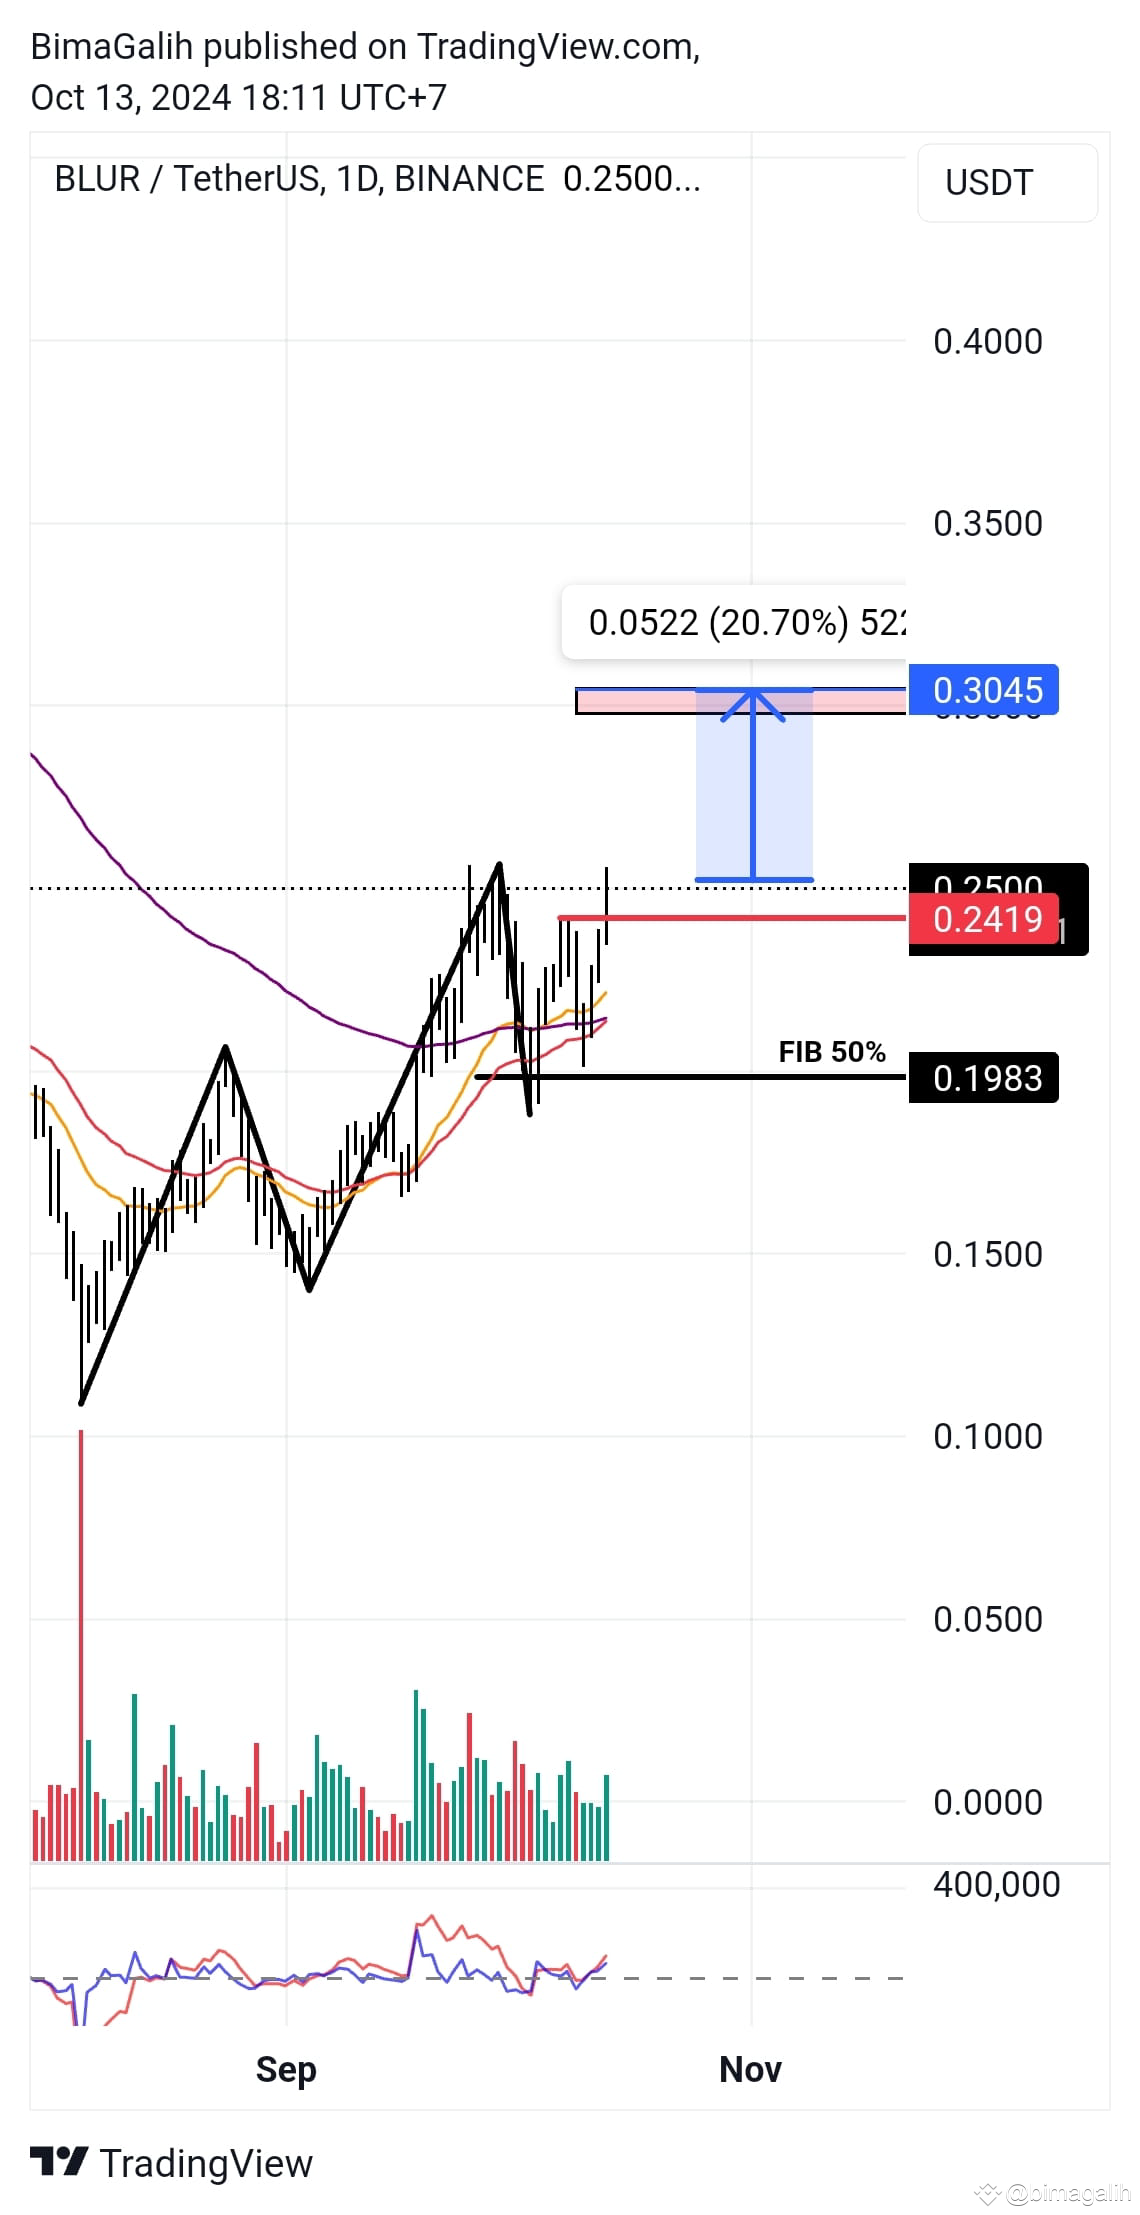
The BLUR coin price has recovered from its previous decline and today successfully breached the resistance level at $0.2419. Can this breakout be considered a reliable signal for the continuation of an uptrend?
Conservative Approach: Waiting until the market closes today to confirm the breakout of the resistance level. If the closing price is above the $0.2419 level, then buying at the beginning of the next trading session can be considered.
Aggressive Approach: Conducting more intensive monitoring on the 1-hour timeframe chart to identify price patterns that emerge after the breakout. This approach allows for faster action but also carries a higher risk if the breakout turns out to be temporary.
If this resistance breakout is sustained, the potential for further price increases remains. A realistic next price target is $0.3045.
#BLUR/USDT #moonbix #BLURUSDT $BLUR
Conservative Approach: Waiting until the market closes today to confirm the breakout of the resistance level. If the closing price is above the $0.2419 level, then buying at the beginning of the next trading session can be considered.
Aggressive Approach: Conducting more intensive monitoring on the 1-hour timeframe chart to identify price patterns that emerge after the breakout. This approach allows for faster action but also carries a higher risk if the breakout turns out to be temporary.
If this resistance breakout is sustained, the potential for further price increases remains. A realistic next price target is $0.3045.
#BLUR/USDT #moonbix #BLURUSDT $BLUR
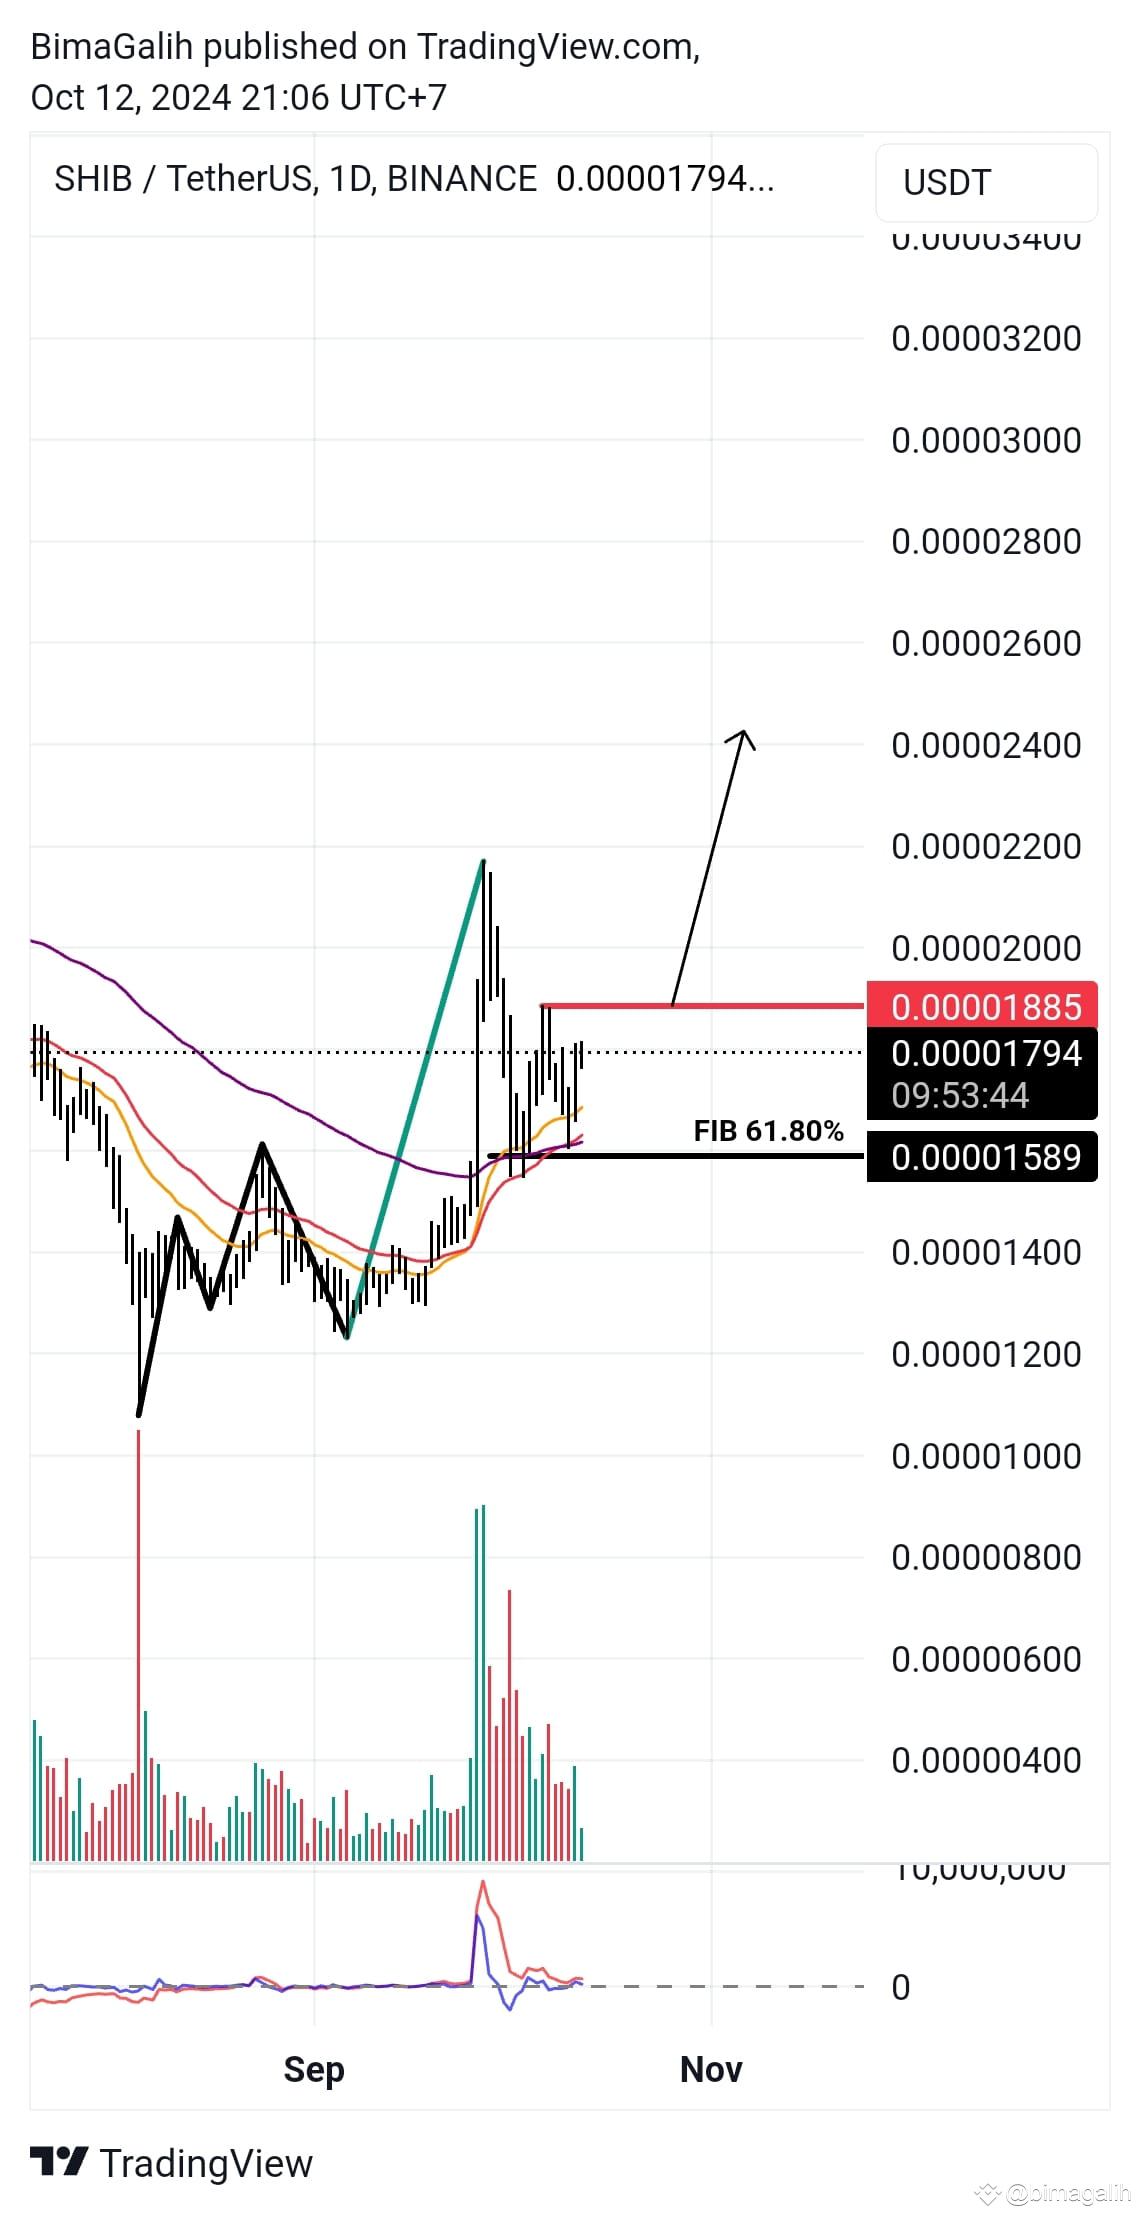
The SHIB coin exhibits early indications of a bullish trend formation, marked by a significant price increase that surpassed the previous peak. However, following this breakthrough, the price experienced a substantial correction and halted at the 61.8% Fibonacci retracement level. Currently, the price is undergoing a prolonged sideways movement. The red resistance line indicated on the chart should be closely monitored, as a successful breakout above this line could signal a continuation of the bullish trend.
$SHIB #moonbix
$SHIB #moonbix
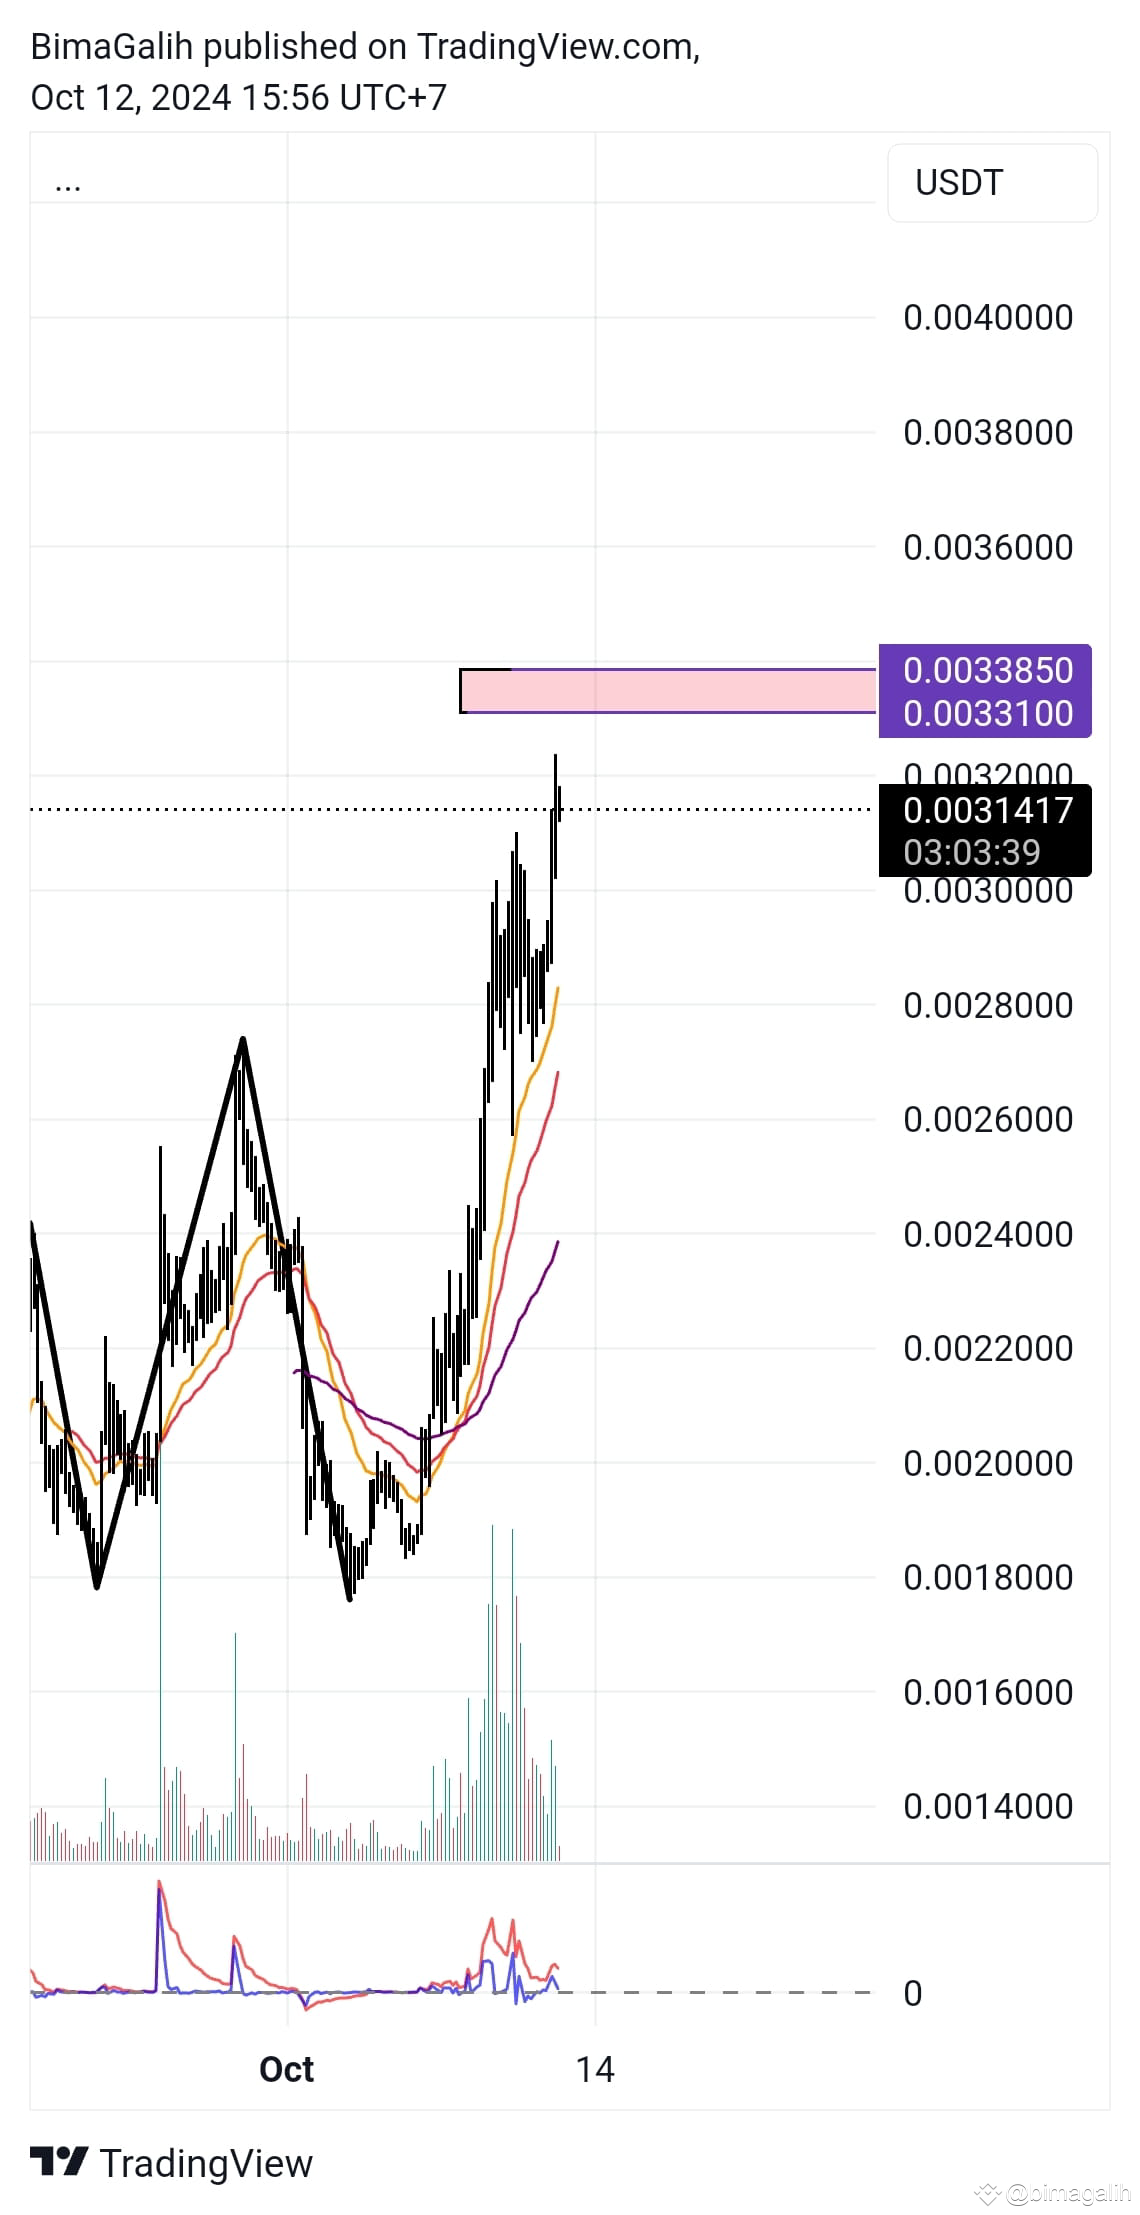
The 1MBABYDOGE coin is nearing the Fibonacci cluster area, which serves as a harmonic resistance. This area often marks the point where institutions take profits.
$1MBABYDOGE #moonbix #1MBABYDODGE
$1MBABYDOGE #moonbix #1MBABYDODGE
The current NEIRO coin price has entered the Fibonacci cluster zone, which often acts as a strong resistance level. Traders who have previously opened long positions should be cautious. There is a high probability of a massive sell-off (profit taking) by institutions (whales) in the near future.
Recommendation:
Immediately close all long positions to anticipate potential larger losses and wait for the next pattern.
$NEIRO #moonbix #NEIRO_Spot_Profits
Recommendation:
Immediately close all long positions to anticipate potential larger losses and wait for the next pattern.
$NEIRO #moonbix #NEIRO_Spot_Profits
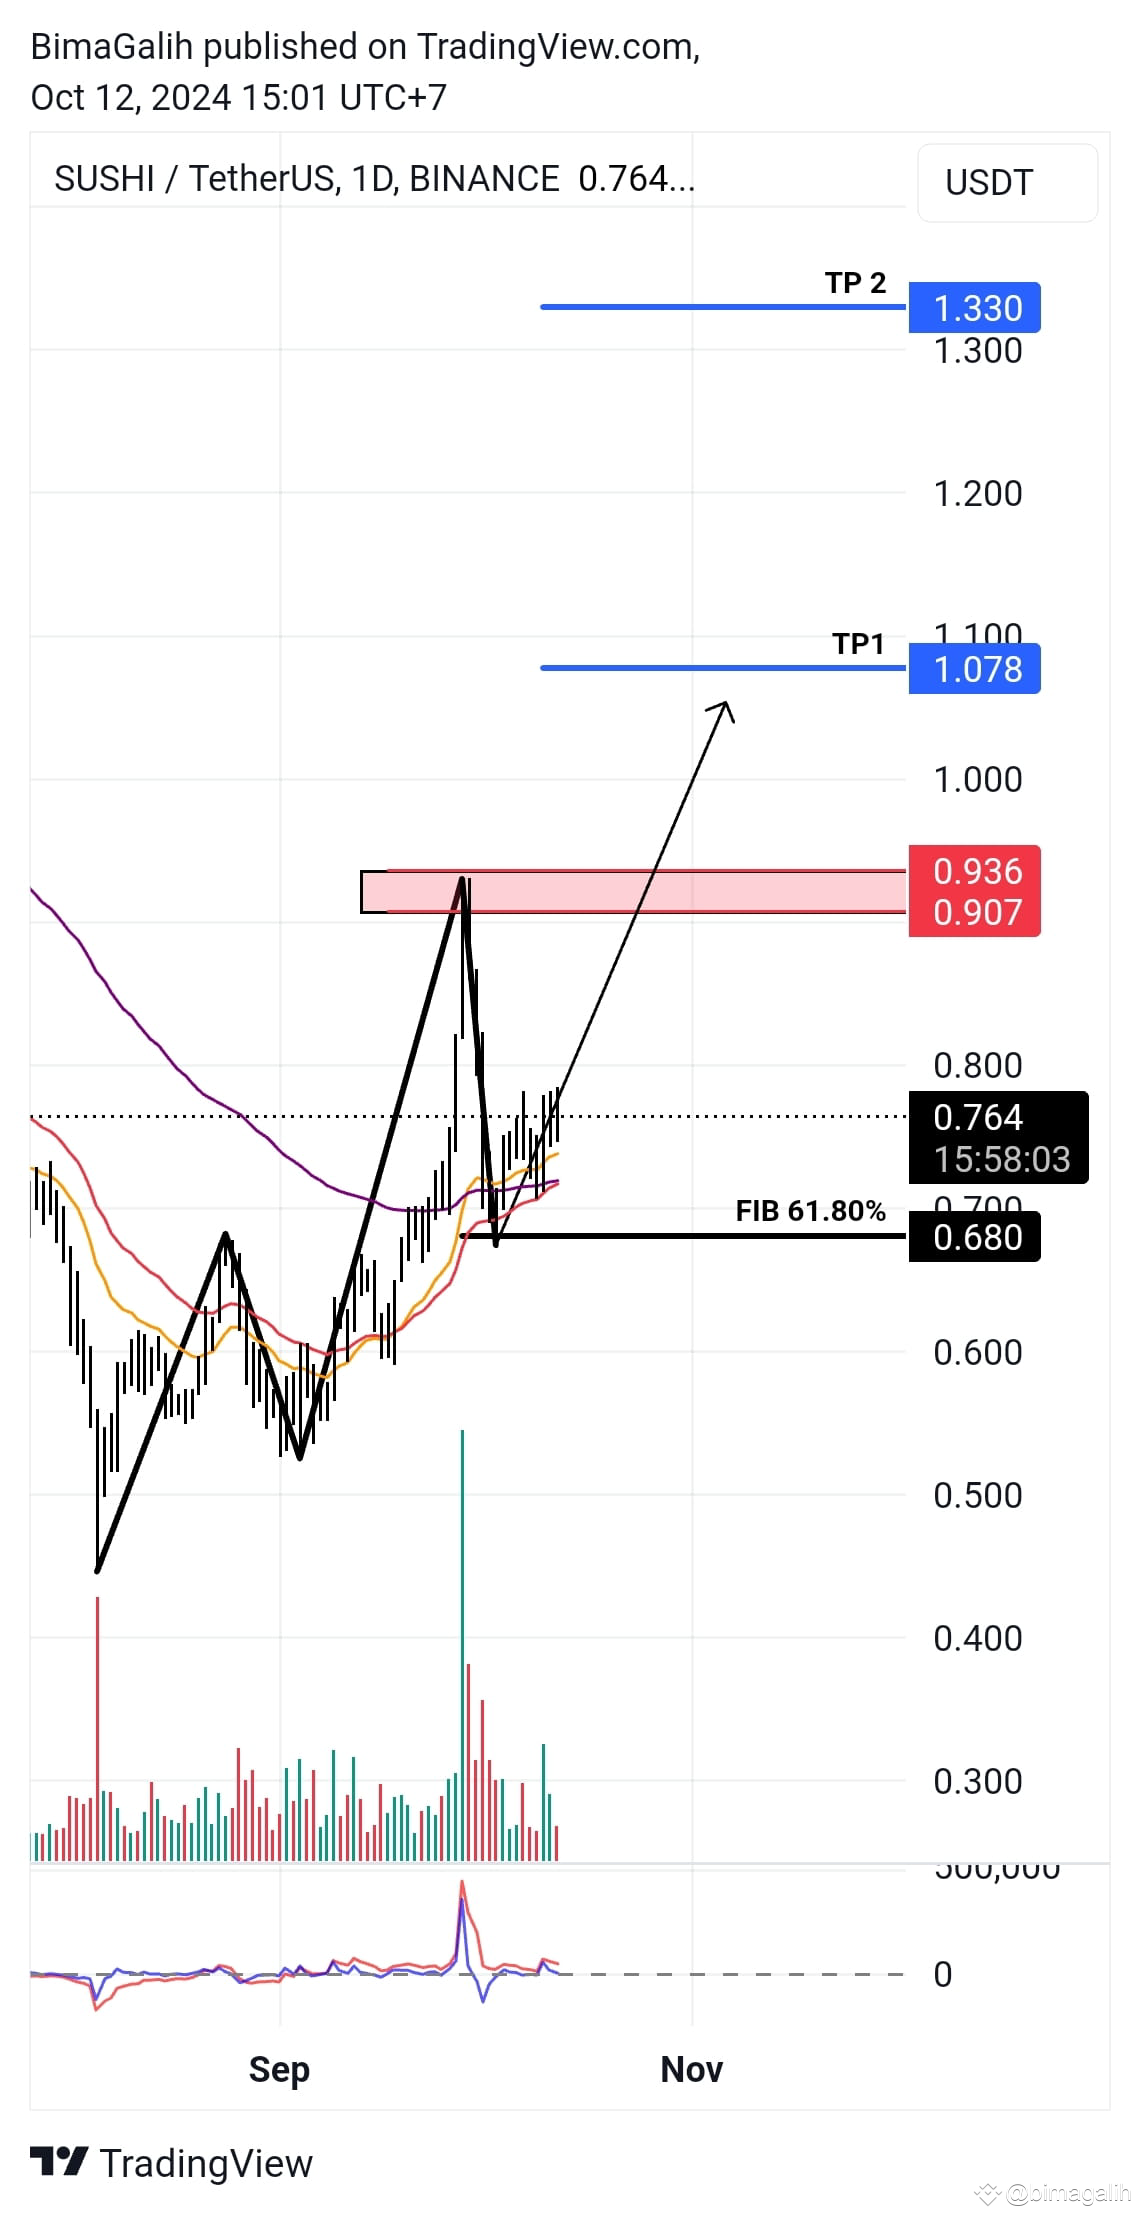
The SUSHI coin is showing a positive trend (bullish). However, there was a price reversal in the range of $0.907 to $0.936 due to a Fibonacci cluster, which became an area for market participants to take profits. Currently, the price is in a correction phase and accumulation is taking place. If the accumulation phase is complete, then the minimum price target is $1.078 and the maximum is $1.330.
It is recommended to wait for further confirmation before taking action.
$SUSHI #moonbix #SUSHIUSD
It is recommended to wait for further confirmation before taking action.
$SUSHI #moonbix #SUSHIUSD
Log in to explore more content