
Ammara Noraiz
41 Posts

Ammara Noraiz
Report
Block User
9 Following
16 Followers
25 Liked
Posts
All
Quotes
·
--
Bullish
SOL/USDT Market Outlook | November 5, 2026
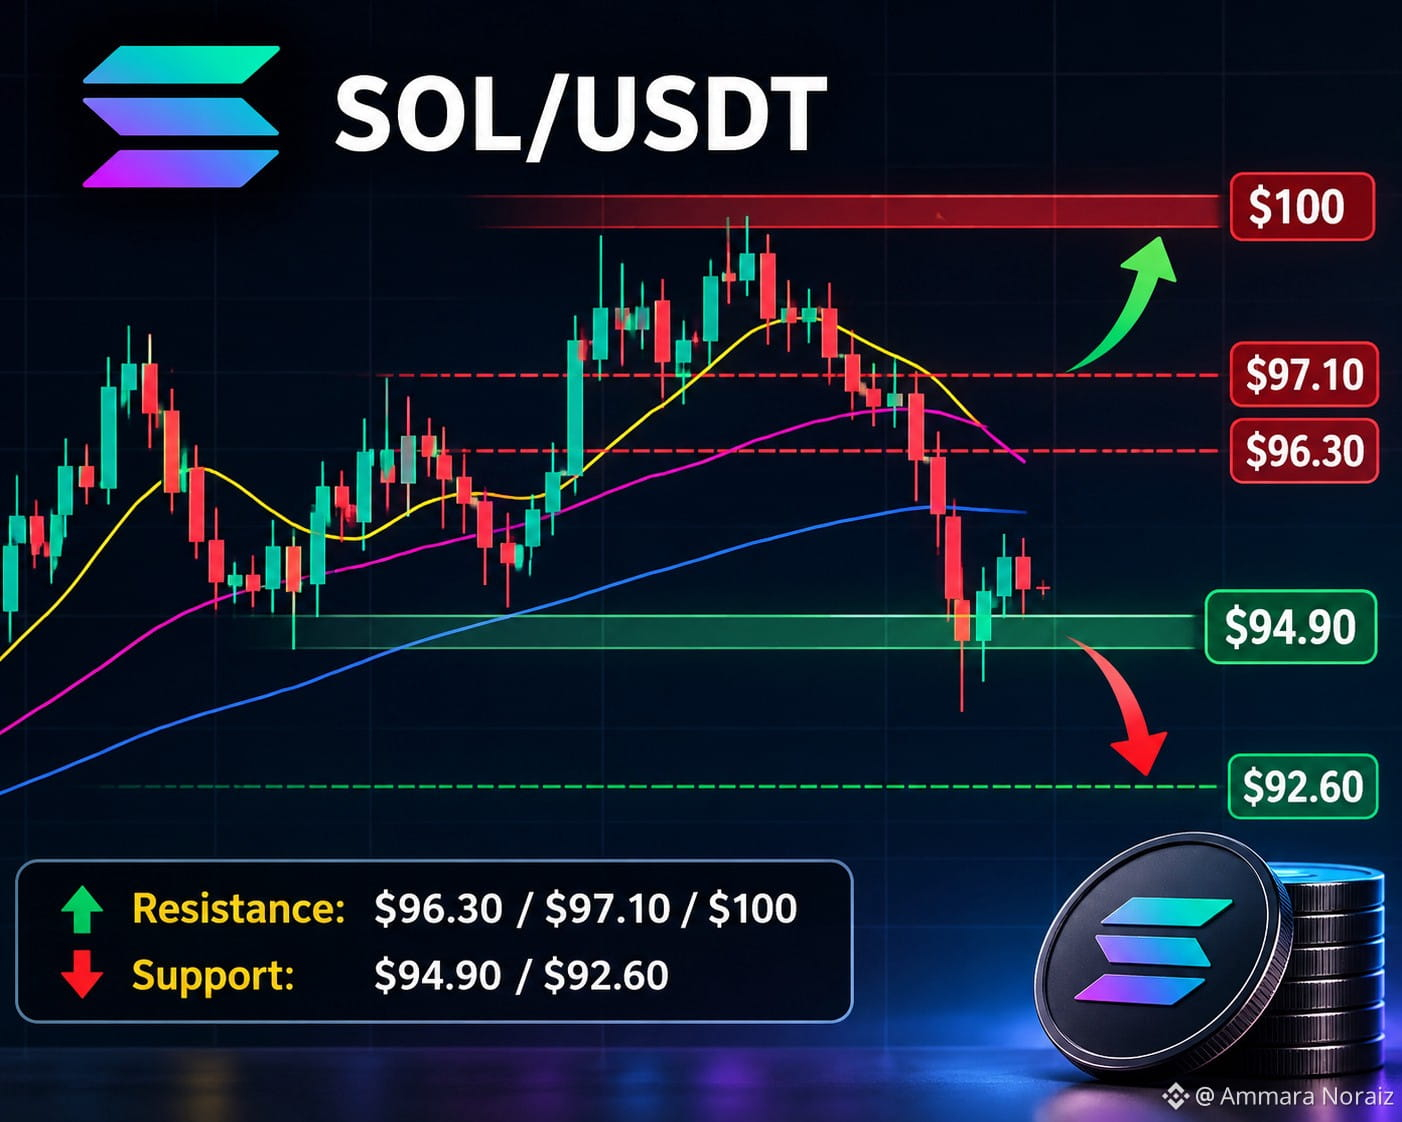
$SOL is currently trading around $95.40, showing short-term weakness after facing rejection near the $97 level. The price is trading below its key moving averages on the 15-minute chart, suggesting bearish momentum in the short term. Immediate support lies around $94.90, followed by $92.60, while resistance is positioned at $96.30 and $97.10. A sustained breakout above $97 could open the door toward the psychological $100 level. However, a breakdown below $94.90 may trigger further downside. Traders should watch volume and price confirmation before taking positions.
Key Levels:
Support: $94.90 / $92.60
Resistance: $96.30 / $97.10 / $100
#sol板块 #solana #solusdtfuturetrading #Binance #CryptoAnalysis
$SOL
SOL/USDT Market Outlook | November 5, 2026
$SOL is currently trading around $95.40, showing short-term weakness after facing rejection near the $97 level. The price is trading below its key moving averages on the 15-minute chart, suggesting bearish momentum in the short term. Immediate support lies around $94.90, followed by $92.60, while resistance is positioned at $96.30 and $97.10. A sustained breakout above $97 could open the door toward the psychological $100 level. However, a breakdown below $94.90 may trigger further downside. Traders should watch volume and price confirmation before taking positions.
Key Levels:
Support: $94.90 / $92.60
Resistance: $96.30 / $97.10 / $100
#sol板块 #solana #solusdtfuturetrading #Binance #CryptoAnalysis
$SOL
$SOL is currently trading around $95.40, showing short-term weakness after facing rejection near the $97 level. The price is trading below its key moving averages on the 15-minute chart, suggesting bearish momentum in the short term. Immediate support lies around $94.90, followed by $92.60, while resistance is positioned at $96.30 and $97.10. A sustained breakout above $97 could open the door toward the psychological $100 level. However, a breakdown below $94.90 may trigger further downside. Traders should watch volume and price confirmation before taking positions.
Key Levels:
Support: $94.90 / $92.60
Resistance: $96.30 / $97.10 / $100
#sol板块 #solana #solusdtfuturetrading #Binance #CryptoAnalysis
$SOL
1
1
290
$BTC is changing the way the world thinks about money, technology, and financial freedom. 🌍
From blockchain innovation to the future of digital assets, the crypto revolution is just getting started!
💡 Stay informed.
📊 Learn about the market.
🚀 Share your crypto insights.
🌐 Be part of the Bitcoin movement.
What do you think Bitcoin's future will look like? Drop your thoughts in the comments! 👇
#Bitcoin #CryptoEducation
#EarningsSeason
$BTC is changing the way the world thinks about money, technology, and financial freedom. 🌍
From blockchain innovation to the future of digital assets, the crypto revolution is just getting started!
💡 Stay informed.
📊 Learn about the market.
🚀 Share your crypto insights.
🌐 Be part of the Bitcoin movement.
What do you think Bitcoin's future will look like? Drop your thoughts in the comments! 👇
#Bitcoin #CryptoEducation
#EarningsSeason
From blockchain innovation to the future of digital assets, the crypto revolution is just getting started!
💡 Stay informed.
📊 Learn about the market.
🚀 Share your crypto insights.
🌐 Be part of the Bitcoin movement.
What do you think Bitcoin's future will look like? Drop your thoughts in the comments! 👇
#Bitcoin #CryptoEducation
#EarningsSeason
92



Article
From Concept to Reality: How @FabricFoundation Uses $ROBO for Smart Automation #ROBOThe future of decentralised AI is unfolding fast, and @FabricFND is leading the charge 🚀 With it at its core, the ecosystem is focused on building real utility through smart automation and intelligent blockchain integration. This isn’t just another trend—Fabric is creating a foundation where AI-driven systems can operate efficiently, securely, and transparently.
From enhancing automation to enabling smarter decision-making on-chain, $ROBO represents a shift toward practical innovation. The combination of advanced technology and real-world use cases makes this project stand out in a crowded space.
Keeping a close eye on how @FabricFoundation continues to evolve, because projects like this define the next phase of Web3. #ROBO
From Concept to Reality: How @FabricFoundation Uses $ROBO for Smart Automation #ROBO
The future of decentralised AI is unfolding fast, and @Fabric Foundation is leading the charge 🚀 With it at its core, the ecosystem is focused on building real utility through smart automation and intelligent blockchain integration. This isn’t just another trend—Fabric is creating a foundation where AI-driven systems can operate efficiently, securely, and transparently.
From enhancing automation to enabling smarter decision-making on-chain, $ROBO represents a shift toward practical innovation. The combination of advanced technology and real-world use cases makes this project stand out in a crowded space.
Keeping a close eye on how @FabricFoundation continues to evolve, because projects like this define the next phase of Web3. #ROBO
From enhancing automation to enabling smarter decision-making on-chain, $ROBO represents a shift toward practical innovation. The combination of advanced technology and real-world use cases makes this project stand out in a crowded space.
Keeping a close eye on how @FabricFoundation continues to evolve, because projects like this define the next phase of Web3. #ROBO
10
·
--
Bullish
$ROBO Exploring the future of decentralised
{future}(ROBOUSDT)
AI with @FabricFoundation 🚀 $ROBO is shaping a smarter on-chain ecosystem where automation meets real utility. The innovation behind Fabric is truly next-level. Keeping a close eye on this evolution 👀 #ROBO
$ROBO Exploring the future of decentralised
AI with @FabricFoundation 🚀 $ROBO is shaping a smarter on-chain ecosystem where automation meets real utility. The innovation behind Fabric is truly next-level. Keeping a close eye on this evolution 👀 #ROBO
AI with @FabricFoundation 🚀 $ROBO is shaping a smarter on-chain ecosystem where automation meets real utility. The innovation behind Fabric is truly next-level. Keeping a close eye on this evolution 👀 #ROBO

7
·
--
Bullish
$SOL just pulled a crazy move 🚀
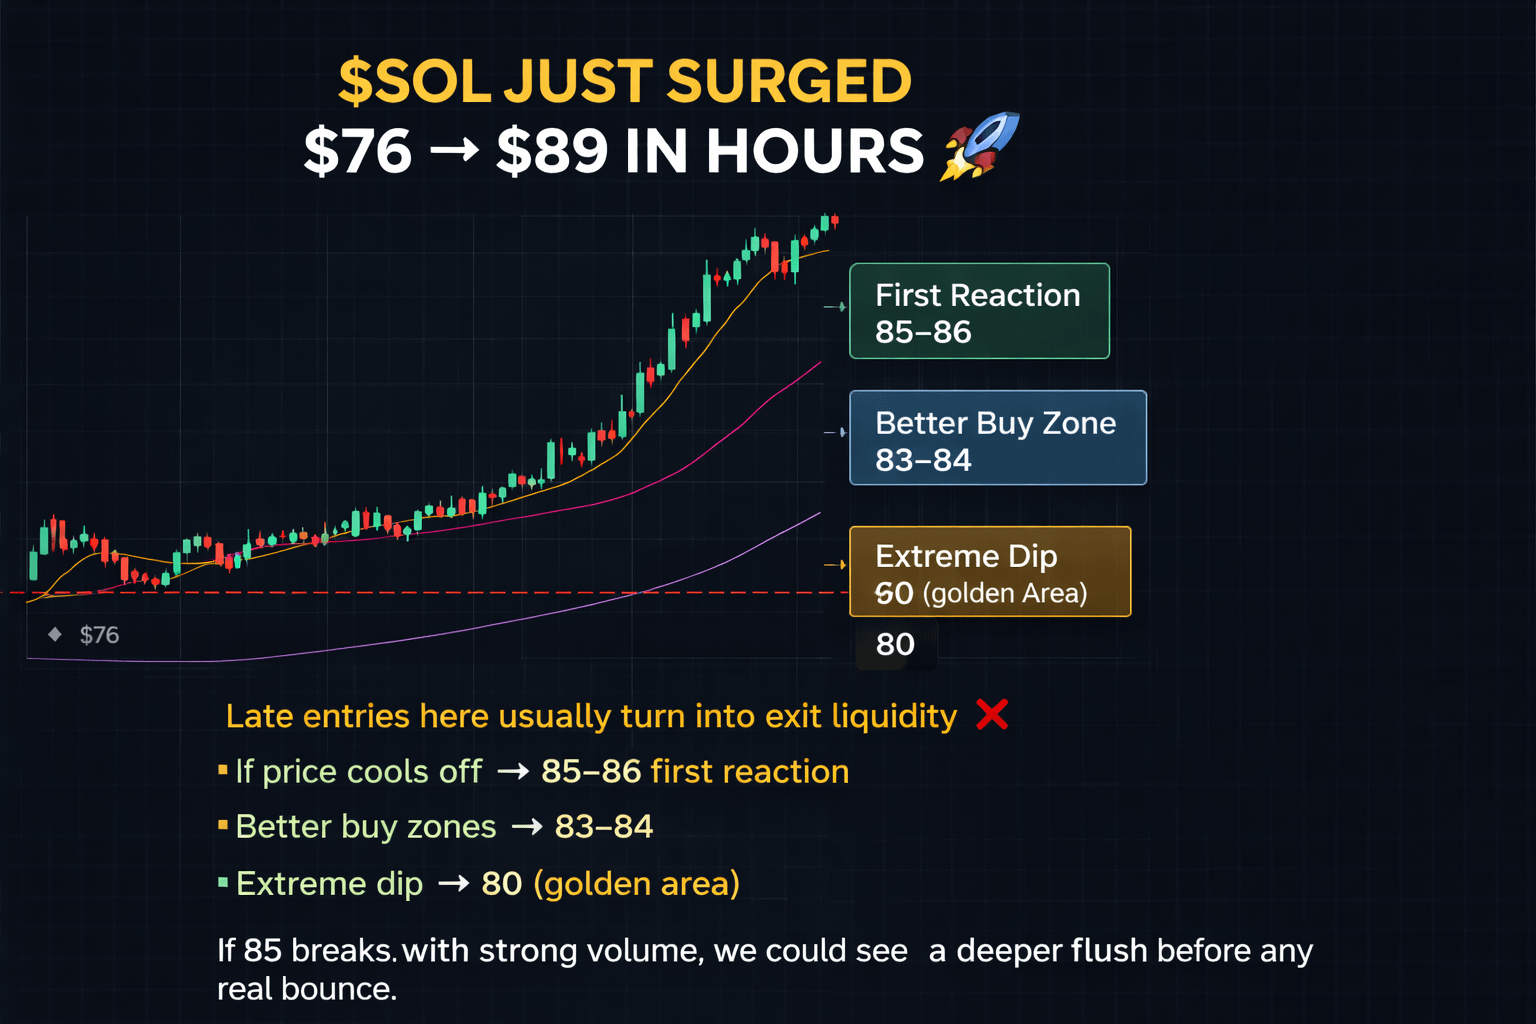
From $76 → $89 in a few hours… that’s not normal price action, that’s pure momentum + liquidity grab.
Right now,
this is NOT a safe chase zone ❌
Late entries here usually turn into exit liquidity.
What I’m watching 👇
• If price cools off → 85–86 first reaction
• Better buy zones → 83–84
• Extreme dip → 80 (golden area)
If 85 breaks with strong volume, we could see a deeper flush before any real bounce.
No FOMO. No chasing green candles.
Patience > impulse.
Let the market come to you 💯
#SOL #CryptoTrading #scalping #BinanceSquare
{future}(SOLUSDT)
$SOL just pulled a crazy move 🚀
From $76 → $89 in a few hours… that’s not normal price action, that’s pure momentum + liquidity grab.
Right now,
this is NOT a safe chase zone ❌
Late entries here usually turn into exit liquidity.
What I’m watching 👇
• If price cools off → 85–86 first reaction
• Better buy zones → 83–84
• Extreme dip → 80 (golden area)
If 85 breaks with strong volume, we could see a deeper flush before any real bounce.
No FOMO. No chasing green candles.
Patience > impulse.
Let the market come to you 💯
#SOL #CryptoTrading #scalping #BinanceSquare
From $76 → $89 in a few hours… that’s not normal price action, that’s pure momentum + liquidity grab.
Right now,
this is NOT a safe chase zone ❌
Late entries here usually turn into exit liquidity.
What I’m watching 👇
• If price cools off → 85–86 first reaction
• Better buy zones → 83–84
• Extreme dip → 80 (golden area)
If 85 breaks with strong volume, we could see a deeper flush before any real bounce.
No FOMO. No chasing green candles.
Patience > impulse.
Let the market come to you 💯
#SOL #CryptoTrading #scalping #BinanceSquare
79
[click and win reward 💯❣️](https://app.binance.com/uni-qr/HMZ3xDxK?utm_medium=web_share_copy)
click and win reward 💯❣️

7
·
--
Bearish
$SOL Spot Setup
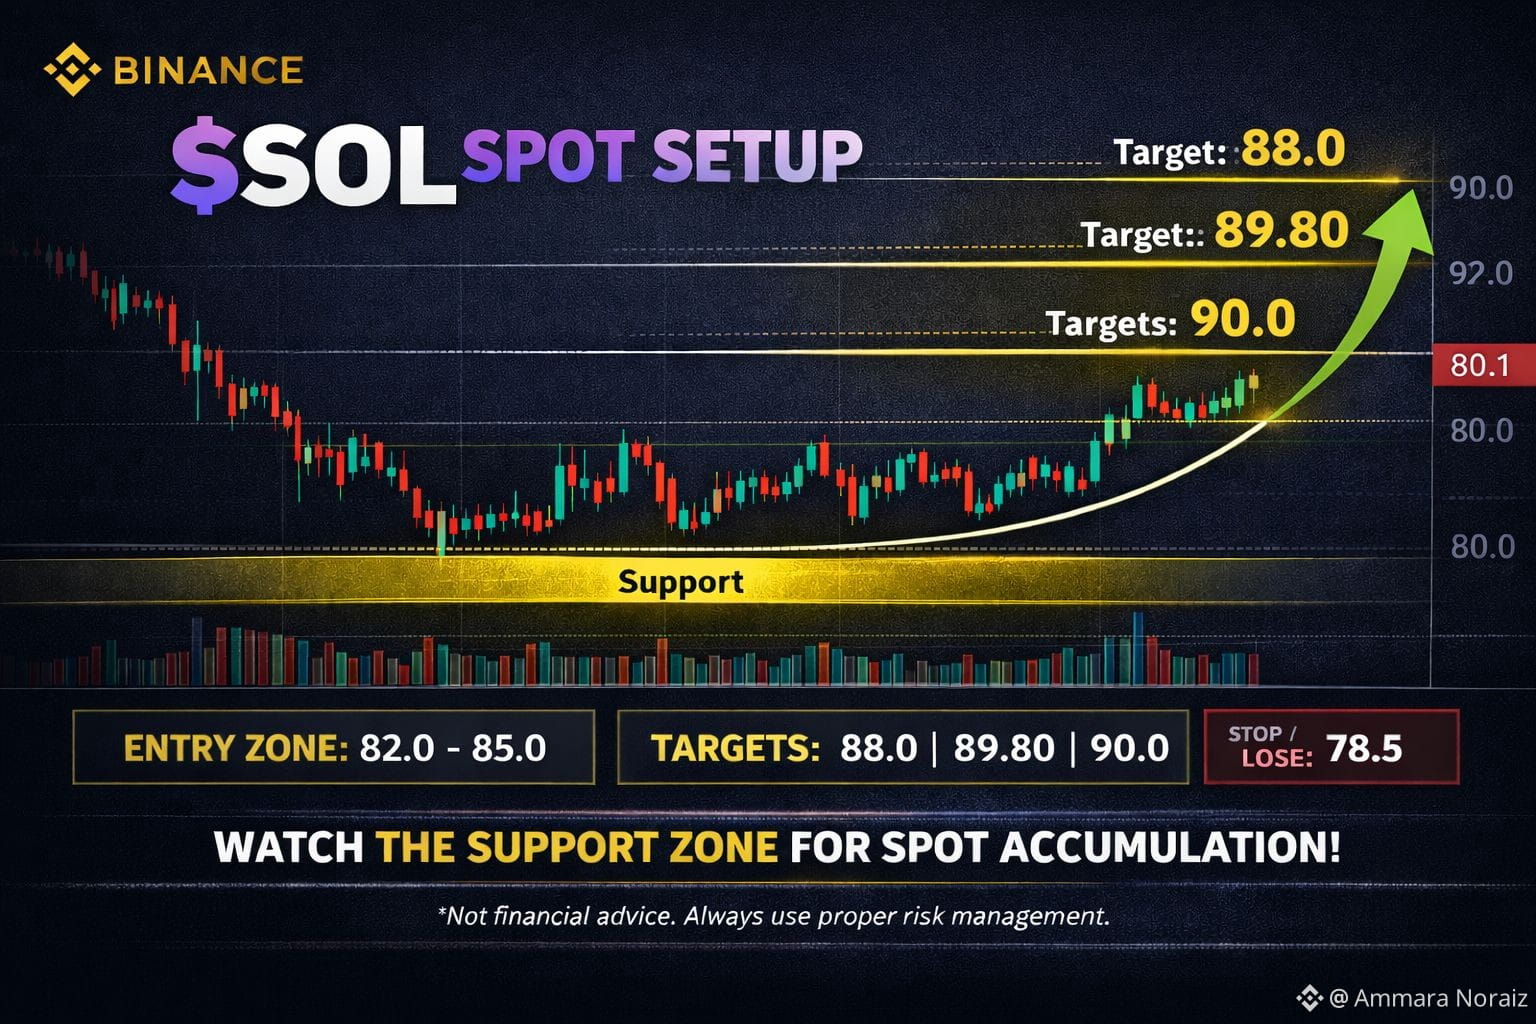
$SOL is consolidating near support after a sharp decline, and price is showing early signs of stabilization. If buyers defend the current zone, a short-term bounce is possible.
Entry Zone: 82.0 – 85.0
Targets: 88.0 / 89.80 / 90.0
Stop-Loss: Below 78.5
As long as price holds above the support area, dips into the entry zone can offer spot accumulation opportunities. A clean break above $90 could bring stronger momentum toward higher targets.
Not financial advice. Always use proper risk management.
#BTCFellBelow$69,000Again #OpenClawFounderJoinsOpenAI #TradeCryptosOnX
{future}(SOLUSDT)
$SOL Spot Setup
$SOL is consolidating near support after a sharp decline, and price is showing early signs of stabilization. If buyers defend the current zone, a short-term bounce is possible.
Entry Zone: 82.0 – 85.0
Targets: 88.0 / 89.80 / 90.0
Stop-Loss: Below 78.5
As long as price holds above the support area, dips into the entry zone can offer spot accumulation opportunities. A clean break above $90 could bring stronger momentum toward higher targets.
Not financial advice. Always use proper risk management.
#BTCFellBelow$69,000Again #OpenClawFounderJoinsOpenAI #TradeCryptosOnX
$SOL is consolidating near support after a sharp decline, and price is showing early signs of stabilization. If buyers defend the current zone, a short-term bounce is possible.
Entry Zone: 82.0 – 85.0
Targets: 88.0 / 89.80 / 90.0
Stop-Loss: Below 78.5
As long as price holds above the support area, dips into the entry zone can offer spot accumulation opportunities. A clean break above $90 could bring stronger momentum toward higher targets.
Not financial advice. Always use proper risk management.
#BTCFellBelow$69,000Again #OpenClawFounderJoinsOpenAI #TradeCryptosOnX
1
3
216
·
--
Bearish
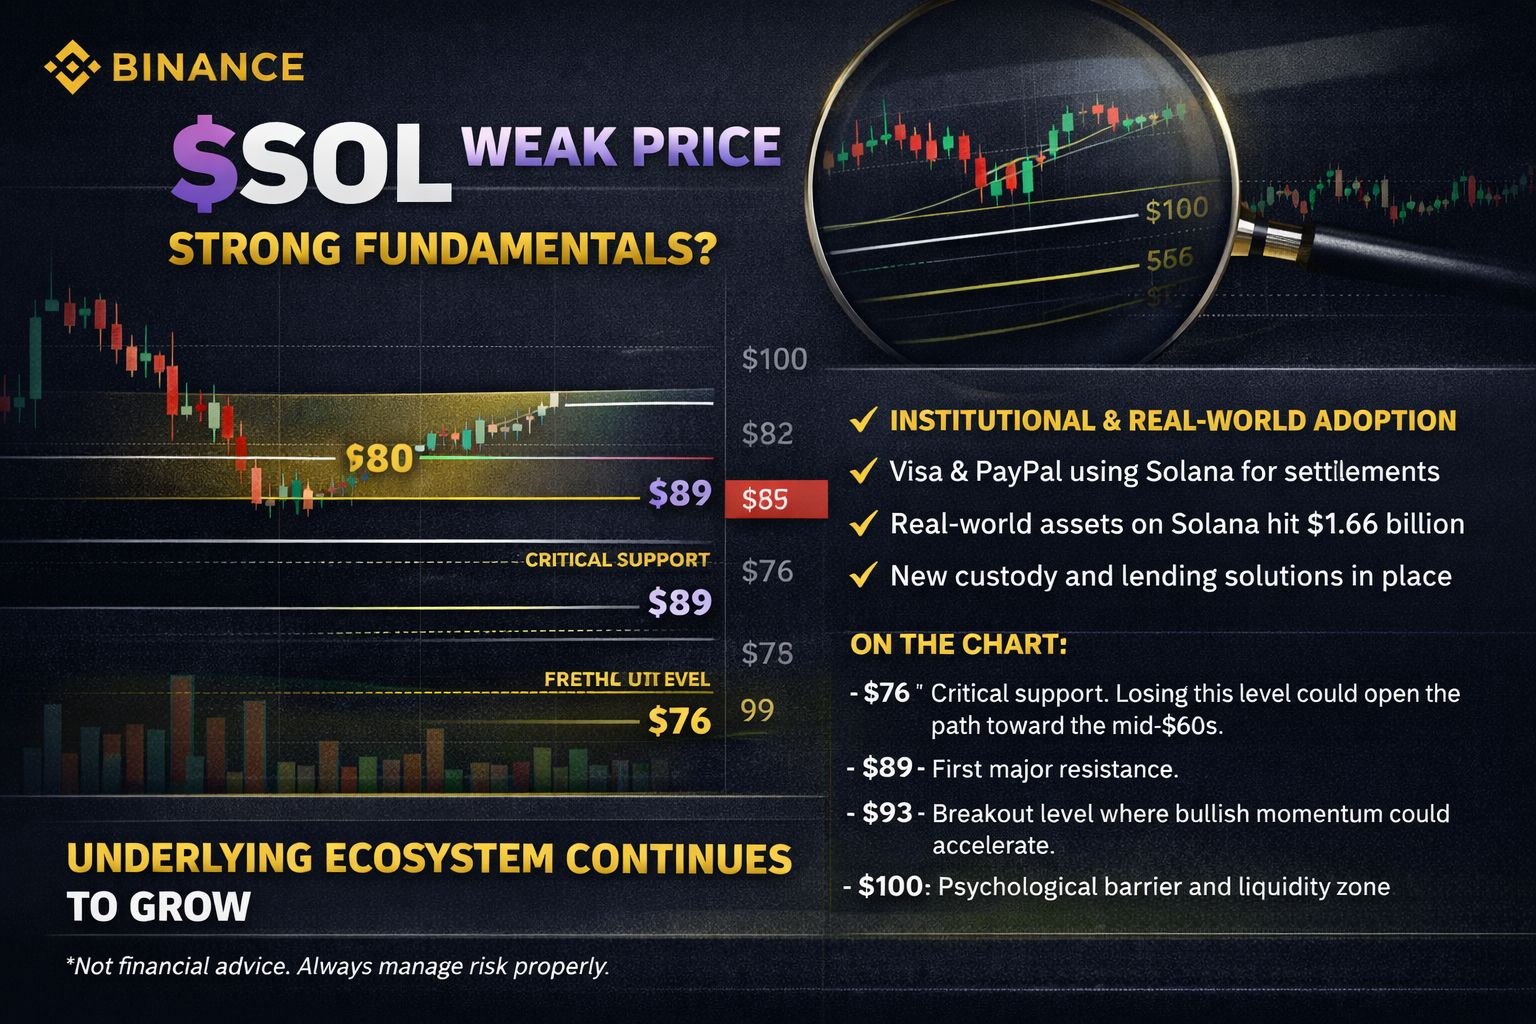
$SOL is trading in the mid-$80s, and while the chart still looks weak, the fundamentals tell a different story. Institutional interest, stablecoin settlements, and real-world assets on the network continue to grow, showing steady ecosystem expansion.
Technically, $SOL dropped from the $140+ region and found support near $76. Price is now hovering around $85, attempting to stabilize.
Key Levels:
$76 – critical support
{future}(SOLUSDT)
$89 – first resistance
$93 – momentum breakout level
$100 – psychological barrier
Momentum remains neutral, suggesting consolidation rather than a confirmed reversal. If fundamentals keep improving, price could eventually catch up.
Not financial advice. Manage risk properly
#OpenClawFounderJoinsOpenAI #solana #PEPEBrokeThroughDowntrendLine
$SOL is trading in the mid-$80s, and while the chart still looks weak, the fundamentals tell a different story. Institutional interest, stablecoin settlements, and real-world assets on the network continue to grow, showing steady ecosystem expansion.
Technically, $SOL dropped from the $140+ region and found support near $76. Price is now hovering around $85, attempting to stabilize.
Key Levels:
$76 – critical support
$89 – first resistance
$93 – momentum breakout level
$100 – psychological barrier
Momentum remains neutral, suggesting consolidation rather than a confirmed reversal. If fundamentals keep improving, price could eventually catch up.
Not financial advice. Manage risk properly
#OpenClawFounderJoinsOpenAI #solana #PEPEBrokeThroughDowntrendLine
Technically, $SOL dropped from the $140+ region and found support near $76. Price is now hovering around $85, attempting to stabilize.
Key Levels:
$76 – critical support
$89 – first resistance
$93 – momentum breakout level
$100 – psychological barrier
Momentum remains neutral, suggesting consolidation rather than a confirmed reversal. If fundamentals keep improving, price could eventually catch up.
Not financial advice. Manage risk properly
#OpenClawFounderJoinsOpenAI #solana #PEPEBrokeThroughDowntrendLine
1
156
·
--
Bullish
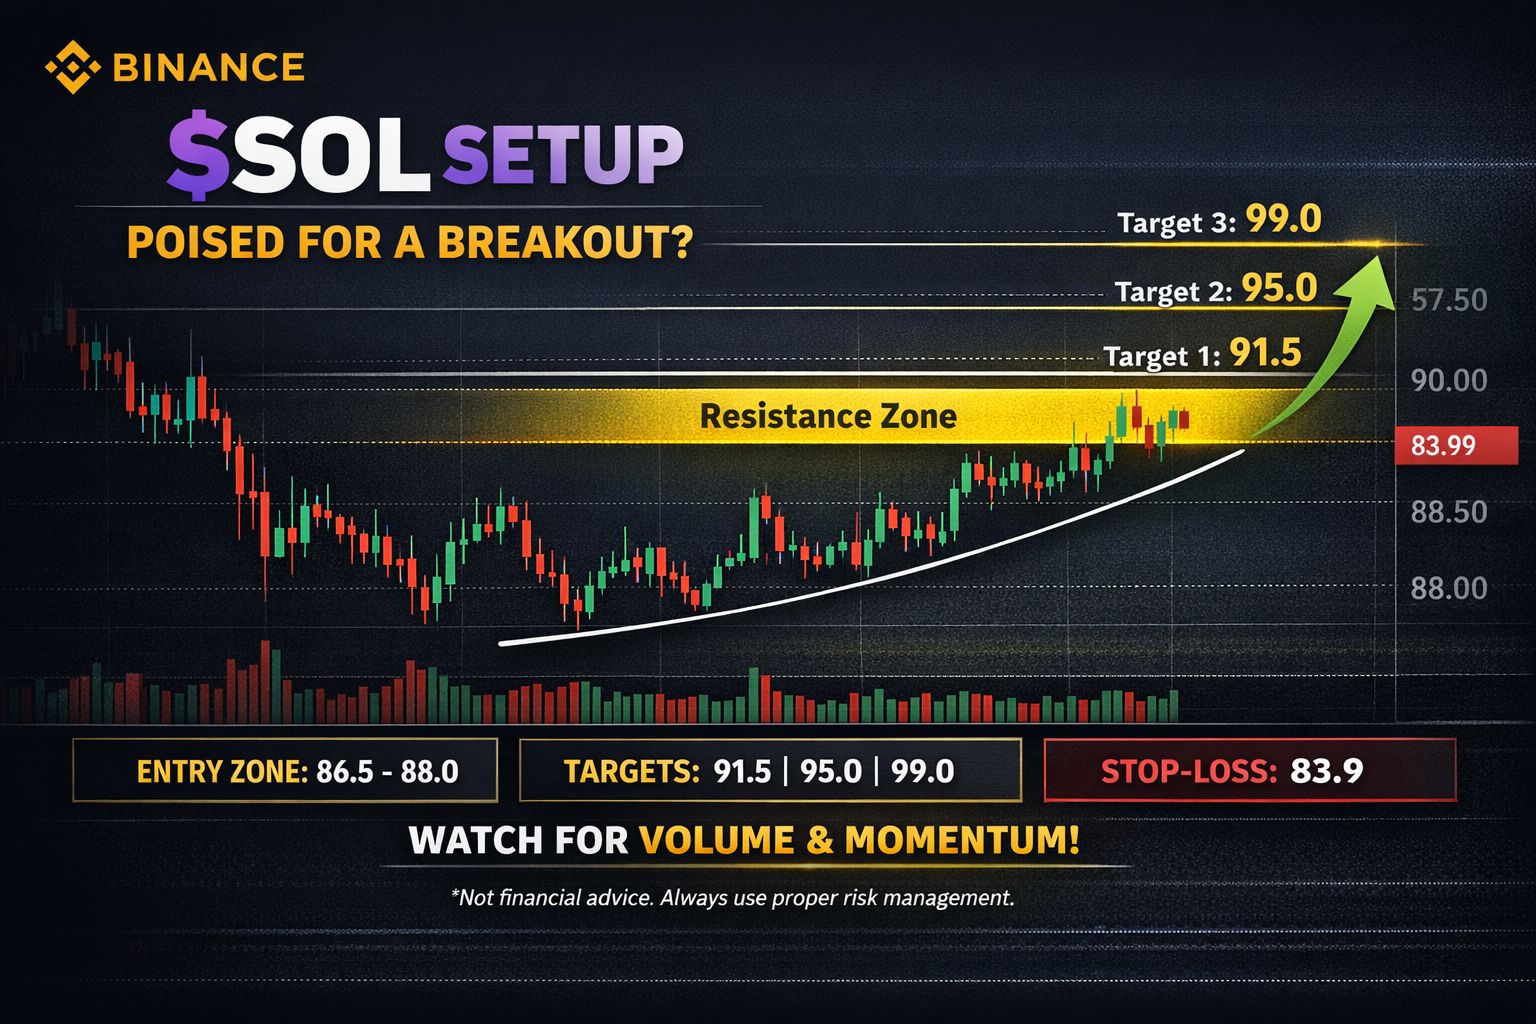
$SOL is showing signs of short-term stabilization after a sharp rebound, forming higher lows on the 1H chart. Price is gradually moving back toward the nearby resistance zone, indicating that buyers are starting to regain control. If this structure holds, a continuation toward the next liquidity levels is possible.
Entry Zone: 86.5 – 88.0
Targets:
TP 1 : 91.5
TP 2 : 95.0
TP 3 : 99.0
Stop-Loss: 83.9
If $SOL pushes above resistance with strong volume, the move toward upper targets could be swift. However, losing the support zone would invalidate the setup, so proper risk management remains key.
#MarketRally #RiskAssetsMarketShock #solana
{future}(SOLUSDT)
$SOL is showing signs of short-term stabilization after a sharp rebound, forming higher lows on the 1H chart. Price is gradually moving back toward the nearby resistance zone, indicating that buyers are starting to regain control. If this structure holds, a continuation toward the next liquidity levels is possible.
Entry Zone: 86.5 – 88.0
Targets:
TP 1 : 91.5
TP 2 : 95.0
TP 3 : 99.0
Stop-Loss: 83.9
If $SOL pushes above resistance with strong volume, the move toward upper targets could be swift. However, losing the support zone would invalidate the setup, so proper risk management remains key.
#MarketRally #RiskAssetsMarketShock #solana
Entry Zone: 86.5 – 88.0
Targets:
TP 1 : 91.5
TP 2 : 95.0
TP 3 : 99.0
Stop-Loss: 83.9
If $SOL pushes above resistance with strong volume, the move toward upper targets could be swift. However, losing the support zone would invalidate the setup, so proper risk management remains key.
#MarketRally #RiskAssetsMarketShock #solana
367
·
--
Bearish
Solana ($SOL )Technical Analysis and Trade Setup*
*Current Market Situation:*
Solana ($SOL #MarketRally ) is currently trading within a strong demand zone, ranging from $84 to $86. The selling pressure is gradually diminishing, and momentum is shifting in favor of a potential bounce.
*Trade Setup:*
- *Entry Point:* $84 - $87
- *Stop Loss (SL):* $80
- *Take Profit (TP) Levels:*
- TP1: $92
- TP2: $98
- TP3: $105
*Technical Analysis:*
The price continues to hold above the key support level, with buyers actively defending this range. Each dip is being absorbed, and the downside follow-through is weak. A successful reclaim and hold above $90 could accelerate the upside momentum.
*Risk Management:*
As long as SOL remains above $84, a recovery move is still in play. It is essential to manage risk and respect invalidation levels to ensure a successful trade.
*Recommendation:*
Consider going long on $SOL within the specified entry range, with a stop loss at $80 and take profit levels at $92, $98, and $105. Monitor the price action closely and adjust the trade accordingly.
#MarketRally #solana #RiskAssetsMarketShock
Solana ($SOL )Technical Analysis and Trade Setup*
*Current Market Situation:*
Solana ($SOL #MarketRally ) is currently trading within a strong demand zone, ranging from $84 to $86. The selling pressure is gradually diminishing, and momentum is shifting in favor of a potential bounce.
*Trade Setup:*
- *Entry Point:* $84 - $87
- *Stop Loss (SL):* $80
- *Take Profit (TP) Levels:*
- TP1: $92
- TP2: $98
- TP3: $105
*Technical Analysis:*
The price continues to hold above the key support level, with buyers actively defending this range. Each dip is being absorbed, and the downside follow-through is weak. A successful reclaim and hold above $90 could accelerate the upside momentum.
*Risk Management:*
As long as SOL remains above $84, a recovery move is still in play. It is essential to manage risk and respect invalidation levels to ensure a successful trade.
*Recommendation:*
Consider going long on $SOL within the specified entry range, with a stop loss at $80 and take profit levels at $92, $98, and $105. Monitor the price action closely and adjust the trade accordingly.
#MarketRally #solana #RiskAssetsMarketShock
*Current Market Situation:*
Solana ($SOL #MarketRally ) is currently trading within a strong demand zone, ranging from $84 to $86. The selling pressure is gradually diminishing, and momentum is shifting in favor of a potential bounce.
*Trade Setup:*
- *Entry Point:* $84 - $87
- *Stop Loss (SL):* $80
- *Take Profit (TP) Levels:*
- TP1: $92
- TP2: $98
- TP3: $105
*Technical Analysis:*
The price continues to hold above the key support level, with buyers actively defending this range. Each dip is being absorbed, and the downside follow-through is weak. A successful reclaim and hold above $90 could accelerate the upside momentum.
*Risk Management:*
As long as SOL remains above $84, a recovery move is still in play. It is essential to manage risk and respect invalidation levels to ensure a successful trade.
*Recommendation:*
Consider going long on $SOL within the specified entry range, with a stop loss at $80 and take profit levels at $92, $98, and $105. Monitor the price action closely and adjust the trade accordingly.
#MarketRally #solana #RiskAssetsMarketShock
2
139
seriously...?🤔🤔
seriously...?🤔🤔

MoonCraft
·
--
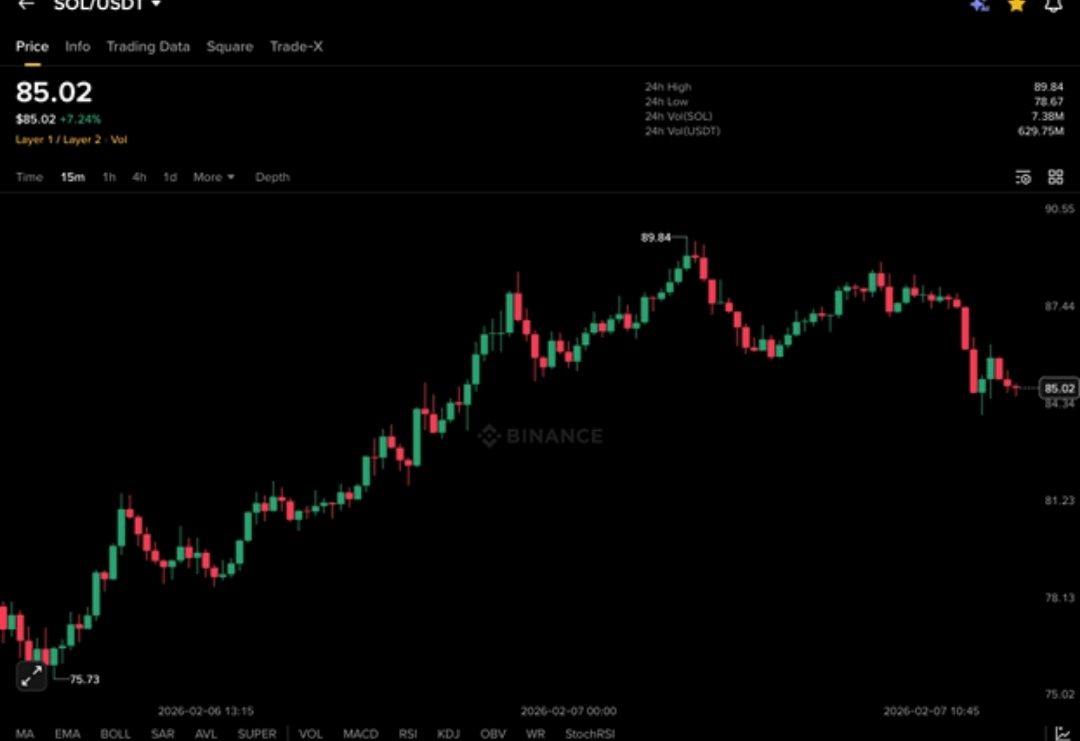
$SOL holding strength after impulsive rally with controlled pullback.
Structure remains bullish with buyers defending higher demand.
EP 84.00 – 86.00
TP
TP 188.00
TP 290.00
TP 392.50
SL 81.50
Structure remains bullish with buyers defending higher demand.
EP 84.00 – 86.00
TP
TP 188.00
TP 290.00
TP 392.50
SL 81.50
6
hope so it will
hope so it will


Blockchain_Official
·
--
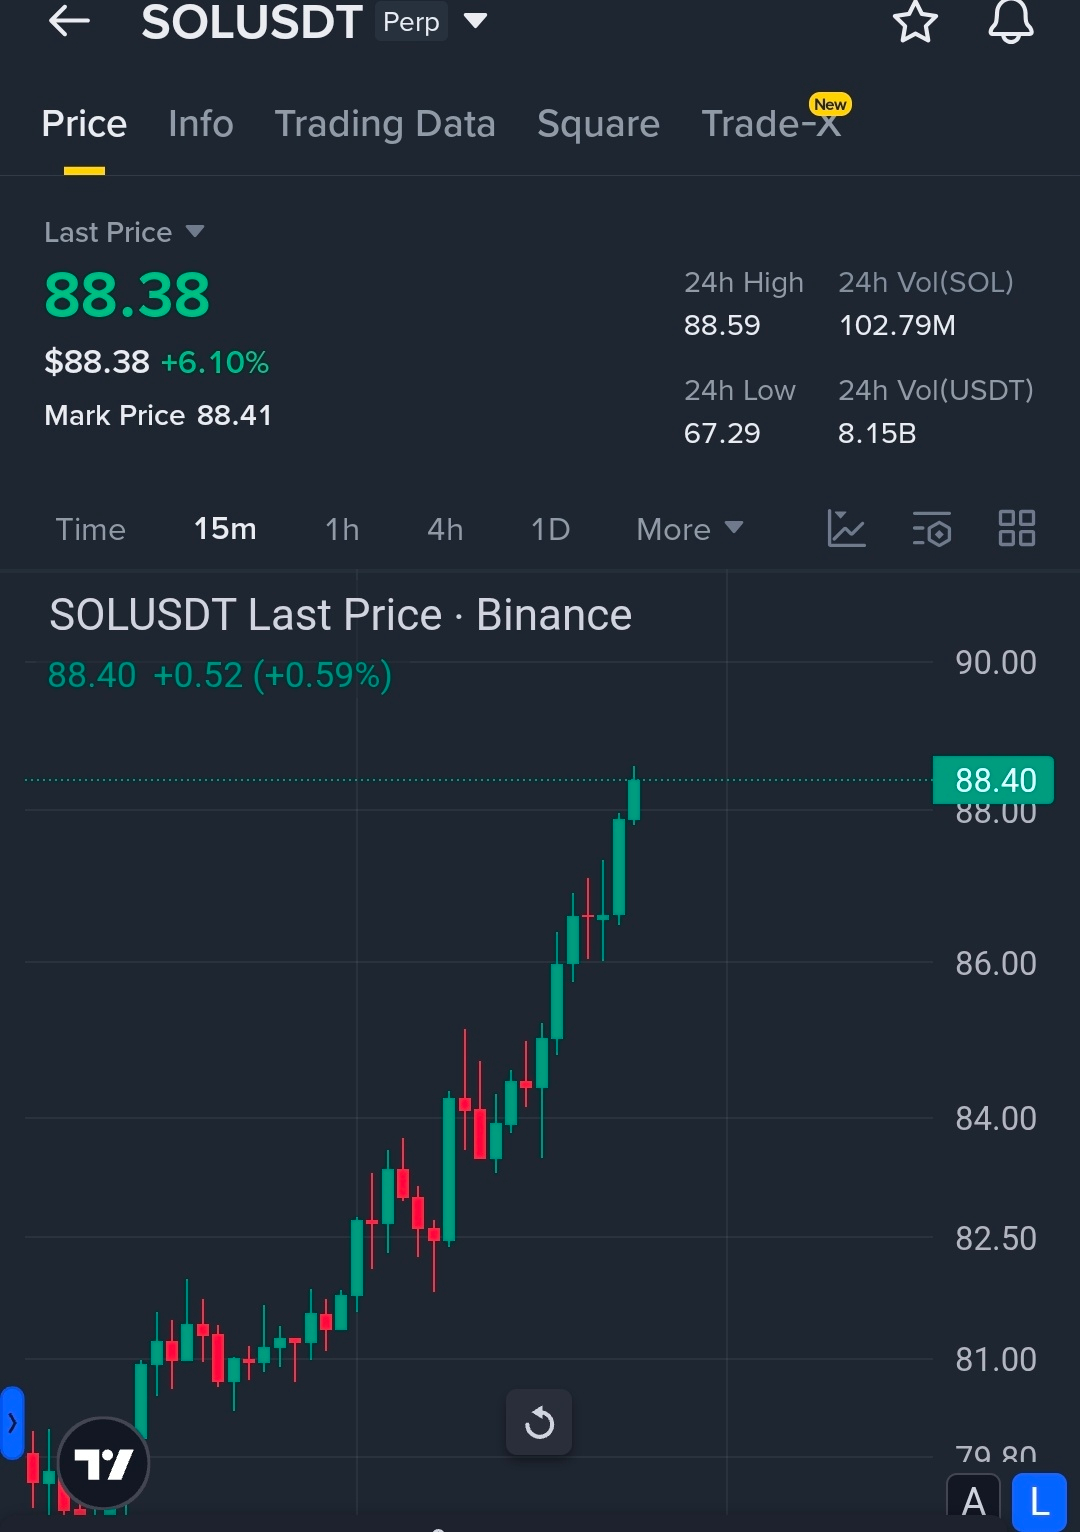
Bullish$SOL Rocketting From Deep Lows – Bullish Momentum Accelerating Fast........
Long SOL
Entry: 87 – 89
SL: 84
TP1: 95
TP2: 105
TP3: 115
Click here to Trade 👇
Long SOL
Entry: 87 – 89
SL: 84
TP1: 95
TP2: 105
TP3: 115
Click here to Trade 👇
3
📈 $BERA Shows Strong Short-Term Momentum Amid Increased Volume
$BERA reflecting strong short-term momentum and increased market participation.
The price action is supported by:
• Noticeable surge in trading volume
• Growing market attention
• Positive short-term sentiment
Such movements often indicate heightened speculative interest; however, traders should remain cautious and avoid entering solely based on price acceleration.
🔍 Risk management and independent research (DYOR) remain essential, especially during high-volatility phases.
If momentum sustains with healthy volume, $BERA could continue to attract short-term opportunities — otherwise, a consolidation or pullback should not be ruled out.
📌 Market View: Neutral to cautiously bullish
📊 Strategy: Wait for confirmation, avoid FOMO
#BERA #TopGainers #Binance
#CryptoMarket #Altcoins #WriteToEarn
#CryptoAnalysis #DYOR
{future}(BERAUSDT)
📈 $BERA Shows Strong Short-Term Momentum Amid Increased Volume
$BERA reflecting strong short-term momentum and increased market participation.
The price action is supported by:
• Noticeable surge in trading volume
• Growing market attention
• Positive short-term sentiment
Such movements often indicate heightened speculative interest; however, traders should remain cautious and avoid entering solely based on price acceleration.
🔍 Risk management and independent research (DYOR) remain essential, especially during high-volatility phases.
If momentum sustains with healthy volume, $BERA could continue to attract short-term opportunities — otherwise, a consolidation or pullback should not be ruled out.
📌 Market View: Neutral to cautiously bullish
📊 Strategy: Wait for confirmation, avoid FOMO
#BERA #TopGainers #Binance
#CryptoMarket #Altcoins #WriteToEarn
#CryptoAnalysis #DYOR
$BERA reflecting strong short-term momentum and increased market participation.
The price action is supported by:
• Noticeable surge in trading volume
• Growing market attention
• Positive short-term sentiment
Such movements often indicate heightened speculative interest; however, traders should remain cautious and avoid entering solely based on price acceleration.
🔍 Risk management and independent research (DYOR) remain essential, especially during high-volatility phases.
If momentum sustains with healthy volume, $BERA could continue to attract short-term opportunities — otherwise, a consolidation or pullback should not be ruled out.
📌 Market View: Neutral to cautiously bullish
📊 Strategy: Wait for confirmation, avoid FOMO
#BERA #TopGainers #Binance
#CryptoMarket #Altcoins #WriteToEarn
#CryptoAnalysis #DYOR

149
Here’s a clean, professional rewrite optimized for Binance Square engagement 👇
🚀 $LTC / USDT — LONG SETUP
🔥 Market Outlook: Litecoin (LTC)
Bullish momentum is building as price holds above key support levels.
🔑 Trade Plan
📌 Direction: LONG
📍 Entry Zone:
👉 83.8 – 84.6
🎯 Profit Targets:
✅ TP1: 86.8 – 87.5
✅ TP2: 88.8 – 89.5
🛑 Stop Loss:
❌ 80.8 – 81.2
📊 Risk Management Rules:
✔ Risk only 1–2% per trade
✔ Secure partial profits at TP1
✔ Move SL to breakeven after TP1
✔ Bullish structure remains valid as long as 1H candles close above 83.4
📈 Momentum favors the upside — trade with discipline and proper risk control.
#LTC #USDT #LongTrade #CryptoSignals 🚀📊
Here’s a clean, professional rewrite optimized for Binance Square engagement 👇
🚀 $LTC / USDT — LONG SETUP
🔥 Market Outlook: Litecoin (LTC)
Bullish momentum is building as price holds above key support levels.
🔑 Trade Plan
📌 Direction: LONG
📍 Entry Zone:
👉 83.8 – 84.6
🎯 Profit Targets:
✅ TP1: 86.8 – 87.5
✅ TP2: 88.8 – 89.5
🛑 Stop Loss:
❌ 80.8 – 81.2
📊 Risk Management Rules:
✔ Risk only 1–2% per trade
✔ Secure partial profits at TP1
✔ Move SL to breakeven after TP1
✔ Bullish structure remains valid as long as 1H candles close above 83.4
📈 Momentum favors the upside — trade with discipline and proper risk control.
#LTC #USDT #LongTrade #CryptoSignals 🚀📊
🚀 $LTC / USDT — LONG SETUP
🔥 Market Outlook: Litecoin (LTC)
Bullish momentum is building as price holds above key support levels.
🔑 Trade Plan
📌 Direction: LONG
📍 Entry Zone:
👉 83.8 – 84.6
🎯 Profit Targets:
✅ TP1: 86.8 – 87.5
✅ TP2: 88.8 – 89.5
🛑 Stop Loss:
❌ 80.8 – 81.2
📊 Risk Management Rules:
✔ Risk only 1–2% per trade
✔ Secure partial profits at TP1
✔ Move SL to breakeven after TP1
✔ Bullish structure remains valid as long as 1H candles close above 83.4
📈 Momentum favors the upside — trade with discipline and proper risk control.
#LTC #USDT #LongTrade #CryptoSignals 🚀📊
72
wat if buy today and die tomorrow then who will wait for 2030??
wat if buy today and die tomorrow then who will wait for 2030??

Money Exchanger
·
--
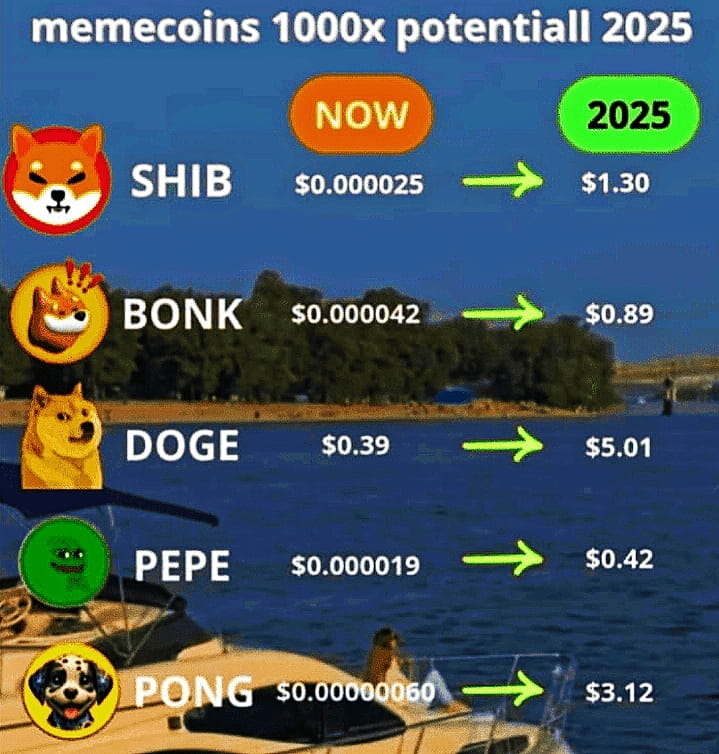
BullishTOP 3 MEME COINS ❤️🔥❤️🔥❤️🔥 CHANGE YOUR LIFE 2030 ???
TOP 1• $BONK
TOP 2• $SHIB
TOP 3• $DOGE
BUY AND HOLD FEW YEARS YOU RETURN 10× TO 100×
TOP 1• $BONK
TOP 2• $SHIB
TOP 3• $DOGE
BUY AND HOLD FEW YEARS YOU RETURN 10× TO 100×
8
🤣🤣🤣 8$ seriously...?
🤣🤣🤣 8$ seriously...?

_dogegod_
·
--
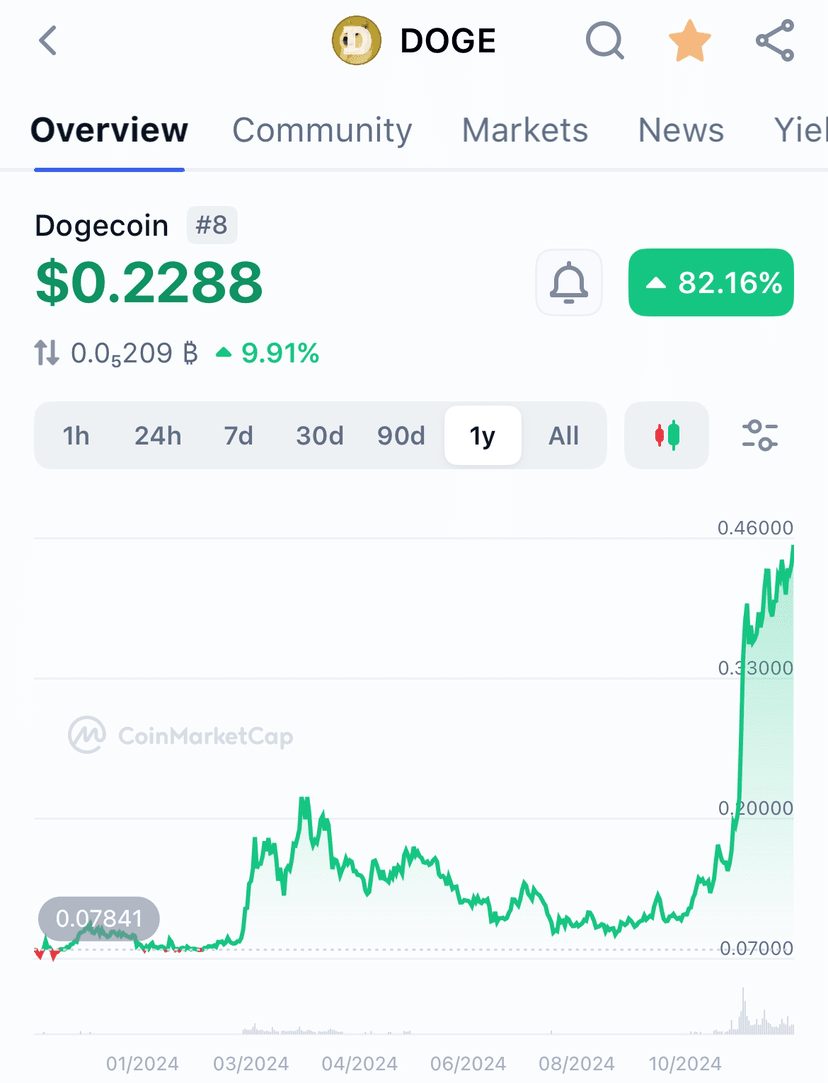
#Dogecoin eyes $8.80.
History rhymes.
History rhymes.
6
🚨 $22.2 Billion BTC & ETH Options Expire! Get Ready for Volatility.
One of the biggest quarter-end expiries in crypto history is here. This could trigger major price movements as market makers adjust their positions.
Key Levels to Watch:
✅$BTC Max Pain: $110K
✅$ETH Max Pain: $3,800
Why You Should Still Be Bullish:
✅ "Uptober" History: October has been Bitcoin's most bullish month.
✅ Fed Rate Cuts: Easing monetary policy boosts high-growth assets.
✅ Pro-Crypto Regulation: New policies in the US and EU increase institutional confidence.
✅ Supply Squeeze: Bitcoin on exchanges is at a low, while demand is rising.
Don't let the short-term noise shake you out. The fundamentals point to strong Q4 momentum.
Question for you: Do you think BTC will hit $120K+ in October? Let me know! 👇
#BTC #ETH #cryptouniverseofficial #Bitcoin #BinanceHODLerXPL
$BTC
{spot}(BTCUSDT)
{spot}(ETHUSDT)
🚨 $22.2 Billion BTC & ETH Options Expire! Get Ready for Volatility.
One of the biggest quarter-end expiries in crypto history is here. This could trigger major price movements as market makers adjust their positions.
Key Levels to Watch:
✅$BTC Max Pain: $110K
✅$ETH Max Pain: $3,800
Why You Should Still Be Bullish:
✅ "Uptober" History: October has been Bitcoin's most bullish month.
✅ Fed Rate Cuts: Easing monetary policy boosts high-growth assets.
✅ Pro-Crypto Regulation: New policies in the US and EU increase institutional confidence.
✅ Supply Squeeze: Bitcoin on exchanges is at a low, while demand is rising.
Don't let the short-term noise shake you out. The fundamentals point to strong Q4 momentum.
Question for you: Do you think BTC will hit $120K+ in October? Let me know! 👇
#BTC #ETH #cryptouniverseofficial #Bitcoin #BinanceHODLerXPL
$BTC
One of the biggest quarter-end expiries in crypto history is here. This could trigger major price movements as market makers adjust their positions.
Key Levels to Watch:
✅$BTC Max Pain: $110K
✅$ETH Max Pain: $3,800
Why You Should Still Be Bullish:
✅ "Uptober" History: October has been Bitcoin's most bullish month.
✅ Fed Rate Cuts: Easing monetary policy boosts high-growth assets.
✅ Pro-Crypto Regulation: New policies in the US and EU increase institutional confidence.
✅ Supply Squeeze: Bitcoin on exchanges is at a low, while demand is rising.
Don't let the short-term noise shake you out. The fundamentals point to strong Q4 momentum.
Question for you: Do you think BTC will hit $120K+ in October? Let me know! 👇
#BTC #ETH #cryptouniverseofficial #Bitcoin #BinanceHODLerXPL
$BTC

333
$SOMI performing like disaster now
$SOMI performing like disaster now

Sakhawat3333
·
--
Bullish@Somnia Official , #Somnia and $SOMI Here’s the latest on Somnia (SOMI) price, focused on ~17-hour recent timeframe, plus insights and context:
🔍 Current Price Snapshot
As of now, SOMI is trading around $0.95–$1.00 USD on major aggregators.
For example, CoinGecko shows ~$0.9511 USD.
CoinMarketCap lists ~$0.96715 USD.
⏱ Last ~17 Hours: Movement & Volatility
Over the past 1 hour, there’s been a decline of about 2.9% according to CoinGecko.
Over the past 24 hours, trend is mild change: up slightly in some exchanges, down slightly in others. Overall, SOMI seems to have dropped from highs near $1.05-$1.10+ to current ~$0.95-$1.00.
On MEXC, the 24-hour range has been between $0.884 (low) and $1.0734 (high).
⚠️ Influencing Factors & Observations
Token unlocks: There were reported unlocks in September which seem to have contributed to downward price pressure.
Volume: Decent trading volume (hundreds of millions USD on aggregators) is helping liquidity, but volatile spikes indicate strong swings.
Market sentiment appears cautious; SOMI is underperforming compared to broader crypto / L1 chains over the past week.
If you like, I can pull up a detailed 15- or 30-minute interval chart for the last 17-hours so you can see precisely how price moved (highs, lows, volume, etc.). Do you want that?
🔍 Current Price Snapshot
As of now, SOMI is trading around $0.95–$1.00 USD on major aggregators.
For example, CoinGecko shows ~$0.9511 USD.
CoinMarketCap lists ~$0.96715 USD.
⏱ Last ~17 Hours: Movement & Volatility
Over the past 1 hour, there’s been a decline of about 2.9% according to CoinGecko.
Over the past 24 hours, trend is mild change: up slightly in some exchanges, down slightly in others. Overall, SOMI seems to have dropped from highs near $1.05-$1.10+ to current ~$0.95-$1.00.
On MEXC, the 24-hour range has been between $0.884 (low) and $1.0734 (high).
⚠️ Influencing Factors & Observations
Token unlocks: There were reported unlocks in September which seem to have contributed to downward price pressure.
Volume: Decent trading volume (hundreds of millions USD on aggregators) is helping liquidity, but volatile spikes indicate strong swings.
Market sentiment appears cautious; SOMI is underperforming compared to broader crypto / L1 chains over the past week.
If you like, I can pull up a detailed 15- or 30-minute interval chart for the last 17-hours so you can see precisely how price moved (highs, lows, volume, etc.). Do you want that?
39
·
--
Bearish
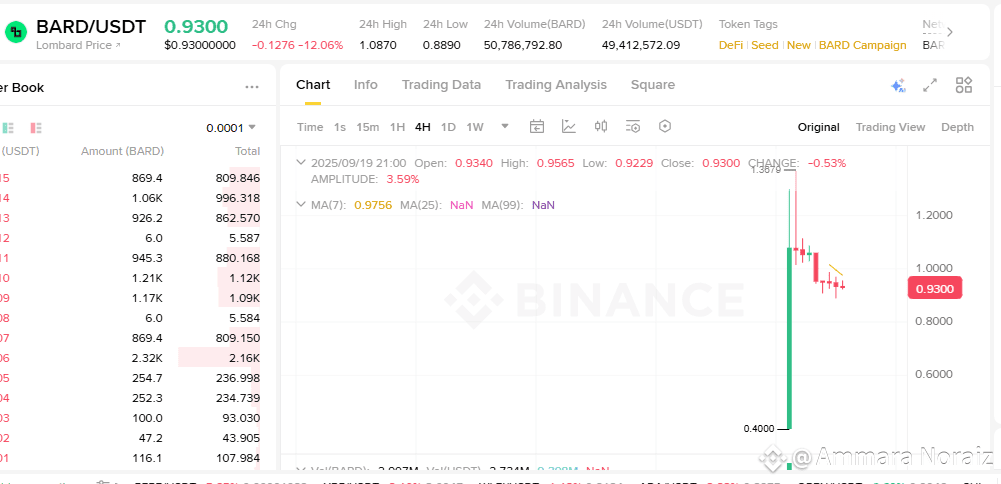
📊 $BARD /USDT – Trade Signals
🔵 Spot Trading Signal
🕯️Buy Zone: 0.90 – 0.93
Targets:
🔹TP1: 0.97
🔹TP2: 1.02
🔹TP3: 1.10
🔹Stop Loss: 0.87
Strategy:
Accumulate slowly in the buy zone.
Partial exits at resistance levels.
If 0.90 fails, wait for re-entry near 0.85.
🟠 Futures Trading Signal (Cautious)
🕯️Long Setup
🔹Entry: 0.91 – 0.93
🔹TP1: 0.97 | TP2: 1.02 | TP3: 1.10
🔹SL: 0.87
🔹Leverage: Max 3–5x (high volatility risk ⚠️)
🕯️ Futures Trading Setup (Short) (if 0.90 breaks)
🔹 Entry: 0.89 – 0.90 (breakdown confirmation)
🔹 TP1: 0.85 | TP2: 0.82
🔹 Stop Loss: 0.94
🔹 Leverage: Max 5–7x ⚠️
🕯️ Candle Pattern Insight
🔹 Doji/Indecision candles forming at support → buyers trying to defend 0.90.
🔹 Trend still weak → needs breakout above 1.00 for bullish confirmation.
⚠️ Risk Rule: Never risk more than 2–3% capital per trade.
#BNBBreaks1000 #USBitcoinReserveDiscussion #BinanceHODLerBARD #BNBChainEcosystemRally #BARDToken $BARD $USDT
{future}(BARDUSDT)
📊 $BARD /USDT – Trade Signals
🔵 Spot Trading Signal
🕯️Buy Zone: 0.90 – 0.93
Targets:
🔹TP1: 0.97
🔹TP2: 1.02
🔹TP3: 1.10
🔹Stop Loss: 0.87
Strategy:
Accumulate slowly in the buy zone.
Partial exits at resistance levels.
If 0.90 fails, wait for re-entry near 0.85.
🟠 Futures Trading Signal (Cautious)
🕯️Long Setup
🔹Entry: 0.91 – 0.93
🔹TP1: 0.97 | TP2: 1.02 | TP3: 1.10
🔹SL: 0.87
🔹Leverage: Max 3–5x (high volatility risk ⚠️)
🕯️ Futures Trading Setup (Short) (if 0.90 breaks)
🔹 Entry: 0.89 – 0.90 (breakdown confirmation)
🔹 TP1: 0.85 | TP2: 0.82
🔹 Stop Loss: 0.94
🔹 Leverage: Max 5–7x ⚠️
🕯️ Candle Pattern Insight
🔹 Doji/Indecision candles forming at support → buyers trying to defend 0.90.
🔹 Trend still weak → needs breakout above 1.00 for bullish confirmation.
⚠️ Risk Rule: Never risk more than 2–3% capital per trade.
#BNBBreaks1000 #USBitcoinReserveDiscussion #BinanceHODLerBARD #BNBChainEcosystemRally #BARDToken $BARD $USDT
🔵 Spot Trading Signal
🕯️Buy Zone: 0.90 – 0.93
Targets:
🔹TP1: 0.97
🔹TP2: 1.02
🔹TP3: 1.10
🔹Stop Loss: 0.87
Strategy:
Accumulate slowly in the buy zone.
Partial exits at resistance levels.
If 0.90 fails, wait for re-entry near 0.85.
🟠 Futures Trading Signal (Cautious)
🕯️Long Setup
🔹Entry: 0.91 – 0.93
🔹TP1: 0.97 | TP2: 1.02 | TP3: 1.10
🔹SL: 0.87
🔹Leverage: Max 3–5x (high volatility risk ⚠️)
🕯️ Futures Trading Setup (Short) (if 0.90 breaks)
🔹 Entry: 0.89 – 0.90 (breakdown confirmation)
🔹 TP1: 0.85 | TP2: 0.82
🔹 Stop Loss: 0.94
🔹 Leverage: Max 5–7x ⚠️
🕯️ Candle Pattern Insight
🔹 Doji/Indecision candles forming at support → buyers trying to defend 0.90.
🔹 Trend still weak → needs breakout above 1.00 for bullish confirmation.
⚠️ Risk Rule: Never risk more than 2–3% capital per trade.
#BNBBreaks1000 #USBitcoinReserveDiscussion #BinanceHODLerBARD #BNBChainEcosystemRally #BARDToken $BARD $USDT
107
Log in to explore more content
Join global crypto users on Binance Square
⚡️ Get latest and useful information about crypto.
💬 Trusted by the world’s largest crypto exchange.
👍 Discover real insights from verified creators.
Email / Phone number
Trending Topics
BinanceReopensWithdrawalsForMoreAssets
1.1M views
5,767 Discussing
Recovery Update #9: Withdrawals for More Assets to Reopen (2026-11-06)
Binance Announcement
·166 Likes
·679.6k views
$2TWipedOutHedgeFundsFaceLiquidation
319 views
21 Discussing
AnthropicIPOValuationDoubts
13,130 views
375 Discussing