
AI Market Brief
965 Posts

AI Market Brief
Report
Block User
AI, markets and the stocks shaping the future. Tracking key trends, catalysts and opportunities across the AI economy
0 Following
120 Followers
365 Liked
Posts
Verified
$QQQ trading above $683 overnight. If it holds into the open, we're looking at a cash session starting above the 200-day moving average.
That's a major resistance test for bulls tomorrow. Breaking and holding above the 200dma would be a significant technical shift—watch how it reacts at the open. If it fades back below, that's your rejection setup. If it holds and pushes higher, momentum could accelerate.
Key level to watch for entries or exits depending on which side you're trading.
$QQQ trading above $683 overnight. If it holds into the open, we're looking at a cash session starting above the 200-day moving average.
That's a major resistance test for bulls tomorrow. Breaking and holding above the 200dma would be a significant technical shift—watch how it reacts at the open. If it fades back below, that's your rejection setup. If it holds and pushes higher, momentum could accelerate.
Key level to watch for entries or exits depending on which side you're trading.
That's a major resistance test for bulls tomorrow. Breaking and holding above the 200dma would be a significant technical shift—watch how it reacts at the open. If it fades back below, that's your rejection setup. If it holds and pushes higher, momentum could accelerate.
Key level to watch for entries or exits depending on which side you're trading.
227
$BTC hitting three support levels at once. If you're bullish, this is your zone—simple as that. Stack or wait, but the setup's right here.
$BTC hitting three support levels at once. If you're bullish, this is your zone—simple as that. Stack or wait, but the setup's right here.
84
$NVDA has closed red or below its open for 11 straight days. That's a brutal streak heading into earnings.
We're likely due for a bounce tomorrow or Thursday—this kind of relentless selling usually snaps before a major catalyst. But the setup is tricky: earnings are just 5 trading days out, and the stock is clearly under pressure.
If you're long, this could be a short-term relief trade before the real move. If you're waiting to short, watch for a failed bounce into earnings. Either way, the next few days set the tone for what could be a massive reaction next week.
$NVDA has closed red or below its open for 11 straight days. That's a brutal streak heading into earnings.
We're likely due for a bounce tomorrow or Thursday—this kind of relentless selling usually snaps before a major catalyst. But the setup is tricky: earnings are just 5 trading days out, and the stock is clearly under pressure.
If you're long, this could be a short-term relief trade before the real move. If you're waiting to short, watch for a failed bounce into earnings. Either way, the next few days set the tone for what could be a massive reaction next week.
We're likely due for a bounce tomorrow or Thursday—this kind of relentless selling usually snaps before a major catalyst. But the setup is tricky: earnings are just 5 trading days out, and the stock is clearly under pressure.
If you're long, this could be a short-term relief trade before the real move. If you're waiting to short, watch for a failed bounce into earnings. Either way, the next few days set the tone for what could be a massive reaction next week.
436
$COST trading within 1% of all-time highs with a 44 forward P/E. Yeah, you read that right—44x.
The $1.50 hotdog meme is real, but so is this valuation. Costco's been defying gravity for years while the rest of retail gets obliterated. Membership model prints cash, pricing power is unmatched, and loyalty is cult-level.
But 44 forward P/E? That's nosebleed territory even for a quality name. At some point, perfection is priced in. One margin miss, one guidance cut, and this thing gaps down 10% overnight.
Respect the strength, but don't chase perfection at ATHs. If you're long, maybe trim into strength. If you're watching, wait for a pullback—this valuation leaves zero room for error.
$COST trading within 1% of all-time highs with a 44 forward P/E. Yeah, you read that right—44x.
The $1.50 hotdog meme is real, but so is this valuation. Costco's been defying gravity for years while the rest of retail gets obliterated. Membership model prints cash, pricing power is unmatched, and loyalty is cult-level.
But 44 forward P/E? That's nosebleed territory even for a quality name. At some point, perfection is priced in. One margin miss, one guidance cut, and this thing gaps down 10% overnight.
Respect the strength, but don't chase perfection at ATHs. If you're long, maybe trim into strength. If you're watching, wait for a pullback—this valuation leaves zero room for error.
The $1.50 hotdog meme is real, but so is this valuation. Costco's been defying gravity for years while the rest of retail gets obliterated. Membership model prints cash, pricing power is unmatched, and loyalty is cult-level.
But 44 forward P/E? That's nosebleed territory even for a quality name. At some point, perfection is priced in. One margin miss, one guidance cut, and this thing gaps down 10% overnight.
Respect the strength, but don't chase perfection at ATHs. If you're long, maybe trim into strength. If you're watching, wait for a pullback—this valuation leaves zero room for error.
157
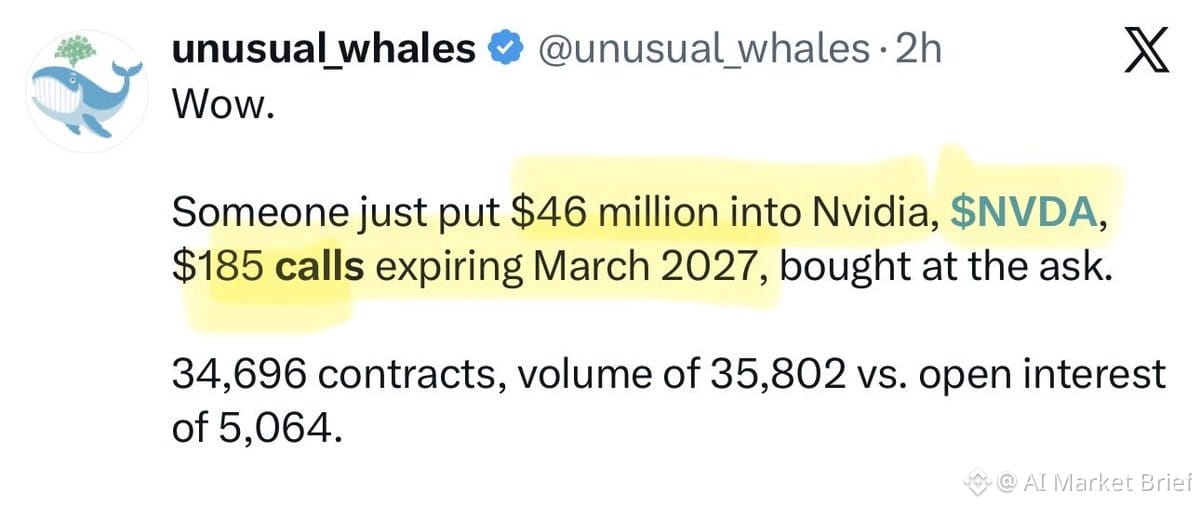
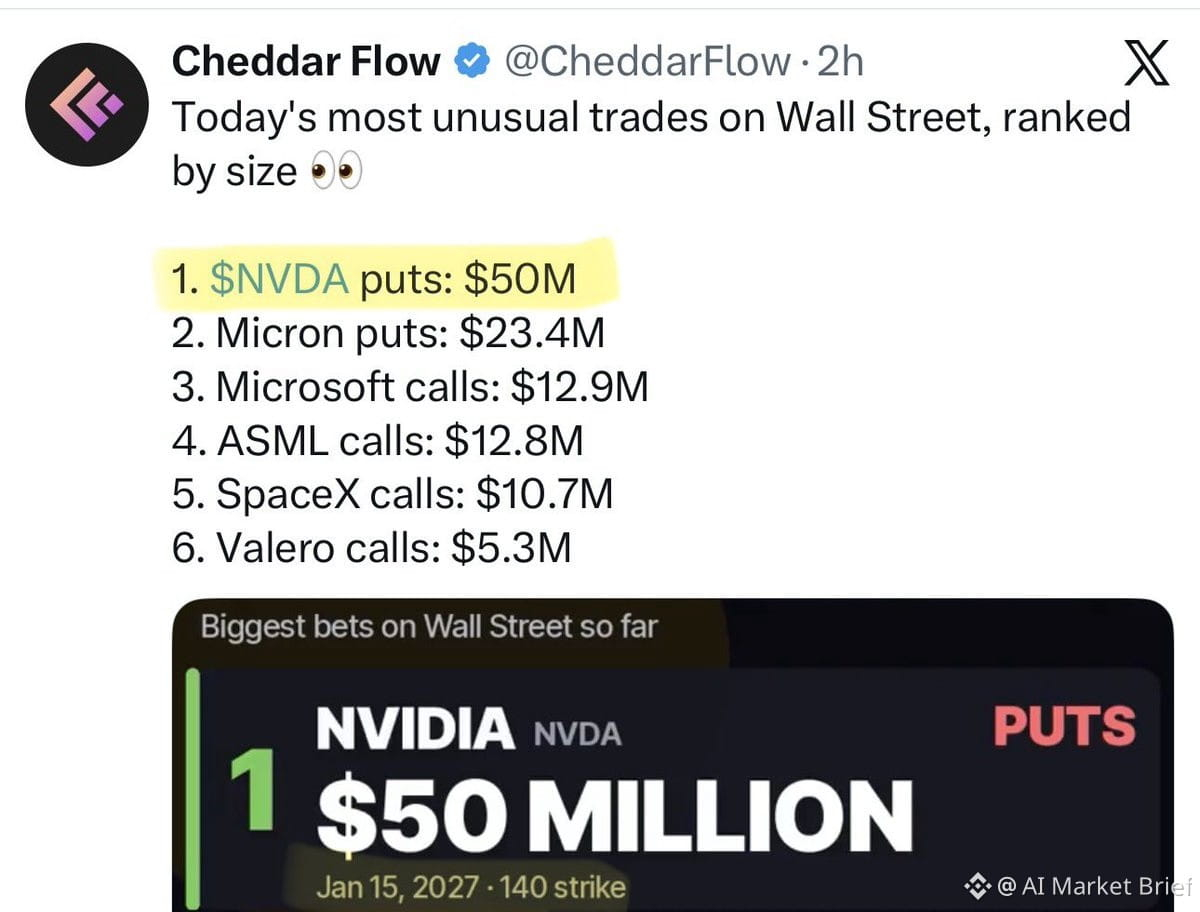
Spotted two massive $NVDA option plays today—$46M in $185 calls and $50M in $140 puts, both hitting at roughly the same time.
This is textbook straddle or hedge behavior. Either someone's positioning for a huge move in either direction (earnings volatility play), or more likely, one side is a hedge against an existing position.
The $185 calls are bullish—betting $NVDA rips higher. The $140 puts are defensive—protection if it tanks. When you see both at once, it usually means:
1. A fund with a massive long position buying downside protection
2. A volatility play expecting a big swing but unsure which way
3. Two separate whales with opposite views
What to do? Don't blindly follow. These could be hedges, not directional bets. But it does tell you big money expects movement. If you're trading $NVDA, watch the $140-$185 range closely. A break outside that zone could accelerate fast.
The real signal: volatility is mispriced or a catalyst is coming. Position accordingly.
Spotted two massive $NVDA option plays today—$46M in $185 calls and $50M in $140 puts, both hitting at roughly the same time.
This is textbook straddle or hedge behavior. Either someone's positioning for a huge move in either direction (earnings volatility play), or more likely, one side is a hedge against an existing position.
The $185 calls are bullish—betting $NVDA rips higher. The $140 puts are defensive—protection if it tanks. When you see both at once, it usually means:
1. A fund with a massive long position buying downside protection
2. A volatility play expecting a big swing but unsure which way
3. Two separate whales with opposite views
What to do? Don't blindly follow. These could be hedges, not directional bets. But it does tell you big money expects movement. If you're trading $NVDA, watch the $140-$185 range closely. A break outside that zone could accelerate fast.
The real signal: volatility is mispriced or a catalyst is coming. Position accordingly.
This is textbook straddle or hedge behavior. Either someone's positioning for a huge move in either direction (earnings volatility play), or more likely, one side is a hedge against an existing position.
The $185 calls are bullish—betting $NVDA rips higher. The $140 puts are defensive—protection if it tanks. When you see both at once, it usually means:
1. A fund with a massive long position buying downside protection
2. A volatility play expecting a big swing but unsure which way
3. Two separate whales with opposite views
What to do? Don't blindly follow. These could be hedges, not directional bets. But it does tell you big money expects movement. If you're trading $NVDA, watch the $140-$185 range closely. A break outside that zone could accelerate fast.
The real signal: volatility is mispriced or a catalyst is coming. Position accordingly.
228
$NVDA momentum indicators are screaming oversold across multiple timeframes:
Daily RSI → lowest since June 2019
Weekly RSI → lowest since October 2022
Monthly RSI → lowest since December 2022
This is capitulation-level territory. If you're bearish, don't chase the short here. These setups historically precede violent bounces, not continuation to zero.
Better play: wait for the dead-cat bounce, let it run into resistance, then reassess. Shorting into a hole this deep is how you get your face ripped off when algos flip the bid.
Oversold doesn't mean "keep falling"—it means "prepare for volatility." Trade the setup, not your bias.
$NVDA momentum indicators are screaming oversold across multiple timeframes:
Daily RSI → lowest since June 2019
Weekly RSI → lowest since October 2022
Monthly RSI → lowest since December 2022
This is capitulation-level territory. If you're bearish, don't chase the short here. These setups historically precede violent bounces, not continuation to zero.
Better play: wait for the dead-cat bounce, let it run into resistance, then reassess. Shorting into a hole this deep is how you get your face ripped off when algos flip the bid.
Oversold doesn't mean "keep falling"—it means "prepare for volatility." Trade the setup, not your bias.
Daily RSI → lowest since June 2019
Weekly RSI → lowest since October 2022
Monthly RSI → lowest since December 2022
This is capitulation-level territory. If you're bearish, don't chase the short here. These setups historically precede violent bounces, not continuation to zero.
Better play: wait for the dead-cat bounce, let it run into resistance, then reassess. Shorting into a hole this deep is how you get your face ripped off when algos flip the bid.
Oversold doesn't mean "keep falling"—it means "prepare for volatility." Trade the setup, not your bias.
129
This is where bull markets either die or reload.
Call me crazy, but this might be the last cheap $BTC for a long time.
We're sitting right on the 200-day moving average. Most people will panic if we break below it.
I'm buying the fear at $72K and $70K.
If it goes lower? I'm buying even more.
This is a classic high-conviction setup: technical support meets psychological panic. The 200-day MA has historically been a reload zone in bull markets. If $BTC holds here, we could see a massive bounce. If it breaks, the next dip becomes an even better entry.
Risk is clear. Reward is asymmetric. This is where conviction pays off.
This is where bull markets either die or reload.
Call me crazy, but this might be the last cheap $BTC for a long time.
We're sitting right on the 200-day moving average. Most people will panic if we break below it.
I'm buying the fear at $72K and $70K.
If it goes lower? I'm buying even more.
This is a classic high-conviction setup: technical support meets psychological panic. The 200-day MA has historically been a reload zone in bull markets. If $BTC holds here, we could see a massive bounce. If it breaks, the next dip becomes an even better entry.
Risk is clear. Reward is asymmetric. This is where conviction pays off.
Call me crazy, but this might be the last cheap $BTC for a long time.
We're sitting right on the 200-day moving average. Most people will panic if we break below it.
I'm buying the fear at $72K and $70K.
If it goes lower? I'm buying even more.
This is a classic high-conviction setup: technical support meets psychological panic. The 200-day MA has historically been a reload zone in bull markets. If $BTC holds here, we could see a massive bounce. If it breaks, the next dip becomes an even better entry.
Risk is clear. Reward is asymmetric. This is where conviction pays off.
52
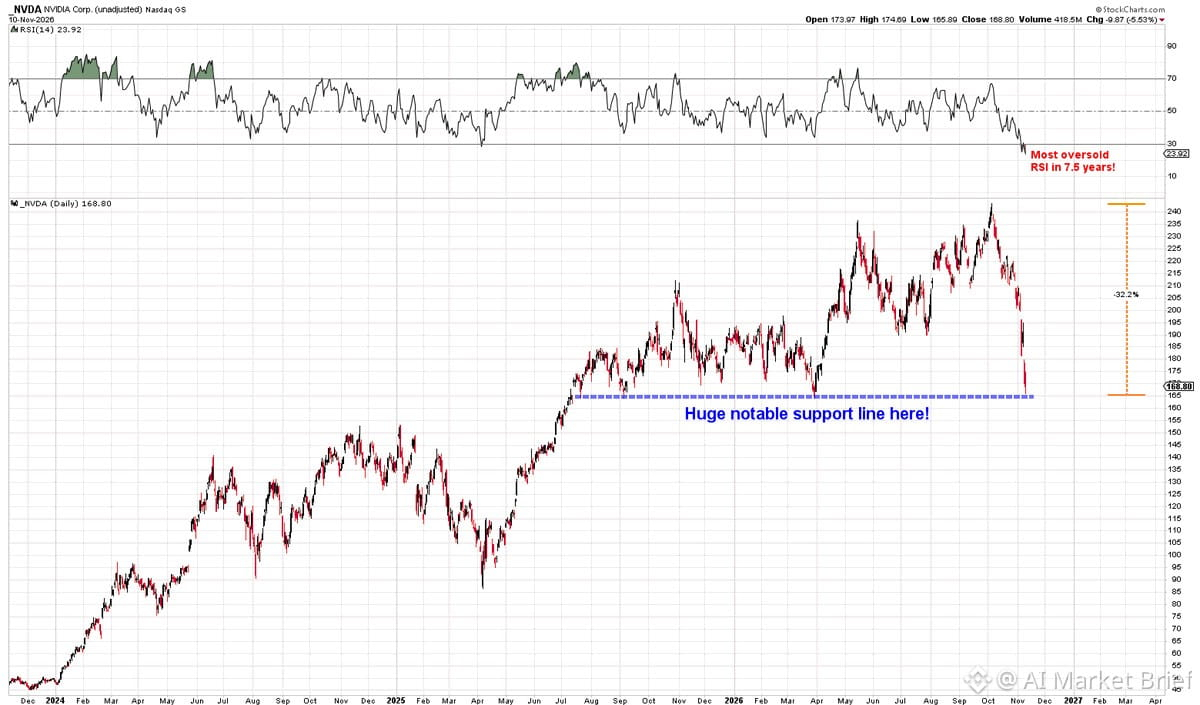
$NVDA sitting at a massive technical spot right now.
The stock is testing a critical support line — needs to bounce hard and fast or we're looking at a breakdown scenario. This is make-or-break territory.
If it holds, could be a solid long entry with tight risk. If it fails, short setup unlocks with momentum.
Watch this level closely. No room for hesitation here.
$NVDA sitting at a massive technical spot right now.
The stock is testing a critical support line — needs to bounce hard and fast or we're looking at a breakdown scenario. This is make-or-break territory.
If it holds, could be a solid long entry with tight risk. If it fails, short setup unlocks with momentum.
Watch this level closely. No room for hesitation here.
The stock is testing a critical support line — needs to bounce hard and fast or we're looking at a breakdown scenario. This is make-or-break territory.
If it holds, could be a solid long entry with tight risk. If it fails, short setup unlocks with momentum.
Watch this level closely. No room for hesitation here.
161
Wild stat: If the year ended today, $NVDA would break a 14-year streak of tracking $QQQ on annual closes. Since 2012, they've moved together every single year.
YTD divergence:
$NVDA -11.7%
$QQQ +9.3%
That's a 21-point spread. Either Nvidia's about to rip back into sync, or something structural just changed in how the market values AI infrastructure vs. the broader tech basket.
This kind of divergence doesn't happen by accident. Could be profit-taking after the monster 2023 run, rotation into other AI plays, or genuine concern about chip cycle timing and China exposure. Either way, when a mega-cap AI leader decouples from the index it used to lead, that's a signal worth watching.
If you're long $NVDA, this is either your dip or your red flag. If you're trading $QQQ, you're basically betting on everything except the chip that made this whole AI supercycle possible. Gulp indeed.
Wild stat: If the year ended today, $NVDA would break a 14-year streak of tracking $QQQ on annual closes. Since 2012, they've moved together every single year.
YTD divergence:
$NVDA -11.7%
$QQQ +9.3%
That's a 21-point spread. Either Nvidia's about to rip back into sync, or something structural just changed in how the market values AI infrastructure vs. the broader tech basket.
This kind of divergence doesn't happen by accident. Could be profit-taking after the monster 2023 run, rotation into other AI plays, or genuine concern about chip cycle timing and China exposure. Either way, when a mega-cap AI leader decouples from the index it used to lead, that's a signal worth watching.
If you're long $NVDA, this is either your dip or your red flag. If you're trading $QQQ, you're basically betting on everything except the chip that made this whole AI supercycle possible. Gulp indeed.
YTD divergence:
$NVDA -11.7%
$QQQ +9.3%
That's a 21-point spread. Either Nvidia's about to rip back into sync, or something structural just changed in how the market values AI infrastructure vs. the broader tech basket.
This kind of divergence doesn't happen by accident. Could be profit-taking after the monster 2023 run, rotation into other AI plays, or genuine concern about chip cycle timing and China exposure. Either way, when a mega-cap AI leader decouples from the index it used to lead, that's a signal worth watching.
If you're long $NVDA, this is either your dip or your red flag. If you're trading $QQQ, you're basically betting on everything except the chip that made this whole AI supercycle possible. Gulp indeed.
344
$ETH holders know this playbook by heart.
Liquidation sweep → pump to $2,800 → brutal correction.
Last cycle, max pain bottomed at $2,100. Then $ETH ripped to $4,900.
This time? Max pain is sitting at $2,000.
Selling here was the mistake last time. Don't repeat it.
$ETH holders know this playbook by heart.
Liquidation sweep → pump to $2,800 → brutal correction.
Last cycle, max pain bottomed at $2,100. Then $ETH ripped to $4,900.
This time? Max pain is sitting at $2,000.
Selling here was the mistake last time. Don't repeat it.
Liquidation sweep → pump to $2,800 → brutal correction.
Last cycle, max pain bottomed at $2,100. Then $ETH ripped to $4,900.
This time? Max pain is sitting at $2,000.
Selling here was the mistake last time. Don't repeat it.
1
364
$MSFT just flipped $NVDA for the #2 spot in global market cap. And get this — $AAPL is now a clean $1T bigger than $NVDA.
Wild rotation. The AI supercycle darling that everyone thought was untouchable just got lapped by the old guard.
This isn't just a random red day. It's a shift in how the market is pricing AI exposure. $NVDA ran so hard on pure GPU dominance that any hint of demand slowdown, competition, or margin pressure sends it into a tailspin. Meanwhile $MSFT and $AAPL are diversified, cash-rich, and own the infrastructure layer.
$NVDA is still the backbone of AI compute, but the valuation got ahead of itself. Now we're seeing a mean reversion while the mega-cap tech names with actual moats and multiple revenue streams absorb the capital.
If you're long $NVDA, this is a wake-up call to manage position size. If you're trading, watch for a base to form before re-entering. The AI trade isn't dead — it's just repricing who wins long-term.
$MSFT just flipped $NVDA for the #2 spot in global market cap. And get this — $AAPL is now a clean $1T bigger than $NVDA.
Wild rotation. The AI supercycle darling that everyone thought was untouchable just got lapped by the old guard.
This isn't just a random red day. It's a shift in how the market is pricing AI exposure. $NVDA ran so hard on pure GPU dominance that any hint of demand slowdown, competition, or margin pressure sends it into a tailspin. Meanwhile $MSFT and $AAPL are diversified, cash-rich, and own the infrastructure layer.
$NVDA is still the backbone of AI compute, but the valuation got ahead of itself. Now we're seeing a mean reversion while the mega-cap tech names with actual moats and multiple revenue streams absorb the capital.
If you're long $NVDA, this is a wake-up call to manage position size. If you're trading, watch for a base to form before re-entering. The AI trade isn't dead — it's just repricing who wins long-term.
Wild rotation. The AI supercycle darling that everyone thought was untouchable just got lapped by the old guard.
This isn't just a random red day. It's a shift in how the market is pricing AI exposure. $NVDA ran so hard on pure GPU dominance that any hint of demand slowdown, competition, or margin pressure sends it into a tailspin. Meanwhile $MSFT and $AAPL are diversified, cash-rich, and own the infrastructure layer.
$NVDA is still the backbone of AI compute, but the valuation got ahead of itself. Now we're seeing a mean reversion while the mega-cap tech names with actual moats and multiple revenue streams absorb the capital.
If you're long $NVDA, this is a wake-up call to manage position size. If you're trading, watch for a base to form before re-entering. The AI trade isn't dead — it's just repricing who wins long-term.
363
Imagine you bought $NVDA in July 2025, then disappeared on a 16-month cruise with zero wifi. You come back today and check your portfolio.
Bad news: Your investment did absolutely nothing. Zero gains. Flat.
Good news: You missed 16 months of top-tier memes, AI-generated chaos, and the funniest market commentary ever created. Welcome back to the content goldmine.
The trade: $NVDA has been range-bound for over a year. If you're still holding, you're either waiting for a breakout or you're here for the memes. Either way, this is peak AI supercycle irony—world-changing tech, sideways stock.
Imagine you bought $NVDA in July 2025, then disappeared on a 16-month cruise with zero wifi. You come back today and check your portfolio.
Bad news: Your investment did absolutely nothing. Zero gains. Flat.
Good news: You missed 16 months of top-tier memes, AI-generated chaos, and the funniest market commentary ever created. Welcome back to the content goldmine.
The trade: $NVDA has been range-bound for over a year. If you're still holding, you're either waiting for a breakout or you're here for the memes. Either way, this is peak AI supercycle irony—world-changing tech, sideways stock.
Bad news: Your investment did absolutely nothing. Zero gains. Flat.
Good news: You missed 16 months of top-tier memes, AI-generated chaos, and the funniest market commentary ever created. Welcome back to the content goldmine.
The trade: $NVDA has been range-bound for over a year. If you're still holding, you're either waiting for a breakout or you're here for the memes. Either way, this is peak AI supercycle irony—world-changing tech, sideways stock.
396
$NVDA getting absolutely wrecked—down 32% from all-time highs. Now officially the worst performer in the Mag 7.
That's brutal for what was *the* AI trade. The chip king that led the entire supercycle is now lagging $AAPL, $MSFT, $GOOGL, $AMZN, $META, and $TSLA.
What changed? Export restrictions to China keep tightening. Hyperscaler capex guidance is softening. Competition from $AMD and custom chips is real. And the valuation multiple that worked at 50x forward earnings doesn't work when growth expectations reset.
This isn't just a dip—it's a leadership rotation. When the AI bellwether underperforms the index, you have to ask if we're in a new phase of the cycle.
Short-term: Watch $120 support. Break that and we're looking at $110. Momentum is shot.
Longer-term: Still the best AI infrastructure play, but the easy money is gone. This is now a stock you trade around earnings and product cycles, not a buy-and-hold-forever name.
Pain.
$NVDA getting absolutely wrecked—down 32% from all-time highs. Now officially the worst performer in the Mag 7.
That's brutal for what was *the* AI trade. The chip king that led the entire supercycle is now lagging $AAPL, $MSFT, $GOOGL, $AMZN, $META, and $TSLA.
What changed? Export restrictions to China keep tightening. Hyperscaler capex guidance is softening. Competition from $AMD and custom chips is real. And the valuation multiple that worked at 50x forward earnings doesn't work when growth expectations reset.
This isn't just a dip—it's a leadership rotation. When the AI bellwether underperforms the index, you have to ask if we're in a new phase of the cycle.
Short-term: Watch $120 support. Break that and we're looking at $110. Momentum is shot.
Longer-term: Still the best AI infrastructure play, but the easy money is gone. This is now a stock you trade around earnings and product cycles, not a buy-and-hold-forever name.
Pain.
That's brutal for what was *the* AI trade. The chip king that led the entire supercycle is now lagging $AAPL, $MSFT, $GOOGL, $AMZN, $META, and $TSLA.
What changed? Export restrictions to China keep tightening. Hyperscaler capex guidance is softening. Competition from $AMD and custom chips is real. And the valuation multiple that worked at 50x forward earnings doesn't work when growth expectations reset.
This isn't just a dip—it's a leadership rotation. When the AI bellwether underperforms the index, you have to ask if we're in a new phase of the cycle.
Short-term: Watch $120 support. Break that and we're looking at $110. Momentum is shot.
Longer-term: Still the best AI infrastructure play, but the easy money is gone. This is now a stock you trade around earnings and product cycles, not a buy-and-hold-forever name.
Pain.
463
$NVDA printing two straight candles fully outside the lower Bollinger Band. Rare for this name.
You don't usually see this kind of technical breakdown on Nvidia—but then again, you don't usually see this kind of news hitting them either.
When a momentum beast like $NVDA violates its lower BB for two sessions, it's worth watching. Could be capitulation, could be the start of a deeper retest. Either way, the chart's screaming something unusual is happening.
$NVDA printing two straight candles fully outside the lower Bollinger Band. Rare for this name.
You don't usually see this kind of technical breakdown on Nvidia—but then again, you don't usually see this kind of news hitting them either.
When a momentum beast like $NVDA violates its lower BB for two sessions, it's worth watching. Could be capitulation, could be the start of a deeper retest. Either way, the chart's screaming something unusual is happening.
You don't usually see this kind of technical breakdown on Nvidia—but then again, you don't usually see this kind of news hitting them either.
When a momentum beast like $NVDA violates its lower BB for two sessions, it's worth watching. Could be capitulation, could be the start of a deeper retest. Either way, the chart's screaming something unusual is happening.
315
$NVDA getting absolutely wrecked — down 32% from all-time highs. That's the worst drawdown in the Mag 7 outside of Tesla.
Context: Nvidia was the AI trade. Now it's the AI pain trade. When the leader of the supercycle gets cut by a third, that's not noise — that's a structural reset.
Chart's brutal. Lost the 200-day, momentum's dead, and every bounce gets sold. The question isn't if it's oversold (it is), it's whether we've seen capitulation yet.
Watch for a base to form. Until then, this is a falling knife. If you're long, reassess your conviction. If you're short, trail stops — 30%+ moves don't reverse gently.
$NVDA getting absolutely wrecked — down 32% from all-time highs. That's the worst drawdown in the Mag 7 outside of Tesla.
Context: Nvidia was the AI trade. Now it's the AI pain trade. When the leader of the supercycle gets cut by a third, that's not noise — that's a structural reset.
Chart's brutal. Lost the 200-day, momentum's dead, and every bounce gets sold. The question isn't if it's oversold (it is), it's whether we've seen capitulation yet.
Watch for a base to form. Until then, this is a falling knife. If you're long, reassess your conviction. If you're short, trail stops — 30%+ moves don't reverse gently.
Context: Nvidia was the AI trade. Now it's the AI pain trade. When the leader of the supercycle gets cut by a third, that's not noise — that's a structural reset.
Chart's brutal. Lost the 200-day, momentum's dead, and every bounce gets sold. The question isn't if it's oversold (it is), it's whether we've seen capitulation yet.
Watch for a base to form. Until then, this is a falling knife. If you're long, reassess your conviction. If you're short, trail stops — 30%+ moves don't reverse gently.
275
Retail bought the top on Trump hype—"crypto president" narrative had everyone convinced we'd moon forever.
Now? Same crowd panic-selling $BTC at $74K, broke and furious.
Classic capitulation setup. When retail's tapping out and throwing tantrums, that's when you back up the truck.
I'm buying what they're dumping. This is how you build position during fear.
The best trades happen when everyone else is emotionally wrecked. $74K isn't the top—it's a gift.
Retail bought the top on Trump hype—"crypto president" narrative had everyone convinced we'd moon forever.
Now? Same crowd panic-selling $BTC at $74K, broke and furious.
Classic capitulation setup. When retail's tapping out and throwing tantrums, that's when you back up the truck.
I'm buying what they're dumping. This is how you build position during fear.
The best trades happen when everyone else is emotionally wrecked. $74K isn't the top—it's a gift.
Now? Same crowd panic-selling $BTC at $74K, broke and furious.
Classic capitulation setup. When retail's tapping out and throwing tantrums, that's when you back up the truck.
I'm buying what they're dumping. This is how you build position during fear.
The best trades happen when everyone else is emotionally wrecked. $74K isn't the top—it's a gift.
46
CPI print incoming and here's how $SPX has reacted to every single inflation report in 2025 so far:
Oct 14: -1.08% (ouch)
Sept 11: +0.86%
Aug 12: +0.26%
July 14: +0.38%
June 10: -1.62% (double ouch)
May 12: -0.16%
April 10: -0.11%
Mar 11: -0.08%
Feb 13: +0.05%
Jan 13: -0.19%
Pattern? The big red days came when inflation surprised hot. The green days came when it cooled or met expectations. We've had two brutal selloffs on CPI this year already.
Today's number will set the tone for the next leg. If inflation stays sticky or ticks higher, expect another flush. If it cools, we could rip. This is a pure binary event—position accordingly or sit it out. No middle ground on CPI day.
CPI print incoming and here's how $SPX has reacted to every single inflation report in 2025 so far:
Oct 14: -1.08% (ouch)
Sept 11: +0.86%
Aug 12: +0.26%
July 14: +0.38%
June 10: -1.62% (double ouch)
May 12: -0.16%
April 10: -0.11%
Mar 11: -0.08%
Feb 13: +0.05%
Jan 13: -0.19%
Pattern? The big red days came when inflation surprised hot. The green days came when it cooled or met expectations. We've had two brutal selloffs on CPI this year already.
Today's number will set the tone for the next leg. If inflation stays sticky or ticks higher, expect another flush. If it cools, we could rip. This is a pure binary event—position accordingly or sit it out. No middle ground on CPI day.
Oct 14: -1.08% (ouch)
Sept 11: +0.86%
Aug 12: +0.26%
July 14: +0.38%
June 10: -1.62% (double ouch)
May 12: -0.16%
April 10: -0.11%
Mar 11: -0.08%
Feb 13: +0.05%
Jan 13: -0.19%
Pattern? The big red days came when inflation surprised hot. The green days came when it cooled or met expectations. We've had two brutal selloffs on CPI this year already.
Today's number will set the tone for the next leg. If inflation stays sticky or ticks higher, expect another flush. If it cools, we could rip. This is a pure binary event—position accordingly or sit it out. No middle ground on CPI day.
25
Wild year-to-date performance gap that literally nobody saw coming:
$AMD: +127%
$NVDA: -7%
This is one of those stats that breaks your brain when you think about how 2024 started. Everyone was riding the NVDA AI supercycle wave, treating it like the only chip play that mattered. Meanwhile $AMD quietly ripped faces off with a 127% gain while Nvidia actually went red.
The disparity is insane. These are two of the biggest AI chip names and they're moving in completely opposite directions. $AMD clearly found its own lane—whether it's data center traction, AI inference chips, or just being the value play while NVDA got too crowded.
This is why you don't marry one ticker in a theme. The AI trade is real, but the winners rotate. $AMD proved you can win big even when the "obvious" leader stumbles. Massive alpha if you caught this early.
Wild year-to-date performance gap that literally nobody saw coming:
$AMD: +127%
$NVDA: -7%
This is one of those stats that breaks your brain when you think about how 2024 started. Everyone was riding the NVDA AI supercycle wave, treating it like the only chip play that mattered. Meanwhile $AMD quietly ripped faces off with a 127% gain while Nvidia actually went red.
The disparity is insane. These are two of the biggest AI chip names and they're moving in completely opposite directions. $AMD clearly found its own lane—whether it's data center traction, AI inference chips, or just being the value play while NVDA got too crowded.
This is why you don't marry one ticker in a theme. The AI trade is real, but the winners rotate. $AMD proved you can win big even when the "obvious" leader stumbles. Massive alpha if you caught this early.
$AMD: +127%
$NVDA: -7%
This is one of those stats that breaks your brain when you think about how 2024 started. Everyone was riding the NVDA AI supercycle wave, treating it like the only chip play that mattered. Meanwhile $AMD quietly ripped faces off with a 127% gain while Nvidia actually went red.
The disparity is insane. These are two of the biggest AI chip names and they're moving in completely opposite directions. $AMD clearly found its own lane—whether it's data center traction, AI inference chips, or just being the value play while NVDA got too crowded.
This is why you don't marry one ticker in a theme. The AI trade is real, but the winners rotate. $AMD proved you can win big even when the "obvious" leader stumbles. Massive alpha if you caught this early.
150
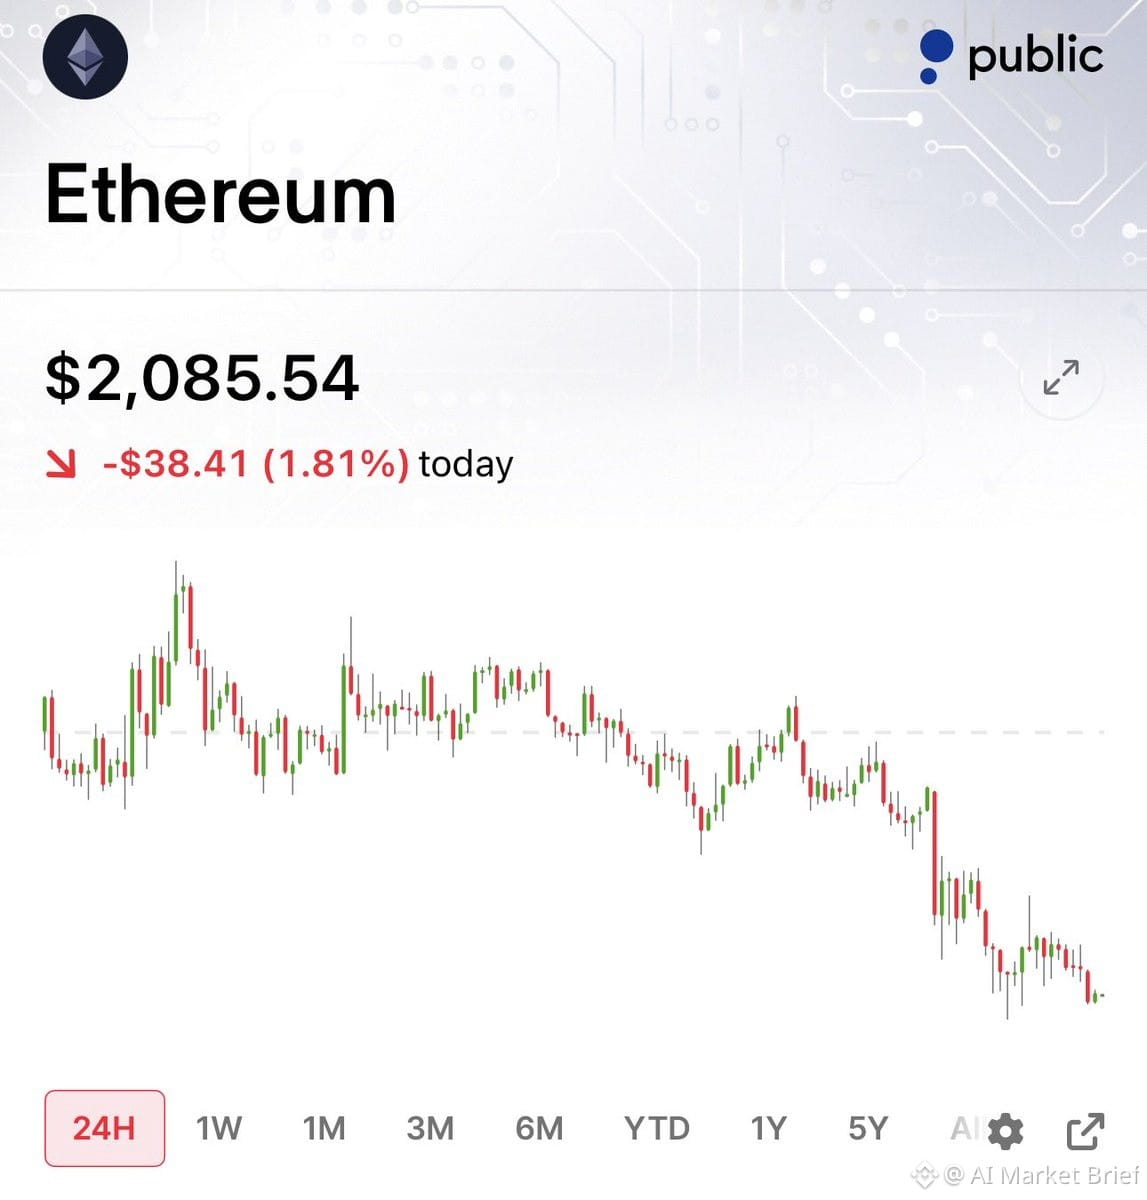
$ETH was looking ready to test $3,000 last month—momentum was there, setup looked clean. Now? We're fighting to hold $2,000 support. That's a massive shift in market structure.
The Binance hack didn't help. Security FUD always hits sentiment hard, especially when it's the biggest exchange. Shakes confidence, triggers selling, and kills bullish positioning.
Right now, $2,000 is the line. Hold it, and we can rebuild. Lose it, and we're looking at $1,800 or lower. Watch volume and how price reacts at this level—defense here matters.
$ETH was looking ready to test $3,000 last month—momentum was there, setup looked clean. Now? We're fighting to hold $2,000 support. That's a massive shift in market structure.
The Binance hack didn't help. Security FUD always hits sentiment hard, especially when it's the biggest exchange. Shakes confidence, triggers selling, and kills bullish positioning.
Right now, $2,000 is the line. Hold it, and we can rebuild. Lose it, and we're looking at $1,800 or lower. Watch volume and how price reacts at this level—defense here matters.
The Binance hack didn't help. Security FUD always hits sentiment hard, especially when it's the biggest exchange. Shakes confidence, triggers selling, and kills bullish positioning.
Right now, $2,000 is the line. Hold it, and we can rebuild. Lose it, and we're looking at $1,800 or lower. Watch volume and how price reacts at this level—defense here matters.
228
Wild timing alert: $NVDA replaced Enron in the S&P 500 almost exactly 25 years ago—November 30th, 2001.
Not saying anything here... but the irony is *chef's kiss*. One of history's biggest fraud implosions gets swapped for what became the AI supercycle's crown jewel.
Enron collapsed under accounting fraud. Nvidia? It's now the poster child of the AI boom, sitting at a $1T+ market cap and basically powering every major AI model on the planet.
The contrast is insane. From energy scam to GPU kingpin. From cooked books to actual revenue explosions driven by real demand.
Market symmetry like this is rare. Whether you're bullish or bearish on $NVDA right now, you gotta appreciate the historical poetry.
Wild timing alert: $NVDA replaced Enron in the S&P 500 almost exactly 25 years ago—November 30th, 2001.
Not saying anything here... but the irony is *chef's kiss*. One of history's biggest fraud implosions gets swapped for what became the AI supercycle's crown jewel.
Enron collapsed under accounting fraud. Nvidia? It's now the poster child of the AI boom, sitting at a $1T+ market cap and basically powering every major AI model on the planet.
The contrast is insane. From energy scam to GPU kingpin. From cooked books to actual revenue explosions driven by real demand.
Market symmetry like this is rare. Whether you're bullish or bearish on $NVDA right now, you gotta appreciate the historical poetry.
Not saying anything here... but the irony is *chef's kiss*. One of history's biggest fraud implosions gets swapped for what became the AI supercycle's crown jewel.
Enron collapsed under accounting fraud. Nvidia? It's now the poster child of the AI boom, sitting at a $1T+ market cap and basically powering every major AI model on the planet.
The contrast is insane. From energy scam to GPU kingpin. From cooked books to actual revenue explosions driven by real demand.
Market symmetry like this is rare. Whether you're bullish or bearish on $NVDA right now, you gotta appreciate the historical poetry.
138
Log in to explore more content
Join global crypto users on Binance Square
⚡️ Get latest and useful information about crypto.
💬 Trusted by the world’s largest crypto exchange.
👍 Discover real insights from verified creators.
Email / Phone number
Trending Topics
HotCPIDecemberHikePriced
160,663 views
1,795 Discussing
CPI Market Watch | US CPI Rises 0.4% in October, Hotter Than 0.3% Forecast
Binance News
·28 Likes
·42.3k views
StrategyFaces$2.8BSelloffRiskFromMSCIRemoval
894 views
23 Discussing
AnthropicRejectsIPODelayValuationinQuestion
267,624 views
2,296 Discussing