
abogato23
82 Posts

abogato23
13 Following
57 Followers
23 Liked
Posts
All
Quotes
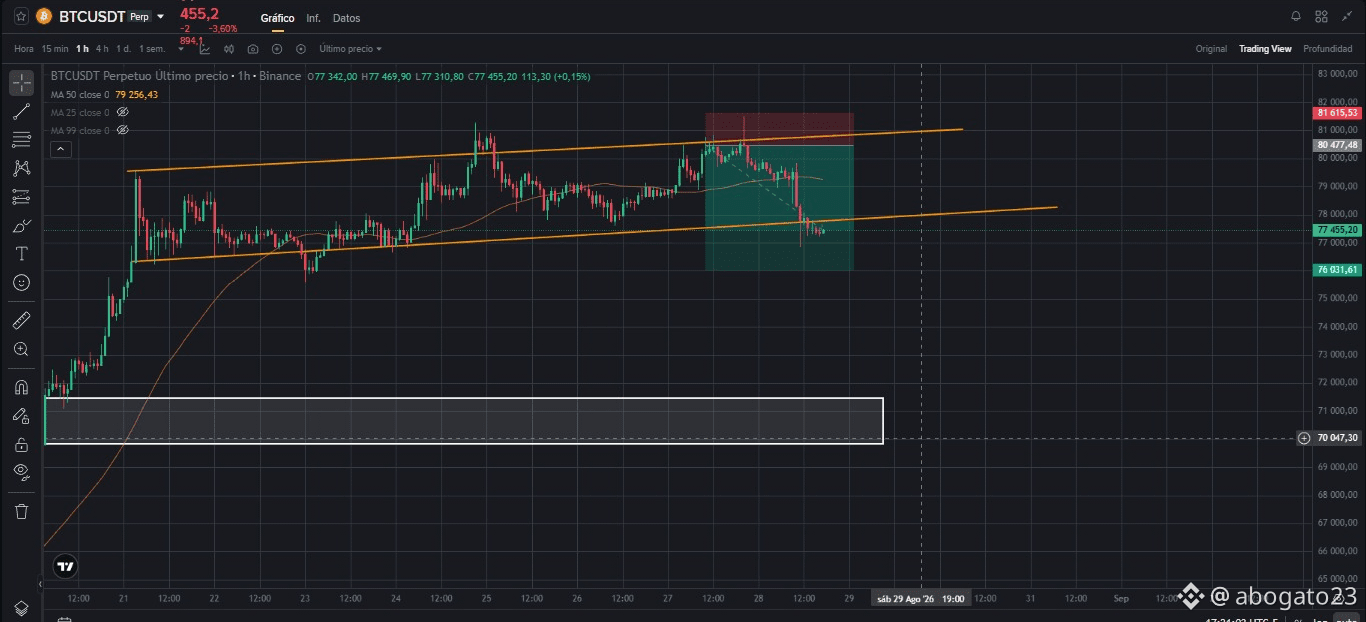
🚨 $BTC — I TOLD YOU. THE CHANNEL FINALLY GAVE IN.
Several days ago I told you that Bitcoin was showing a lot of weakness in the short term.
And finally, the market spoke. 👀
After several days of waiting, $BTC :
📌 Breaks the bullish channel it had been forming.
📌 Starts closing several candles below.
📌 Confirms that the bullish structure is losing strength.
For me, this completely changes the scenario.
🎯 My position: I expect a fairly strong bearish move from this zone.
But now I don’t want to chase the price.
I want to find the best entry point.
👀 An important reference could be precisely the lower part of the old channel—especially if price retests it from below and gives us confirmation.
The breakout has already happened.
Now we just need to wait for the retest and see how price responds.
Will BTC keep falling directly, or will it give us that pullback before continuing lower?
I’m reading you. 👇
#Bitcoin #BTC走势分析 #crypto #trading #BinanceSquare
Several days ago I told you that Bitcoin was showing a lot of weakness in the short term.
And finally, the market spoke. 👀
After several days of waiting, $BTC :
📌 Breaks the bullish channel it had been forming.
📌 Starts closing several candles below.
📌 Confirms that the bullish structure is losing strength.
For me, this completely changes the scenario.
🎯 My position: I expect a fairly strong bearish move from this zone.
But now I don’t want to chase the price.
I want to find the best entry point.
👀 An important reference could be precisely the lower part of the old channel—especially if price retests it from below and gives us confirmation.
The breakout has already happened.
Now we just need to wait for the retest and see how price responds.
Will BTC keep falling directly, or will it give us that pullback before continuing lower?
I’m reading you. 👇
#Bitcoin #BTC走势分析 #crypto #trading #BinanceSquare
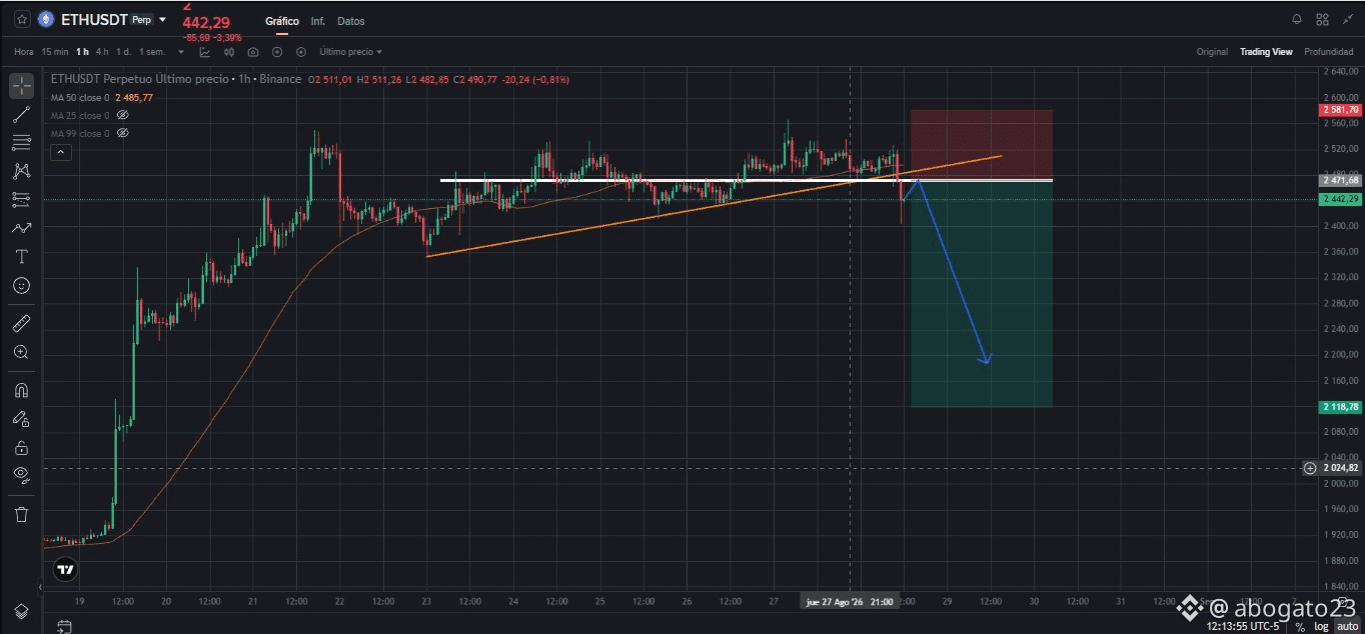
🚨 $ETH COLLAPSES… BUT REALLY IS IT THE MOMENT TO SHORT?
$ETH has experienced a strong downward move in the last few hours. 📉
But be careful…
A strong drop by itself doesn’t mean that ETH has to keep falling.
It could simply be a temporary trap. 👀
That’s why, personally, I wouldn’t enter just because I see the price plunging.
What I’m waiting for is much more important:
📌 For the price to move forward.
📌 3–4 candle closes below the trend line.
📌 Confirmation that real weakness actually exists.
If we get that confirmation, then for me the scenario starts to get interesting:
🎯 ETH could go look for the imbalances it left during the previous rally.
That would be my target for a potential bearish swing.
The take-profit, obviously, each person should define it according to their own risk management, but personally I’d be looking for filling those imbalances.
⚠️ And watch out for something:
This kind of breakout is usually accompanied by a lot of volatility.
That’s why, if I enter, I prefer a wide stop above the previous highs, trying to avoid getting stopped out by a simple wick before the move really develops.
I don’t want to sell the panic.
I want to wait for confirmation.
👀 Has ETH just set a bearish trap, or are we seeing the start of a move toward the rally’s imbalances?
#Ethereum #ETH #crypto #trading #BinanceSquare
$ETH has experienced a strong downward move in the last few hours. 📉
But be careful…
A strong drop by itself doesn’t mean that ETH has to keep falling.
It could simply be a temporary trap. 👀
That’s why, personally, I wouldn’t enter just because I see the price plunging.
What I’m waiting for is much more important:
📌 For the price to move forward.
📌 3–4 candle closes below the trend line.
📌 Confirmation that real weakness actually exists.
If we get that confirmation, then for me the scenario starts to get interesting:
🎯 ETH could go look for the imbalances it left during the previous rally.
That would be my target for a potential bearish swing.
The take-profit, obviously, each person should define it according to their own risk management, but personally I’d be looking for filling those imbalances.
⚠️ And watch out for something:
This kind of breakout is usually accompanied by a lot of volatility.
That’s why, if I enter, I prefer a wide stop above the previous highs, trying to avoid getting stopped out by a simple wick before the move really develops.
I don’t want to sell the panic.
I want to wait for confirmation.
👀 Has ETH just set a bearish trap, or are we seeing the start of a move toward the rally’s imbalances?
#Ethereum #ETH #crypto #trading #BinanceSquare
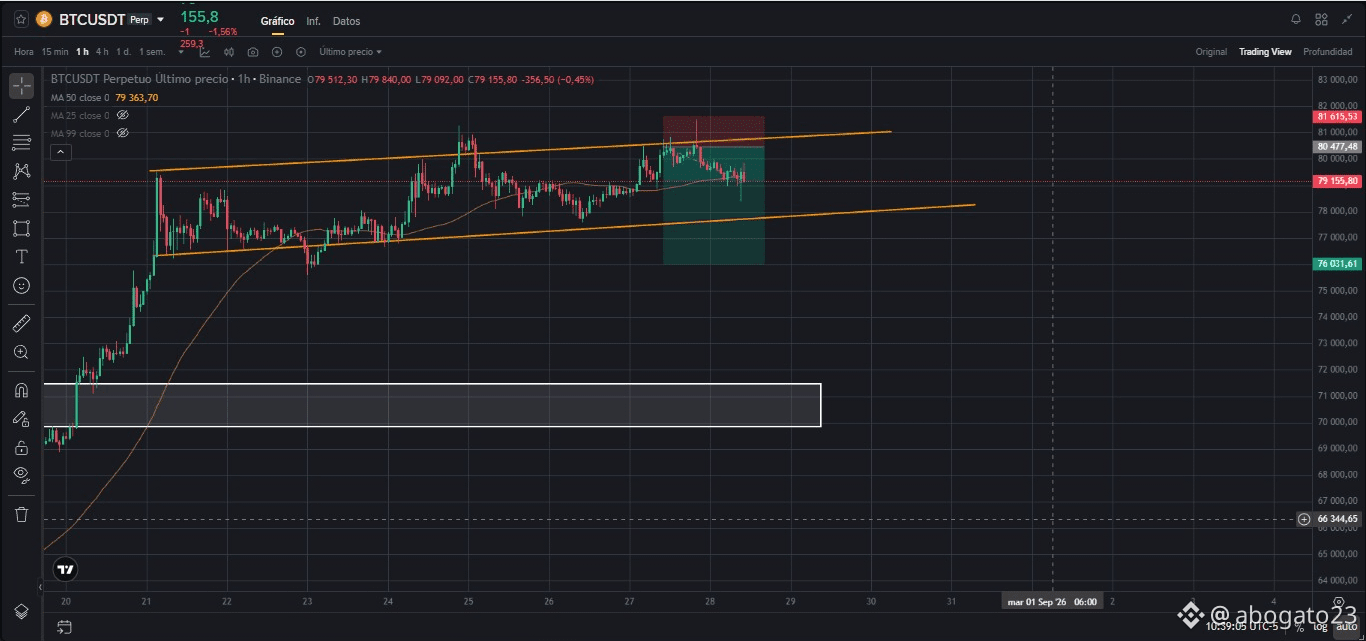
⏳ Does $BTC run out of time?
Bitcoin has been forming an uptrend channel for several days, and now we’re reaching a zone where price will have to decide. 👀
The question is simple:
Will we see another rejection at the top of the channel, or will we finally witness a breakout of the structure?
For my part, I’m starting to pay more attention to weakness.
If $BTC can’t break through with strength and rejects again from the top of the channel, we could be looking at another opportunity to look for the bearish move. 📉
But if it breaks and confirms above, the scenario changes completely.
🎯 I don’t want to guess the move. I want to wait for price to speak.
So right now I have two scenarios on the table:
🟢 Breakout and bullish continuation.
🔴 Rejection of the channel and a bearish move.
👀 Is $BTC running out of time, or do you think we’ll see another rejection in the channel?
I’m reading you.
#bitcoin #BTC走势分析 #crypto #Trading #BinanceSquare
Bitcoin has been forming an uptrend channel for several days, and now we’re reaching a zone where price will have to decide. 👀
The question is simple:
Will we see another rejection at the top of the channel, or will we finally witness a breakout of the structure?
For my part, I’m starting to pay more attention to weakness.
If $BTC can’t break through with strength and rejects again from the top of the channel, we could be looking at another opportunity to look for the bearish move. 📉
But if it breaks and confirms above, the scenario changes completely.
🎯 I don’t want to guess the move. I want to wait for price to speak.
So right now I have two scenarios on the table:
🟢 Breakout and bullish continuation.
🔴 Rejection of the channel and a bearish move.
👀 Is $BTC running out of time, or do you think we’ll see another rejection in the channel?
I’m reading you.
#bitcoin #BTC走势分析 #crypto #Trading #BinanceSquare
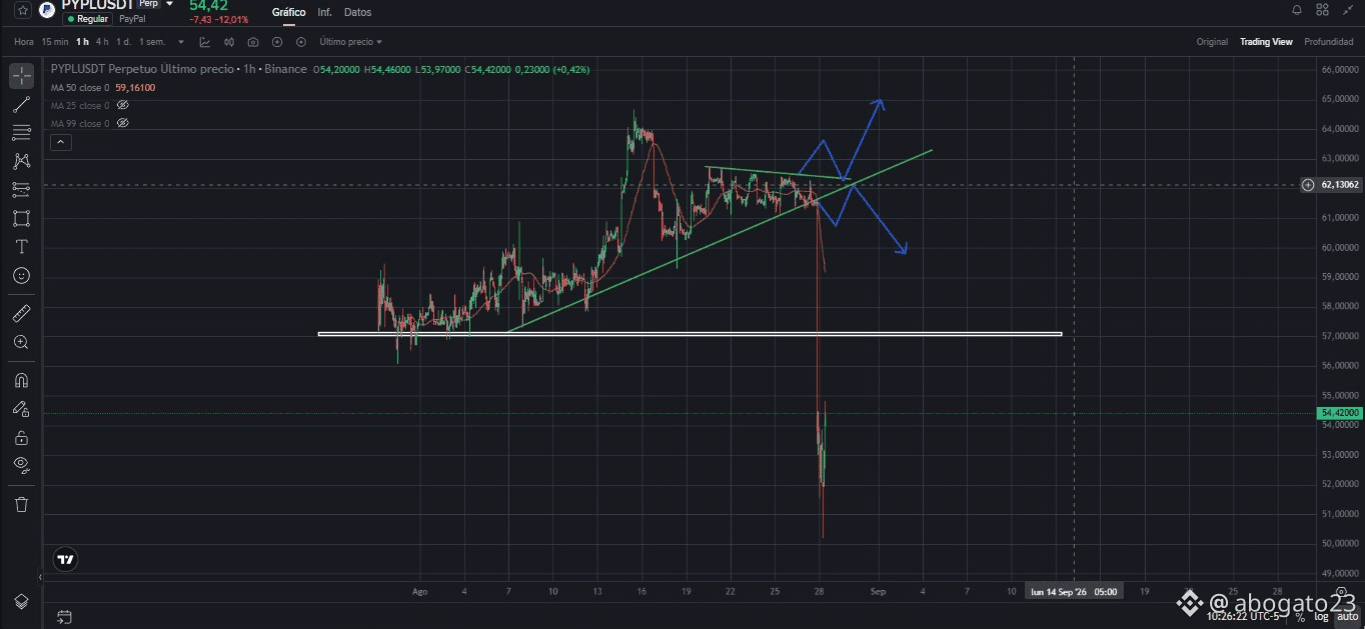
🚨 $PYPL — I TOLD YOU… AND THE MARKET DIDN’T WAIT
A few days ago I shared my PayPal analysis with you.
At that moment, $PYPL was just starting to form a compression pattern, along with a trendline that, in my view, was too liquidity-heavy.
I showed you my position and I was clear:
👉 My scenario leaned more to the downside.
And the market had the final say.
📉 More than a 12% drop in less than 24 hours.
Now the interesting part:
What can we expect from $PYPL after this move? 👀
If you entered from the top when I published the analysis, personally I’m sticking with my swing outlook, aiming eventually for prices close to $40.
If you haven’t entered yet, I’d especially watch the $57 zone as a possible area to look for a continuation of the short, always waiting for confirmation and managing risk.
Even though there’s something we can’t ignore…
🔥 The speed of this drop.
When an asset loses so much ground in such a short time, there’s a chance it won’t even give us the pullback we’re expecting and will simply keep falling.
That’s why I don’t want to guess now.
I have my scenario.
I have my zones.
And now we just have to wait.
Let the market speak. 👀
Will PYPL bounce back toward $57 to continue the short, or will it keep falling directly to new lows?
#PYPL #PayPal #Tradin g #Stock s #BinanceSquareVietnam
A few days ago I shared my PayPal analysis with you.
At that moment, $PYPL was just starting to form a compression pattern, along with a trendline that, in my view, was too liquidity-heavy.
I showed you my position and I was clear:
👉 My scenario leaned more to the downside.
And the market had the final say.
📉 More than a 12% drop in less than 24 hours.
Now the interesting part:
What can we expect from $PYPL after this move? 👀
If you entered from the top when I published the analysis, personally I’m sticking with my swing outlook, aiming eventually for prices close to $40.
If you haven’t entered yet, I’d especially watch the $57 zone as a possible area to look for a continuation of the short, always waiting for confirmation and managing risk.
Even though there’s something we can’t ignore…
🔥 The speed of this drop.
When an asset loses so much ground in such a short time, there’s a chance it won’t even give us the pullback we’re expecting and will simply keep falling.
That’s why I don’t want to guess now.
I have my scenario.
I have my zones.
And now we just have to wait.
Let the market speak. 👀
Will PYPL bounce back toward $57 to continue the short, or will it keep falling directly to new lows?
#PYPL #PayPal #Tradin g #Stock s #BinanceSquareVietnam
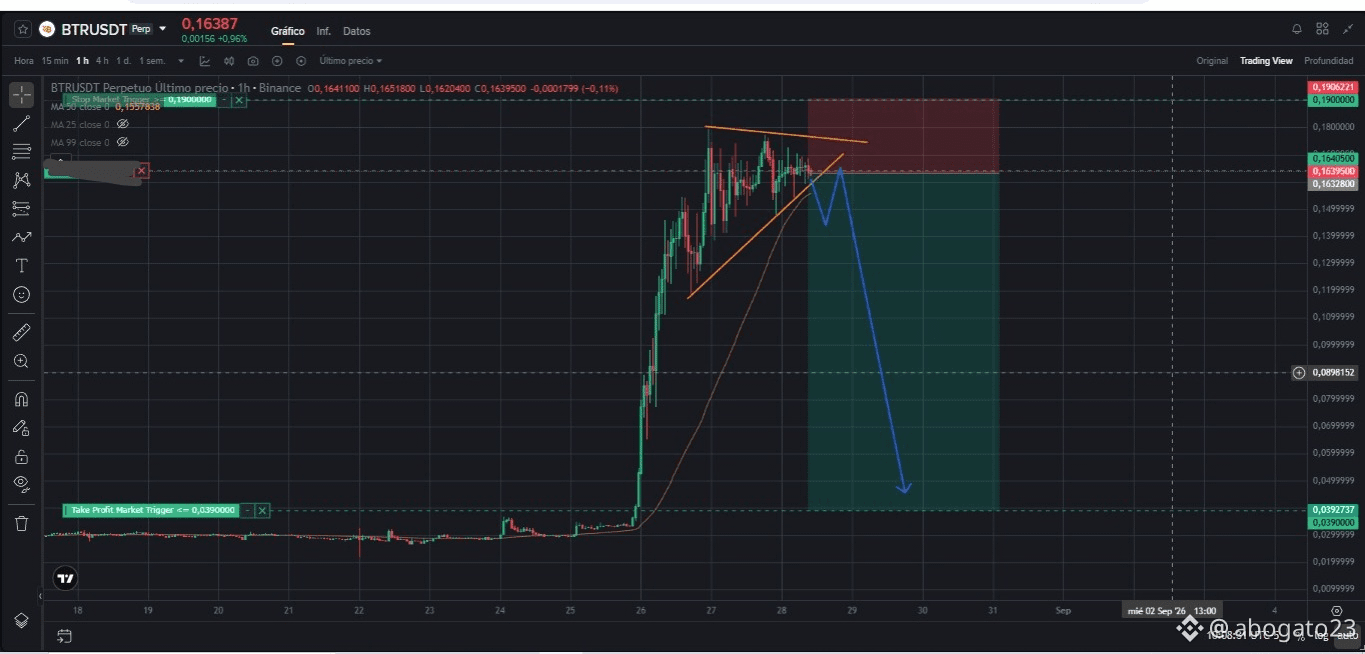
🚨 $BTR — THE PARABLE MAY BE REACHING ITS END
$BTR has only been doing something brutal for just 2 days:
📈 +250% in a practically parabolic move.
But now something shows up that catches my attention even more than the rise itself. 👀
The price finally reached and completely filled the imbalance left behind during its previous drop.
And right after that…
📌 The impulse starts losing strength.
📌 The price enters a compression zone.
📌 A kind of wedge/triangle begins forming.
After such a vertical move, this kind of structure is something I would keep a very close eye on.
Why?
Because when price stops moving after a parabolic rise, while the market compresses, distribution may be forming.
🎯 My scenario: $BTR could be close to finishing its bullish move and setting up a strong drop.
I'm not trying to guess the top.
I'm waiting for confirmation that the structure is really losing strength.
⏳ After +250% in 2 days…
How much longer do you think BTR can hold on before the correction arrives? 👀
#BTR #Crypt or #Altcoins #Trading #BinanceSquare
$BTR has only been doing something brutal for just 2 days:
📈 +250% in a practically parabolic move.
But now something shows up that catches my attention even more than the rise itself. 👀
The price finally reached and completely filled the imbalance left behind during its previous drop.
And right after that…
📌 The impulse starts losing strength.
📌 The price enters a compression zone.
📌 A kind of wedge/triangle begins forming.
After such a vertical move, this kind of structure is something I would keep a very close eye on.
Why?
Because when price stops moving after a parabolic rise, while the market compresses, distribution may be forming.
🎯 My scenario: $BTR could be close to finishing its bullish move and setting up a strong drop.
I'm not trying to guess the top.
I'm waiting for confirmation that the structure is really losing strength.
⏳ After +250% in 2 days…
How much longer do you think BTR can hold on before the correction arrives? 👀
#BTR #Crypt or #Altcoins #Trading #BinanceSquare
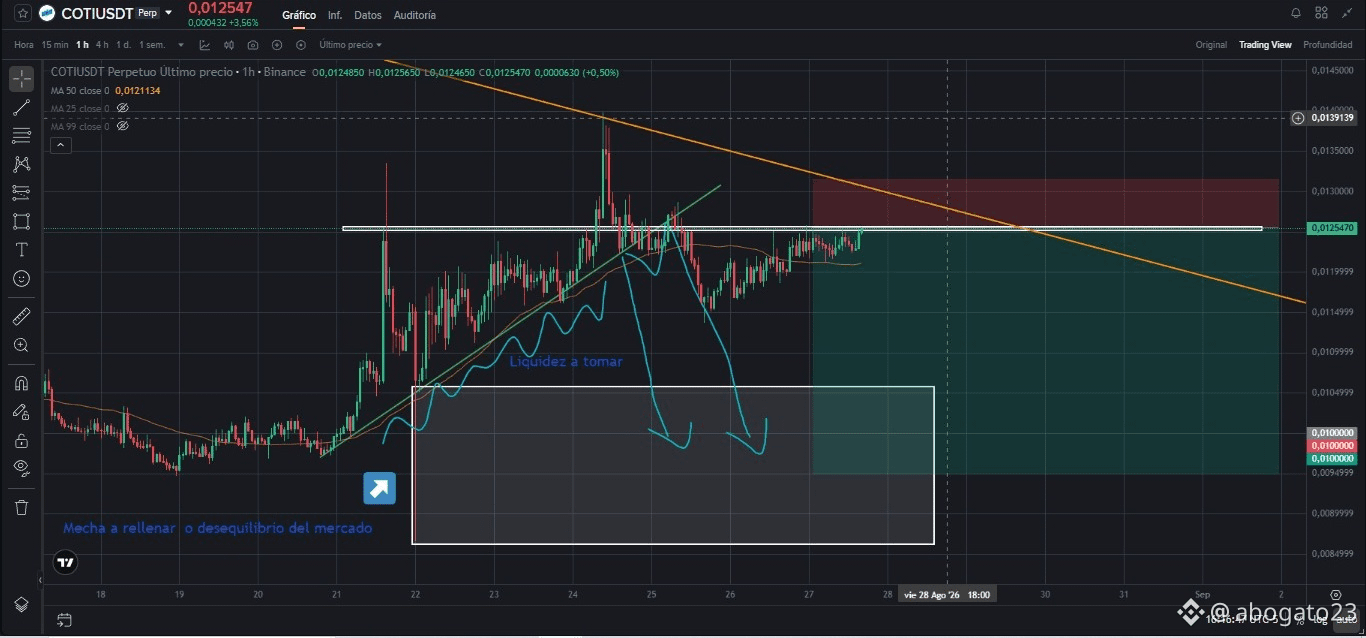
🚨 $COTI I — DAYS AFTER, THE THESIS STILL HOLDS
A few days ago I shared my setup for $COTI .
And today, several days later, the price is still giving us something important: the structure continues to show little bullish strength. 👀
It hasn’t managed to develop the momentum that many would expect.
In fact, for my bearish scenario, the current position is even more interesting than it was a few days ago.
📌 Lower buying strength
📌 Still weak structure
📌 Better risk/reward ratio
📌 The bearish scenario is still valid
🎯 If you were waiting for an entry, for me now a much more interesting zone appears to place it, always with proper risk management.
The idea isn’t to chase the price.
It’s to wait for the market to offer us a better risk/reward relationship.
And $COTI still looks to me like one of those projects that could be preparing another downside move. 📉
👀 Do you think $COTI still has the strength to recover, or are we seeing the last attempts before the drop?
#COTI #Crypt o #Altcoin s #Trading #BinanceSquare
A few days ago I shared my setup for $COTI .
And today, several days later, the price is still giving us something important: the structure continues to show little bullish strength. 👀
It hasn’t managed to develop the momentum that many would expect.
In fact, for my bearish scenario, the current position is even more interesting than it was a few days ago.
📌 Lower buying strength
📌 Still weak structure
📌 Better risk/reward ratio
📌 The bearish scenario is still valid
🎯 If you were waiting for an entry, for me now a much more interesting zone appears to place it, always with proper risk management.
The idea isn’t to chase the price.
It’s to wait for the market to offer us a better risk/reward relationship.
And $COTI still looks to me like one of those projects that could be preparing another downside move. 📉
👀 Do you think $COTI still has the strength to recover, or are we seeing the last attempts before the drop?
#COTI #Crypt o #Altcoin s #Trading #BinanceSquare
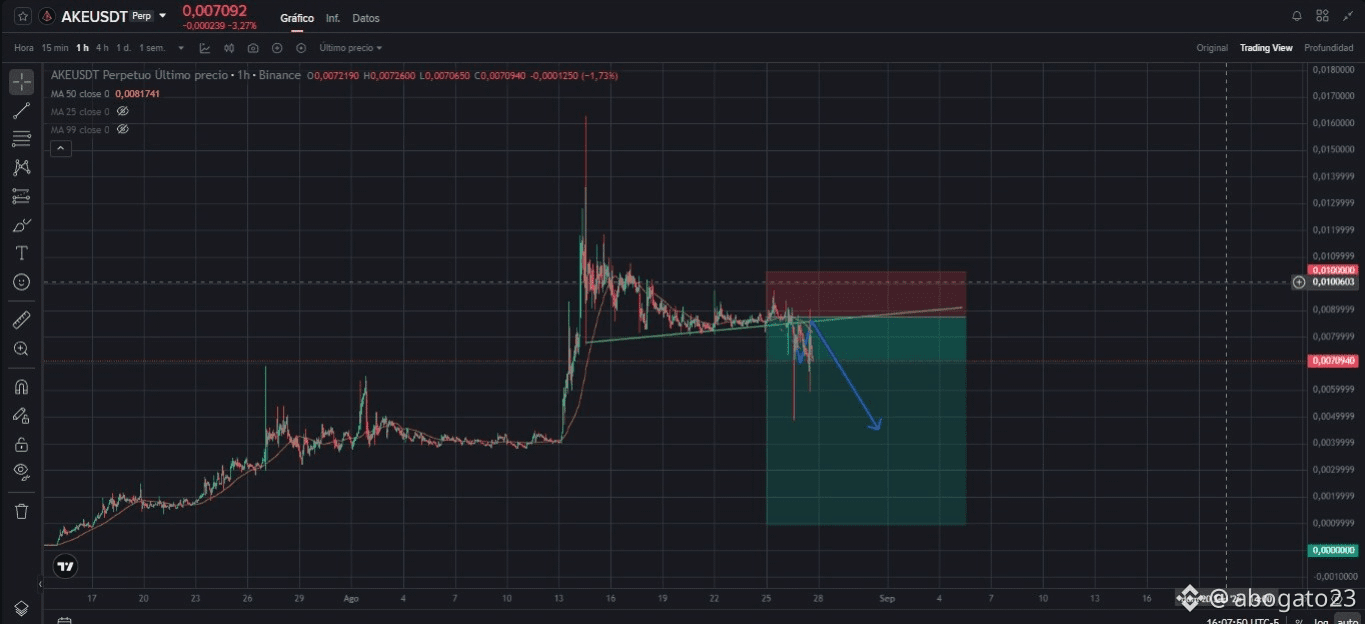
🚨 $AKE — I TOLD YOU. THE MARKET TURNED OUT TO BE RIGHT.
A few days ago this analysis caused quite a stir. 👀
Many didn’t agree with the scenario it laid out for $AKE .
But the market has a very simple way of answering:
with price.
And it hasn’t even been a week.
What happened?
📌 $AKE liquidated longs on H1.
📌 It did it again a second time.
📌 It also ended up liquidating the most positioned shorts.
📌 Finally, it broke the trend line.
📌 It retested the breakout.
📌 And from there, the drop began. 📉
Exactly the sequence we were waiting for.
That’s why I always say:
You don’t need to be right immediately. You need to have a thesis and wait for the market to confirm it.
Now the analysis changes.
🎯 The work is done.
All that’s left is to wait for $AKE to reach our TP.
And if it finally does, it will be another reminder of something the market constantly repeats:
liquidity first, direction afterward.
👀 Did you follow the AKE move from that analysis, or did you think the bearish scenario wouldn’t play out?
#AKE #Crypto #Altcoins #Trading #BinanceSquare
A few days ago this analysis caused quite a stir. 👀
Many didn’t agree with the scenario it laid out for $AKE .
But the market has a very simple way of answering:
with price.
And it hasn’t even been a week.
What happened?
📌 $AKE liquidated longs on H1.
📌 It did it again a second time.
📌 It also ended up liquidating the most positioned shorts.
📌 Finally, it broke the trend line.
📌 It retested the breakout.
📌 And from there, the drop began. 📉
Exactly the sequence we were waiting for.
That’s why I always say:
You don’t need to be right immediately. You need to have a thesis and wait for the market to confirm it.
Now the analysis changes.
🎯 The work is done.
All that’s left is to wait for $AKE to reach our TP.
And if it finally does, it will be another reminder of something the market constantly repeats:
liquidity first, direction afterward.
👀 Did you follow the AKE move from that analysis, or did you think the bearish scenario wouldn’t play out?
#AKE #Crypto #Altcoins #Trading #BinanceSquare
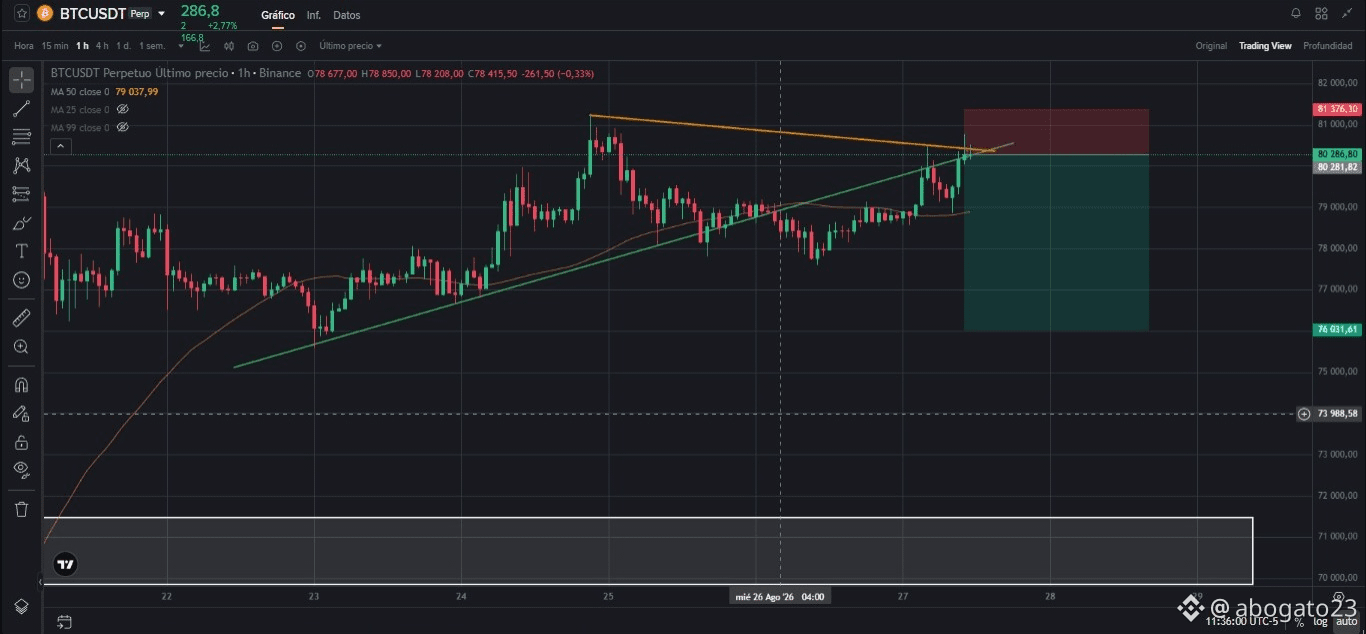
🚨 $BTC TIME RUNS OUT…
Bitcoin is starting to show signs of weakness that I wouldn’t ignore. 👀
On H4, the bullish trend line we had been following (🟢 green line) has already been broken, and more importantly, we have several candle closes below it.
That gives the breakout more validity.
But there’s another detail I’m interested in. 👇
On H1 (🟡 yellow line), the short-term structure is also beginning to show bearish strength.
So we have:
📌 H4 → bullish trend broken
📌 Several closes → breakout with higher confirmation
📌 H1 → increasing bearish pressure
📌 Confluence → favorable scenario to look for a short
🎯 My scenario: $BTC enters an area where it would start looking for short opportunities.
That said: a well-placed stop and risk management.
I don’t want to guess the move. I want to see how the next candles react, and especially their closes.
👀 Now comes the interesting part:
Is Bitcoin preparing for a deeper drop, or does it still have enough strength to recover the structure?
What would you do here: short or wait for confirmation?
#Bitcoin #BTC #Crypt o #Trading #BinanceSquare
Bitcoin is starting to show signs of weakness that I wouldn’t ignore. 👀
On H4, the bullish trend line we had been following (🟢 green line) has already been broken, and more importantly, we have several candle closes below it.
That gives the breakout more validity.
But there’s another detail I’m interested in. 👇
On H1 (🟡 yellow line), the short-term structure is also beginning to show bearish strength.
So we have:
📌 H4 → bullish trend broken
📌 Several closes → breakout with higher confirmation
📌 H1 → increasing bearish pressure
📌 Confluence → favorable scenario to look for a short
🎯 My scenario: $BTC enters an area where it would start looking for short opportunities.
That said: a well-placed stop and risk management.
I don’t want to guess the move. I want to see how the next candles react, and especially their closes.
👀 Now comes the interesting part:
Is Bitcoin preparing for a deeper drop, or does it still have enough strength to recover the structure?
What would you do here: short or wait for confirmation?
#Bitcoin #BTC #Crypt o #Trading #BinanceSquare
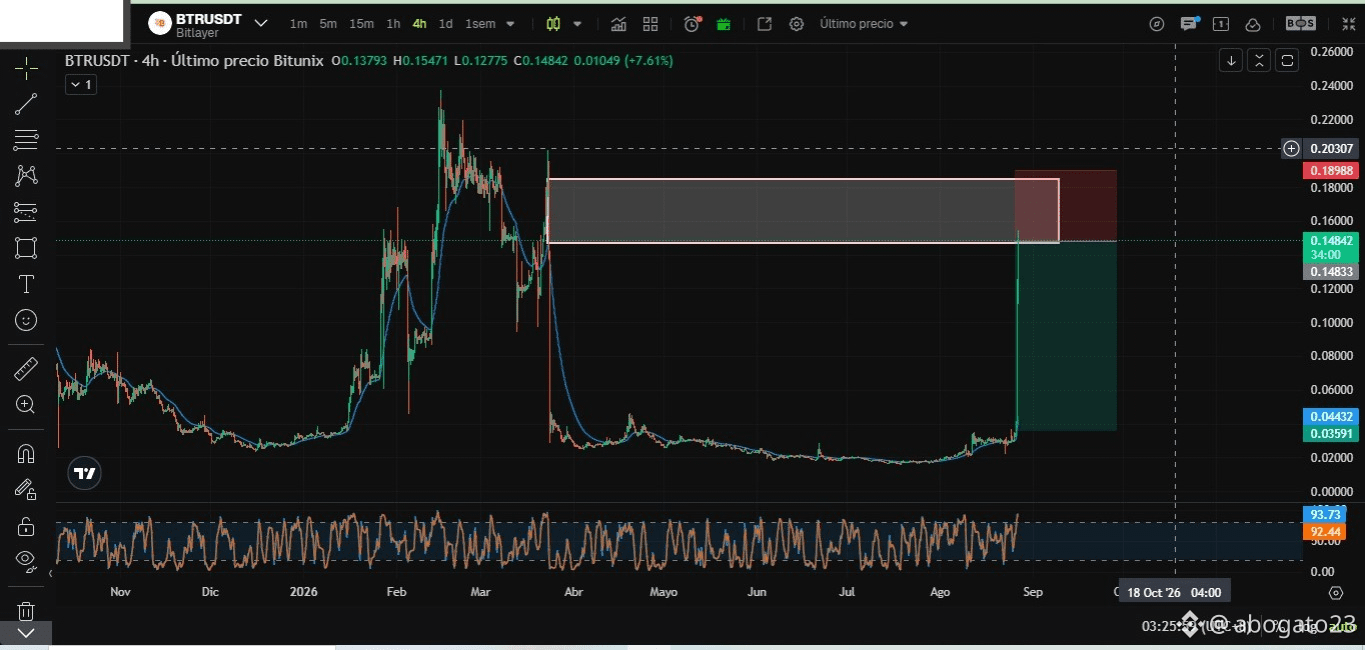
$BTR replenish the big imbalance that was left in h4, 350% in less than two days, get ready for the drop, it's on the way.
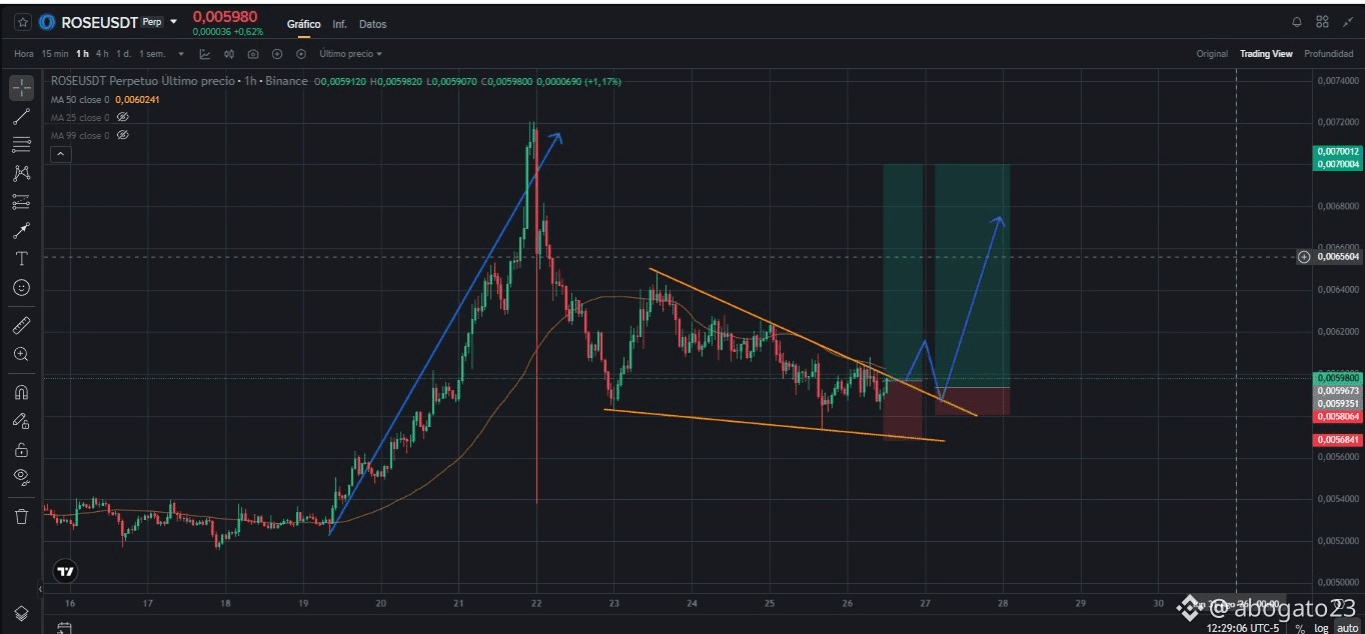
$ROSE 🌹 | Last push before dropping?
After the strong bullish move the altcoins had, $ROSE also got its pump… but now it’s starting to show something interesting. 👀
The asset has already cooled off and begun to accumulate, which is what usually happens after such a strong move.
In this kind of pump & dump, the pattern is usually pretty clear:
📌 Strong rise
📌 Dump or accumulation
📌 Final move before continuing the drop
And this is where $ROSE gets interesting: we have H1 imbalances that could turn into the next target.
When the market starts leaving these traces, many times it’s showing us that there’s still one last push left before it finishes dropping.
🎯 For me, ROSE could be setting up exactly that move.
The kind of move that the MMs love so much. 👀
After the strong bullish move the altcoins had, $ROSE also got its pump… but now it’s starting to show something interesting. 👀
The asset has already cooled off and begun to accumulate, which is what usually happens after such a strong move.
In this kind of pump & dump, the pattern is usually pretty clear:
📌 Strong rise
📌 Dump or accumulation
📌 Final move before continuing the drop
And this is where $ROSE gets interesting: we have H1 imbalances that could turn into the next target.
When the market starts leaving these traces, many times it’s showing us that there’s still one last push left before it finishes dropping.
🎯 For me, ROSE could be setting up exactly that move.
The kind of move that the MMs love so much. 👀
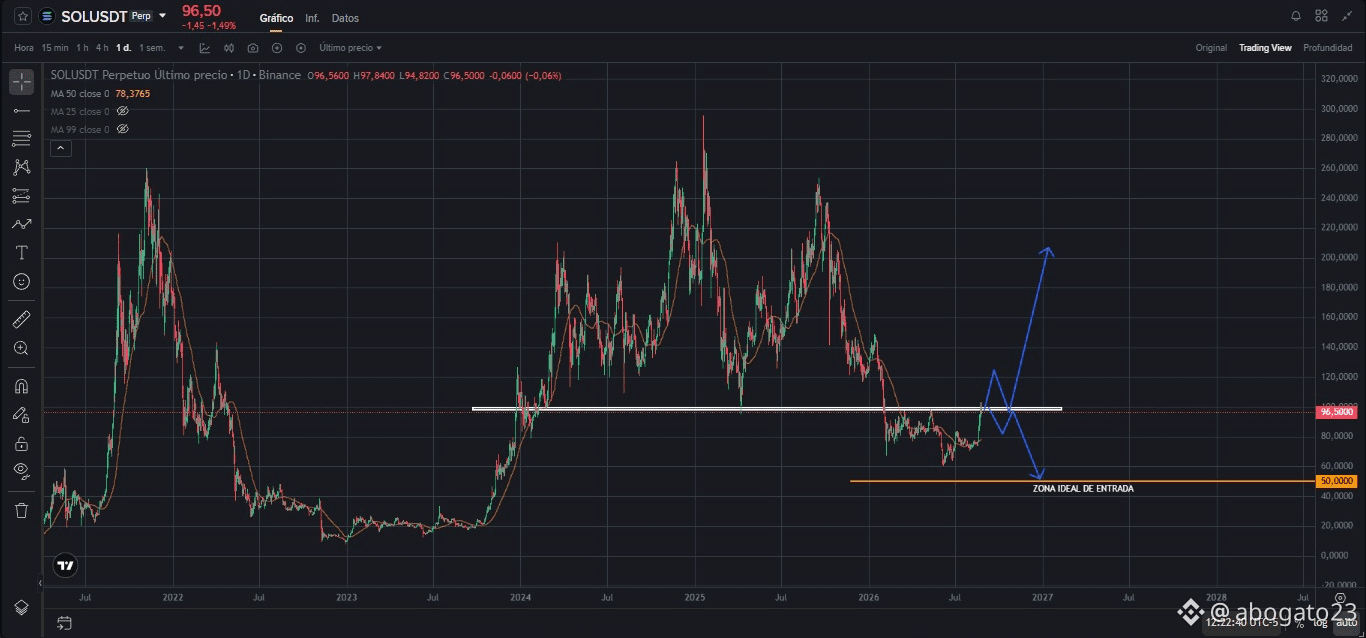
$SOL 🚨 | To the ATH or a bullish trap?
After the strong rally of $BTC , several altcoins took off and $SOL , being one of the big players in the ecosystem, couldn’t be left behind.
But here’s the interesting part. 👀
$SOL is starting to slow down right at one of the most important resistances on the daily chart:
📌 It tries to break through forcefully, but it still hasn’t managed to confirm it.
📌 Resistance keeps rejecting the price.
📌 For me, there’s still a possibility of a deviation before continuing.
In holding mode, I don’t rule out SOL eventually reaching new highs.
But my main scenario is different: first it could revisit the $50 zone before attempting to attack the ATH. 📉
Am I wrong? The market and time will tell.
🎯 If SOL starts closing several daily and weekly candles above $100, I’ll rule out this scenario and seriously start considering an entry.
For now, I’m just watching. 👀
After the strong rally of $BTC , several altcoins took off and $SOL , being one of the big players in the ecosystem, couldn’t be left behind.
But here’s the interesting part. 👀
$SOL is starting to slow down right at one of the most important resistances on the daily chart:
📌 It tries to break through forcefully, but it still hasn’t managed to confirm it.
📌 Resistance keeps rejecting the price.
📌 For me, there’s still a possibility of a deviation before continuing.
In holding mode, I don’t rule out SOL eventually reaching new highs.
But my main scenario is different: first it could revisit the $50 zone before attempting to attack the ATH. 📉
Am I wrong? The market and time will tell.
🎯 If SOL starts closing several daily and weekly candles above $100, I’ll rule out this scenario and seriously start considering an entry.
For now, I’m just watching. 👀
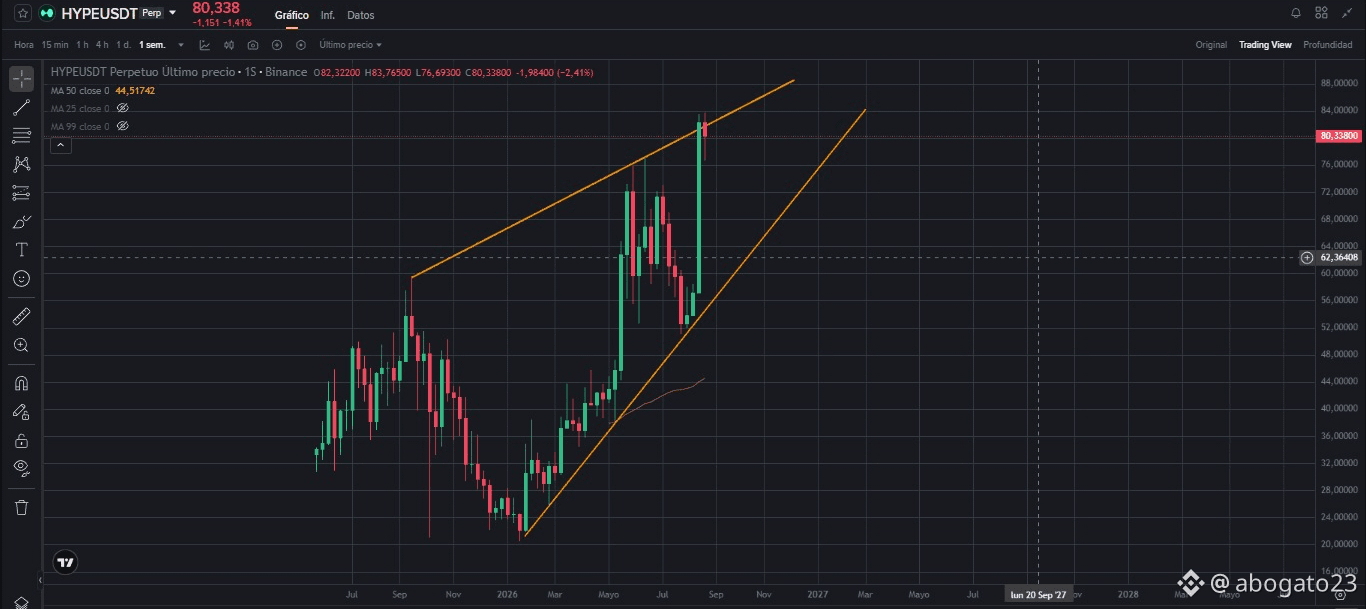
$HYPE E 👀 | I only leave this idea...
On a weekly basis, $HYPE comienza to start showing something that’s worth observing with great attention.
I’m not going to tell you what position to take. Everyone makes their own decisions. 📊
But remember something:
The market always speaks.
And many times, before making a move, it leaves small clues about what’s coming next.
👀 You just have to know how to listen to it—or read it, hehe
On a weekly basis, $HYPE comienza to start showing something that’s worth observing with great attention.
I’m not going to tell you what position to take. Everyone makes their own decisions. 📊
But remember something:
The market always speaks.
And many times, before making a move, it leaves small clues about what’s coming next.
👀 You just have to know how to listen to it—or read it, hehe
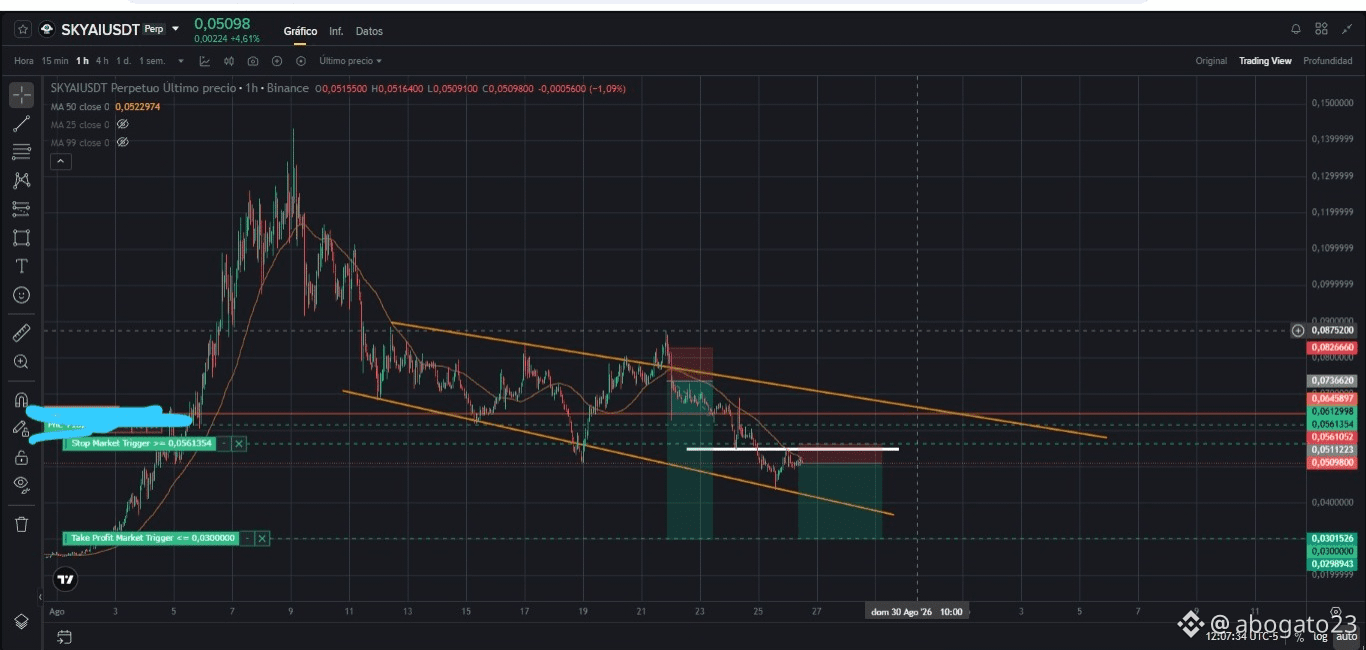
$SKYAI I 📉 | Is the final dump approaching?
I told you a few days ago: I shorted it from the top based on the bearish channel. And today, more than ever, I believe it’s close to its final sell-off. 👀
The asset is starting to show something very important: it no longer has the same upward strength.
On the contrary, it begins to leave clear signs of weakness:
📉 Higher and higher highs.
📉 Increased difficulty in breaking through resistances.
📉 Progressive loss of bullish momentum.
📉 Bearish channel still defining the structure.
For me, this is a pretty interesting moment to look for the short again and finally take it to the TP. 🎯
Now we just have to wait for it to confirm the weakness and let the price drop.
I told you a few days ago: I shorted it from the top based on the bearish channel. And today, more than ever, I believe it’s close to its final sell-off. 👀
The asset is starting to show something very important: it no longer has the same upward strength.
On the contrary, it begins to leave clear signs of weakness:
📉 Higher and higher highs.
📉 Increased difficulty in breaking through resistances.
📉 Progressive loss of bullish momentum.
📉 Bearish channel still defining the structure.
For me, this is a pretty interesting moment to look for the short again and finally take it to the TP. 🎯
Now we just have to wait for it to confirm the weakness and let the price drop.
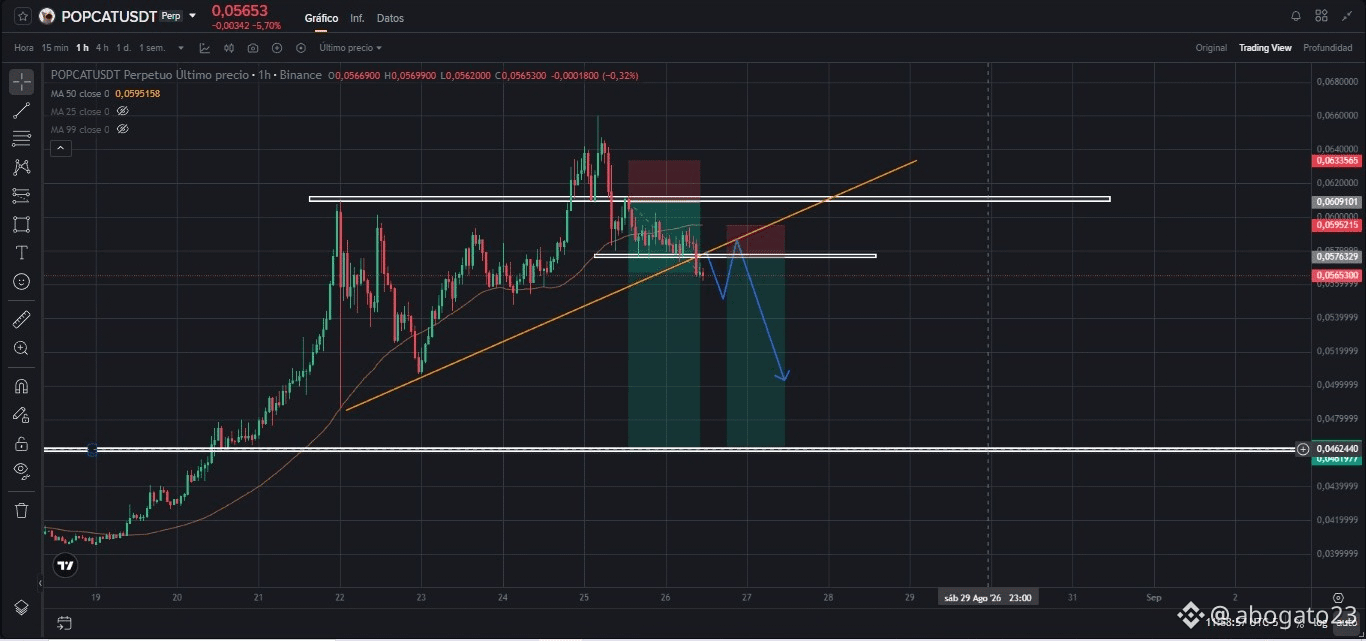
$POPCAT 📉 | Will the drop continue?
If you were keeping an eye on my positions, yesterday I was already saying that $POPCAT showed signs of falling… and sure enough, the bearish move arrived. 👀
But now a even more interesting confirmation appears:
📉 Break of the bullish trend from the last leg.
📉 Several candles confirming weakness.
📉 Possible retest of the trend or the previous support.
In my case, I would get back into a short position if it keeps confirming the breakout and then performs the retest.
🎯 My goal would be to look for the beginning of the impulse again, although the TP will depend on how the move develops.
The structure is already speaking. Now it’s time to wait for confirmation. 📉
If you were keeping an eye on my positions, yesterday I was already saying that $POPCAT showed signs of falling… and sure enough, the bearish move arrived. 👀
But now a even more interesting confirmation appears:
📉 Break of the bullish trend from the last leg.
📉 Several candles confirming weakness.
📉 Possible retest of the trend or the previous support.
In my case, I would get back into a short position if it keeps confirming the breakout and then performs the retest.
🎯 My goal would be to look for the beginning of the impulse again, although the TP will depend on how the move develops.
The structure is already speaking. Now it’s time to wait for confirmation. 📉
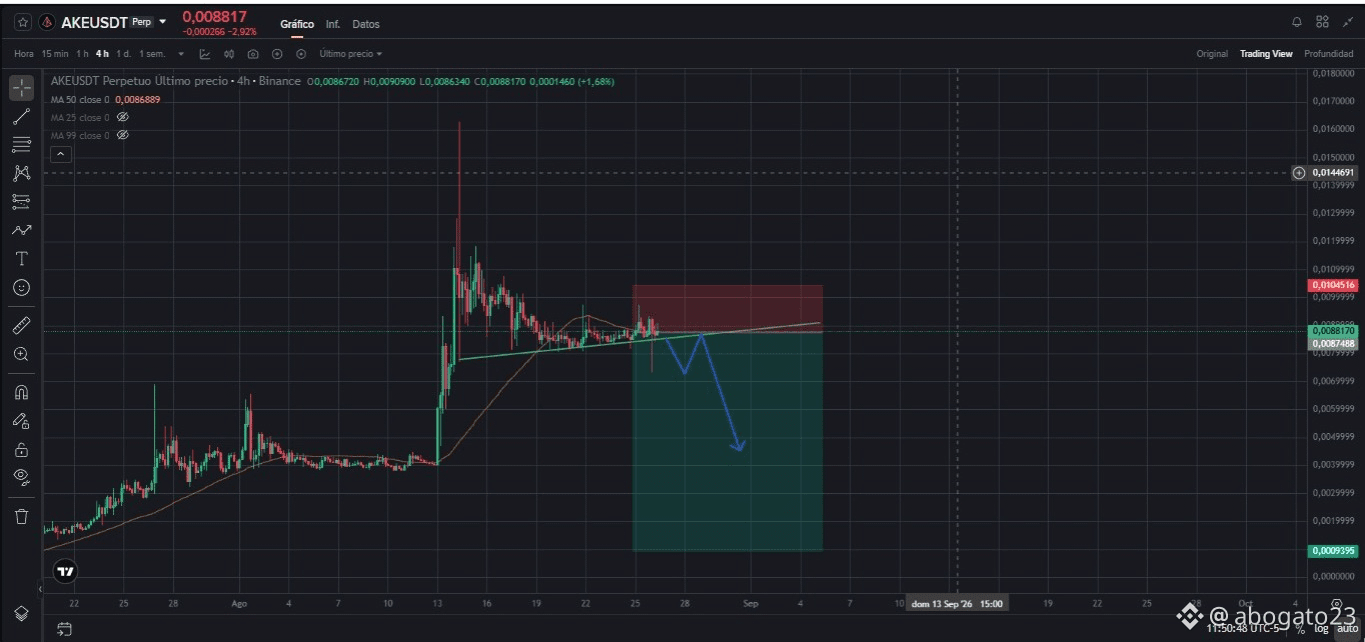
$AKE 📉 | Is the big drop coming?
I've been telling you for days: after a rise of more than 14,000%, this asset is starting to show strong weakness patterns. 👀
Every time I look, I see more signs of distribution at the highs:
📉 It fails to break above its ATH again.
📉 The bullish structure remains, but with increasingly weaker moves.
📉 The whales could be quietly unloading.
📉 The 50 EMA on H4 is beginning to position itself above the price.
For those who trade with more risk, a market short could be an option.
But if you prefer more confirmation, I'd wait for the break of the trendline + a retest to increase the position.
⚠️ Watch out: $AKE can be extremely explosive. In a move like that, a drop of 50%, 70%, or even more could happen within hours.
If you're waiting for confirmation, stay very on top of the chart.
The big drop can come at any moment. 📉
I've been telling you for days: after a rise of more than 14,000%, this asset is starting to show strong weakness patterns. 👀
Every time I look, I see more signs of distribution at the highs:
📉 It fails to break above its ATH again.
📉 The bullish structure remains, but with increasingly weaker moves.
📉 The whales could be quietly unloading.
📉 The 50 EMA on H4 is beginning to position itself above the price.
For those who trade with more risk, a market short could be an option.
But if you prefer more confirmation, I'd wait for the break of the trendline + a retest to increase the position.
⚠️ Watch out: $AKE can be extremely explosive. In a move like that, a drop of 50%, 70%, or even more could happen within hours.
If you're waiting for confirmation, stay very on top of the chart.
The big drop can come at any moment. 📉
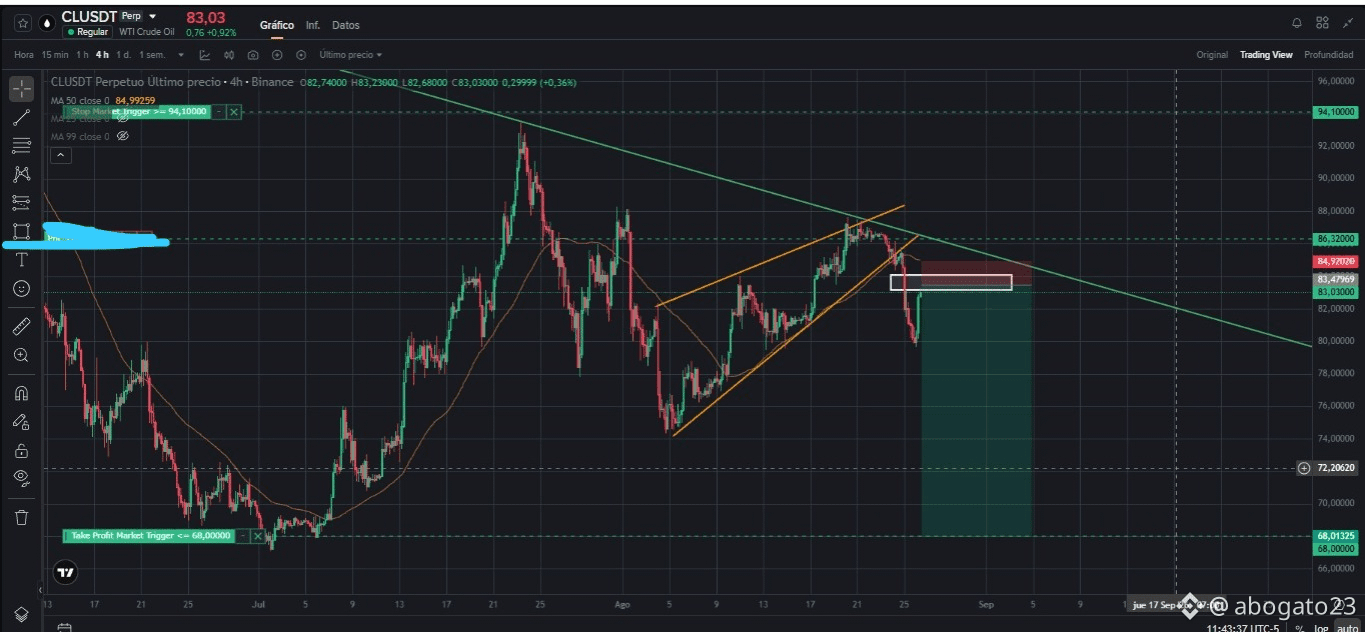
$CL 🛢️ | New entry for shorts?
If you were waiting on my previous posts, we’d already been talking about it: $CL is coming back to an interesting zone.
On the daily chart, it maintains a bearish trend, while on H4 it’s forming a wedge that from the start showed weakness after the strong bullish impulse. 👀
Now price is starting to look for the imbalance fill on H4, and this is where it gets interesting:
📉 Bearish trend on the daily
📉 Weakening wedge on H4
📉 Imbalance pending to be filled
📉 Structure with room to keep falling
For me, it could be a good opportunity to enter short—either as a swing trade until the wedge is completed or by targeting the previous low.
🎯 The exit will depend on how you trade and how the move develops.
Now it’s time to wait for confirmation.
If you were waiting on my previous posts, we’d already been talking about it: $CL is coming back to an interesting zone.
On the daily chart, it maintains a bearish trend, while on H4 it’s forming a wedge that from the start showed weakness after the strong bullish impulse. 👀
Now price is starting to look for the imbalance fill on H4, and this is where it gets interesting:
📉 Bearish trend on the daily
📉 Weakening wedge on H4
📉 Imbalance pending to be filled
📉 Structure with room to keep falling
For me, it could be a good opportunity to enter short—either as a swing trade until the wedge is completed or by targeting the previous low.
🎯 The exit will depend on how you trade and how the move develops.
Now it’s time to wait for confirmation.
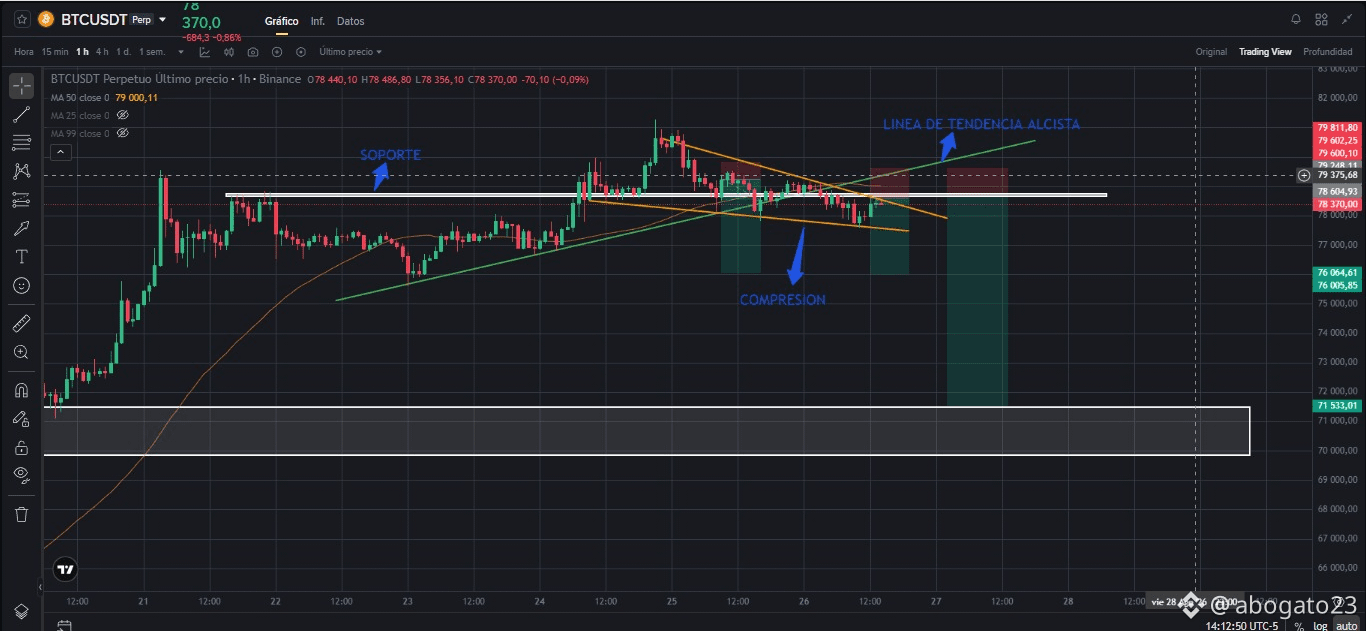
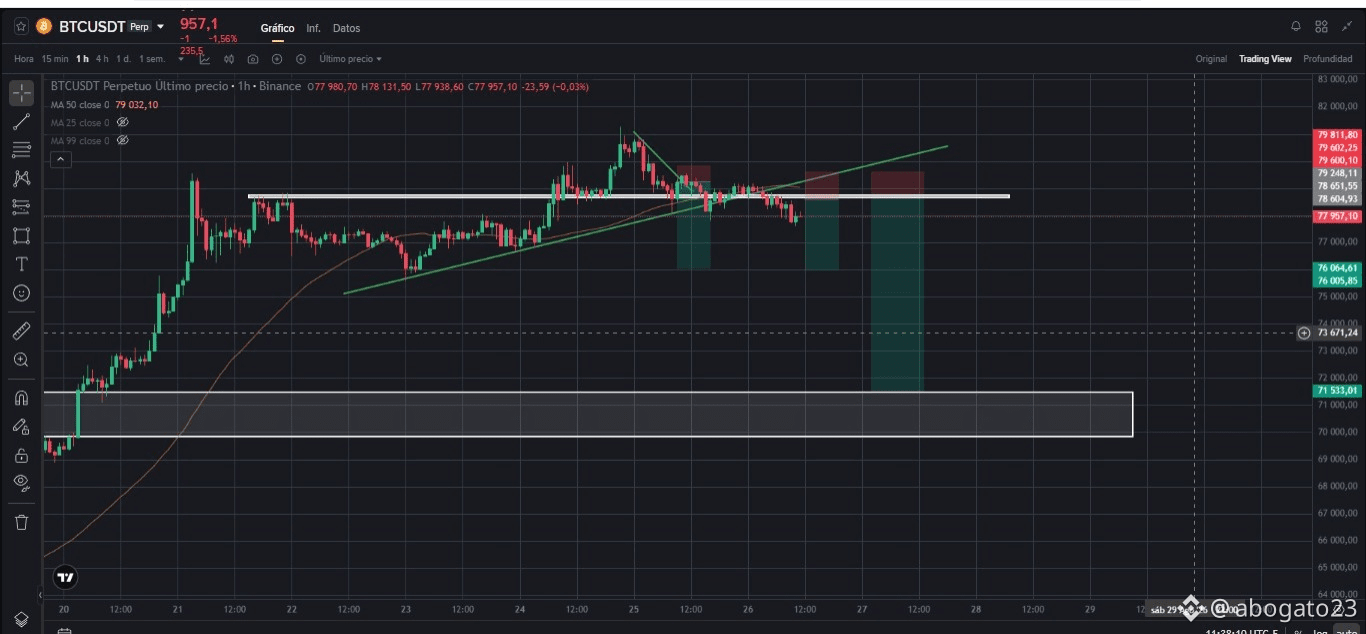
$BTC 📉 | Has the FOMO ended?
As I had been warning a few days ago, $BTC is starting to show considerable weakness and today it confirms something important. 👀
After the strong bullish impulse:
📉 It breaks the uptrend on H4 and H1.
📉 It leaves several candle closes below.
📉 It loses an important support in the short term.
📉 It begins closing several candles below the 50 EMA on H1.
If you didn’t enter the previous move, it could be looking for another short opportunity.
For me, it could be interesting as a swing setup to look for filling the imbalances, although more confirmation is still needed.
🎯 If $BTC retests the lost support and rejects it, that could be a good entry.
Is the institutional move ending?
Is the FOMO fading and fear returning to the market? 👀
As I had been warning a few days ago, $BTC is starting to show considerable weakness and today it confirms something important. 👀
After the strong bullish impulse:
📉 It breaks the uptrend on H4 and H1.
📉 It leaves several candle closes below.
📉 It loses an important support in the short term.
📉 It begins closing several candles below the 50 EMA on H1.
If you didn’t enter the previous move, it could be looking for another short opportunity.
For me, it could be interesting as a swing setup to look for filling the imbalances, although more confirmation is still needed.
🎯 If $BTC retests the lost support and rejects it, that could be a good entry.
Is the institutional move ending?
Is the FOMO fading and fear returning to the market? 👀
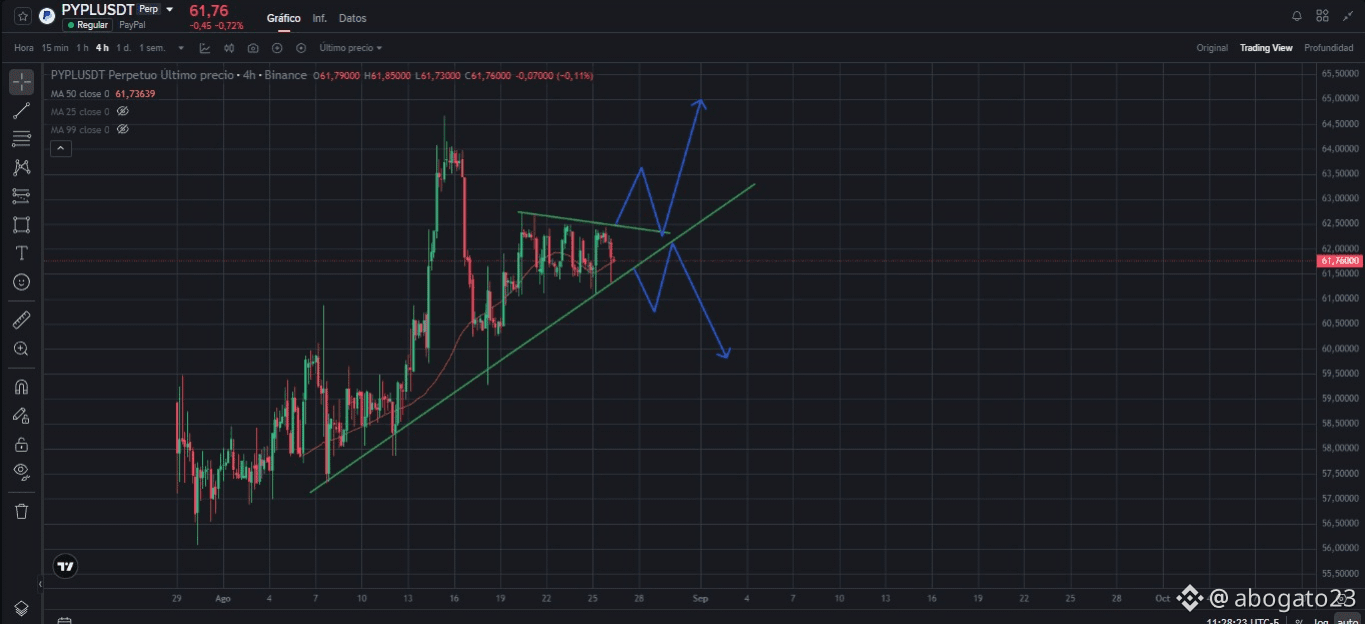
$PYPL ⚡ | Is movement coming?
$PYPL begins to squeeze its final stretch, and the chart starts giving us interesting clues about its next move. 👀
On H4 we have a fairly well-respected uptrend, but on H1 something different is starting to show:
📌 Price compression.
📌 Tighter and tighter movement.
📌 A possible explosive move approaching.
Right now, the scenario is open: it could break upward or seek a drop.
I’ll be watching the breakout to decide between long or short.
🎯 Either scenario is valid, but confirmation will be key.
Let’s see who gets ahead of the next move. 👀
$PYPL begins to squeeze its final stretch, and the chart starts giving us interesting clues about its next move. 👀
On H4 we have a fairly well-respected uptrend, but on H1 something different is starting to show:
📌 Price compression.
📌 Tighter and tighter movement.
📌 A possible explosive move approaching.
Right now, the scenario is open: it could break upward or seek a drop.
I’ll be watching the breakout to decide between long or short.
🎯 Either scenario is valid, but confirmation will be key.
Let’s see who gets ahead of the next move. 👀
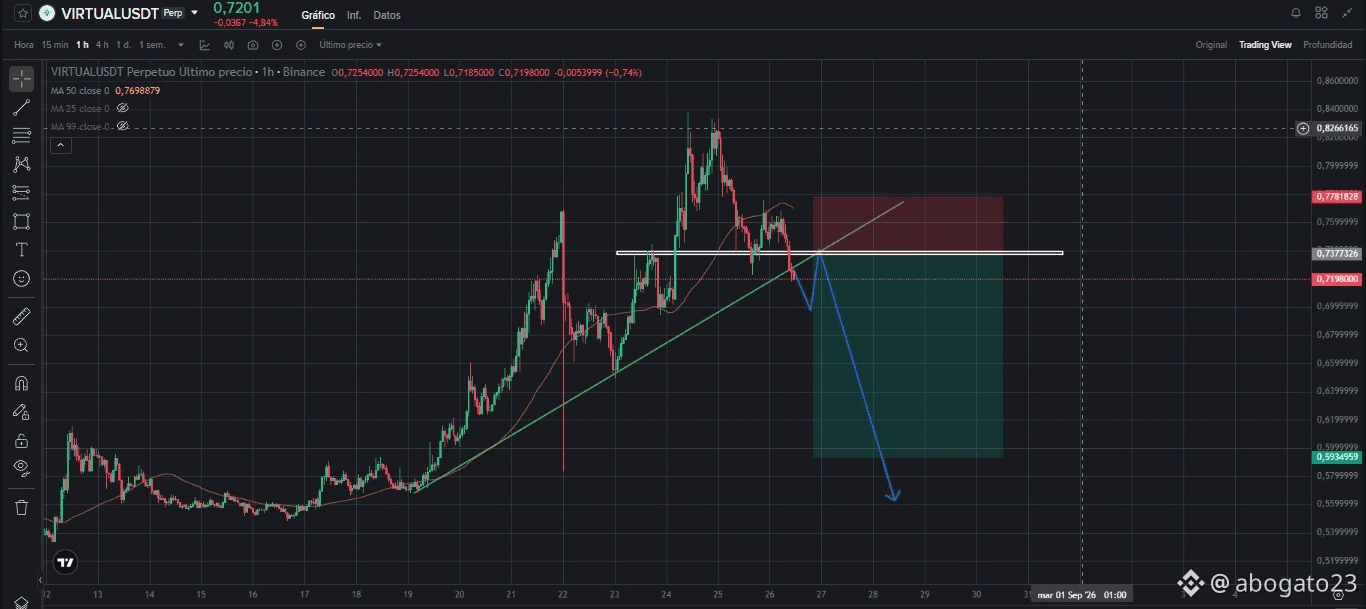
$VIRTUAL L 📉 | Next short?
This asset begins to show strong weakness on H1. 👀
After breaking a support forcefully, it has already had several candle closes below it, confirming that the level is starting to lose importance.
Now comes the interesting part:
📌 Next barrier: bullish trendline.
📌 If it breaks this structure, it could accelerate the drop.
📌 The best scenario would be to wait for a retest of the trend, or even of the support that was just broken.
For me, a break + retest on H1 could provide a pretty interesting short entry. 🎯
Watch out for $VIRTUAL . 📉
This asset begins to show strong weakness on H1. 👀
After breaking a support forcefully, it has already had several candle closes below it, confirming that the level is starting to lose importance.
Now comes the interesting part:
📌 Next barrier: bullish trendline.
📌 If it breaks this structure, it could accelerate the drop.
📌 The best scenario would be to wait for a retest of the trend, or even of the support that was just broken.
For me, a break + retest on H1 could provide a pretty interesting short entry. 🎯
Watch out for $VIRTUAL . 📉
Log in to explore more content