
Abdul ansari092
44 Posts

Abdul ansari092
Report
Block User
0 Following
1 Followers
1 Liked
Posts
3. Bitcoin analysis (BTC)
Global price: approximately $74,226.
24-hour range: $74,030–$75,548.
7-day performance: -4.03%.
24-hour spot ETF flow: $201 million net outflow on November 9.
Market observation: Bitcoin is showing weakness but holding around the $74K area in the reported snapshot.
3. Bitcoin analysis (BTC)
Global price: approximately $74,226.
24-hour range: $74,030–$75,548.
7-day performance: -4.03%.
24-hour spot ETF flow: $201 million net outflow on November 9.
Market observation: Bitcoin is showing weakness but holding around the $74K area in the reported snapshot.
Global price: approximately $74,226.
24-hour range: $74,030–$75,548.
7-day performance: -4.03%.
24-hour spot ETF flow: $201 million net outflow on November 9.
Market observation: Bitcoin is showing weakness but holding around the $74K area in the reported snapshot.
75
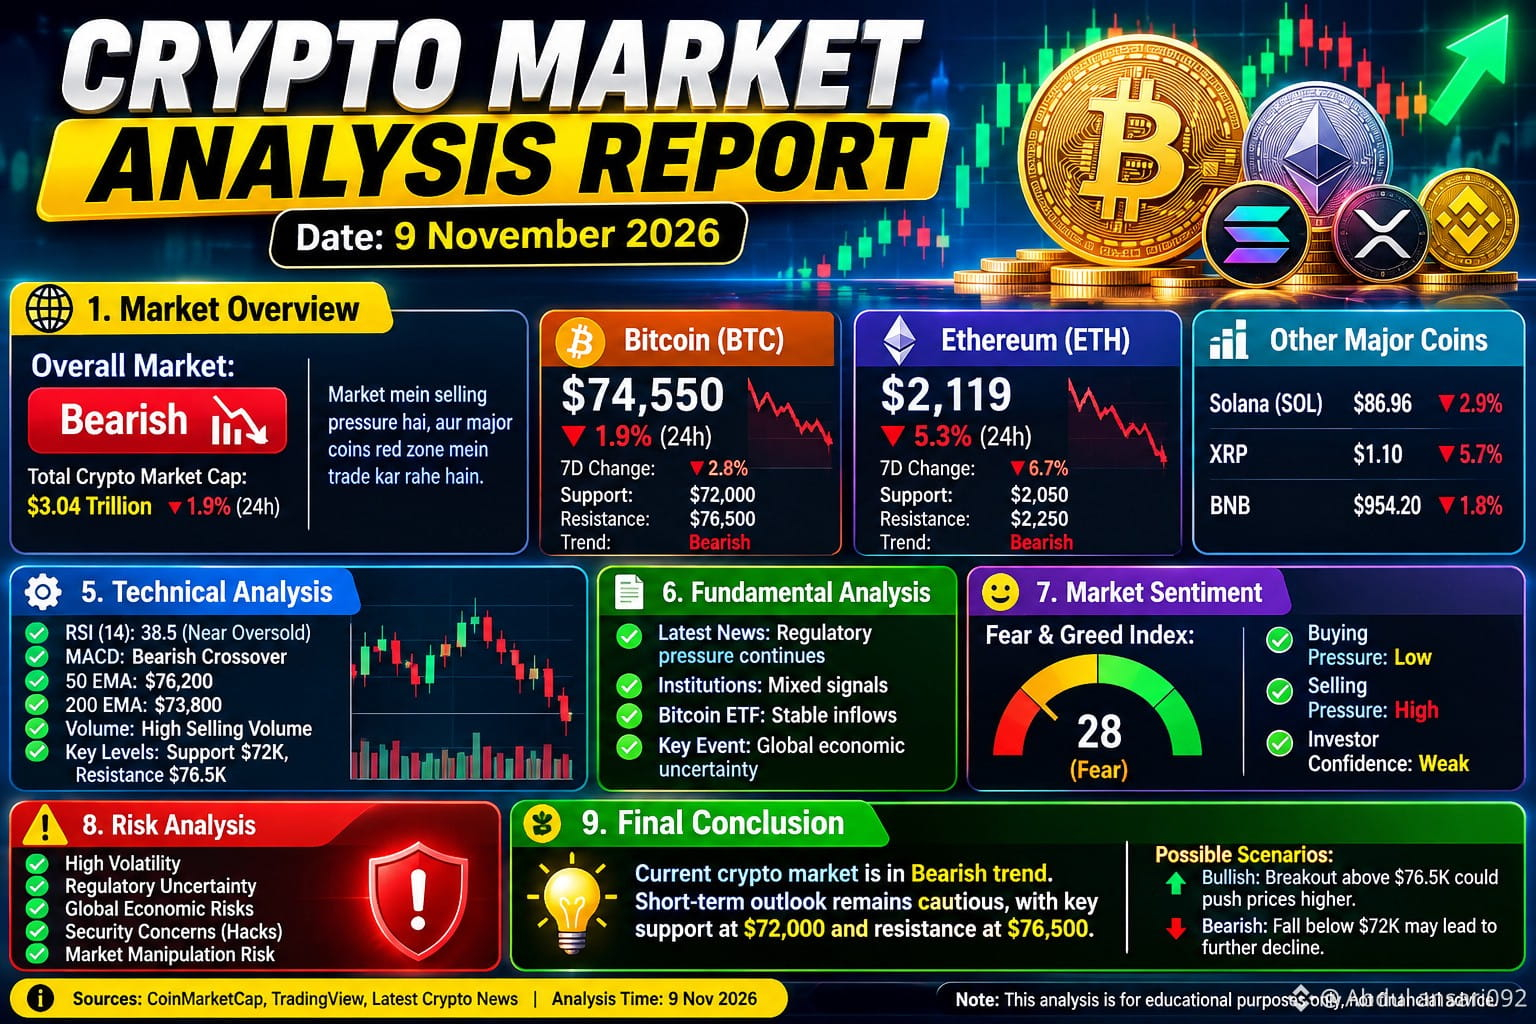
CRYPTO MARKET ANALYSIS REPORT
Date: 9 November 2026
1. Market Overview
Analyse the current cryptocurrency market and identify whether the overall market is Bullish, Bearish, or Sideways.
2. Bitcoin Analysis (BTC)
- Current Price:
- 24-Hour Change:
- 7-Day Performance:
- Support Levels:
- Resistance Levels:
- Market Trend:
3. Ethereum Analysis (ETH)
- Current Price:
- 24-Hour Change:
- 7-Day Performance:
- Support Levels:
- Resistance Levels:
- Market Trend:
4. Other Major Cryptocurrencies
Analyse:
- Solana (SOL)
- XRP
- BNB
5. Technical Analysis
- RSI Indicator
- MACD Indicator
- Moving Averages (50 EMA & 200 EMA)
- Trading Volume
- Support and Resistance
6. Fundamental Analysis
- Latest Crypto News
- Institutional Investments
- Regulatory Developments
- Bitcoin ETF Activity
- Important Market Events
7. Market Sentiment
- Fear and Greed Index
- Buying Pressure
- Selling Pressure
- Investor Confidence
8. Risk Analysis
Identify major market risks, volatility, and factors that could influence cryptocurrency prices.
9. Final Conclusion
Provide a data-driven summary of the market outlook, possible bullish and bearish scenarios, and key levels to monitor.
Important: Use updated and verified market data. Mention data sources and analysis timestamps. Do not present predictions as guaranteed outcomes.#WhatWillDriveCryptoandStocks’NextRebound? #AnthropicRejectsIPODelayValuationinQuestion $BITCOIN
{alpha}(10x72e4f9f808c49a2a61de9c5896298920dc4eeea9)
CRYPTO MARKET ANALYSIS REPORT
Date: 9 November 2026
1. Market Overview
Analyse the current cryptocurrency market and identify whether the overall market is Bullish, Bearish, or Sideways.
2. Bitcoin Analysis (BTC)
- Current Price:
- 24-Hour Change:
- 7-Day Performance:
- Support Levels:
- Resistance Levels:
- Market Trend:
3. Ethereum Analysis (ETH)
- Current Price:
- 24-Hour Change:
- 7-Day Performance:
- Support Levels:
- Resistance Levels:
- Market Trend:
4. Other Major Cryptocurrencies
Analyse:
- Solana (SOL)
- XRP
- BNB
5. Technical Analysis
- RSI Indicator
- MACD Indicator
- Moving Averages (50 EMA & 200 EMA)
- Trading Volume
- Support and Resistance
6. Fundamental Analysis
- Latest Crypto News
- Institutional Investments
- Regulatory Developments
- Bitcoin ETF Activity
- Important Market Events
7. Market Sentiment
- Fear and Greed Index
- Buying Pressure
- Selling Pressure
- Investor Confidence
8. Risk Analysis
Identify major market risks, volatility, and factors that could influence cryptocurrency prices.
9. Final Conclusion
Provide a data-driven summary of the market outlook, possible bullish and bearish scenarios, and key levels to monitor.
Important: Use updated and verified market data. Mention data sources and analysis timestamps. Do not present predictions as guaranteed outcomes.#WhatWillDriveCryptoandStocks’NextRebound? #AnthropicRejectsIPODelayValuationinQuestion $BITCOIN
Date: 9 November 2026
1. Market Overview
Analyse the current cryptocurrency market and identify whether the overall market is Bullish, Bearish, or Sideways.
2. Bitcoin Analysis (BTC)
- Current Price:
- 24-Hour Change:
- 7-Day Performance:
- Support Levels:
- Resistance Levels:
- Market Trend:
3. Ethereum Analysis (ETH)
- Current Price:
- 24-Hour Change:
- 7-Day Performance:
- Support Levels:
- Resistance Levels:
- Market Trend:
4. Other Major Cryptocurrencies
Analyse:
- Solana (SOL)
- XRP
- BNB
5. Technical Analysis
- RSI Indicator
- MACD Indicator
- Moving Averages (50 EMA & 200 EMA)
- Trading Volume
- Support and Resistance
6. Fundamental Analysis
- Latest Crypto News
- Institutional Investments
- Regulatory Developments
- Bitcoin ETF Activity
- Important Market Events
7. Market Sentiment
- Fear and Greed Index
- Buying Pressure
- Selling Pressure
- Investor Confidence
8. Risk Analysis
Identify major market risks, volatility, and factors that could influence cryptocurrency prices.
9. Final Conclusion
Provide a data-driven summary of the market outlook, possible bullish and bearish scenarios, and key levels to monitor.
Important: Use updated and verified market data. Mention data sources and analysis timestamps. Do not present predictions as guaranteed outcomes.#WhatWillDriveCryptoandStocks’NextRebound? #AnthropicRejectsIPODelayValuationinQuestion $BITCOIN
118
3. Bitcoin analysis (BTC)
Global price: approximately $74,226.
24-hour range: $74,030–$75,548.
7-day performance: -4.03%.
24-hour spot ETF flow: $201 million net outflow on November 9.
Market observation: Bitcoin is showing weakness but holding around the $74K area in the reported snapshot.
3. Bitcoin analysis (BTC)
Global price: approximately $74,226.
24-hour range: $74,030–$75,548.
7-day performance: -4.03%.
24-hour spot ETF flow: $201 million net outflow on November 9.
Market observation: Bitcoin is showing weakness but holding around the $74K area in the reported snapshot.
Global price: approximately $74,226.
24-hour range: $74,030–$75,548.
7-day performance: -4.03%.
24-hour spot ETF flow: $201 million net outflow on November 9.
Market observation: Bitcoin is showing weakness but holding around the $74K area in the reported snapshot.
73
3. Bitcoin analysis (BTC)
Global price: approximately $74,226.
24-hour range: $74,030–$75,548.
7-day performance: -4.03%.
24-hour spot ETF flow: $201 million net outflow on November 9.
Market observation: Bitcoin is showing weakness but holding around the $74K area in the reported snapshot.
3. Bitcoin analysis (BTC)
Global price: approximately $74,226.
24-hour range: $74,030–$75,548.
7-day performance: -4.03%.
24-hour spot ETF flow: $201 million net outflow on November 9.
Market observation: Bitcoin is showing weakness but holding around the $74K area in the reported snapshot.
Global price: approximately $74,226.
24-hour range: $74,030–$75,548.
7-day performance: -4.03%.
24-hour spot ETF flow: $201 million net outflow on November 9.
Market observation: Bitcoin is showing weakness but holding around the $74K area in the reported snapshot.

73
$BTC
{spot}(BTCUSDT)
🚨 Bitcoin Under Pressure: Can BTC Hold the $76,500 Support Zone?
Bitcoin ($BTC) is facing renewed selling pressure on October 30, 2026, as market uncertainty weighs on cryptocurrency prices.
According to CoinDesk, Bitcoin was trading around $77,386, following a significant market decline. The latest market report also highlighted a sharp increase in futures liquidations.
📊 Technical Analysis
Bitcoin's short-term technical structure looks weak.
Important Support Zones:
- $76,500 — Immediate support area.
- $75,800 — Next important support zone.
- $73,100 — A lower technical reference if selling pressure continues.
Important Resistance Zones:
- $80,000 — Psychological resistance.
- $80,600 — Important technical resistance.
- $81,200–$82,000 — Stronger resistance area.
📉 Bearish Scenario
If BTC fails to hold the $76,500 support zone, additional selling pressure could bring the $75,800 region into focus. A sustained move below this area could increase downside risk toward $73,100.
📈 Bullish Scenario
If buyers defend the $76,500 region and Bitcoin recovers above $80,000, market sentiment could improve. A stronger recovery above $81,200–$82,000 would provide a more meaningful sign of improving momentum.
⚠️ What Is Driving the Market?
Recent reports highlight a major security concern involving Binance, increased market uncertainty, and substantial liquidations.
CoinDesk reported approximately $1.57 billion in crypto futures liquidations, alongside a sharp increase in trading volume.
Bitcoin's next direction may also depend on broader market sentiment, trading activity, and the movement of traditional financial markets.
💬 **What do you think? Can Bitcoin defend the $76,500 support zone, or could sellers push BTC lower?
Share your analysis in the comments!**
Educational content only. This article is not financial advice or a recommendation to buy or sell any cryptocurrency. Always do your own research.
$BTC
🚨 Bitcoin Under Pressure: Can BTC Hold the $76,500 Support Zone?
Bitcoin ($BTC ) is facing renewed selling pressure on October 30, 2026, as market uncertainty weighs on cryptocurrency prices.
According to CoinDesk, Bitcoin was trading around $77,386, following a significant market decline. The latest market report also highlighted a sharp increase in futures liquidations.
📊 Technical Analysis
Bitcoin's short-term technical structure looks weak.
Important Support Zones:
- $76,500 — Immediate support area.
- $75,800 — Next important support zone.
- $73,100 — A lower technical reference if selling pressure continues.
Important Resistance Zones:
- $80,000 — Psychological resistance.
- $80,600 — Important technical resistance.
- $81,200–$82,000 — Stronger resistance area.
📉 Bearish Scenario
If BTC fails to hold the $76,500 support zone, additional selling pressure could bring the $75,800 region into focus. A sustained move below this area could increase downside risk toward $73,100.
📈 Bullish Scenario
If buyers defend the $76,500 region and Bitcoin recovers above $80,000, market sentiment could improve. A stronger recovery above $81,200–$82,000 would provide a more meaningful sign of improving momentum.
⚠️ What Is Driving the Market?
Recent reports highlight a major security concern involving Binance, increased market uncertainty, and substantial liquidations.
CoinDesk reported approximately $1.57 billion in crypto futures liquidations, alongside a sharp increase in trading volume.
Bitcoin's next direction may also depend on broader market sentiment, trading activity, and the movement of traditional financial markets.
💬 **What do you think? Can Bitcoin defend the $76,500 support zone, or could sellers push BTC lower?
Share your analysis in the comments!**
Educational content only. This article is not financial advice or a recommendation to buy or sell any cryptocurrency. Always do your own research.
🚨 Bitcoin Under Pressure: Can BTC Hold the $76,500 Support Zone?
Bitcoin ($BTC ) is facing renewed selling pressure on October 30, 2026, as market uncertainty weighs on cryptocurrency prices.
According to CoinDesk, Bitcoin was trading around $77,386, following a significant market decline. The latest market report also highlighted a sharp increase in futures liquidations.
📊 Technical Analysis
Bitcoin's short-term technical structure looks weak.
Important Support Zones:
- $76,500 — Immediate support area.
- $75,800 — Next important support zone.
- $73,100 — A lower technical reference if selling pressure continues.
Important Resistance Zones:
- $80,000 — Psychological resistance.
- $80,600 — Important technical resistance.
- $81,200–$82,000 — Stronger resistance area.
📉 Bearish Scenario
If BTC fails to hold the $76,500 support zone, additional selling pressure could bring the $75,800 region into focus. A sustained move below this area could increase downside risk toward $73,100.
📈 Bullish Scenario
If buyers defend the $76,500 region and Bitcoin recovers above $80,000, market sentiment could improve. A stronger recovery above $81,200–$82,000 would provide a more meaningful sign of improving momentum.
⚠️ What Is Driving the Market?
Recent reports highlight a major security concern involving Binance, increased market uncertainty, and substantial liquidations.
CoinDesk reported approximately $1.57 billion in crypto futures liquidations, alongside a sharp increase in trading volume.
Bitcoin's next direction may also depend on broader market sentiment, trading activity, and the movement of traditional financial markets.
💬 **What do you think? Can Bitcoin defend the $76,500 support zone, or could sellers push BTC lower?
Share your analysis in the comments!**
Educational content only. This article is not financial advice or a recommendation to buy or sell any cryptocurrency. Always do your own research.

65
$BNB
{spot}(BNBUSDT)
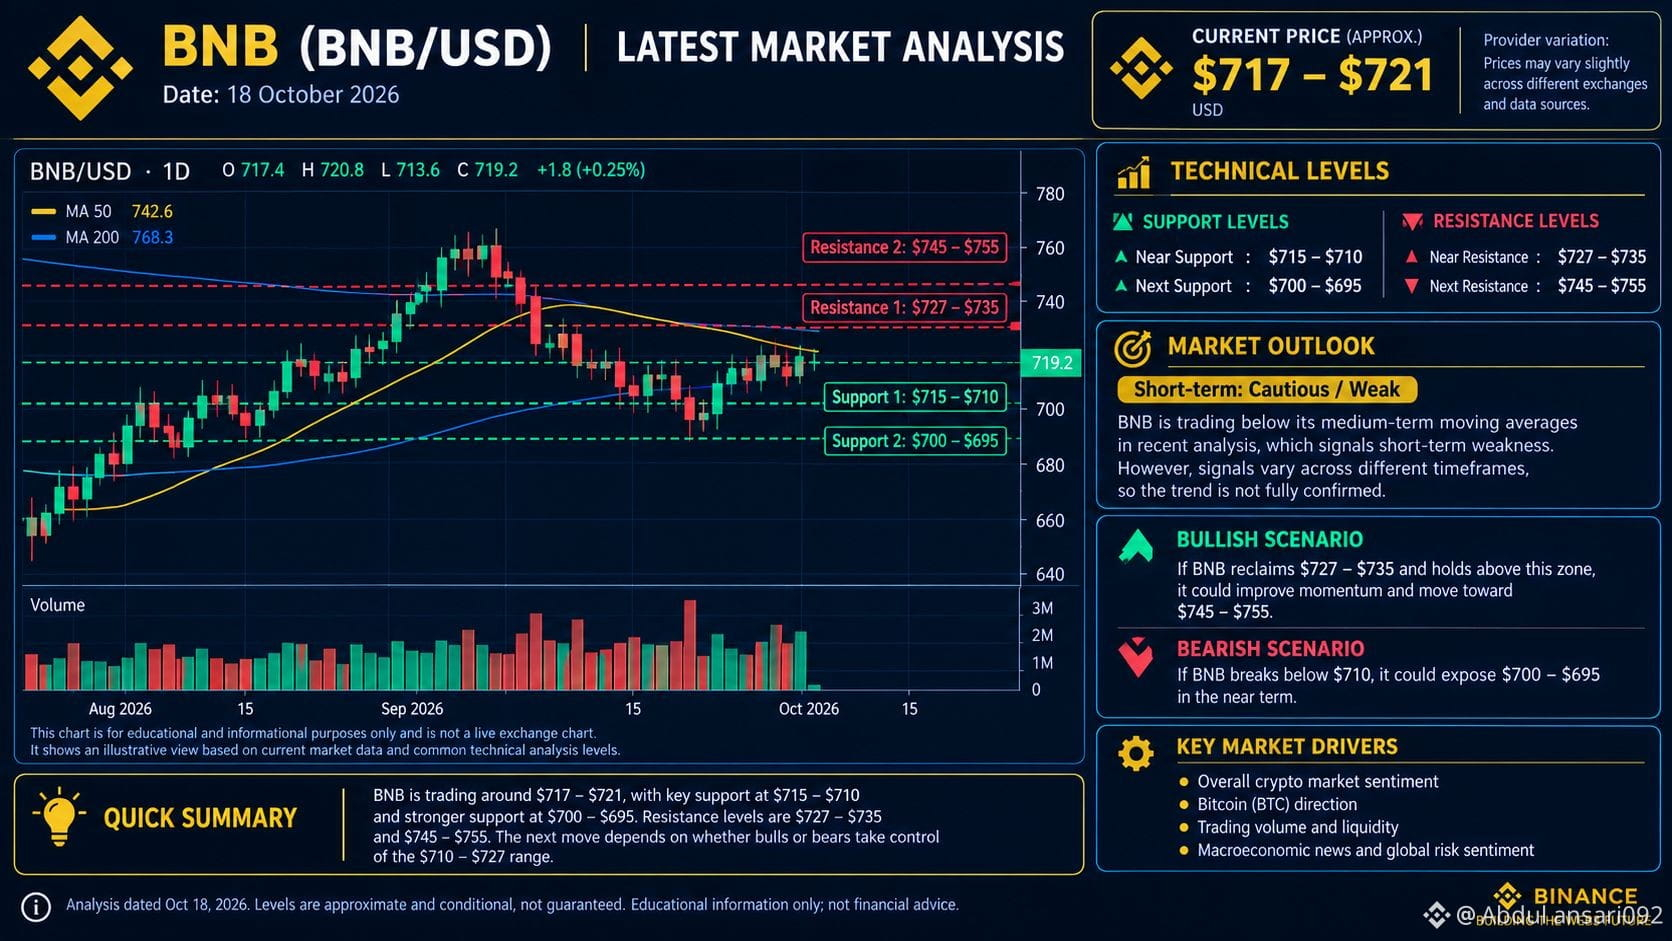
Current Price: Approximately $717–$721
SUPPORT LEVELS:
• Support 1: $715–$710
• Support 2: $700–$695
RESISTANCE LEVELS:
• Resistance 1: $727–$735
• Resistance 2: $745–$755
MARKET OUTLOOK:
Short-term outlook: Cautious / Weak.
Bullish Scenario:
If BNB breaks above $735 and holds that level, it could move toward $745–$755.
Bearish Scenario:
If BNB falls below $710, it could test the $700–$695 support zone.
KEY MARKET DRIVERS:
• Overall cryptocurrency market sentiment
• Bitcoin price movements
• Trading volume and liquidity
• Macroeconomic news and global market conditions
CONCLUSION:
BNB is trading near $717–$721, with short-term weakness and nearby support around $715–$710. A confirmed breakout above $735 or a breakdown below $710 could help indicate the next direction.
Note: Prices and technical levels are approximate and can change rapidly. This analysis is for educational purposes only and is not financial advice.#GrayscaleAndRepublicLaunchThreeCryptoFunds #DeepSeekReleasesUpdatedAIModel #Nasdaq100Falls5.5%InWorstWeekIn18Months
$BNB
Current Price: Approximately $717–$721
SUPPORT LEVELS:
• Support 1: $715–$710
• Support 2: $700–$695
RESISTANCE LEVELS:
• Resistance 1: $727–$735
• Resistance 2: $745–$755
MARKET OUTLOOK:
Short-term outlook: Cautious / Weak.
Bullish Scenario:
If BNB breaks above $735 and holds that level, it could move toward $745–$755.
Bearish Scenario:
If BNB falls below $710, it could test the $700–$695 support zone.
KEY MARKET DRIVERS:
• Overall cryptocurrency market sentiment
• Bitcoin price movements
• Trading volume and liquidity
• Macroeconomic news and global market conditions
CONCLUSION:
BNB is trading near $717–$721, with short-term weakness and nearby support around $715–$710. A confirmed breakout above $735 or a breakdown below $710 could help indicate the next direction.
Note: Prices and technical levels are approximate and can change rapidly. This analysis is for educational purposes only and is not financial advice.#GrayscaleAndRepublicLaunchThreeCryptoFunds #DeepSeekReleasesUpdatedAIModel #Nasdaq100Falls5.5%InWorstWeekIn18Months
Current Price: Approximately $717–$721
SUPPORT LEVELS:
• Support 1: $715–$710
• Support 2: $700–$695
RESISTANCE LEVELS:
• Resistance 1: $727–$735
• Resistance 2: $745–$755
MARKET OUTLOOK:
Short-term outlook: Cautious / Weak.
Bullish Scenario:
If BNB breaks above $735 and holds that level, it could move toward $745–$755.
Bearish Scenario:
If BNB falls below $710, it could test the $700–$695 support zone.
KEY MARKET DRIVERS:
• Overall cryptocurrency market sentiment
• Bitcoin price movements
• Trading volume and liquidity
• Macroeconomic news and global market conditions
CONCLUSION:
BNB is trading near $717–$721, with short-term weakness and nearby support around $715–$710. A confirmed breakout above $735 or a breakdown below $710 could help indicate the next direction.
Note: Prices and technical levels are approximate and can change rapidly. This analysis is for educational purposes only and is not financial advice.#GrayscaleAndRepublicLaunchThreeCryptoFunds #DeepSeekReleasesUpdatedAIModel #Nasdaq100Falls5.5%InWorstWeekIn18Months
70
$BTC
Current Price: $82,900 7-Day Change: -2.2% 30-Day Change: +7.7%
SUPPORT LEVELS: • Support 1: $81,000 • Support 2: $80,000
RESISTANCE LEVELS: • Resistance 1: $85,000 • Resistance 2: $87,500
MARKET OUTLOOK: Short-term outlook: Cautious and range-bound.
Bullish Scenario: A breakout above $85,000 could push Bitcoin toward $87,500.
Bearish Scenario: A breakdown below $81,000 could lead to a retest of $80,000.
KEY MARKET DRIVERS: • Rising oil prices • U.S. Treasury yields • Buying interest after recent losses • Mixed market sentiment and high volatility
CONCLUSION: Bitcoin is trading near $82,900, between key support and resistance levels. Traders should watch for a confirmed breakout or breakdown before making decisions.
#EtherETFsExtendOutflowsToNineDays #EthereumSurpasses2500USDT #XRPLedgerPatchesXRPCreationBug
{spot}(BTCUSDT)
$BTC
Current Price: $82,900 7-Day Change: -2.2% 30-Day Change: +7.7%
SUPPORT LEVELS: • Support 1: $81,000 • Support 2: $80,000
RESISTANCE LEVELS: • Resistance 1: $85,000 • Resistance 2: $87,500
MARKET OUTLOOK: Short-term outlook: Cautious and range-bound.
Bullish Scenario: A breakout above $85,000 could push Bitcoin toward $87,500.
Bearish Scenario: A breakdown below $81,000 could lead to a retest of $80,000.
KEY MARKET DRIVERS: • Rising oil prices • U.S. Treasury yields • Buying interest after recent losses • Mixed market sentiment and high volatility
CONCLUSION: Bitcoin is trading near $82,900, between key support and resistance levels. Traders should watch for a confirmed breakout or breakdown before making decisions.
#EtherETFsExtendOutflowsToNineDays #EthereumSurpasses2500USDT #XRPLedgerPatchesXRPCreationBug
Current Price: $82,900 7-Day Change: -2.2% 30-Day Change: +7.7%
SUPPORT LEVELS: • Support 1: $81,000 • Support 2: $80,000
RESISTANCE LEVELS: • Resistance 1: $85,000 • Resistance 2: $87,500
MARKET OUTLOOK: Short-term outlook: Cautious and range-bound.
Bullish Scenario: A breakout above $85,000 could push Bitcoin toward $87,500.
Bearish Scenario: A breakdown below $81,000 could lead to a retest of $80,000.
KEY MARKET DRIVERS: • Rising oil prices • U.S. Treasury yields • Buying interest after recent losses • Mixed market sentiment and high volatility
CONCLUSION: Bitcoin is trading near $82,900, between key support and resistance levels. Traders should watch for a confirmed breakout or breakdown before making decisions.
#EtherETFsExtendOutflowsToNineDays #EthereumSurpasses2500USDT #XRPLedgerPatchesXRPCreationBug
79
$BTC
{spot}(BTCUSDT)
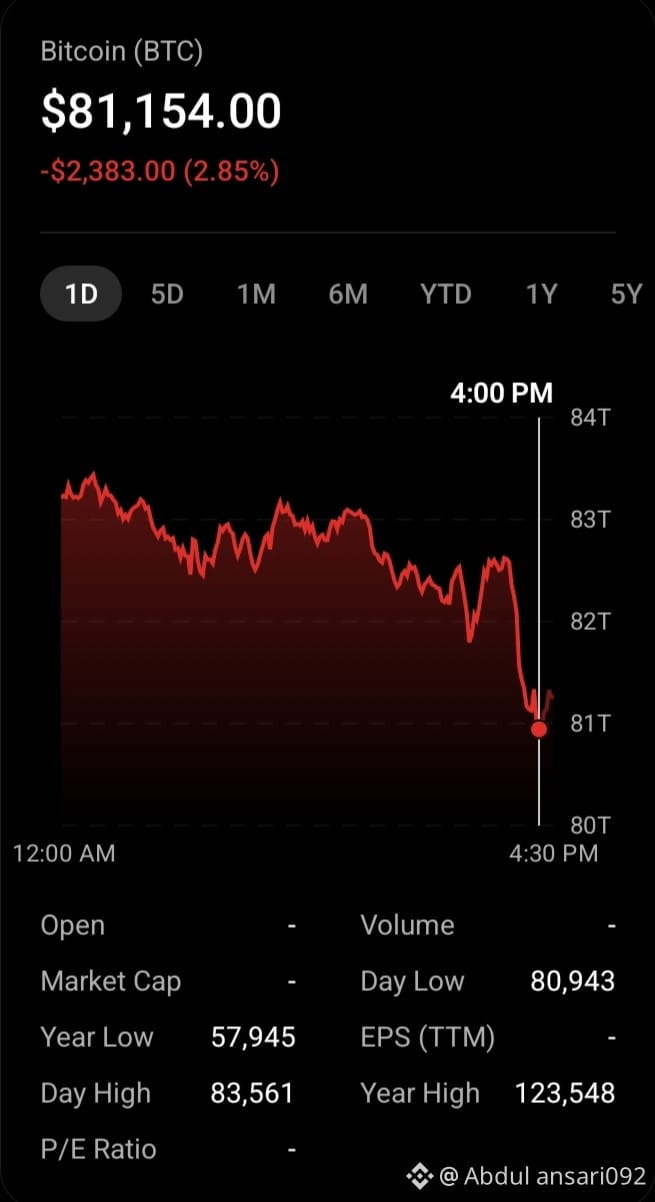
As of 8 October 2026, Bitcoin is under short-term selling pressure. The live chart shows BTC around $81.2K, with today’s range roughly $80.9K–$83.6K.
Short-term trend: Bearish/weak 📉
Important support: Around $81K–$82K
Important resistance: Around $83.5K–$86.5K
A major reason for the recent weakness is rising U.S. Treasury yields and oil prices, which are putting pressure on risk assets.
Admirals +1
U.S. spot Bitcoin ETFs saw about $484.9M of net outflows on October 7, adding selling pressure.
crypto.news
There is also a possible short-term rebound signal, but it needs confirmation from buyers.
crypto.news
My read: BTC is at a crucial area. Holding around $81K could support a bounce, while a clear break below it would make the short-term picture more negative. This is market analysis, not a recommendation to buy or sell. #IMFSaysTokenizedMarketsSmall #FedMinutesFocusOnOctoberPause #VitalikWarnsAICouldWeakenCryptographySecurity
$BTC
As of 8 October 2026, Bitcoin is under short-term selling pressure. The live chart shows BTC around $81.2K, with today’s range roughly $80.9K–$83.6K.
Short-term trend: Bearish/weak 📉
Important support: Around $81K–$82K
Important resistance: Around $83.5K–$86.5K
A major reason for the recent weakness is rising U.S. Treasury yields and oil prices, which are putting pressure on risk assets.
Admirals +1
U.S. spot Bitcoin ETFs saw about $484.9M of net outflows on October 7, adding selling pressure.
crypto.news
There is also a possible short-term rebound signal, but it needs confirmation from buyers.
crypto.news
My read: BTC is at a crucial area. Holding around $81K could support a bounce, while a clear break below it would make the short-term picture more negative. This is market analysis, not a recommendation to buy or sell. #IMFSaysTokenizedMarketsSmall #FedMinutesFocusOnOctoberPause #VitalikWarnsAICouldWeakenCryptographySecurity
As of 8 October 2026, Bitcoin is under short-term selling pressure. The live chart shows BTC around $81.2K, with today’s range roughly $80.9K–$83.6K.
Short-term trend: Bearish/weak 📉
Important support: Around $81K–$82K
Important resistance: Around $83.5K–$86.5K
A major reason for the recent weakness is rising U.S. Treasury yields and oil prices, which are putting pressure on risk assets.
Admirals +1
U.S. spot Bitcoin ETFs saw about $484.9M of net outflows on October 7, adding selling pressure.
crypto.news
There is also a possible short-term rebound signal, but it needs confirmation from buyers.
crypto.news
My read: BTC is at a crucial area. Holding around $81K could support a bounce, while a clear break below it would make the short-term picture more negative. This is market analysis, not a recommendation to buy or sell. #IMFSaysTokenizedMarketsSmall #FedMinutesFocusOnOctoberPause #VitalikWarnsAICouldWeakenCryptographySecurity
44
$ADA
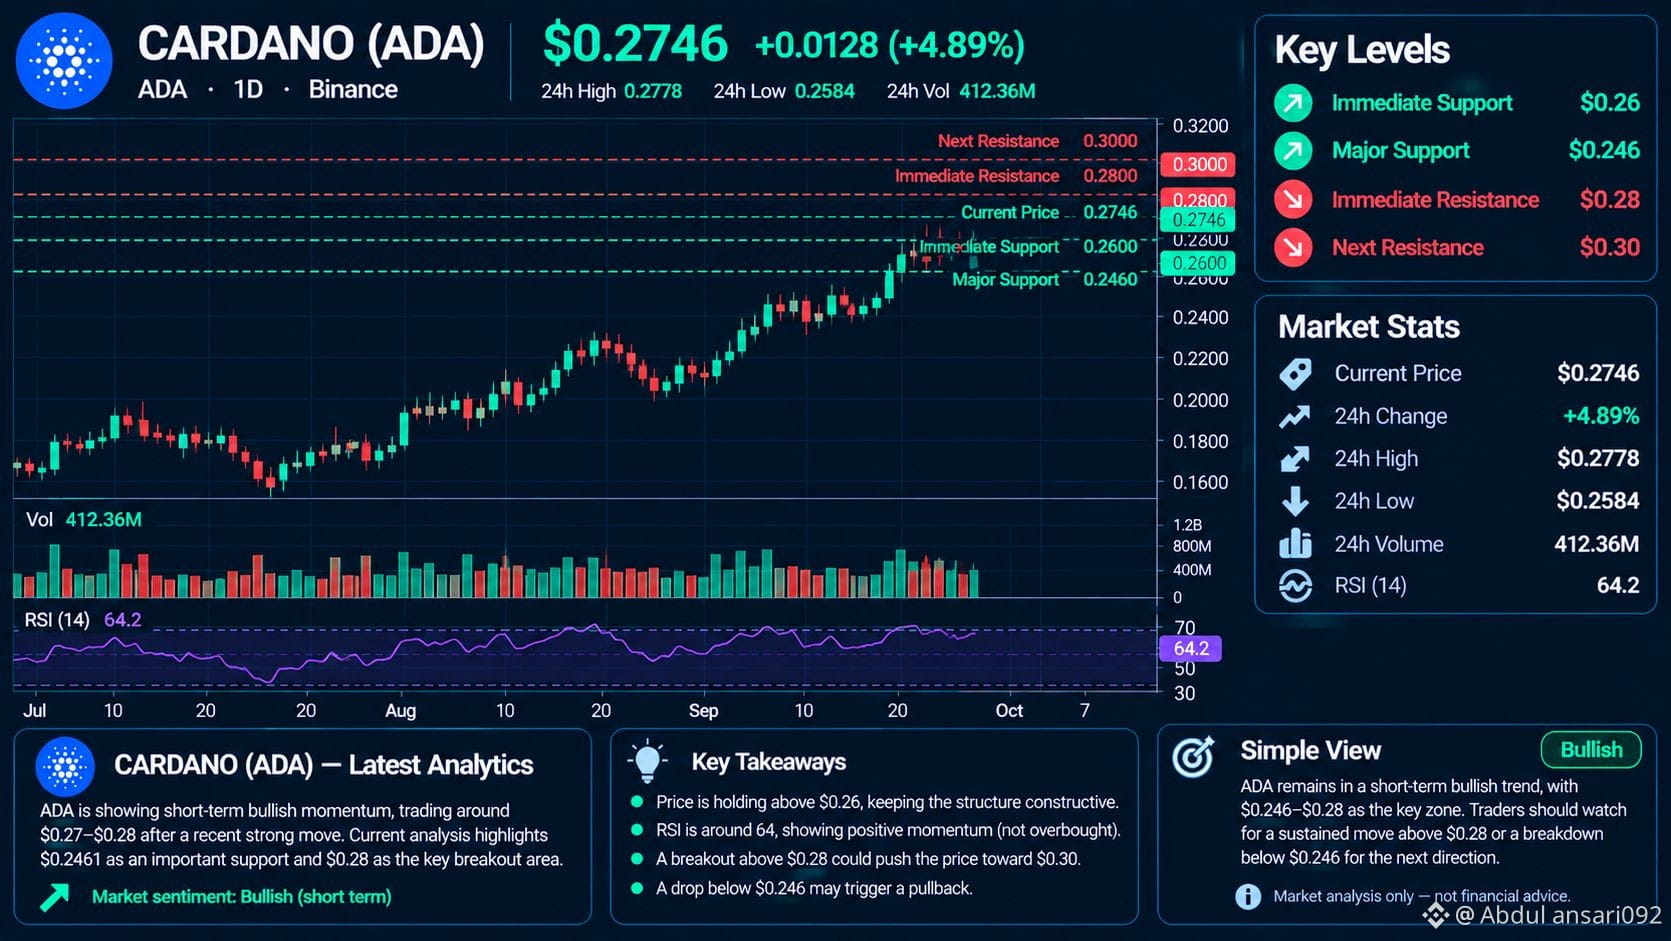
ADA is showing short-term bullish momentum, trading around $0.27–$0.28 after a recent strong move. Current analysis highlights $0.2461 as an important support and $0.28 as the key breakout area. �
Coin Edition +1
📊 Key Levels
Immediate Support: $0.26
Major Support: $0.246
Immediate Resistance: $0.28
Next Resistance: $0.30
📈 Chart View
Holding above $0.26 keeps the short-term structure constructive. A sustained move above $0.28 would strengthen the bullish setup, while losing $0.246 would weaken it. �
Coin Edition
🧠 Simple View
Short-term: Bullish
Key zone: $0.246–$0.28
#FedMinutesFocusOnOctoberPause #VitalikWarnsAICouldWeakenCryptographySecurity #FrenchHillUrgesCLARITYActPassageInLameDuck
{spot}(ADAUSDT)
$ADA
ADA is showing short-term bullish momentum, trading around $0.27–$0.28 after a recent strong move. Current analysis highlights $0.2461 as an important support and $0.28 as the key breakout area. �
Coin Edition +1
📊 Key Levels
Immediate Support: $0.26
Major Support: $0.246
Immediate Resistance: $0.28
Next Resistance: $0.30
📈 Chart View
Holding above $0.26 keeps the short-term structure constructive. A sustained move above $0.28 would strengthen the bullish setup, while losing $0.246 would weaken it. �
Coin Edition
🧠 Simple View
Short-term: Bullish
Key zone: $0.246–$0.28
#FedMinutesFocusOnOctoberPause #VitalikWarnsAICouldWeakenCryptographySecurity #FrenchHillUrgesCLARITYActPassageInLameDuck
ADA is showing short-term bullish momentum, trading around $0.27–$0.28 after a recent strong move. Current analysis highlights $0.2461 as an important support and $0.28 as the key breakout area. �
Coin Edition +1
📊 Key Levels
Immediate Support: $0.26
Major Support: $0.246
Immediate Resistance: $0.28
Next Resistance: $0.30
📈 Chart View
Holding above $0.26 keeps the short-term structure constructive. A sustained move above $0.28 would strengthen the bullish setup, while losing $0.246 would weaken it. �
Coin Edition
🧠 Simple View
Short-term: Bullish
Key zone: $0.246–$0.28
#FedMinutesFocusOnOctoberPause #VitalikWarnsAICouldWeakenCryptographySecurity #FrenchHillUrgesCLARITYActPassageInLameDuck
160
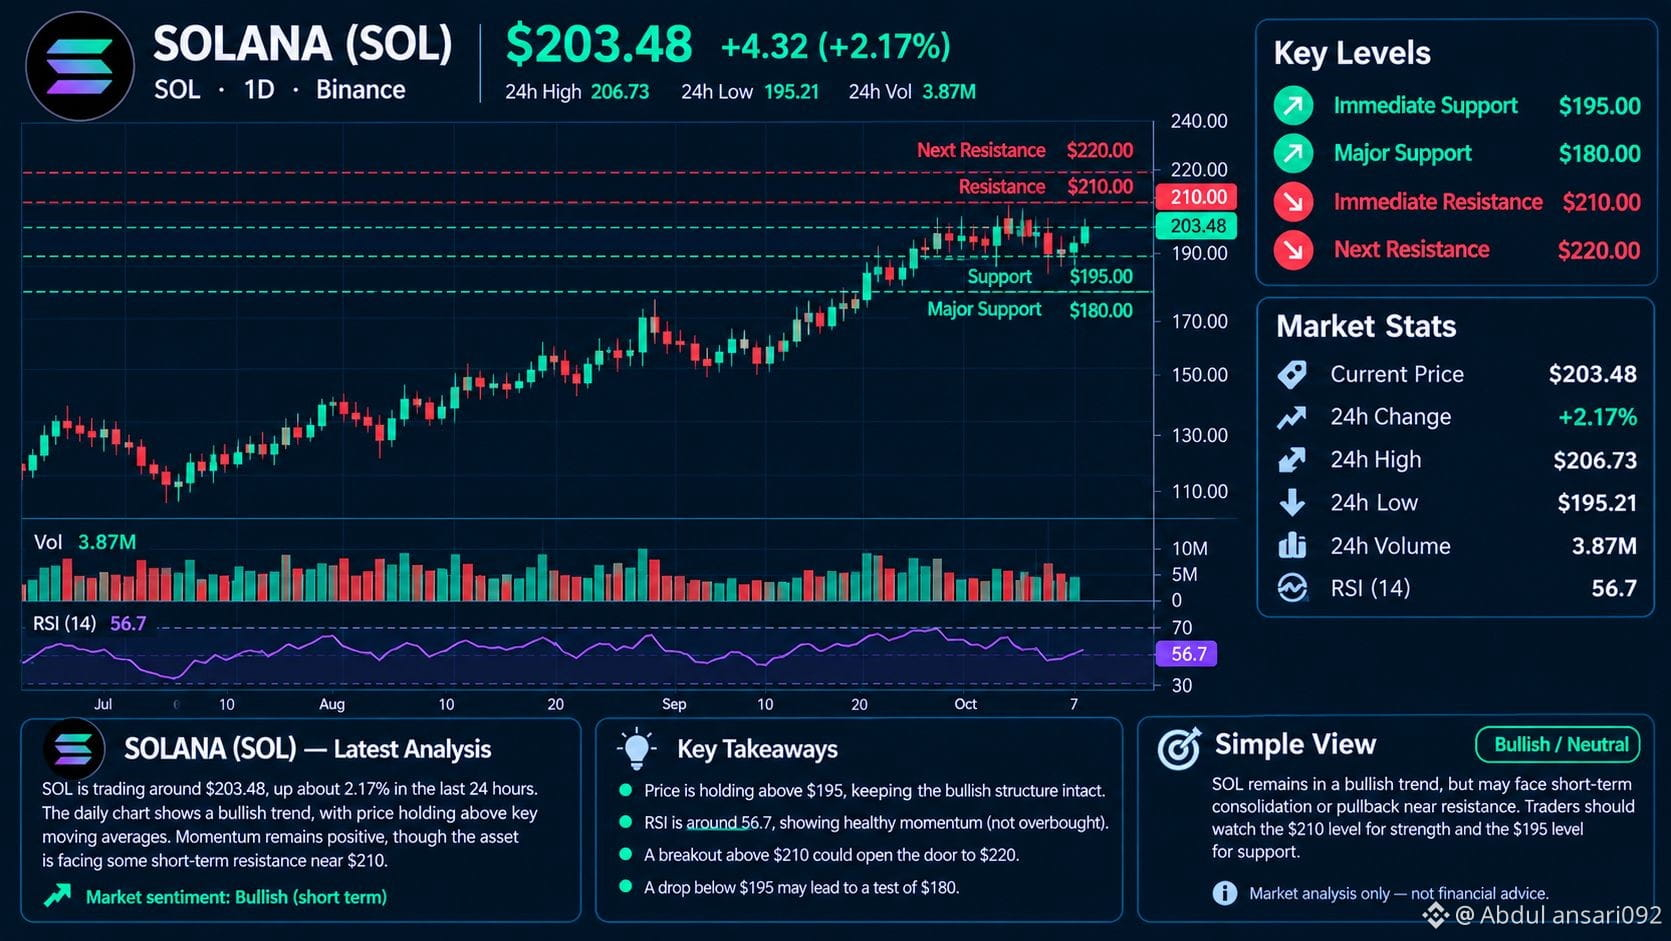
$SOL
SOL is trading around $115–$116, with the short-term trend under pressure after the recent rejection from the $120+ area. CoinGecko shows about $116.27, while Investing.com’s technical data has RSI around 34, indicating weak short-term momentum. �
CoinGecko +1
📊 Key Levels
Immediate Support: $114.50–$115
Major Support: $111.50–$108
Immediate Resistance: $117–$120
Major Resistance: $122–$125
A daily close above $117 would improve the short-term structure, while a sustained break below $114.50 could increase downside pressure toward $111–$108. �
en.coinotag.com +1
🧠 Simple View
Short-term: Bearish/Neutral
Medium-term: Still constructive while SOL holds the broader $108+ area.
#FedMinutesFocusOnOctoberPause #VitalikWarnsAICouldWeakenCryptographySecurity #FrenchHillUrgesCLARITYActPassageInLameDuck
{spot}(SOLUSDT)
$SOL
SOL is trading around $115–$116, with the short-term trend under pressure after the recent rejection from the $120+ area. CoinGecko shows about $116.27, while Investing.com’s technical data has RSI around 34, indicating weak short-term momentum. �
CoinGecko +1
📊 Key Levels
Immediate Support: $114.50–$115
Major Support: $111.50–$108
Immediate Resistance: $117–$120
Major Resistance: $122–$125
A daily close above $117 would improve the short-term structure, while a sustained break below $114.50 could increase downside pressure toward $111–$108. �
en.coinotag.com +1
🧠 Simple View
Short-term: Bearish/Neutral
Medium-term: Still constructive while SOL holds the broader $108+ area.
#FedMinutesFocusOnOctoberPause #VitalikWarnsAICouldWeakenCryptographySecurity #FrenchHillUrgesCLARITYActPassageInLameDuck
SOL is trading around $115–$116, with the short-term trend under pressure after the recent rejection from the $120+ area. CoinGecko shows about $116.27, while Investing.com’s technical data has RSI around 34, indicating weak short-term momentum. �
CoinGecko +1
📊 Key Levels
Immediate Support: $114.50–$115
Major Support: $111.50–$108
Immediate Resistance: $117–$120
Major Resistance: $122–$125
A daily close above $117 would improve the short-term structure, while a sustained break below $114.50 could increase downside pressure toward $111–$108. �
en.coinotag.com +1
🧠 Simple View
Short-term: Bearish/Neutral
Medium-term: Still constructive while SOL holds the broader $108+ area.
#FedMinutesFocusOnOctoberPause #VitalikWarnsAICouldWeakenCryptographySecurity #FrenchHillUrgesCLARITYActPassageInLameDuck
88
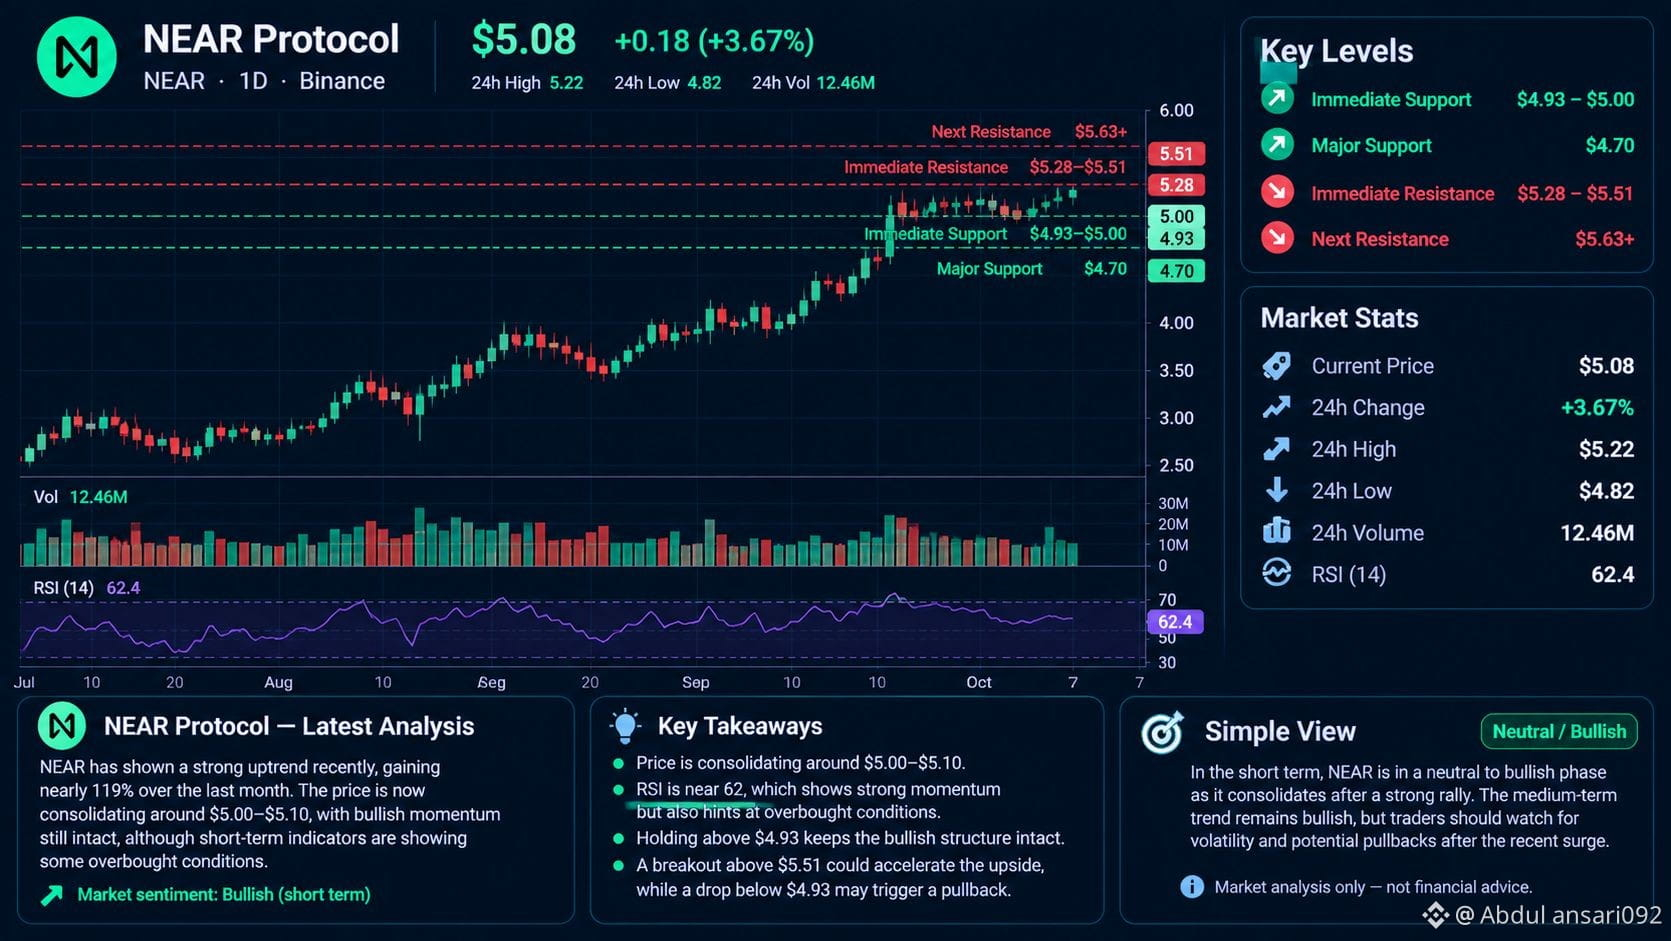
$NEAR
NEAR has recently shown a strong rally, but the price is now consolidating around the $5.00–$5.10 zone. The daily technical picture is still bullish, although short-term indicators are showing some overbought conditions.
💰 Current Price
≈ $5.08
🟢 Key Levels
Immediate Support: $4.93–$5.00
Major Support: $4.70
Immediate Resistance: $5.28–$5.51
Next Resistance: $5.63+
📊 Chart View
NEAR’s structure remains relatively strong above $5.00. A sustained breakout above $5.51 could strengthen bullish momentum, while a drop below $4.93 could increase weakness.
🧠 Simple View
Short-term: Neutral/Bullish
Medium-term: Bullish, but volatility and pullback risk remain after the sharp rally.
{spot}(NEARUSDT)
#FedMinutesFocusOnOctoberPause #BinanceLaunchesBinanceIntelligence #EvernorthDelaysNasdaqDebutToOct12
$NEAR
NEAR has recently shown a strong rally, but the price is now consolidating around the $5.00–$5.10 zone. The daily technical picture is still bullish, although short-term indicators are showing some overbought conditions.
💰 Current Price
≈ $5.08
🟢 Key Levels
Immediate Support: $4.93–$5.00
Major Support: $4.70
Immediate Resistance: $5.28–$5.51
Next Resistance: $5.63+
📊 Chart View
NEAR’s structure remains relatively strong above $5.00. A sustained breakout above $5.51 could strengthen bullish momentum, while a drop below $4.93 could increase weakness.
🧠 Simple View
Short-term: Neutral/Bullish
Medium-term: Bullish, but volatility and pullback risk remain after the sharp rally.
#FedMinutesFocusOnOctoberPause #BinanceLaunchesBinanceIntelligence #EvernorthDelaysNasdaqDebutToOct12
NEAR has recently shown a strong rally, but the price is now consolidating around the $5.00–$5.10 zone. The daily technical picture is still bullish, although short-term indicators are showing some overbought conditions.
💰 Current Price
≈ $5.08
🟢 Key Levels
Immediate Support: $4.93–$5.00
Major Support: $4.70
Immediate Resistance: $5.28–$5.51
Next Resistance: $5.63+
📊 Chart View
NEAR’s structure remains relatively strong above $5.00. A sustained breakout above $5.51 could strengthen bullish momentum, while a drop below $4.93 could increase weakness.
🧠 Simple View
Short-term: Neutral/Bullish
Medium-term: Bullish, but volatility and pullback risk remain after the sharp rally.
#FedMinutesFocusOnOctoberPause #BinanceLaunchesBinanceIntelligence #EvernorthDelaysNasdaqDebutToOct12
125
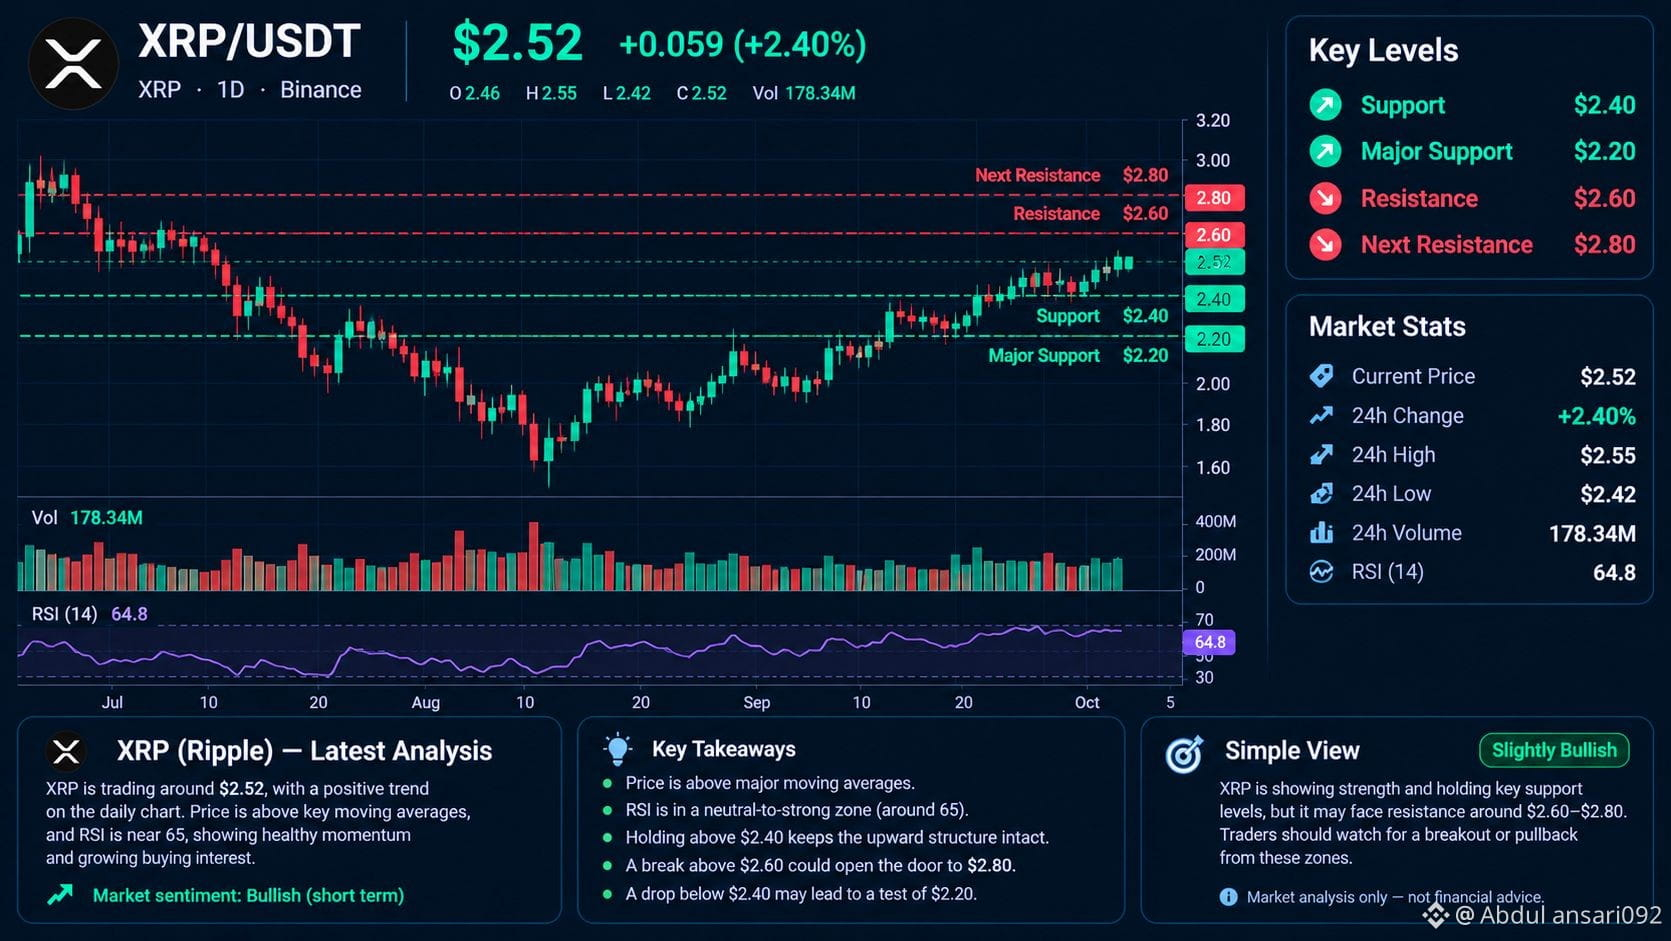
$XRP
XRP is trading around $1.44, down roughly 4.5% over 24 hours. The short-term technical picture has weakened: RSI is around 25, several momentum indicators are bearish, and XRP is trading below its major moving averages.
🔑 Key Levels
- Immediate Support: $1.43–$1.44
- Major Support: $1.30–$1.34
- Immediate Resistance: $1.45–$1.46
- Major Resistance: $1.50–$1.55
📊 Chart View
XRP is currently in a short-term bearish phase after rejection near the $1.55 area. Holding the $1.43–$1.44 region could stabilize the price, while a sustained recovery above $1.50–$1.55 would improve the technical structure.
👀 Simple View
Bearish short-term bias. RSI is deeply weak/oversold, but that alone does not confirm a reversal. The main levels to monitor are $1.43 support and $1.50–$1.55 resistance.
#FedMinutesFocusOnOctoberPause #BinanceLaunchesBinanceIntelligence #EvernorthDelaysNasdaqDebutToOct12
{spot}(XRPUSDT)
$XRP
XRP is trading around $1.44, down roughly 4.5% over 24 hours. The short-term technical picture has weakened: RSI is around 25, several momentum indicators are bearish, and XRP is trading below its major moving averages.
🔑 Key Levels
- Immediate Support: $1.43–$1.44
- Major Support: $1.30–$1.34
- Immediate Resistance: $1.45–$1.46
- Major Resistance: $1.50–$1.55
📊 Chart View
XRP is currently in a short-term bearish phase after rejection near the $1.55 area. Holding the $1.43–$1.44 region could stabilize the price, while a sustained recovery above $1.50–$1.55 would improve the technical structure.
👀 Simple View
Bearish short-term bias. RSI is deeply weak/oversold, but that alone does not confirm a reversal. The main levels to monitor are $1.43 support and $1.50–$1.55 resistance.
#FedMinutesFocusOnOctoberPause #BinanceLaunchesBinanceIntelligence #EvernorthDelaysNasdaqDebutToOct12
XRP is trading around $1.44, down roughly 4.5% over 24 hours. The short-term technical picture has weakened: RSI is around 25, several momentum indicators are bearish, and XRP is trading below its major moving averages.
🔑 Key Levels
- Immediate Support: $1.43–$1.44
- Major Support: $1.30–$1.34
- Immediate Resistance: $1.45–$1.46
- Major Resistance: $1.50–$1.55
📊 Chart View
XRP is currently in a short-term bearish phase after rejection near the $1.55 area. Holding the $1.43–$1.44 region could stabilize the price, while a sustained recovery above $1.50–$1.55 would improve the technical structure.
👀 Simple View
Bearish short-term bias. RSI is deeply weak/oversold, but that alone does not confirm a reversal. The main levels to monitor are $1.43 support and $1.50–$1.55 resistance.
#FedMinutesFocusOnOctoberPause #BinanceLaunchesBinanceIntelligence #EvernorthDelaysNasdaqDebutToOct12
134
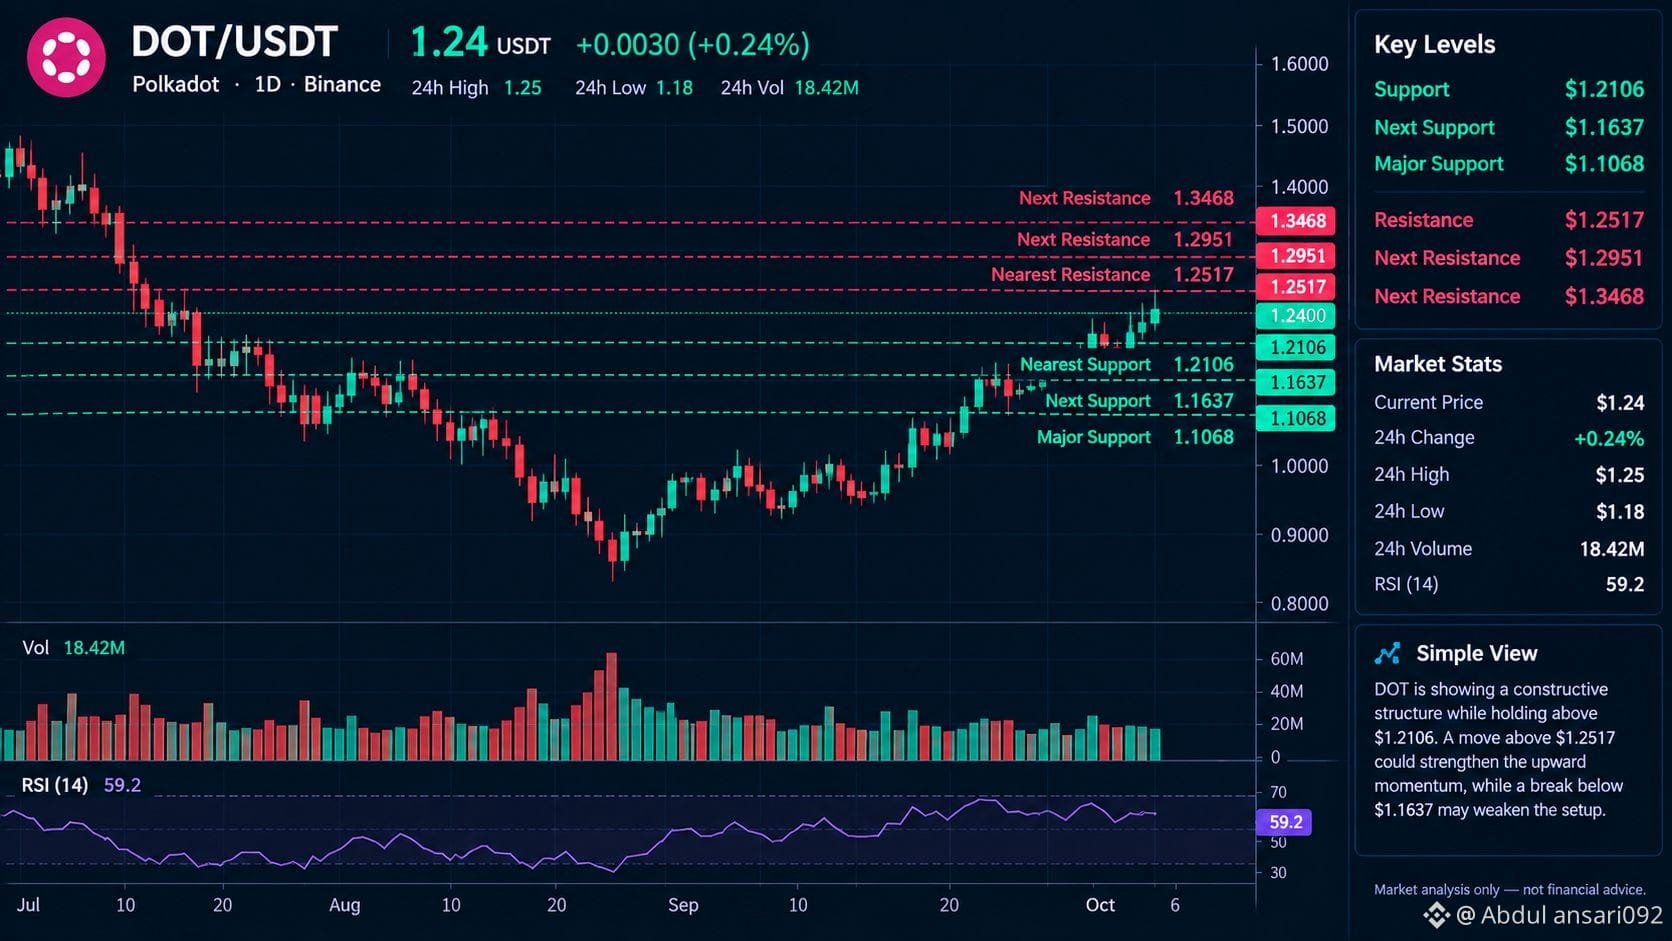
$DOT
Polkadot (DOT) is trading around $1.22, up about 0.56% in 24 hours. Recent volume has increased sharply, while price remains above key moving averages, giving the short-term chart a constructive technical structure.
🔑 Key Levels
- Support: $1.15
- Major Support: $1.11 → $1.06
- Resistance: $1.25 → $1.30
📊 Chart View
Holding above $1.15 keeps the current recovery structure intact. A sustained move above the $1.25–$1.30 resistance zone would indicate stronger upward momentum, while a move below $1.11 would weaken the setup.
👀 Simple View
Slightly bullish/constructive, but DOT remains sensitive to the broader crypto market. Bitcoin's movement can significantly affect altcoin momentum.
#DOT_UPDATE #bitcoin #BinanceLaunchesBinanceIntelligence
{spot}(DOTUSDT)
$DOT
Polkadot (DOT) is trading around $1.22, up about 0.56% in 24 hours. Recent volume has increased sharply, while price remains above key moving averages, giving the short-term chart a constructive technical structure.
🔑 Key Levels
- Support: $1.15
- Major Support: $1.11 → $1.06
- Resistance: $1.25 → $1.30
📊 Chart View
Holding above $1.15 keeps the current recovery structure intact. A sustained move above the $1.25–$1.30 resistance zone would indicate stronger upward momentum, while a move below $1.11 would weaken the setup.
👀 Simple View
Slightly bullish/constructive, but DOT remains sensitive to the broader crypto market. Bitcoin's movement can significantly affect altcoin momentum.
#DOT_UPDATE #bitcoin #BinanceLaunchesBinanceIntelligence
Polkadot (DOT) is trading around $1.22, up about 0.56% in 24 hours. Recent volume has increased sharply, while price remains above key moving averages, giving the short-term chart a constructive technical structure.
🔑 Key Levels
- Support: $1.15
- Major Support: $1.11 → $1.06
- Resistance: $1.25 → $1.30
📊 Chart View
Holding above $1.15 keeps the current recovery structure intact. A sustained move above the $1.25–$1.30 resistance zone would indicate stronger upward momentum, while a move below $1.11 would weaken the setup.
👀 Simple View
Slightly bullish/constructive, but DOT remains sensitive to the broader crypto market. Bitcoin's movement can significantly affect altcoin momentum.
#DOT_UPDATE #bitcoin #BinanceLaunchesBinanceIntelligence
1
202
$BTC
{spot}(BTCUSDT)
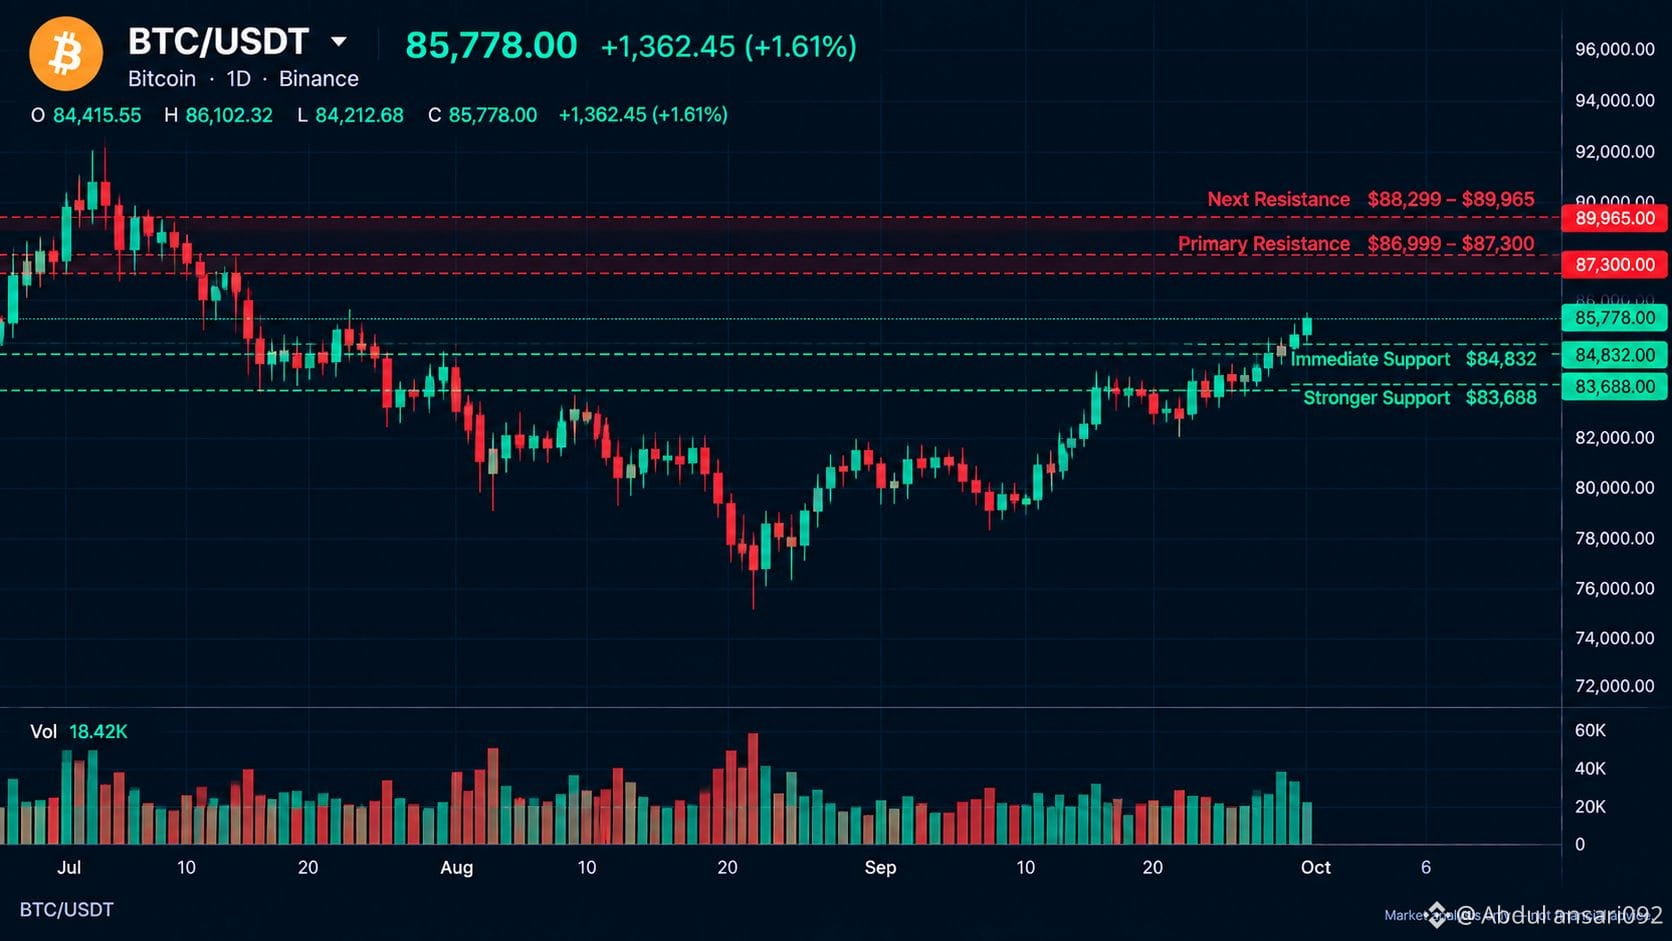
Bitcoin is trading around $85,300, with the daily technical picture showing a strong bullish bias. BTC is above its major moving averages, while RSI is around 62, indicating positive momentum.
🔑 Key Levels
- Support: $84,800
- Major Support: $83,750 → $82,360
- Resistance: $86,376
- Next Resistance: $87,353 → $88,692
📊 Chart View
BTC is holding above the $84,800 support zone. A daily close above $86,376 would strengthen the current bullish structure, while a break below $84,800 could weaken short-term momentum.
👀 Simple View
Bullish bias, but BTC is facing strong resistance around $86,400–$87,400, so volatility can remain high.
#BinanceSquareTalks #bitcoin #Analsis
$BTC
Bitcoin is trading around $85,300, with the daily technical picture showing a strong bullish bias. BTC is above its major moving averages, while RSI is around 62, indicating positive momentum.
🔑 Key Levels
- Support: $84,800
- Major Support: $83,750 → $82,360
- Resistance: $86,376
- Next Resistance: $87,353 → $88,692
📊 Chart View
BTC is holding above the $84,800 support zone. A daily close above $86,376 would strengthen the current bullish structure, while a break below $84,800 could weaken short-term momentum.
👀 Simple View
Bullish bias, but BTC is facing strong resistance around $86,400–$87,400, so volatility can remain high.
#BinanceSquareTalks #bitcoin #Analsis
Bitcoin is trading around $85,300, with the daily technical picture showing a strong bullish bias. BTC is above its major moving averages, while RSI is around 62, indicating positive momentum.
🔑 Key Levels
- Support: $84,800
- Major Support: $83,750 → $82,360
- Resistance: $86,376
- Next Resistance: $87,353 → $88,692
📊 Chart View
BTC is holding above the $84,800 support zone. A daily close above $86,376 would strengthen the current bullish structure, while a break below $84,800 could weaken short-term momentum.
👀 Simple View
Bullish bias, but BTC is facing strong resistance around $86,400–$87,400, so volatility can remain high.
#BinanceSquareTalks #bitcoin #Analsis
63
$BNB
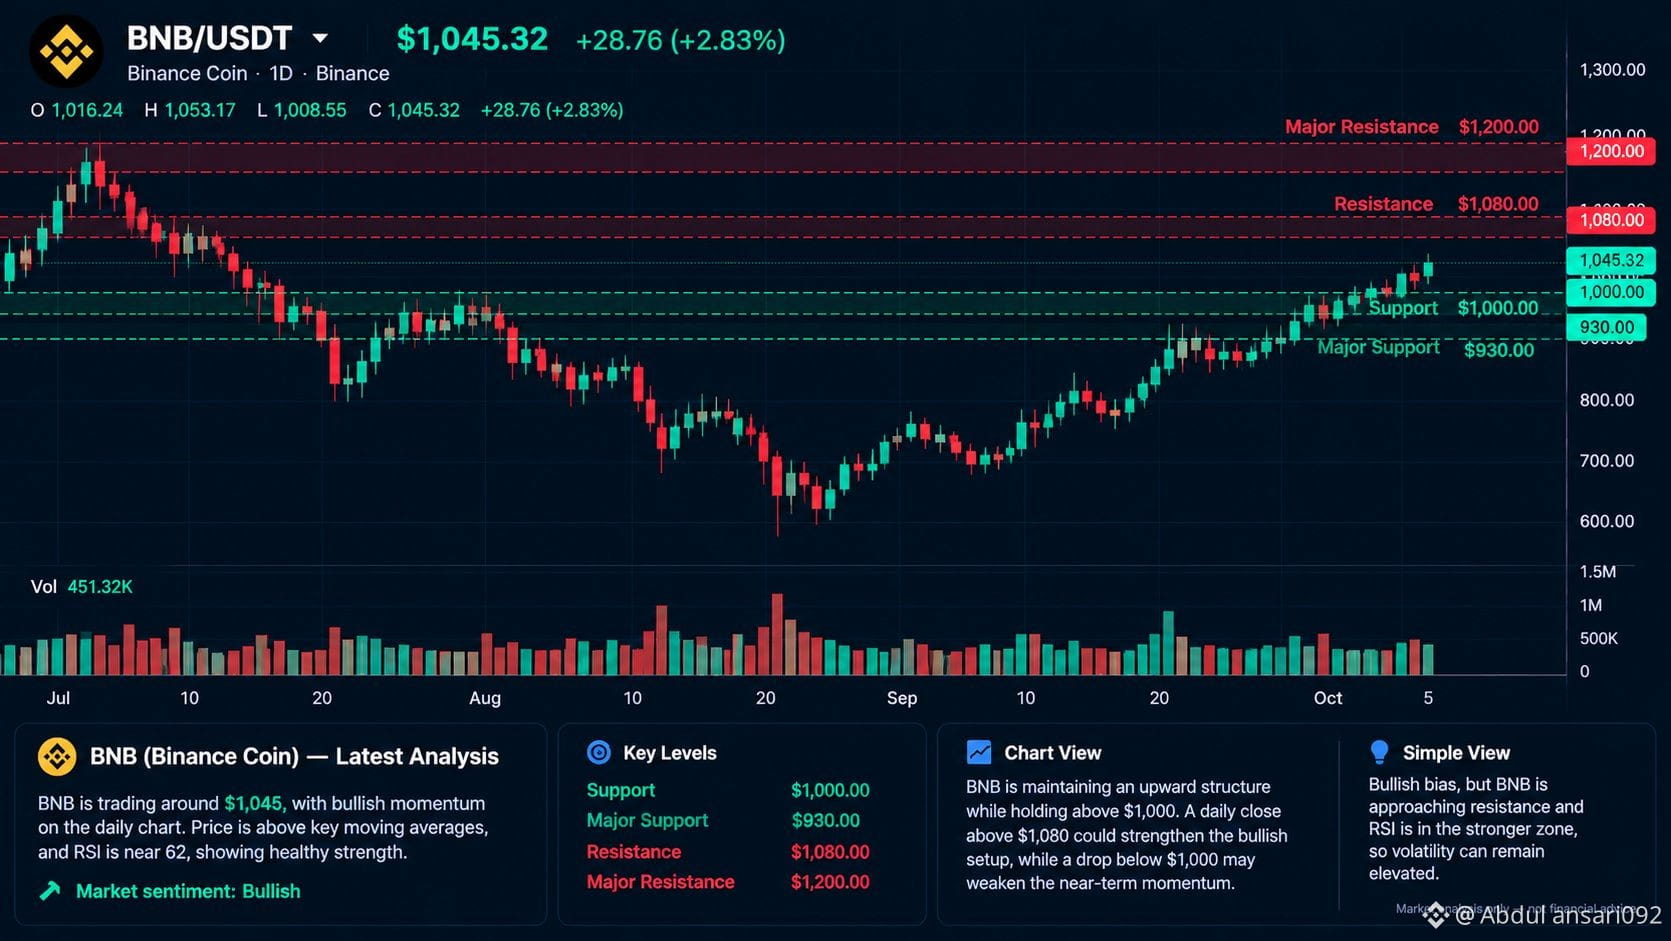
BNB remains in a daily uptrend, with 5 of 7 technical indicator groups showing bullish conditions. Momentum is strong, although MACD and some short-term oscillators are showing mixed signals.
🔑 Key Levels
- Support: $780 → $769
- Major Support: $755
- Resistance: $794 → $806
- Next Resistance: $820–$840
📊 Chart View
BNB is holding above $780, keeping the current bullish structure intact. A daily close above $793–$806 would strengthen the upside momentum, while a move below $780 could weaken the near-term setup.
👀 Simple View
Bullish bias, but volatility is high and momentum indicators are mixe
#ETHUp70%InQ3ButLiquidityFalls #EthStakingExitQueueHits2026High #FedOctoberHoldOdds82.3%
$BNB
BNB remains in a daily uptrend, with 5 of 7 technical indicator groups showing bullish conditions. Momentum is strong, although MACD and some short-term oscillators are showing mixed signals.
🔑 Key Levels
- Support: $780 → $769
- Major Support: $755
- Resistance: $794 → $806
- Next Resistance: $820–$840
📊 Chart View
BNB is holding above $780, keeping the current bullish structure intact. A daily close above $793–$806 would strengthen the upside momentum, while a move below $780 could weaken the near-term setup.
👀 Simple View
Bullish bias, but volatility is high and momentum indicators are mixe
#ETHUp70%InQ3ButLiquidityFalls #EthStakingExitQueueHits2026High #FedOctoberHoldOdds82.3%
BNB remains in a daily uptrend, with 5 of 7 technical indicator groups showing bullish conditions. Momentum is strong, although MACD and some short-term oscillators are showing mixed signals.
🔑 Key Levels
- Support: $780 → $769
- Major Support: $755
- Resistance: $794 → $806
- Next Resistance: $820–$840
📊 Chart View
BNB is holding above $780, keeping the current bullish structure intact. A daily close above $793–$806 would strengthen the upside momentum, while a move below $780 could weaken the near-term setup.
👀 Simple View
Bullish bias, but volatility is high and momentum indicators are mixe
#ETHUp70%InQ3ButLiquidityFalls #EthStakingExitQueueHits2026High #FedOctoberHoldOdds82.3%
103
$SOL
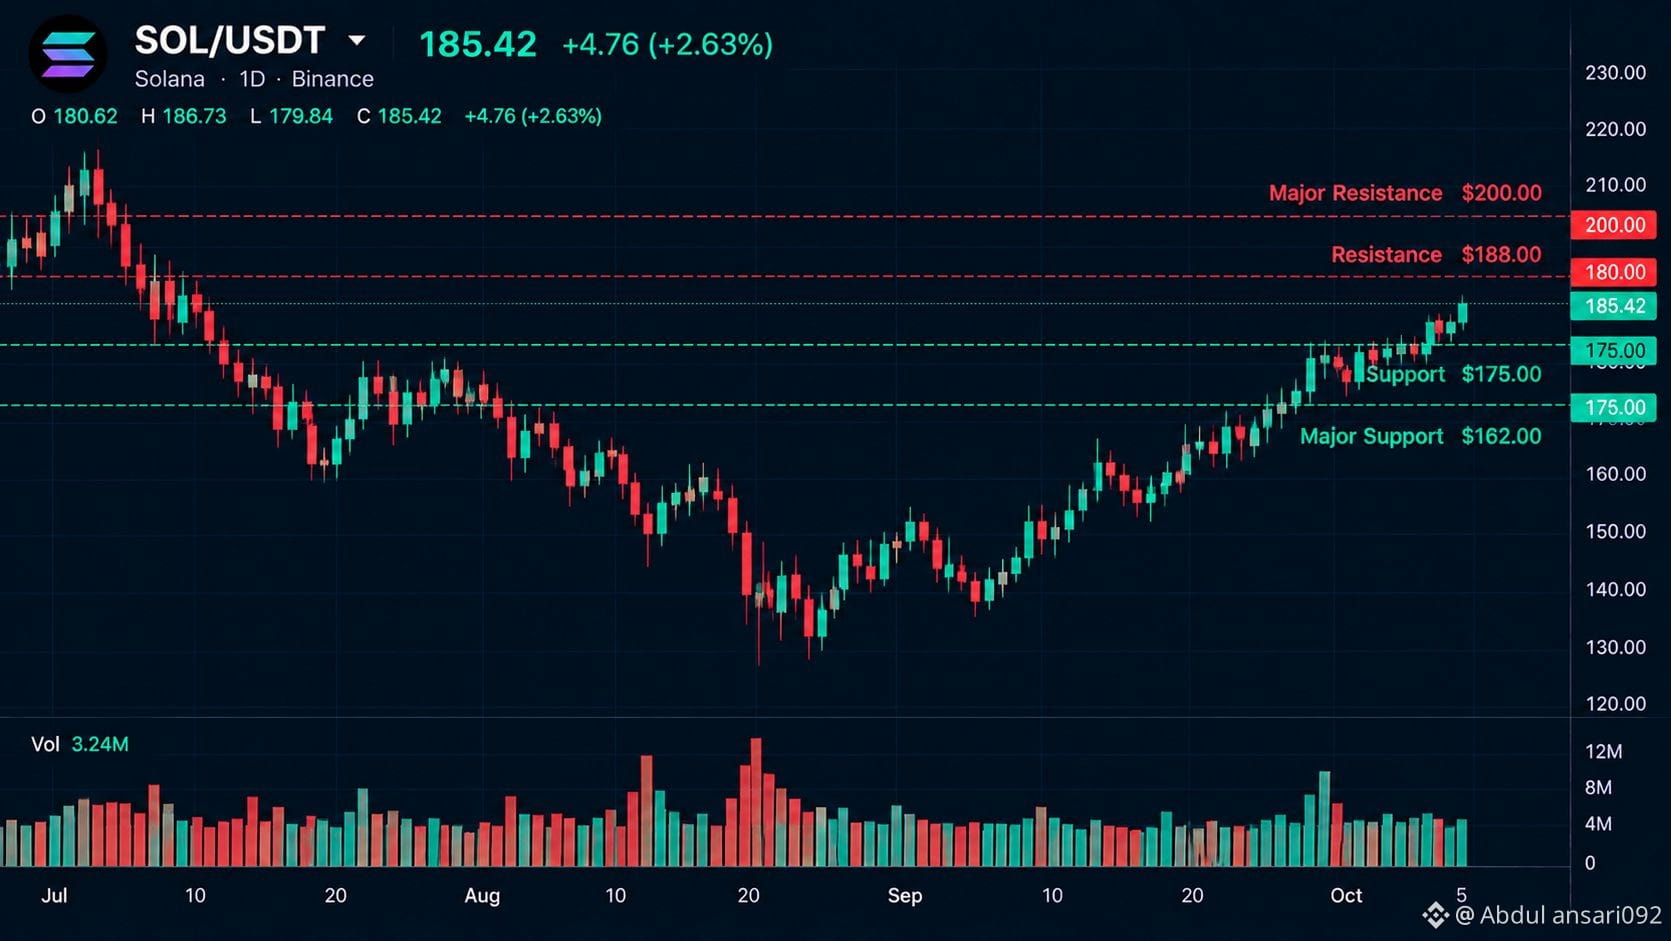
Solana is trading around $121. Daily technical indicators remain broadly bullish, with price above major moving averages and RSI around 66, showing strong momentum.
🔑 Key Levels
- Support: $120.64 → $117.84
- Major Support: $111.92
- Resistance: $123.81 → $126.57
- Major Resistance: $139.97
📊 Chart View
SOL is maintaining its upward structure while holding above $120.64. A daily close above $123.81 would strengthen the bullish setup, while a break below $120.64 could weaken near-term momentum.
👀 Simple View
Bullish bias, but SOL is nearing resistance and RSI is already in the stronger zone, so volatility can remain elevated.
#bitcoin #sol板块
{spot}(SOLUSDT)
$SOL
Solana is trading around $121. Daily technical indicators remain broadly bullish, with price above major moving averages and RSI around 66, showing strong momentum.
🔑 Key Levels
- Support: $120.64 → $117.84
- Major Support: $111.92
- Resistance: $123.81 → $126.57
- Major Resistance: $139.97
📊 Chart View
SOL is maintaining its upward structure while holding above $120.64. A daily close above $123.81 would strengthen the bullish setup, while a break below $120.64 could weaken near-term momentum.
👀 Simple View
Bullish bias, but SOL is nearing resistance and RSI is already in the stronger zone, so volatility can remain elevated.
#bitcoin #sol板块
Solana is trading around $121. Daily technical indicators remain broadly bullish, with price above major moving averages and RSI around 66, showing strong momentum.
🔑 Key Levels
- Support: $120.64 → $117.84
- Major Support: $111.92
- Resistance: $123.81 → $126.57
- Major Resistance: $139.97
📊 Chart View
SOL is maintaining its upward structure while holding above $120.64. A daily close above $123.81 would strengthen the bullish setup, while a break below $120.64 could weaken near-term momentum.
👀 Simple View
Bullish bias, but SOL is nearing resistance and RSI is already in the stronger zone, so volatility can remain elevated.
#bitcoin #sol板块
55
$ETH
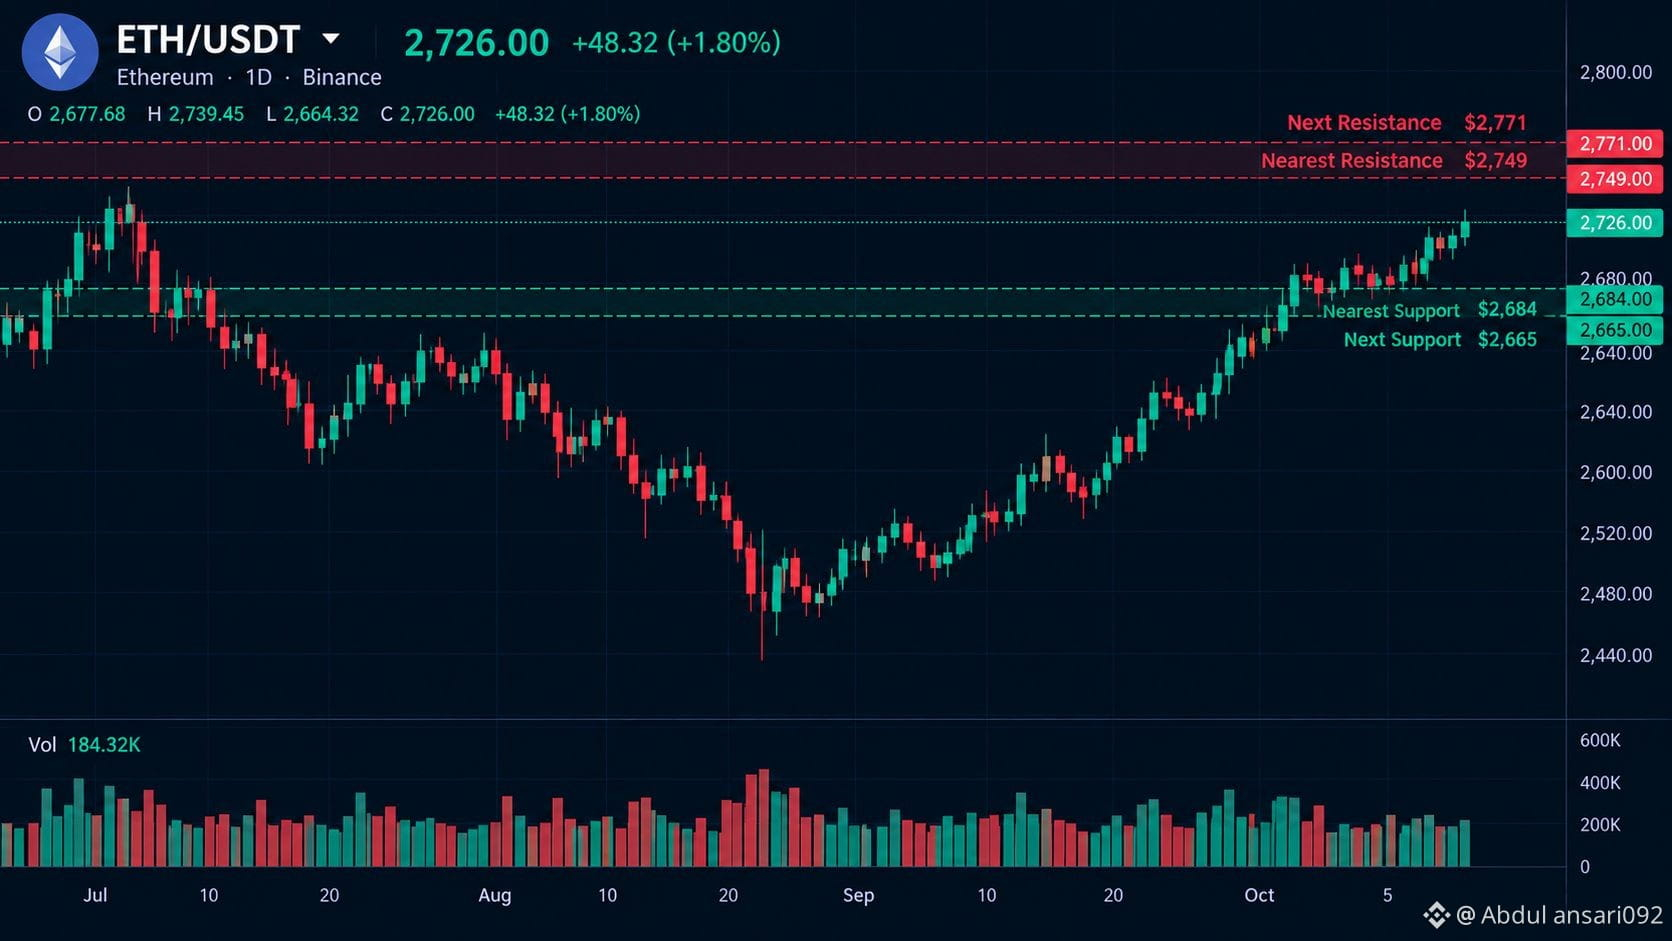
Ethereum is holding above key moving averages, and the daily technical structure remains bullish. Current technical readings show ETH near the $2,700 area, with RSI around 60–64, indicating positive momentum without being deeply overbought.
🔑 Key Levels
- Support: $2,684
- Major Support: $2,514
- Resistance: $2,749
- Next Resistance: $2,771–$2,800
📊 Chart View
ETH remains in an upward structure while holding above $2,684. A sustained move above $2,749 would strengthen the bullish setup, while a daily close below $2,684 could weaken the current structure.
👀 Simple View
Bullish bias, with $2,684 as the key nearby support and the $2,749–$2,800 zone acting as major resistance.
#BinanceSquareFamily #Ethereum #bitcoin
{spot}(ETHUSDT)
$ETH
Ethereum is holding above key moving averages, and the daily technical structure remains bullish. Current technical readings show ETH near the $2,700 area, with RSI around 60–64, indicating positive momentum without being deeply overbought.
🔑 Key Levels
- Support: $2,684
- Major Support: $2,514
- Resistance: $2,749
- Next Resistance: $2,771–$2,800
📊 Chart View
ETH remains in an upward structure while holding above $2,684. A sustained move above $2,749 would strengthen the bullish setup, while a daily close below $2,684 could weaken the current structure.
👀 Simple View
Bullish bias, with $2,684 as the key nearby support and the $2,749–$2,800 zone acting as major resistance.
#BinanceSquareFamily #Ethereum #bitcoin
Ethereum is holding above key moving averages, and the daily technical structure remains bullish. Current technical readings show ETH near the $2,700 area, with RSI around 60–64, indicating positive momentum without being deeply overbought.
🔑 Key Levels
- Support: $2,684
- Major Support: $2,514
- Resistance: $2,749
- Next Resistance: $2,771–$2,800
📊 Chart View
ETH remains in an upward structure while holding above $2,684. A sustained move above $2,749 would strengthen the bullish setup, while a daily close below $2,684 could weaken the current structure.
👀 Simple View
Bullish bias, with $2,684 as the key nearby support and the $2,749–$2,800 zone acting as major resistance.
#BinanceSquareFamily #Ethereum #bitcoin
60
$ADA
{spot}(ADAUSDT)
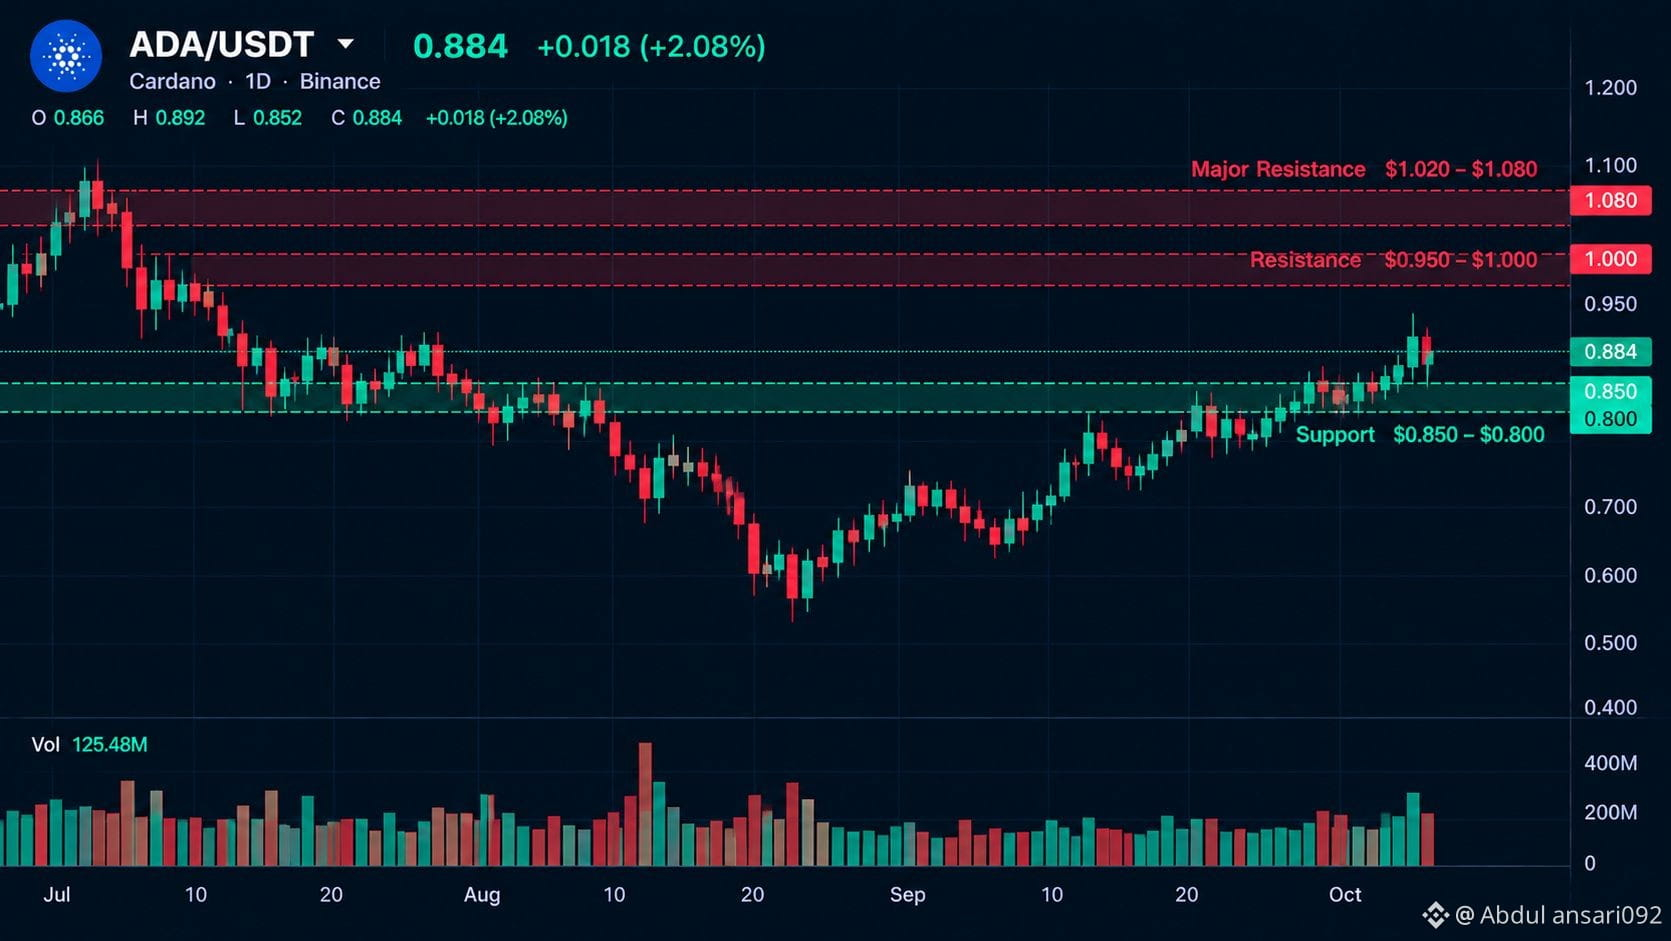
Cardano (ADA) is trading around $0.252, with technical indicators showing a strong bullish setup. Moving averages are currently giving strong-buy signals, while RSI is elevated, suggesting short-term momentum is strong but a pullback is possible.
🔑 Key Levels
- Support: $0.249 → $0.246
- Major Support: $0.242
- Resistance: $0.257 → $0.261
- Next Resistance: $0.264–$0.265
📊 Chart View
ADA is holding above its major moving averages, supporting the current bullish structure. A sustained move above $0.257–$0.261 could strengthen the upward momentum, while losing $0.246 would weaken the setup.
👀 Simple View
Bullish bias, but RSI is elevated, so volatility and short-term pullbacks remain possible.
#BinanceExplorers #bitcoin #Cardano
$ADA
Cardano (ADA) is trading around $0.252, with technical indicators showing a strong bullish setup. Moving averages are currently giving strong-buy signals, while RSI is elevated, suggesting short-term momentum is strong but a pullback is possible.
🔑 Key Levels
- Support: $0.249 → $0.246
- Major Support: $0.242
- Resistance: $0.257 → $0.261
- Next Resistance: $0.264–$0.265
📊 Chart View
ADA is holding above its major moving averages, supporting the current bullish structure. A sustained move above $0.257–$0.261 could strengthen the upward momentum, while losing $0.246 would weaken the setup.
👀 Simple View
Bullish bias, but RSI is elevated, so volatility and short-term pullbacks remain possible.
#BinanceExplorers #bitcoin #Cardano
Cardano (ADA) is trading around $0.252, with technical indicators showing a strong bullish setup. Moving averages are currently giving strong-buy signals, while RSI is elevated, suggesting short-term momentum is strong but a pullback is possible.
🔑 Key Levels
- Support: $0.249 → $0.246
- Major Support: $0.242
- Resistance: $0.257 → $0.261
- Next Resistance: $0.264–$0.265
📊 Chart View
ADA is holding above its major moving averages, supporting the current bullish structure. A sustained move above $0.257–$0.261 could strengthen the upward momentum, while losing $0.246 would weaken the setup.
👀 Simple View
Bullish bias, but RSI is elevated, so volatility and short-term pullbacks remain possible.
#BinanceExplorers #bitcoin #Cardano
147
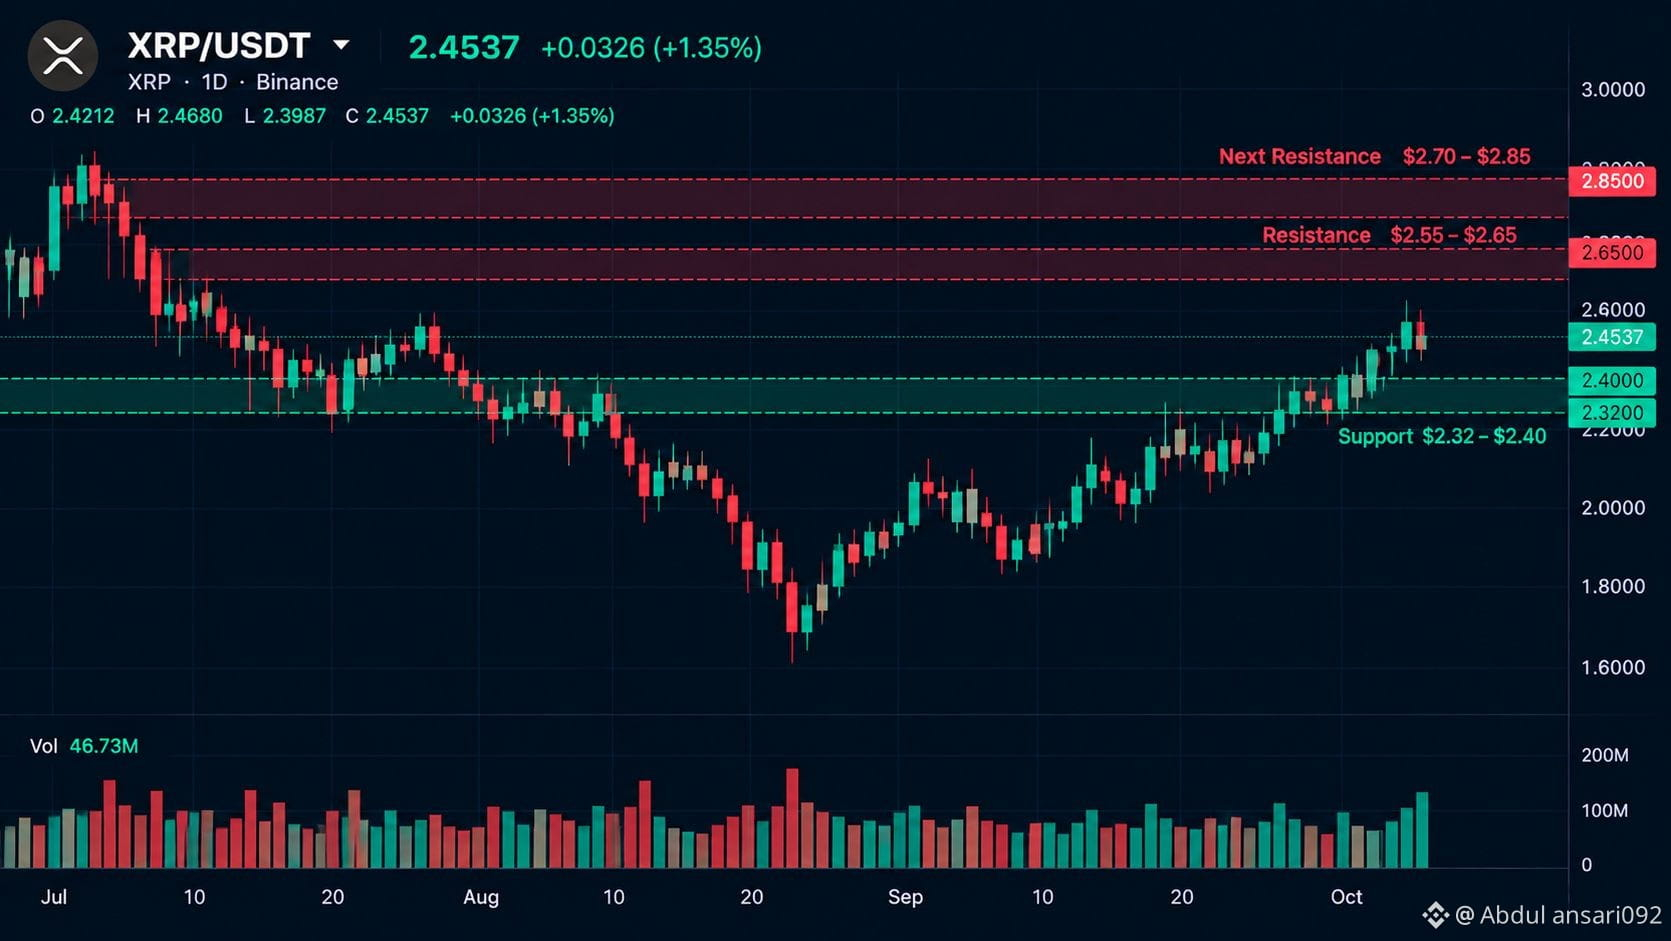
$XRP is trading around $1.50, with daily RSI near 57, indicating neutral-to-positive momentum.
Key Levels
- Support: $1.50 → $1.43
- Resistance: $1.57 → $1.62
- Major Resistance: $1.70
Chart View
XRP remains in an uptrend on the daily chart. A move above $1.57 could strengthen momentum, while losing $1.50 may weaken the setup.
Simple View: Bullish bias with $1.50 support and $1.57 resistance as the key levels.
#bitcoin.” #Binance #TradingCommunity
{spot}(XRPUSDT)
$XRP is trading around $1.50, with daily RSI near 57, indicating neutral-to-positive momentum.
Key Levels
- Support: $1.50 → $1.43
- Resistance: $1.57 → $1.62
- Major Resistance: $1.70
Chart View
XRP remains in an uptrend on the daily chart. A move above $1.57 could strengthen momentum, while losing $1.50 may weaken the setup.
Simple View: Bullish bias with $1.50 support and $1.57 resistance as the key levels.
#bitcoin.” #Binance #TradingCommunity
Key Levels
- Support: $1.50 → $1.43
- Resistance: $1.57 → $1.62
- Major Resistance: $1.70
Chart View
XRP remains in an uptrend on the daily chart. A move above $1.57 could strengthen momentum, while losing $1.50 may weaken the setup.
Simple View: Bullish bias with $1.50 support and $1.57 resistance as the key levels.
#bitcoin.” #Binance #TradingCommunity
84
{spot}(BTCUSDT)
$BTC
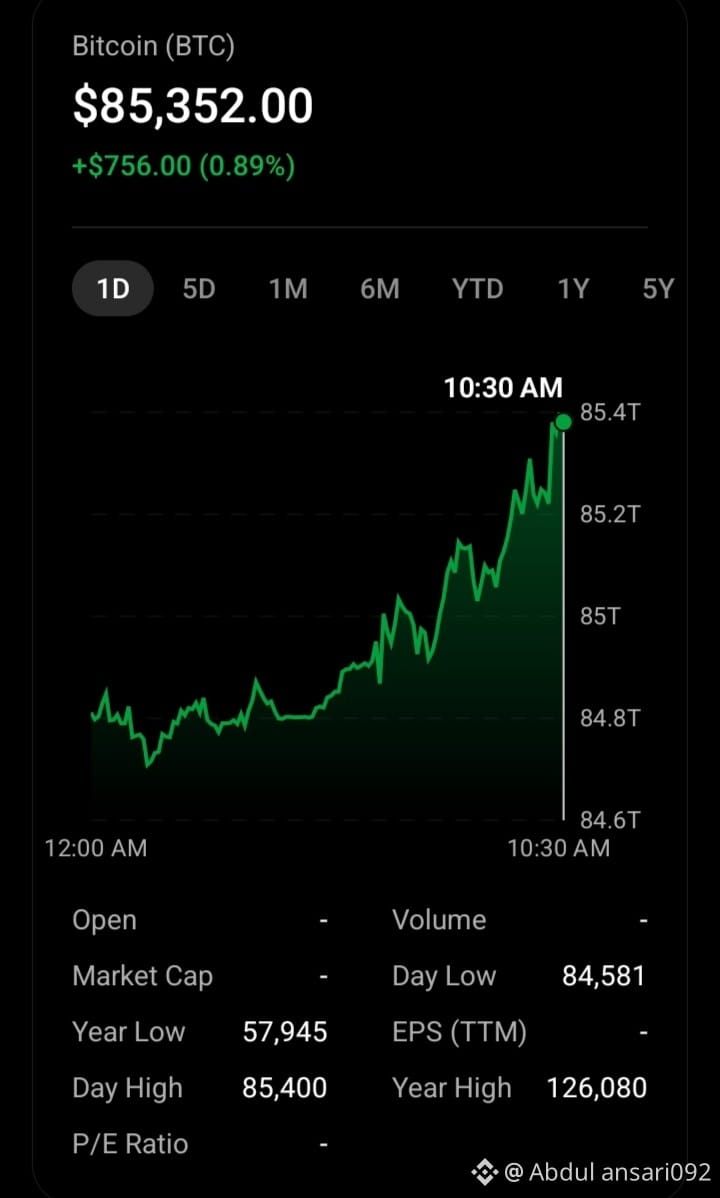
Current price: about $85.4K
24h move: about +0.9%
Intraday range: roughly $84.6K–$85.4K
In India, BTC is around ₹82 lakh; one current source reports +0.54% over 24 hours and a market cap around ₹164.7 lakh crore. �
The Economic Times
Recent technical analysis identifies $82.3K–$82.8K as an important support zone and around $84.5K as near-term resistance. �
CoinDCX
Longer-term forecasts are mixed: Citi recently raised its 12-month BTC forecast to $113,000, citing stronger crypto activity, macro conditions and renewed ETF inflows.
#BinanceSquareTalks #bitcoin
$BTC
Current price: about $85.4K
24h move: about +0.9%
Intraday range: roughly $84.6K–$85.4K
In India, BTC is around ₹82 lakh; one current source reports +0.54% over 24 hours and a market cap around ₹164.7 lakh crore. �
The Economic Times
Recent technical analysis identifies $82.3K–$82.8K as an important support zone and around $84.5K as near-term resistance. �
CoinDCX
Longer-term forecasts are mixed: Citi recently raised its 12-month BTC forecast to $113,000, citing stronger crypto activity, macro conditions and renewed ETF inflows.
#BinanceSquareTalks #bitcoin
Current price: about $85.4K
24h move: about +0.9%
Intraday range: roughly $84.6K–$85.4K
In India, BTC is around ₹82 lakh; one current source reports +0.54% over 24 hours and a market cap around ₹164.7 lakh crore. �
The Economic Times
Recent technical analysis identifies $82.3K–$82.8K as an important support zone and around $84.5K as near-term resistance. �
CoinDCX
Longer-term forecasts are mixed: Citi recently raised its 12-month BTC forecast to $113,000, citing stronger crypto activity, macro conditions and renewed ETF inflows.
#BinanceSquareTalks #bitcoin
90
Log in to explore more content
Join global crypto users on Binance Square
⚡️ Get latest and useful information about crypto.
💬 Trusted by the world’s largest crypto exchange.
👍 Discover real insights from verified creators.
Email / Phone number
Trending Topics
CanBTCReboundAfterFallingBelow60K?
317,836 views
1,334 Discussing
Bitcoin News | Bitcoin Falls Below $60,000 for the First Time Since July as IBIT Posts Record $541 Million Outflow
Binance News
·49 Likes
·95.1k views
GlobalStocksFaceLongestLosingStreakSince2023
102,662 views
958 Discussing
BlackRockIBITPostsRecord$541MSingleDayOutflow
4 views
2 Discussing