
倾听视野
3.2k Posts

倾听视野
 Square Verified+
不卷嘴炮,只卷信息差。老韭8年,从来不盲猜,只看趋势。跟我一起,别走错方向。
400 Following
41.8K+ Followers
26.7K+ Liked
Posts
All
Quotes
Videos
Live
Verified
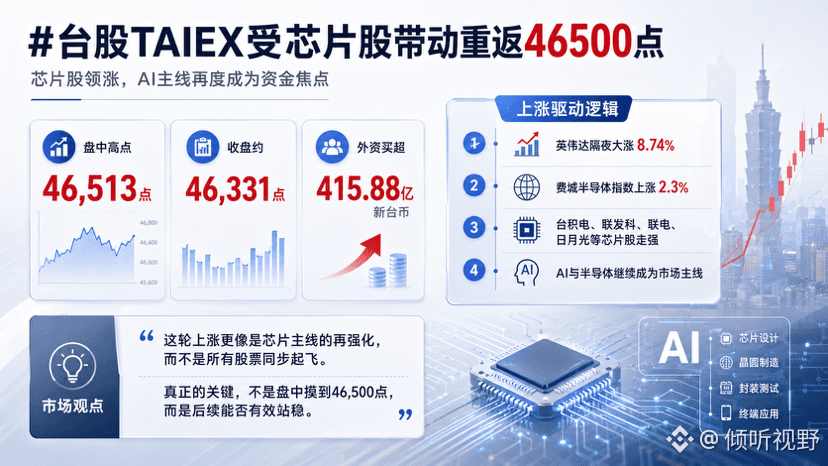
#台股TAIEX受芯片股带动重返46500点
The more I look at this move in the Taiwan stock market, the more it seems that what people call a “bull market for the benchmark index” is increasingly looking like a “chip-stock rally.”
Today, the TAIEX opened and surged upward, even touching 46,513 during the session before quickly reclaiming and holding above the 46,500 level. On the surface, the index looks strong again, but if you break down the market action, it’s very clear: it’s still the usual suspects in AI and semiconductors leading the charge.
Last night, Nvidia jumped 8.74%, and the Philadelphia Semiconductor Index also rose 2.3%. After that sentiment spread to Asia, it showed up very directly here. In Taiwan, MediaTek, United Microelectronics, Delta Electronics, and ASE all strengthened together, and TSMC also pushed up to 2,440 yuan in the early trading. Especially noteworthy is that UMC drove a volume-backed advance to hit limit-up. This kind of tape action is basically telling you: investors may talk about valuation and bubbles all they want, but in the end, real money still flows into chips.
Even more extreme, today foreign investors bought more than NT$41.5 billion.
So what I think is most worth paying attention to right now isn’t whether the Taiwan market can make new highs—it’s that the market is forming a very clear path dependency. As long as Nvidia doesn’t break down and the AI capex logic doesn’t fail, investors’ first reaction will still be to come back and buy Taiwan’s semiconductor supply chain.
But there’s a problem here.
The higher the index goes, the less you can just look at the numbers and feel good. Above 46,000 points is no longer a place where you can make money just by blindly buying with your eyes closed. The fact that chip stocks lifted the index beautifully doesn’t mean every single stock has the same fundamentals. What you’re seeing today is investors clustering together; if sentiment flips tomorrow, the places where they are bundled the tightest could also end up getting punished the hardest.
Personally, I’m more willing to interpret this phase as: the main theme of AI has again proven that it isn’t dead—and for now, the market still can’t find any alternative with more room for growth in capacity and earnings imagination.
Taiwan stocks do have risks.
It’s just that in the current stage, semiconductors remain the clearest answer that makes investors open their wallets to cast their votes.
What to watch next is whether 46,500 points can move from “touched intraday” to “actually holds steady” in a sustained way.
#TAIEX #台积电 #半导体 #英伟达
The more I look at this move in the Taiwan stock market, the more it seems that what people call a “bull market for the benchmark index” is increasingly looking like a “chip-stock rally.”
Today, the TAIEX opened and surged upward, even touching 46,513 during the session before quickly reclaiming and holding above the 46,500 level. On the surface, the index looks strong again, but if you break down the market action, it’s very clear: it’s still the usual suspects in AI and semiconductors leading the charge.
Last night, Nvidia jumped 8.74%, and the Philadelphia Semiconductor Index also rose 2.3%. After that sentiment spread to Asia, it showed up very directly here. In Taiwan, MediaTek, United Microelectronics, Delta Electronics, and ASE all strengthened together, and TSMC also pushed up to 2,440 yuan in the early trading. Especially noteworthy is that UMC drove a volume-backed advance to hit limit-up. This kind of tape action is basically telling you: investors may talk about valuation and bubbles all they want, but in the end, real money still flows into chips.
Even more extreme, today foreign investors bought more than NT$41.5 billion.
So what I think is most worth paying attention to right now isn’t whether the Taiwan market can make new highs—it’s that the market is forming a very clear path dependency. As long as Nvidia doesn’t break down and the AI capex logic doesn’t fail, investors’ first reaction will still be to come back and buy Taiwan’s semiconductor supply chain.
But there’s a problem here.
The higher the index goes, the less you can just look at the numbers and feel good. Above 46,000 points is no longer a place where you can make money just by blindly buying with your eyes closed. The fact that chip stocks lifted the index beautifully doesn’t mean every single stock has the same fundamentals. What you’re seeing today is investors clustering together; if sentiment flips tomorrow, the places where they are bundled the tightest could also end up getting punished the hardest.
Personally, I’m more willing to interpret this phase as: the main theme of AI has again proven that it isn’t dead—and for now, the market still can’t find any alternative with more room for growth in capacity and earnings imagination.
Taiwan stocks do have risks.
It’s just that in the current stage, semiconductors remain the clearest answer that makes investors open their wallets to cast their votes.
What to watch next is whether 46,500 points can move from “touched intraday” to “actually holds steady” in a sustained way.
#TAIEX #台积电 #半导体 #英伟达
Verified
#英伟达开盘140分钟成交335亿美元
This isn’t a single stock anymore—it’s the “AI casino” of global capital.
Honestly, seeing this data, my first reaction is: Wall Street’s current frenzy over Nvidia may be even more extreme than we imagined.
On August 27, just 2 hours and 20 minutes after the market opened—i.e., 140 minutes—Nvidia’s trading volume reached $33.5 billion, already exceeding its usual full day’s trading levels. (cls.cn)
What does $33.5 billion even mean?
In yuan terms, it’s over a few hundred billion—within 140 minutes, people were wildly switching hands around a single company.
And the fuse behind it is also very direct: the earnings report again beat expectations.
Nvidia’s Q2 revenue hit $96.22 billion, and its data center revenue surged to $89 billion, up 117% year over year. The company also forecast next-quarter revenue at around $108 billion and provided a stunning outlook: sales growth of about 70% for the next fiscal year. (reuters.com)
The result: the market voted with money.
That day, Nvidia’s stock jumped 8.7%, adding roughly $441.5 billion to its market cap, which surged to around $5.49 trillion. (marketwatch.com)
But I think the most worth discussing here isn’t whether Nvidia can still go up.
It’s that the entire U.S. stock-market AI trade is increasingly starting to answer one question:
Where does the money in AI ultimately end up?
OpenAI, Meta, Google, Amazon—they’re all burning cash to build computing power. But as long as capital expenditures keep rising, Nvidia is like the person selling shovels right at the entrance of the gold rush.
While everyone else argues about who can build the strongest AI, Nvidia first sells the GPUs.
So, in plain terms, the $33.5 billion in trading volume means the market is signaling with real money: people may doubt the AI bubble, but for now, they still don’t dare to easily leave Nvidia.
Of course, after such a big surge, I wouldn’t tell everyone to blindly chase.
The more an asset becomes watched by the whole public, the scarier the expectations get. Once a future quarter delivers only “excellent” instead of “absurd,” the valuation will still get cut without anyone being polite.
But at least for now, Nvidia has once again proven one thing:
Whether there’s a bubble in AI can keep being debated—but for this era, the most expensive entry ticket is still computing power.
#英伟达开盘140分钟成交335亿美元 #英伟达 #NVIDIA #AI $NVDA.US
This isn’t a single stock anymore—it’s the “AI casino” of global capital.
Honestly, seeing this data, my first reaction is: Wall Street’s current frenzy over Nvidia may be even more extreme than we imagined.
On August 27, just 2 hours and 20 minutes after the market opened—i.e., 140 minutes—Nvidia’s trading volume reached $33.5 billion, already exceeding its usual full day’s trading levels. (cls.cn)
What does $33.5 billion even mean?
In yuan terms, it’s over a few hundred billion—within 140 minutes, people were wildly switching hands around a single company.
And the fuse behind it is also very direct: the earnings report again beat expectations.
Nvidia’s Q2 revenue hit $96.22 billion, and its data center revenue surged to $89 billion, up 117% year over year. The company also forecast next-quarter revenue at around $108 billion and provided a stunning outlook: sales growth of about 70% for the next fiscal year. (reuters.com)
The result: the market voted with money.
That day, Nvidia’s stock jumped 8.7%, adding roughly $441.5 billion to its market cap, which surged to around $5.49 trillion. (marketwatch.com)
But I think the most worth discussing here isn’t whether Nvidia can still go up.
It’s that the entire U.S. stock-market AI trade is increasingly starting to answer one question:
Where does the money in AI ultimately end up?
OpenAI, Meta, Google, Amazon—they’re all burning cash to build computing power. But as long as capital expenditures keep rising, Nvidia is like the person selling shovels right at the entrance of the gold rush.
While everyone else argues about who can build the strongest AI, Nvidia first sells the GPUs.
So, in plain terms, the $33.5 billion in trading volume means the market is signaling with real money: people may doubt the AI bubble, but for now, they still don’t dare to easily leave Nvidia.
Of course, after such a big surge, I wouldn’t tell everyone to blindly chase.
The more an asset becomes watched by the whole public, the scarier the expectations get. Once a future quarter delivers only “excellent” instead of “absurd,” the valuation will still get cut without anyone being polite.
But at least for now, Nvidia has once again proven one thing:
Whether there’s a bubble in AI can keep being debated—but for this era, the most expensive entry ticket is still computing power.
#英伟达开盘140分钟成交335亿美元 #英伟达 #NVIDIA #AI $NVDA.US

NVDAUS-4.48%
Verified
#黄金8月上涨约14% |Those who say the gold bull market is over have been taught a lesson again this month
If you at the beginning of this month felt that gold has already stopped rising, then this August candlestick is probably a bit uncomfortable to watch.
As of August 28, spot gold is still trading around $4,600 per ounce. The total gain for August is about 14%, and on Monday it even briefly touched a near three-month high.
What’s the most unbelievable part?
This rally hasn’t been built on the comfortable script of a “mad rush to cut rates by the Fed.” On the contrary, U.S. inflation pressure is still there, and the market is even pricing in the possibility of continued rate hikes toward the end of the year. In normal textbook logic, the higher the interest rates, the harder it is for non-yielding assets like gold. But gold, against this headwind, has still risen 14%.
So I think the real thing driving gold higher this month isn’t “rate-cut expectations.” It’s that people’s sense of safety in money itself is declining.
U.S. fiscal and debt pressures, concerns about the dollar’s purchasing power, and on top of that, geopolitics has never truly settled down—more and more capital is starting to figure out one thing: gold has no interest, that’s true, but it also has no default risk from anyone.
More importantly, ETF inflows are back, and central bank buying remains in place. This means that buying gold now isn’t just for hedging; there’s also a significant amount of medium- to long-term allocation capital.
Of course, after a consecutive month of gains of 14%, I actually wouldn’t recommend blindly charging in just because you see a big bullish candle.
Above $4,600 is no longer a cheap entry point. If a pullback of 5%, or even deeper, shows up in the short term, I wouldn’t be surprised at all.
But I also won’t turn bearish lightly just because it has gone up a lot.
The truly strong assets are never those that rise every day. It’s those times when everyone thinks it’s ridiculously expensive and is getting ready to laugh—yet somehow, someone underneath is always stepping in with real money.
That’s what’s most terrifying about gold right now.
Before, we talked about whether “gold can it still rise.”
Now I want to ask something else:
When a gold that pays no interest can rise 14% in a month, is the market buying gold— or is it giving the dollar and the credit system a vote of no confidence?
#黄金8月上涨约14% $XAU #黄金 #贵金属 #宏观市场
If you at the beginning of this month felt that gold has already stopped rising, then this August candlestick is probably a bit uncomfortable to watch.
As of August 28, spot gold is still trading around $4,600 per ounce. The total gain for August is about 14%, and on Monday it even briefly touched a near three-month high.
What’s the most unbelievable part?
This rally hasn’t been built on the comfortable script of a “mad rush to cut rates by the Fed.” On the contrary, U.S. inflation pressure is still there, and the market is even pricing in the possibility of continued rate hikes toward the end of the year. In normal textbook logic, the higher the interest rates, the harder it is for non-yielding assets like gold. But gold, against this headwind, has still risen 14%.
So I think the real thing driving gold higher this month isn’t “rate-cut expectations.” It’s that people’s sense of safety in money itself is declining.
U.S. fiscal and debt pressures, concerns about the dollar’s purchasing power, and on top of that, geopolitics has never truly settled down—more and more capital is starting to figure out one thing: gold has no interest, that’s true, but it also has no default risk from anyone.
More importantly, ETF inflows are back, and central bank buying remains in place. This means that buying gold now isn’t just for hedging; there’s also a significant amount of medium- to long-term allocation capital.
Of course, after a consecutive month of gains of 14%, I actually wouldn’t recommend blindly charging in just because you see a big bullish candle.
Above $4,600 is no longer a cheap entry point. If a pullback of 5%, or even deeper, shows up in the short term, I wouldn’t be surprised at all.
But I also won’t turn bearish lightly just because it has gone up a lot.
The truly strong assets are never those that rise every day. It’s those times when everyone thinks it’s ridiculously expensive and is getting ready to laugh—yet somehow, someone underneath is always stepping in with real money.
That’s what’s most terrifying about gold right now.
Before, we talked about whether “gold can it still rise.”
Now I want to ask something else:
When a gold that pays no interest can rise 14% in a month, is the market buying gold— or is it giving the dollar and the credit system a vote of no confidence?
#黄金8月上涨约14% $XAU #黄金 #贵金属 #宏观市场

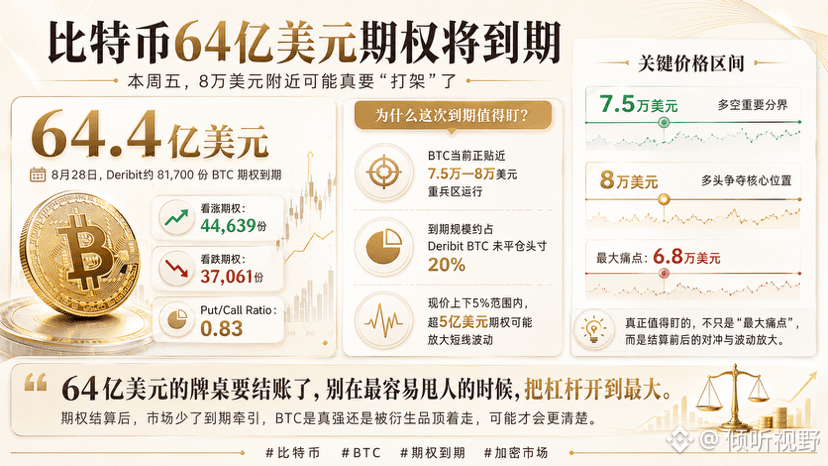
#比特币64亿美元期权将到期 |This Friday, around $80 million it may really “come to blows”
If over the past couple of days you find that BTC has been grinding repeatedly around $78,000–$80,000, don’t rush to blame the big players—this level was never likely to stay quiet.
On August 28, the last Friday of this month, Deribit will have about 81,700 BTC options contracts expiring, with a notional value of roughly $6.44 billion. Of these, there are 44,639 call options and 37,061 put options, with a Put/Call Ratio of about 0.83—overall positioning is clearly more tilted long. More importantly, $75,000 and $80,000 are exactly the two densest areas for call open interest, with around $236 million and $157 million in calls pinned there, respectively.
I think the most worth noting is that Bitcoin is currently just skimming along the options “weighting battle zone.”
And this expiry batch is about 20% of Deribit’s open BTC positions. Within a ±5% range around the current price, there is still more than $500 million worth of options notional value. What does that mean? The closer you get to settlement, the more market makers are likely to keep adjusting their spot and futures hedges to control risk. When price moves even slightly, the hedging orders push the market to keep moving.
So instead, I feel that especially after $BTC —just surged from around $62,000 all the way to $80,000— in a strong-trend market, trying to mechanically guess the price using Max Pain is very likely to get “educated” by the market.
My view is simple:
If $80,000 holds, longs will feel more comfortable; if $75,000 is lost, short-term volatility could be amplified noticeably.
The truly interesting timing, though, is actually after options settlement. Once the burden of multi-billion-dollar positions comes off and the market has less “expiration-driven” pressure, whether BTC is truly strong or being pushed along by derivatives may become clearer.
Here’s my only reminder: the options table worth $6.4 billion is due for settlement—don’t crank leverage to the maximum at the easiest moment to get shaken off.
#比特币64亿美元期权将到期 #BTC #bitcoin #加密货币
If over the past couple of days you find that BTC has been grinding repeatedly around $78,000–$80,000, don’t rush to blame the big players—this level was never likely to stay quiet.
On August 28, the last Friday of this month, Deribit will have about 81,700 BTC options contracts expiring, with a notional value of roughly $6.44 billion. Of these, there are 44,639 call options and 37,061 put options, with a Put/Call Ratio of about 0.83—overall positioning is clearly more tilted long. More importantly, $75,000 and $80,000 are exactly the two densest areas for call open interest, with around $236 million and $157 million in calls pinned there, respectively.
I think the most worth noting is that Bitcoin is currently just skimming along the options “weighting battle zone.”
And this expiry batch is about 20% of Deribit’s open BTC positions. Within a ±5% range around the current price, there is still more than $500 million worth of options notional value. What does that mean? The closer you get to settlement, the more market makers are likely to keep adjusting their spot and futures hedges to control risk. When price moves even slightly, the hedging orders push the market to keep moving.
So instead, I feel that especially after $BTC —just surged from around $62,000 all the way to $80,000— in a strong-trend market, trying to mechanically guess the price using Max Pain is very likely to get “educated” by the market.
My view is simple:
If $80,000 holds, longs will feel more comfortable; if $75,000 is lost, short-term volatility could be amplified noticeably.
The truly interesting timing, though, is actually after options settlement. Once the burden of multi-billion-dollar positions comes off and the market has less “expiration-driven” pressure, whether BTC is truly strong or being pushed along by derivatives may become clearer.
Here’s my only reminder: the options table worth $6.4 billion is due for settlement—don’t crank leverage to the maximum at the easiest moment to get shaken off.
#比特币64亿美元期权将到期 #BTC #bitcoin #加密货币
Partly True
The oil price keeps dropping, and I actually feel the market is releasing a very important signal.
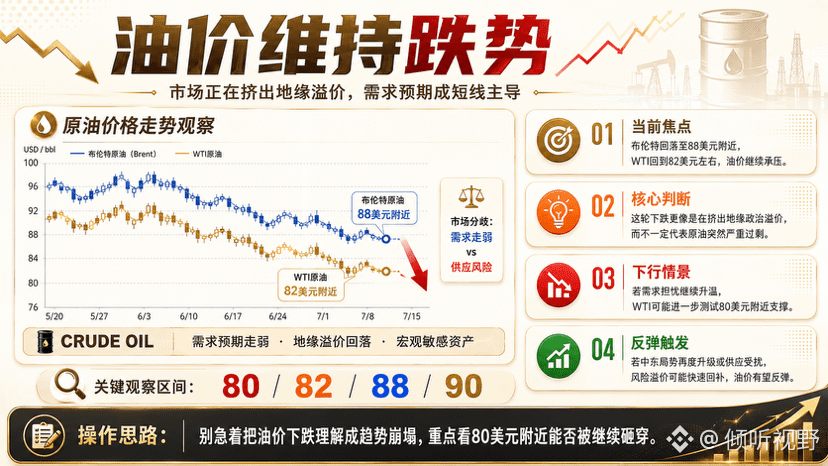
Brent crude is now down to around $88, and WTI has also returned to about $82. The single-day decline once exceeded 4%, and both have fallen back to near two-week lows.
To be honest, the most interesting part of the recent oil price movement isn’t “how much it’s falling.” It’s that previously, whenever there were Middle East developments, prices would surge. This time, the market doesn’t seem to be buying that story.
The U.S. continues to ramp up sanctions on Iran. In normal logic, when news like that comes out, oil prices should first print a big bullish candle. But this time it’s the opposite: investors are more willing to trade the prospect of easing tensions and progress on diplomatic talks. Put simply, the market isn’t betting on whether “supplies will be cut tomorrow,” but on whether “the worst has already passed.”
That said, I don’t think investors should get too optimistic either.
In its latest report, the IEA expects that global oil demand in 2026 could fall by about 1.6 million barrels per day, with demand expectations clearly weakening. But on the other hand, global inventories are dropping quickly: in July, oil inventories fell by roughly 69 million barrels. And supply uncertainty in the Middle East remains significant.
So oil prices right now are pretty conflicted:
On one side, the economy and demand are hitting the brakes, pushing oil prices down;
On the other side, supply risks from the Middle East, Russia, and transportation routes have not truly disappeared—they could still push prices back up at any time.
Personally, I’m more inclined to believe this round of declines first wiped out the geopolitical premium, rather than reflecting a sudden emergence of serious oil oversupply.
These two concepts are very different.
If later the Middle East situation continues to cool off and WTI retests $80—or even lower—I wouldn’t be surprised at all. But as long as the Strait of Hormuz has another surprise event beyond expectations, the risk premium that’s been squeezed out could also return within days.
So when oil prices fall, I won’t just call it “an energy bear market has arrived.”
What’s really worth watching is this: once oil hits around $80, will investors still be willing to keep selling it down?
If they can drive it lower, it suggests demand issues are starting to take over the pricing. If they can’t, then this move might just be the market unwinding the war premium back out.
How oil prices move from here will have knock-on effects on inflation, Fed expectations, gold, U.S. stocks, and even the crypto market.
#油价维持跌势 $XAUT #美股 #币圈
Brent crude is now down to around $88, and WTI has also returned to about $82. The single-day decline once exceeded 4%, and both have fallen back to near two-week lows.
To be honest, the most interesting part of the recent oil price movement isn’t “how much it’s falling.” It’s that previously, whenever there were Middle East developments, prices would surge. This time, the market doesn’t seem to be buying that story.
The U.S. continues to ramp up sanctions on Iran. In normal logic, when news like that comes out, oil prices should first print a big bullish candle. But this time it’s the opposite: investors are more willing to trade the prospect of easing tensions and progress on diplomatic talks. Put simply, the market isn’t betting on whether “supplies will be cut tomorrow,” but on whether “the worst has already passed.”
That said, I don’t think investors should get too optimistic either.
In its latest report, the IEA expects that global oil demand in 2026 could fall by about 1.6 million barrels per day, with demand expectations clearly weakening. But on the other hand, global inventories are dropping quickly: in July, oil inventories fell by roughly 69 million barrels. And supply uncertainty in the Middle East remains significant.
So oil prices right now are pretty conflicted:
On one side, the economy and demand are hitting the brakes, pushing oil prices down;
On the other side, supply risks from the Middle East, Russia, and transportation routes have not truly disappeared—they could still push prices back up at any time.
Personally, I’m more inclined to believe this round of declines first wiped out the geopolitical premium, rather than reflecting a sudden emergence of serious oil oversupply.
These two concepts are very different.
If later the Middle East situation continues to cool off and WTI retests $80—or even lower—I wouldn’t be surprised at all. But as long as the Strait of Hormuz has another surprise event beyond expectations, the risk premium that’s been squeezed out could also return within days.
So when oil prices fall, I won’t just call it “an energy bear market has arrived.”
What’s really worth watching is this: once oil hits around $80, will investors still be willing to keep selling it down?
If they can drive it lower, it suggests demand issues are starting to take over the pricing. If they can’t, then this move might just be the market unwinding the war premium back out.
How oil prices move from here will have knock-on effects on inflation, Fed expectations, gold, U.S. stocks, and even the crypto market.
#油价维持跌势 $XAUT #美股 #币圈
Verified
Gold sends another signal after being bought by China: 56 tonnes—it's not just “buying gold”
When I saw the data for Hong Kong’s net gold exports to the mainland in July—56.193 tonnes—my first reaction wasn’t “gold is about to rise again.” Instead, it was: after all this time of high gold prices stirring things up, China’s interest in gold capital still hasn’t faded.
The net export volume in July increased by about 11% compared with June’s 50.679 tonnes. Year-on-year, it rose from 43.923 tonnes in July last year—an increase of nearly 28%. This change is definitely worth thinking about. After all, gold prices are no longer “cheap,” yet we can still see noticeable physical gold inflows at this level. That suggests a portion of the funds buying gold are no longer solely betting on short-term price moves.
Even more interesting is that jewelry consumption doesn’t appear to have taken off significantly. Market analysis instead believes that investment demand—such as for gold bars and coins—may be the main driver. China’s gold ETFs also continued to see net inflows in July, with holdings rising by about 5 tonnes to 282 tonnes.
In plain terms, I think gold is going through a very clear shift: in the past, people bought gold because they feared inflation and crises. Now, more and more people are buying gold because they’re starting to question whether keeping cash “sitting idle for the long term” is actually safe.
Of course, 56.193 tonnes is only the net flow into the mainland through Hong Kong, and it doesn’t represent China’s total gold imports. Channels like Shanghai and Beijing aren’t included. So please don’t see one figure and start shouting “gold is about to take off.”
But one point I’m becoming increasingly sure about: gold’s biggest backing isn’t a piece of good news suddenly appearing on some particular day—it’s that when prices drop, there really are people who step in and take it.
As long as physical demand, ETF capital, and official reserve demand don’t show a clear retreat, it will be hard for gold to be judged by the old logic of “if it rises too much, it must collapse.”
Sometimes, the real big trend isn’t something everyone chases out of frenzy—it’s a group of people who complain that it’s too expensive, yet never stop buying.
#香港7月对内地黄金净出口56.193吨 $XAUT #黄金
When I saw the data for Hong Kong’s net gold exports to the mainland in July—56.193 tonnes—my first reaction wasn’t “gold is about to rise again.” Instead, it was: after all this time of high gold prices stirring things up, China’s interest in gold capital still hasn’t faded.
The net export volume in July increased by about 11% compared with June’s 50.679 tonnes. Year-on-year, it rose from 43.923 tonnes in July last year—an increase of nearly 28%. This change is definitely worth thinking about. After all, gold prices are no longer “cheap,” yet we can still see noticeable physical gold inflows at this level. That suggests a portion of the funds buying gold are no longer solely betting on short-term price moves.
Even more interesting is that jewelry consumption doesn’t appear to have taken off significantly. Market analysis instead believes that investment demand—such as for gold bars and coins—may be the main driver. China’s gold ETFs also continued to see net inflows in July, with holdings rising by about 5 tonnes to 282 tonnes.
In plain terms, I think gold is going through a very clear shift: in the past, people bought gold because they feared inflation and crises. Now, more and more people are buying gold because they’re starting to question whether keeping cash “sitting idle for the long term” is actually safe.
Of course, 56.193 tonnes is only the net flow into the mainland through Hong Kong, and it doesn’t represent China’s total gold imports. Channels like Shanghai and Beijing aren’t included. So please don’t see one figure and start shouting “gold is about to take off.”
But one point I’m becoming increasingly sure about: gold’s biggest backing isn’t a piece of good news suddenly appearing on some particular day—it’s that when prices drop, there really are people who step in and take it.
As long as physical demand, ETF capital, and official reserve demand don’t show a clear retreat, it will be hard for gold to be judged by the old logic of “if it rises too much, it must collapse.”
Sometimes, the real big trend isn’t something everyone chases out of frenzy—it’s a group of people who complain that it’s too expensive, yet never stop buying.
#香港7月对内地黄金净出口56.193吨 $XAUT #黄金

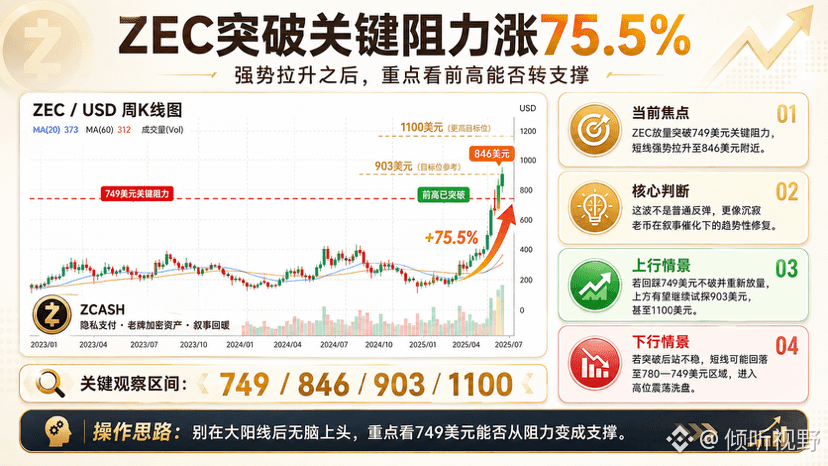
#ZEC突破关键阻力涨75.5% To be honest, this ZEC move left me stunned for a second.
Up 75.5% in a week, the price surged to around $846 and at the same time swept last November’s previous high at $749 underfoot. When many people see this kind of candlestick, their first reaction is: “Can you still chase it?” But I think the most important thing now isn’t excitement—it’s to move your hand off the buy button for two seconds first.
Because $ZEC isn’t a typical rebound this time. It has truly broken through a key resistance that’s been pressing down for a long time. What’s even more interesting is that Grayscale is still pushing Zcash Trust toward conversion into an ETF, and the related registration filings have already been submitted to the SEC. Clearly, the market is trading these things together: the privacy-coin narrative, ETF expectations, and a Bitcoin-driven altcoin rebound. Once money finds the story, old coins can go absolutely crazy—no slower than #MEME .
But the problem is exactly here: 75.5% isn’t a small gain. It’s pushing a whole stretch of expectations directly into the price. Now the weekly RSI is already near 70. The first target zone ahead is roughly $903; above that is around $1100. That means, of course there’s still upside—but if you rush in now, the odds are completely different from a week ago.
Personally, I’d rather watch two spots.
First, can that prior high at $749 turn from “resistance” into “support”? If it pulls back and doesn’t break, and then moves higher on increased volume, this wouldn’t be just a burst of sentiment—it could realistically keep trending.
Second, around $900, can it break through in one decisive move? If it spikes and then rolls over, it wouldn’t be surprising at all to see short-term profit-taking come crashing down.
The most torturous thing in crypto is this: when it hasn’t risen, nobody wants it; after it jumps 75%, everyone suddenly starts studying the fundamentals.
So for this ZEC move, I admit it’s very strong—but I won’t lose my mind just because of one massive green candle. The truly comfortable opportunity is never rushing in to “relay” after you see others cashing out—it’s waiting for the market to prove “strength” to you.
#zec is worth keeping an eye on now, but don’t confuse FOMO with judgment.
Up 75.5% in a week, the price surged to around $846 and at the same time swept last November’s previous high at $749 underfoot. When many people see this kind of candlestick, their first reaction is: “Can you still chase it?” But I think the most important thing now isn’t excitement—it’s to move your hand off the buy button for two seconds first.
Because $ZEC isn’t a typical rebound this time. It has truly broken through a key resistance that’s been pressing down for a long time. What’s even more interesting is that Grayscale is still pushing Zcash Trust toward conversion into an ETF, and the related registration filings have already been submitted to the SEC. Clearly, the market is trading these things together: the privacy-coin narrative, ETF expectations, and a Bitcoin-driven altcoin rebound. Once money finds the story, old coins can go absolutely crazy—no slower than #MEME .
But the problem is exactly here: 75.5% isn’t a small gain. It’s pushing a whole stretch of expectations directly into the price. Now the weekly RSI is already near 70. The first target zone ahead is roughly $903; above that is around $1100. That means, of course there’s still upside—but if you rush in now, the odds are completely different from a week ago.
Personally, I’d rather watch two spots.
First, can that prior high at $749 turn from “resistance” into “support”? If it pulls back and doesn’t break, and then moves higher on increased volume, this wouldn’t be just a burst of sentiment—it could realistically keep trending.
Second, around $900, can it break through in one decisive move? If it spikes and then rolls over, it wouldn’t be surprising at all to see short-term profit-taking come crashing down.
The most torturous thing in crypto is this: when it hasn’t risen, nobody wants it; after it jumps 75%, everyone suddenly starts studying the fundamentals.
So for this ZEC move, I admit it’s very strong—but I won’t lose my mind just because of one massive green candle. The truly comfortable opportunity is never rushing in to “relay” after you see others cashing out—it’s waiting for the market to prove “strength” to you.
#zec is worth keeping an eye on now, but don’t confuse FOMO with judgment.
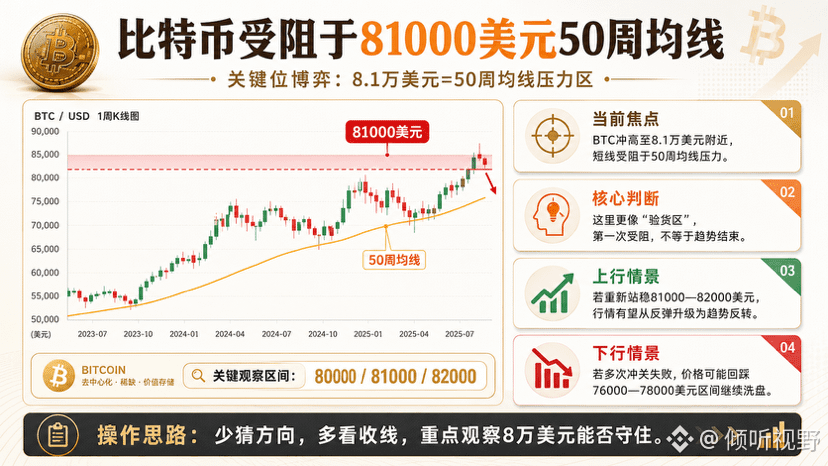
#比特币受阻于81000美元50周均线
This wave #比特币 was pulled from low levels all the way to above $80,000—it's definitely moved hard. But the real tough part is only just starting to get chewed into.
$BTC hit a high around $81,265 yesterday, then was quickly pushed back down. Coincidentally, the current 50-week moving average is sitting right near $81,000. In effect, the market has run straight into a “bull-bear boundary wall.”
Personally, I don’t think there’s any need to panic if it gets smashed down from here.
In the prior week it rose more than 20%. The shorts were repeatedly squeezed out, and there are naturally a lot of short-term profit-takers near the key moving-average levels, so it’s normal that selling shows up right there. What really needs attention isn’t that $81.0k didn’t break through on the first try, but whether subsequent repeated attempts can hold steady—and if it eventually can’t even defend $80,000.
Now I’d rather treat the $80,000–$82,000 range as an “inspection zone.”
If, next, $BTC can get back above $81,000–$82,000, and it doesn’t just poke down with a quick wick and immediately fall, but instead truly closes above on both the daily and weekly charts—then the situation would be completely different. Because at the level of the 50-week moving average, it’s not about volatility of a few hundred dollars; it’s about whether the market has the credentials to upgrade from a “oversold rebound” into a “trend reversal.” Historical stats also show that in completed bear-market cycles, after #BTC recaptured the 50-week moving average, it often had already moved past the worst phase.
Even more importantly, this rally isn’t just retail investors shouting “bull market.” U.S. spot Bitcoin ETF flows have clearly started returning. Last week alone saw net inflows of about $1.9 billion, which indicates institutional money has genuinely started entering again.
So I’m just an observer. I think $81k is the exam.
If it holds, the prior upside may have only been warm-up; if it doesn’t hold and it retraces to wash the market once through $76,000–$78,000, I wouldn’t be surprised at all.
In crypto, people are most easily fooled in two ways: those who get scared of missing the bus right after things pump, and those who call for a bear market right after things drop.
At this point, don’t over-guess—watch how it closes. #BTC走势分析
This wave #比特币 was pulled from low levels all the way to above $80,000—it's definitely moved hard. But the real tough part is only just starting to get chewed into.
$BTC hit a high around $81,265 yesterday, then was quickly pushed back down. Coincidentally, the current 50-week moving average is sitting right near $81,000. In effect, the market has run straight into a “bull-bear boundary wall.”
Personally, I don’t think there’s any need to panic if it gets smashed down from here.
In the prior week it rose more than 20%. The shorts were repeatedly squeezed out, and there are naturally a lot of short-term profit-takers near the key moving-average levels, so it’s normal that selling shows up right there. What really needs attention isn’t that $81.0k didn’t break through on the first try, but whether subsequent repeated attempts can hold steady—and if it eventually can’t even defend $80,000.
Now I’d rather treat the $80,000–$82,000 range as an “inspection zone.”
If, next, $BTC can get back above $81,000–$82,000, and it doesn’t just poke down with a quick wick and immediately fall, but instead truly closes above on both the daily and weekly charts—then the situation would be completely different. Because at the level of the 50-week moving average, it’s not about volatility of a few hundred dollars; it’s about whether the market has the credentials to upgrade from a “oversold rebound” into a “trend reversal.” Historical stats also show that in completed bear-market cycles, after #BTC recaptured the 50-week moving average, it often had already moved past the worst phase.
Even more importantly, this rally isn’t just retail investors shouting “bull market.” U.S. spot Bitcoin ETF flows have clearly started returning. Last week alone saw net inflows of about $1.9 billion, which indicates institutional money has genuinely started entering again.
So I’m just an observer. I think $81k is the exam.
If it holds, the prior upside may have only been warm-up; if it doesn’t hold and it retraces to wash the market once through $76,000–$78,000, I wouldn’t be surprised at all.
In crypto, people are most easily fooled in two ways: those who get scared of missing the bus right after things pump, and those who call for a bear market right after things drop.
At this point, don’t over-guess—watch how it closes. #BTC走势分析
Verified
#黄金触及4700美元结束六个月回调
I think this candlestick is more meaningful than the number 4700.
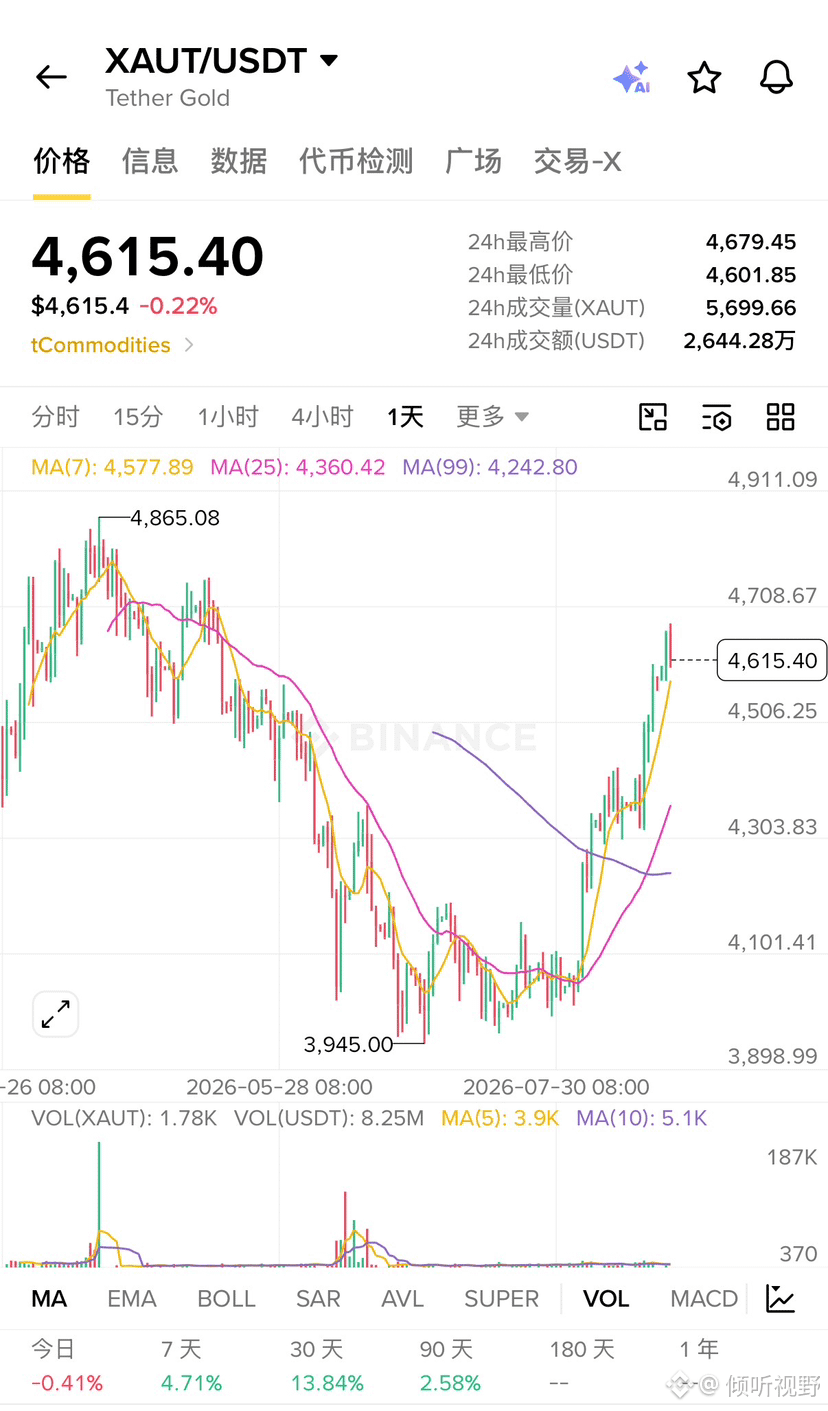
Let me make it clear first: what broke through the $4700 level this time is the COMEX December gold futures. Spot gold is currently around $4625, and after pushing higher it saw profit-taking. Don’t look at how much it has pulled back now—gold’s structure for this leg has already changed completely compared with a month ago.
Starting from the January historical high of about $5598, #黄金 spent a full roughly 26 weeks adjusting, with the low once dipping to around $3945. Now, the weekly chart has regained a key trend line, and the daily chart has also moved back above the 200-day moving average. Technically, this half-year-long downward structure has basically been broken.
Even more bullish is the flows: last week, gold ETFs saw net inflows of 46.7 tons—about $6.4 billion—marking the largest single-week inflow in 10 months. U.S. debt, a weaker dollar, and unease in the long-end bond market have reignited the logic of “why big money is buying gold” again.
I’m actually not in a rush to call for 5000 right now.
Around 4700 is the first hard resistance. True strength isn’t just tagging 4700—it’s being able to pull back and still hold. As long as it doesn’t fall back below $4500, I’d rather interpret this move as: gold isn’t a simple rebound, but a re-entry into the uptrend.
After the half-year correction ends, the next act is just beginning.
$XAUT #黄金etf
I think this candlestick is more meaningful than the number 4700.
Let me make it clear first: what broke through the $4700 level this time is the COMEX December gold futures. Spot gold is currently around $4625, and after pushing higher it saw profit-taking. Don’t look at how much it has pulled back now—gold’s structure for this leg has already changed completely compared with a month ago.
Starting from the January historical high of about $5598, #黄金 spent a full roughly 26 weeks adjusting, with the low once dipping to around $3945. Now, the weekly chart has regained a key trend line, and the daily chart has also moved back above the 200-day moving average. Technically, this half-year-long downward structure has basically been broken.
Even more bullish is the flows: last week, gold ETFs saw net inflows of 46.7 tons—about $6.4 billion—marking the largest single-week inflow in 10 months. U.S. debt, a weaker dollar, and unease in the long-end bond market have reignited the logic of “why big money is buying gold” again.
I’m actually not in a rush to call for 5000 right now.
Around 4700 is the first hard resistance. True strength isn’t just tagging 4700—it’s being able to pull back and still hold. As long as it doesn’t fall back below $4500, I’d rather interpret this move as: gold isn’t a simple rebound, but a re-entry into the uptrend.
After the half-year correction ends, the next act is just beginning.
$XAUT #黄金etf

#BTC触及80000美元
80000, I finally let #比特币 get a touch.
But now I’m not as excited as I was a few days ago.
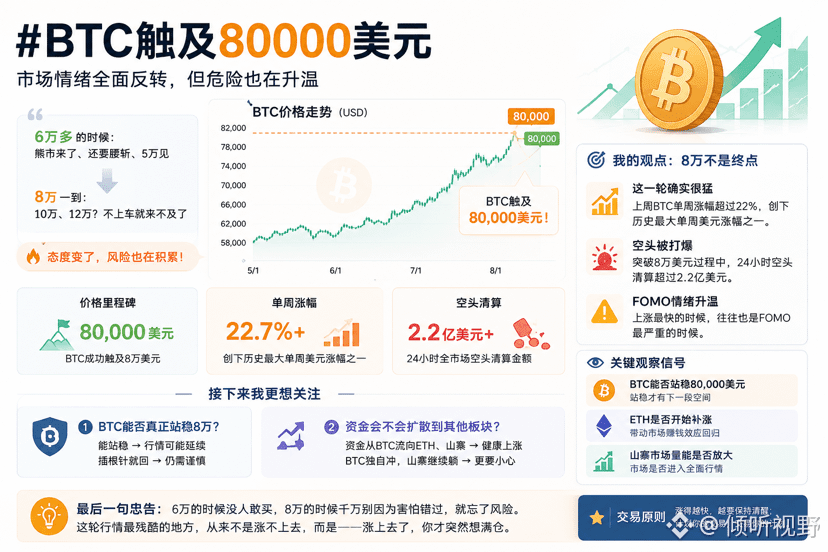
The reason is simple: $BTC went from over 60,000 all the way to 80,000. What has really changed isn’t just the price—everyone’s attitude has changed too.
Back when it was over 60,000, the market was full of “the bear market is coming,” “it will be cut in half again,” and “50,000 is the target.”
Now that it hits 80,000, people start shouting 100,000, 120,000—and even thinking, “if you don’t get on, you’ll miss it in time.”
That’s exactly what I’m most wary about.
This leg really is fierce. Last week, BTC’s weekly gain exceeded 22%, one of the largest single-week U.S.-dollar percentage jumps on record. And during the push toward 80,000 today, it also blew up a large number of shorts immediately—total short liquidations in 24 hours already exceed $220 million.
But don’t forget:
When price rises the fastest, that’s often when FOMO is at its worst.
Personally, I won’t suddenly become blindly bullish just because it breaks 80,000.
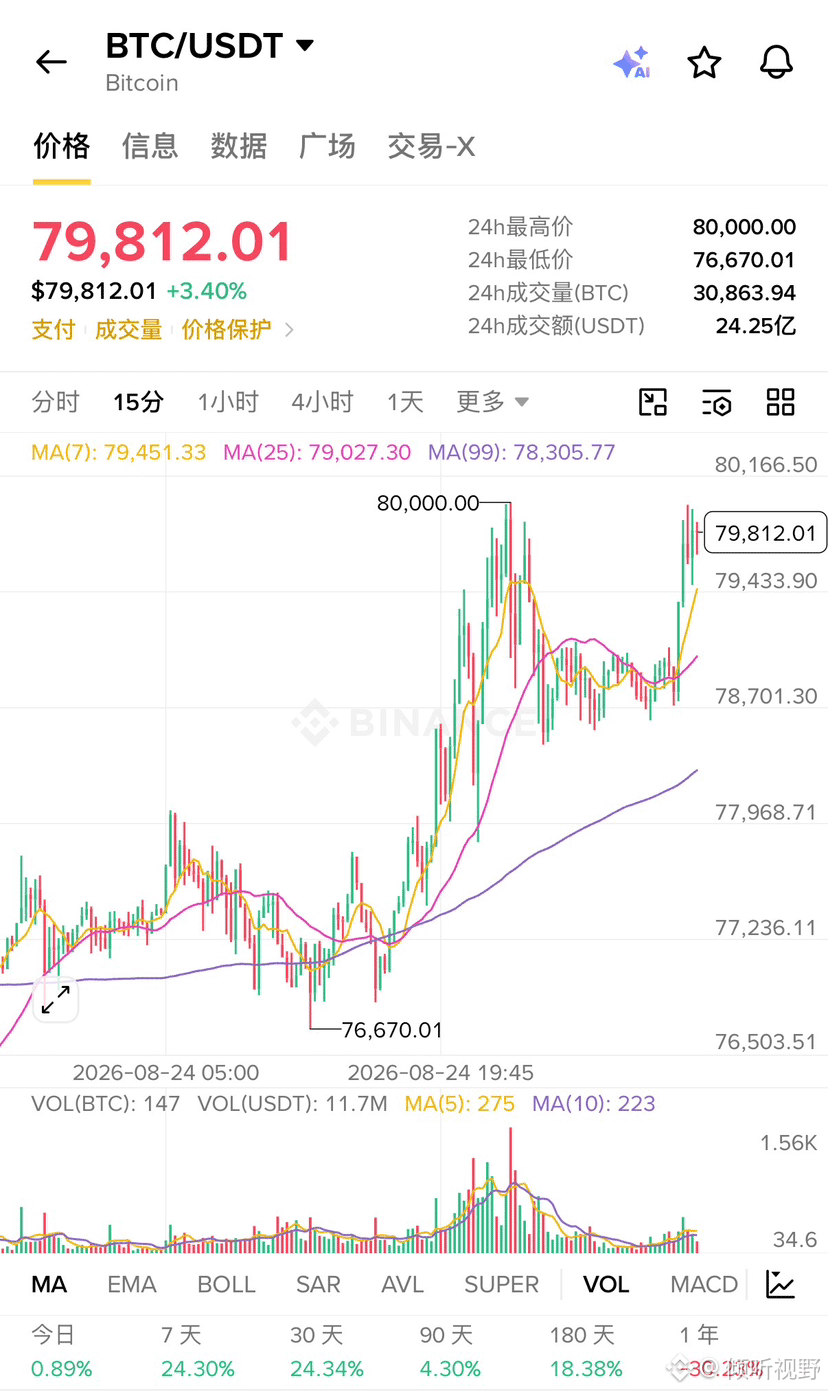
Next, I want to see two things: first, whether BTC can truly hold above 80,000—not just stab through it and come back down; second, whether capital starts to move from BTC into ETH and altcoins.
If 80,000 holds and ETH and the altcoins follow, then the market will truly feel comfortable.
If #BTC charges up on its own and the altcoins keep lying dormant, then I’d actually be even more cautious.
So my personal view is very simple now:
When it was at 60,000, no one dared to buy. When it’s at 80,000, don’t, out of fear of missing out, forget about risk.
The cruelest part of this rally has never been that it didn’t go up.
It’s that—once it goes up, you suddenly feel like going all-in.#比特币周涨23.6%
80000, I finally let #比特币 get a touch.
But now I’m not as excited as I was a few days ago.
The reason is simple: $BTC went from over 60,000 all the way to 80,000. What has really changed isn’t just the price—everyone’s attitude has changed too.
Back when it was over 60,000, the market was full of “the bear market is coming,” “it will be cut in half again,” and “50,000 is the target.”
Now that it hits 80,000, people start shouting 100,000, 120,000—and even thinking, “if you don’t get on, you’ll miss it in time.”
That’s exactly what I’m most wary about.
This leg really is fierce. Last week, BTC’s weekly gain exceeded 22%, one of the largest single-week U.S.-dollar percentage jumps on record. And during the push toward 80,000 today, it also blew up a large number of shorts immediately—total short liquidations in 24 hours already exceed $220 million.
But don’t forget:
When price rises the fastest, that’s often when FOMO is at its worst.
Personally, I won’t suddenly become blindly bullish just because it breaks 80,000.
Next, I want to see two things: first, whether BTC can truly hold above 80,000—not just stab through it and come back down; second, whether capital starts to move from BTC into ETH and altcoins.
If 80,000 holds and ETH and the altcoins follow, then the market will truly feel comfortable.
If #BTC charges up on its own and the altcoins keep lying dormant, then I’d actually be even more cautious.
So my personal view is very simple now:
When it was at 60,000, no one dared to buy. When it’s at 80,000, don’t, out of fear of missing out, forget about risk.
The cruelest part of this rally has never been that it didn’t go up.
It’s that—once it goes up, you suddenly feel like going all-in.#比特币周涨23.6%
I feel that the “big regulatory era” for stablecoins may only be just beginning.
BPI and The Clearing House have submitted their latest comments to FinCEN: the customer identity verification requirements for stablecoins should not only focus on issuers’ issuance and redemptions, but should further clarify coverage of intermediary institutions in the secondary market.
In plain terms—going forward, regulators want to be able to see more clearly who is using stablecoins and who they’re transacting through.
I think this matter’s impact is actually very significant.
Previously, stablecoin regulation focused on: whether there are sufficient assets behind $USDT and $USDC , and whether issuers are compliant; now the logic is clearly moving one layer deeper:
Coin compliance isn’t enough anymore—the people using and circulating the coin also need to become increasingly transparent.
If this approach is ultimately implemented, exchanges, custodians, wallet service providers, and even certain DeFi entry points may face heavier KYC/AML compliance pressure.
For ordinary players, in the short term, some people will definitely find it troublesome—possibly even feeling that “on-chain activity is becoming less like on-chain.”
But from my perspective, this actually indicates one thing:
The U.S. is not preparing to eliminate stablecoins—it’s working to truly integrate stablecoins into the financial system.
What’s most worth being wary of has never been regulation arriving.
It’s what happens after regulation arrives—who can stay, and who will get cleared out.
The next battle for stablecoins may not be about issuing volume anymore, but about compliance gateways and financial discourse power.
#BPI吁FinCEN扩大稳定币身份识别至二级市场 #稳定币
BPI and The Clearing House have submitted their latest comments to FinCEN: the customer identity verification requirements for stablecoins should not only focus on issuers’ issuance and redemptions, but should further clarify coverage of intermediary institutions in the secondary market.
In plain terms—going forward, regulators want to be able to see more clearly who is using stablecoins and who they’re transacting through.
I think this matter’s impact is actually very significant.
Previously, stablecoin regulation focused on: whether there are sufficient assets behind $USDT and $USDC , and whether issuers are compliant; now the logic is clearly moving one layer deeper:
Coin compliance isn’t enough anymore—the people using and circulating the coin also need to become increasingly transparent.
If this approach is ultimately implemented, exchanges, custodians, wallet service providers, and even certain DeFi entry points may face heavier KYC/AML compliance pressure.
For ordinary players, in the short term, some people will definitely find it troublesome—possibly even feeling that “on-chain activity is becoming less like on-chain.”
But from my perspective, this actually indicates one thing:
The U.S. is not preparing to eliminate stablecoins—it’s working to truly integrate stablecoins into the financial system.
What’s most worth being wary of has never been regulation arriving.
It’s what happens after regulation arrives—who can stay, and who will get cleared out.
The next battle for stablecoins may not be about issuing volume anymore, but about compliance gateways and financial discourse power.
#BPI吁FinCEN扩大稳定币身份识别至二级市场 #稳定币

#英伟达AI服务器涨价超15%
With this AI wave, it may really be entering an era of “compute power inflation.”
According to the latest reports, the price of servers equipped with NVIDIA AI chips is expected to rise by more than 15%. Some of the price increases will start to show up in devices shipping in early 2027. High-end AI systems such as the Vera Rubin and Grace Blackwell could also be affected.
The reason behind the price hikes is also pretty straightforward: memory is getting more expensive.
In the past, when people talked about AI, they focused on whether there would be enough GPUs and how many cards NVIDIA could sell. Now the issue has spread to HBM (high-bandwidth memory), memory, servers, data centers, power, and even the entire supply chain.
In other words, the AI arms race hasn’t ended yet—but costs are already starting to climb.
Big tech firms like Microsoft, Google, and Oracle are still wildly expanding their AI infrastructure. Demand doesn’t seem to be cooling off, so upstream supply-chain players naturally have more pricing power.
Honestly, what’s really worth paying attention to here isn’t just how much more money NVIDIA can make.
It’s that if AI servers as a whole move into a price-increase cycle, sectors like storage, HBM, optical modules, PCBs, liquid cooling, power, and data centers are likely to continue being repeatedly “dug into” by funds.
Previously, the market was betting on “who has AI.”
The next phase may be betting on:
Who controls the scarcest resources in AI—whoever has them will have pricing power.
If NVIDIA dares to raise prices by 15%, to some extent it shows that AI isn’t being bought by nobody. Instead, people are lining up to buy it.
#ai #英伟达 $NVDAB $NVDA.US
With this AI wave, it may really be entering an era of “compute power inflation.”
According to the latest reports, the price of servers equipped with NVIDIA AI chips is expected to rise by more than 15%. Some of the price increases will start to show up in devices shipping in early 2027. High-end AI systems such as the Vera Rubin and Grace Blackwell could also be affected.
The reason behind the price hikes is also pretty straightforward: memory is getting more expensive.
In the past, when people talked about AI, they focused on whether there would be enough GPUs and how many cards NVIDIA could sell. Now the issue has spread to HBM (high-bandwidth memory), memory, servers, data centers, power, and even the entire supply chain.
In other words, the AI arms race hasn’t ended yet—but costs are already starting to climb.
Big tech firms like Microsoft, Google, and Oracle are still wildly expanding their AI infrastructure. Demand doesn’t seem to be cooling off, so upstream supply-chain players naturally have more pricing power.
Honestly, what’s really worth paying attention to here isn’t just how much more money NVIDIA can make.
It’s that if AI servers as a whole move into a price-increase cycle, sectors like storage, HBM, optical modules, PCBs, liquid cooling, power, and data centers are likely to continue being repeatedly “dug into” by funds.
Previously, the market was betting on “who has AI.”
The next phase may be betting on:
Who controls the scarcest resources in AI—whoever has them will have pricing power.
If NVIDIA dares to raise prices by 15%, to some extent it shows that AI isn’t being bought by nobody. Instead, people are lining up to buy it.
#ai #英伟达 $NVDAB $NVDA.US

NVDAB-4.08%
NVDAUS-4.48%
Verified
#黄金反弹近5% This time it might not be just a “bounce back”
Not long ago, gold kept falling and many people were calling the bull market over—yet this week it’s pulled right back up.
Spot gold has now regained $4,620/oz. During the session it even pushed toward around $4,630. The week’s gain is over 5%, and it has already risen for the third straight week.
More importantly, gold has moved back above the 200-day moving average, which clearly indicates that the short-term structure has turned stronger.
Behind this upswing, key drivers include a weaker US dollar, volatility in US Treasuries, and a renewed uptick in safe-haven demand. There’s also an interesting recent phenomenon: #黄金 is rising, and #比特币 is also rising. Two completely different assets, yet they may both be trading the same logic—funds are again searching for value storage outside the US dollar system.
Next, I’ll focus on three key levels:
$4,510—$4,530: Important support. As long as it holds, the long setup remains intact.
$4,630—$4,650: The current first resistance zone.
$4,700: If price breaks above $4,650, the market may likely push toward this level.
That said, gold has already run up quite a bit in the short term, so chasing higher prices isn’t comfortable right now. In truly strong markets, pullbacks don’t scare it. If later the price dips back near $4,500 and is supported by incoming capital, then this move may be more than just a oversold rebound.
The real question now is:
Is gold in just a rebound, or is it preparing to challenge $5,000 again?
#XAU $XAUT
Not long ago, gold kept falling and many people were calling the bull market over—yet this week it’s pulled right back up.
Spot gold has now regained $4,620/oz. During the session it even pushed toward around $4,630. The week’s gain is over 5%, and it has already risen for the third straight week.
More importantly, gold has moved back above the 200-day moving average, which clearly indicates that the short-term structure has turned stronger.
Behind this upswing, key drivers include a weaker US dollar, volatility in US Treasuries, and a renewed uptick in safe-haven demand. There’s also an interesting recent phenomenon: #黄金 is rising, and #比特币 is also rising. Two completely different assets, yet they may both be trading the same logic—funds are again searching for value storage outside the US dollar system.
Next, I’ll focus on three key levels:
$4,510—$4,530: Important support. As long as it holds, the long setup remains intact.
$4,630—$4,650: The current first resistance zone.
$4,700: If price breaks above $4,650, the market may likely push toward this level.
That said, gold has already run up quite a bit in the short term, so chasing higher prices isn’t comfortable right now. In truly strong markets, pullbacks don’t scare it. If later the price dips back near $4,500 and is supported by incoming capital, then this move may be more than just a oversold rebound.
The real question now is:
Is gold in just a rebound, or is it preparing to challenge $5,000 again?
#XAU $XAUT


This week in Bitcoin, they straight-up shot the air force so they started doubting their own lives!
#比特币创2023年3月来最佳周表现
If nothing major and crazy happens by the weekend, then $BTC this week basically can be recorded as the most notable market performance from the past three years.
It rallied all the way from the start of the week to nearly $80,000, with the highest intraday gain in the week reaching close to 23%. You know, not long ago the market was still debating whether $60,000 would hold—and now the vibe is: when will $80,000 break?
For this rally, I think the most worth watching thing isn’t “how much it rose,” but how fast the market sentiment has changed.
A few weeks ago, everyone was still afraid of more downside, with capital being cautious and tight-lipped; even altcoins—nobody dared touch them. But this week, U.S. policy expectations turned warmer, liquidity expectations heated up, ETF inflows returned, and on top of that, a large number of shorts were forced to cover—those factors together lit the fuse. BTC went from “nobody dares to chase” to “afraid we’ll miss the train.”
This is the most familiar script in crypto land:
When it’s above $60k, people think it’s too expensive and fear the drop;
When it’s above $70k, people start researching;
When it finally pushes toward $80k, people start asking whether they can still get on board.
More interestingly, this time it’s not just BTC rising. $ETH 、$XRP 、#SOL and plenty of other altcoins have also started recovering noticeably, and risk appetite among investors is being lifted again.
But I actually think the most dangerous thing right now isn’t going bearish—it’s this: after consecutive big gains, people get carried away and start thinking the bull market is completely back.
#BTC this week was indeed ferocious, but there’s still a considerable distance from the all-time highs. What’s truly worth watching is whether $80,000 can hold, whether ETF capital can keep flowing in consistently, and whether after BTC rallies, the funds will genuinely spread out to #ETH and #山寨 .
If all three signals show up at the same time, then this week might not just be a one-off “violent rebound.”
It could be where the next leg of the market really starts to accelerate.
So now I just want to ask one thing:
Did you end up buying all the way when it was above $60k, or did you only react when it was above $70k? 😂
#比特币创2023年3月来最佳周表现
If nothing major and crazy happens by the weekend, then $BTC this week basically can be recorded as the most notable market performance from the past three years.
It rallied all the way from the start of the week to nearly $80,000, with the highest intraday gain in the week reaching close to 23%. You know, not long ago the market was still debating whether $60,000 would hold—and now the vibe is: when will $80,000 break?
For this rally, I think the most worth watching thing isn’t “how much it rose,” but how fast the market sentiment has changed.
A few weeks ago, everyone was still afraid of more downside, with capital being cautious and tight-lipped; even altcoins—nobody dared touch them. But this week, U.S. policy expectations turned warmer, liquidity expectations heated up, ETF inflows returned, and on top of that, a large number of shorts were forced to cover—those factors together lit the fuse. BTC went from “nobody dares to chase” to “afraid we’ll miss the train.”
This is the most familiar script in crypto land:
When it’s above $60k, people think it’s too expensive and fear the drop;
When it’s above $70k, people start researching;
When it finally pushes toward $80k, people start asking whether they can still get on board.
More interestingly, this time it’s not just BTC rising. $ETH 、$XRP 、#SOL and plenty of other altcoins have also started recovering noticeably, and risk appetite among investors is being lifted again.
But I actually think the most dangerous thing right now isn’t going bearish—it’s this: after consecutive big gains, people get carried away and start thinking the bull market is completely back.
#BTC this week was indeed ferocious, but there’s still a considerable distance from the all-time highs. What’s truly worth watching is whether $80,000 can hold, whether ETF capital can keep flowing in consistently, and whether after BTC rallies, the funds will genuinely spread out to #ETH and #山寨 .
If all three signals show up at the same time, then this week might not just be a one-off “violent rebound.”
It could be where the next leg of the market really starts to accelerate.
So now I just want to ask one thing:
Did you end up buying all the way when it was above $60k, or did you only react when it was above $70k? 😂
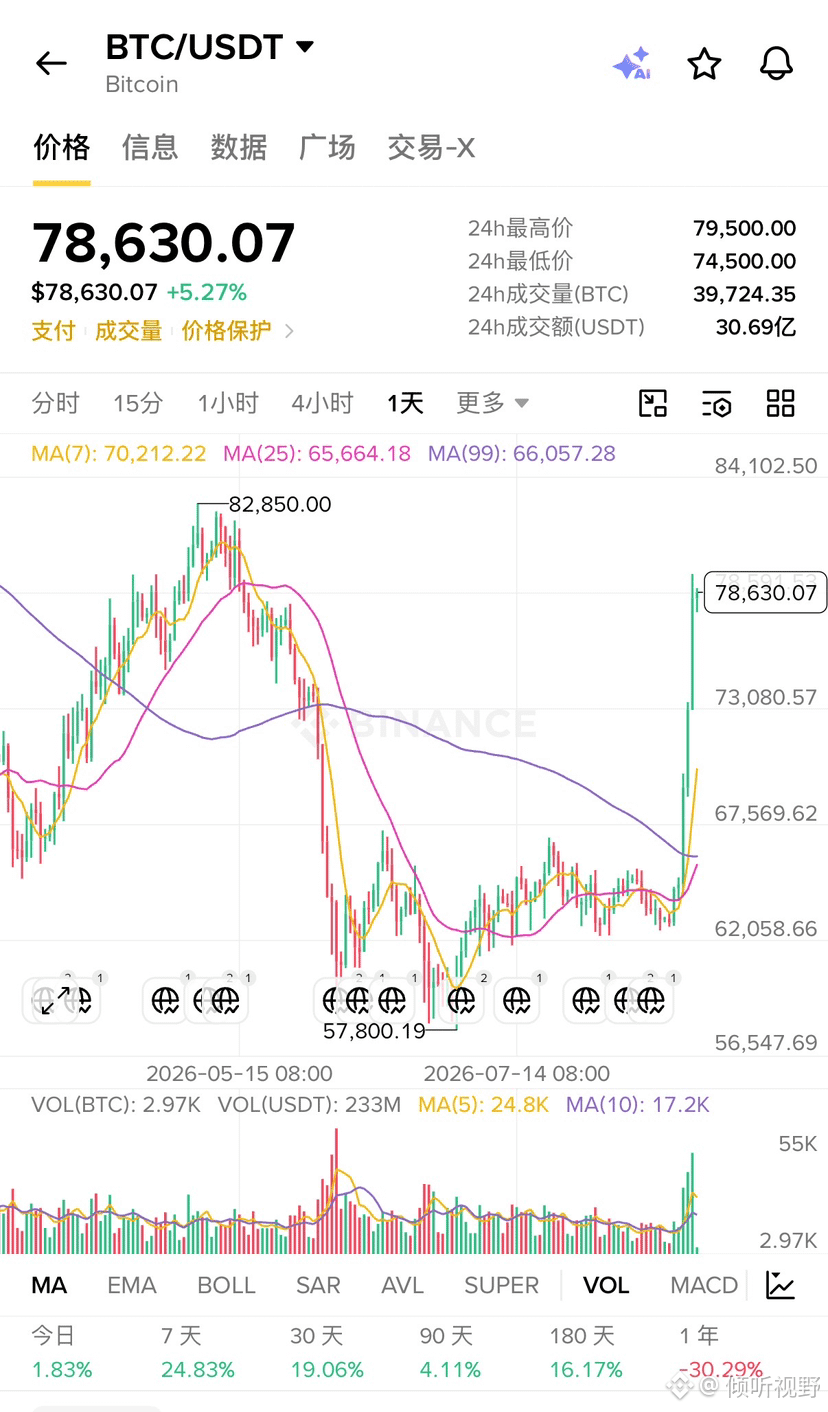

Tonight 20:30, the US CPI is coming! Big market volatility may have only just begun
Tonight, what I think is most worth watching isn’t some fake/low-quality “altcoin,” but the US July CPI.
The data will be released tonight at 20:30, and tomorrow at the same time there will also be the PPI. The market currently roughly expects July CPI year-over-year to be around 3.4%, and core CPI month-over-month to be about +0.2%. The truly key thing isn’t the number itself, but how far it deviates from expectations at the end.
If CPI is clearly below expectations, the market will very likely start re-pricing “inflation cooling,” which would naturally be favorable for risk assets such as $BTC , $ETH , and $BNB . But if the data unexpectedly blows past the forecasts, the US dollar, Treasury yields, and risk assets could all instantly change their tune.
That said, I won’t bet on the direction ahead of time tonight.
With everyone watching a data release like this, the most common outcome is actually “false moves.” After the data comes out, BTC may first pump and then dump, or spike through to liquidate leverage before moving in its real direction—either one is completely normal.
For myself, I’m mainly watching three things: how much the actual CPI differs from expectations, whether core CPI has cooled, and most importantly—how BTC actually reacts to the data.
Sometimes the data is a negative surprise, but BTC just refuses to fall; that can indicate there are people underneath ready to pick it up. And sometimes the data is clearly a positive surprise, yet BTC rallies and then falls back—this may mean the good news was already priced in by the market ahead of time.
So tonight, I’d rather wait until the first wave of sentiment plays out, and then decide whether to follow.
Opportunities in crypto are never in short supply. What’s most dangerous is when the direction hasn’t emerged yet, and the leverage sends you out first.
Tonight at 20:30—will CPI give BTC the gas, or the brakes?
#美国7月CPI与PPI数据本周出炉 #BTC #ETH #cpi #美联储何时降息?
Tonight, what I think is most worth watching isn’t some fake/low-quality “altcoin,” but the US July CPI.
The data will be released tonight at 20:30, and tomorrow at the same time there will also be the PPI. The market currently roughly expects July CPI year-over-year to be around 3.4%, and core CPI month-over-month to be about +0.2%. The truly key thing isn’t the number itself, but how far it deviates from expectations at the end.
If CPI is clearly below expectations, the market will very likely start re-pricing “inflation cooling,” which would naturally be favorable for risk assets such as $BTC , $ETH , and $BNB . But if the data unexpectedly blows past the forecasts, the US dollar, Treasury yields, and risk assets could all instantly change their tune.
That said, I won’t bet on the direction ahead of time tonight.
With everyone watching a data release like this, the most common outcome is actually “false moves.” After the data comes out, BTC may first pump and then dump, or spike through to liquidate leverage before moving in its real direction—either one is completely normal.
For myself, I’m mainly watching three things: how much the actual CPI differs from expectations, whether core CPI has cooled, and most importantly—how BTC actually reacts to the data.
Sometimes the data is a negative surprise, but BTC just refuses to fall; that can indicate there are people underneath ready to pick it up. And sometimes the data is clearly a positive surprise, yet BTC rallies and then falls back—this may mean the good news was already priced in by the market ahead of time.
So tonight, I’d rather wait until the first wave of sentiment plays out, and then decide whether to follow.
Opportunities in crypto are never in short supply. What’s most dangerous is when the direction hasn’t emerged yet, and the leverage sends you out first.
Tonight at 20:30—will CPI give BTC the gas, or the brakes?
#美国7月CPI与PPI数据本周出炉 #BTC #ETH #cpi #美联储何时降息?

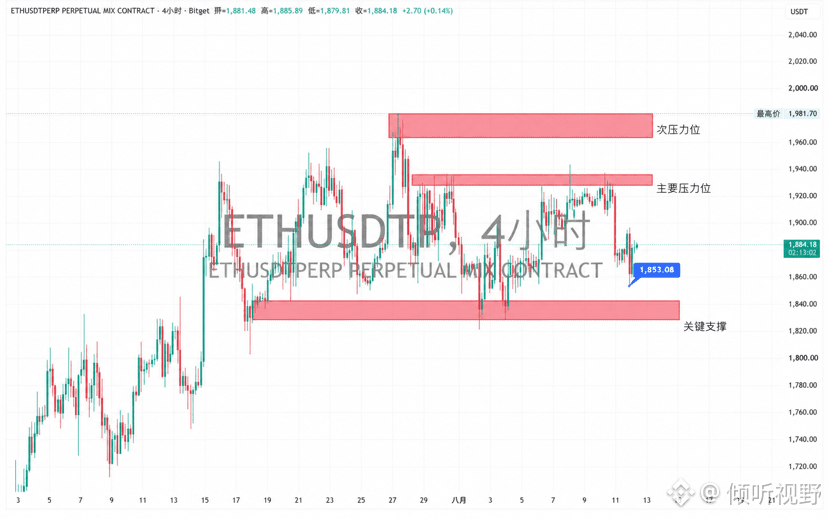
#ETH 4H I'm mainly watching this part 👀
After this pullback, I think 1830–1845 is still the most关键 (critical) short-term zone. In the last few times price reached here, there was funding/volume supporting the move. Also, this area is basically pinned at the defensive zone of the current upward structure. So as long as it doesn’t break down effectively, I’m not too pessimistic for now.
In other words, if 1830–1845 can hold, then this pullback looks more like a normal shakeout during an uptrend rather than a direct trend break. If later price can reclaim 1910–1930, then the bulls still have a chance to push higher toward the 1950–1980 range.
So right now, looking at $ETH , you don’t need to overthink it: the trend hasn’t turned bad yet. What really matters is whether the bulls can absorb and hold this pullback.
If it holds, there’s still action ahead; if it doesn’t, then reassess the structure again.
#ETH #Ethereum #行情分析📈 #加密货币
After this pullback, I think 1830–1845 is still the most关键 (critical) short-term zone. In the last few times price reached here, there was funding/volume supporting the move. Also, this area is basically pinned at the defensive zone of the current upward structure. So as long as it doesn’t break down effectively, I’m not too pessimistic for now.
In other words, if 1830–1845 can hold, then this pullback looks more like a normal shakeout during an uptrend rather than a direct trend break. If later price can reclaim 1910–1930, then the bulls still have a chance to push higher toward the 1950–1980 range.
So right now, looking at $ETH , you don’t need to overthink it: the trend hasn’t turned bad yet. What really matters is whether the bulls can absorb and hold this pullback.
If it holds, there’s still action ahead; if it doesn’t, then reassess the structure again.
#ETH #Ethereum #行情分析📈 #加密货币

Verified
Gold is climbing again and is back near $4,380. This time, it’s definitely not just a typical safe-haven move.
Many people still associate gold with this idea: when there’s war, buy gold; when the market panics, buy gold. But this wave is more interesting, because it’s not rising on “panic.” Instead, the market is repositioning around a different belief:
The dollar and high interest rates may not hold up for much longer.
Earlier, gold was being crushed. With the dollar strong and U.S. Treasury yields high, people felt gold has no interest, so it’s better to hold dollar assets. But the narrative has started to shift. U.S. employment data has cooled, and the market is once again fantasizing about whether the Fed might eventually ease. The moment the dollar softens, gold immediately looks like someone loosened the grip around its neck.
That’s why the $4,380 level is so crucial.
It’s not just a number—it’s a litmus test for market sentiment. If it breaks above, it suggests funds are once again betting that gold can keep telling the “rate cuts + safe-haven demand + central bank buying” story. If it can’t break through, then this area could turn into a sell-off zone for short-term profit-taking.
Even more importantly, people buying gold aren’t only retail investors. Central banks are buying, institutions are watching, and ordinary people are also starting to discuss again where money is truly safest. When everyone simultaneously feels cash will lose value, stocks are too expensive, and crypto is too wild, this old-fashioned asset suddenly starts looking appealing again.
But don’t forget: as gold rises to this level, volatility will increase too.
It isn’t that gold won’t drop—it’s just that it has moved back to the center of the global capital playbook.
So the most exciting question ahead isn’t whether gold can reach $4,380, but:
If $4,380 is truly taken out, how far is $4,400?
In the past, people said gold is an “old man’s asset.”
Now it looks more like the world’s last sense of safety for global capital.
#黄金挑战4380美元 $XAU
Many people still associate gold with this idea: when there’s war, buy gold; when the market panics, buy gold. But this wave is more interesting, because it’s not rising on “panic.” Instead, the market is repositioning around a different belief:
The dollar and high interest rates may not hold up for much longer.
Earlier, gold was being crushed. With the dollar strong and U.S. Treasury yields high, people felt gold has no interest, so it’s better to hold dollar assets. But the narrative has started to shift. U.S. employment data has cooled, and the market is once again fantasizing about whether the Fed might eventually ease. The moment the dollar softens, gold immediately looks like someone loosened the grip around its neck.
That’s why the $4,380 level is so crucial.
It’s not just a number—it’s a litmus test for market sentiment. If it breaks above, it suggests funds are once again betting that gold can keep telling the “rate cuts + safe-haven demand + central bank buying” story. If it can’t break through, then this area could turn into a sell-off zone for short-term profit-taking.
Even more importantly, people buying gold aren’t only retail investors. Central banks are buying, institutions are watching, and ordinary people are also starting to discuss again where money is truly safest. When everyone simultaneously feels cash will lose value, stocks are too expensive, and crypto is too wild, this old-fashioned asset suddenly starts looking appealing again.
But don’t forget: as gold rises to this level, volatility will increase too.
It isn’t that gold won’t drop—it’s just that it has moved back to the center of the global capital playbook.
So the most exciting question ahead isn’t whether gold can reach $4,380, but:
If $4,380 is truly taken out, how far is $4,400?
In the past, people said gold is an “old man’s asset.”
Now it looks more like the world’s last sense of safety for global capital.
#黄金挑战4380美元 $XAU

Log in to explore more content