
Crypto麻子新
4.8k Posts

Crypto麻子新
公众号:麻子新 微博:麻子新 手续费返20%邀请码:IPGH0OV5

Level 1 Creator

PEPE Holder
Frequent Trader
5.9 Years
79 Following
21.4K+ Followers
59.2K+ Liked
1 Badges
Posts
All
Quotes
Videos
Live
PINNED
Open -- Contract -- Today's Profit and Loss -- Funding Fees and Transaction Fees.
You can see your fees for the past year. If you should spend, save what you can!
Use my link to automatically reverse 20% and manually reverse 15%, which means you can reduce 35% of the fees, which should be the highest in the entire network. The manual reverse part is settled once a month. Don't underestimate the fees. Even if you are a small retail investor, the fees you incur in a year are unimaginable! If you trade frequently, you may save enough to buy a BBA in a year.
Xiaoxin exclusive link: https://www.marketwebb.club/join?ref=RC67WKBY
Exclusive invitation code: RC67WKBY
What if you have already registered? I can give you a tutorial. You don't need to change your mobile phone number or identity to re-authenticate. It only takes about ten minutes to get it done!
币安聊天室链接!
$BNB
You can see your fees for the past year. If you should spend, save what you can!
Use my link to automatically reverse 20% and manually reverse 15%, which means you can reduce 35% of the fees, which should be the highest in the entire network. The manual reverse part is settled once a month. Don't underestimate the fees. Even if you are a small retail investor, the fees you incur in a year are unimaginable! If you trade frequently, you may save enough to buy a BBA in a year.
Xiaoxin exclusive link: https://www.marketwebb.club/join?ref=RC67WKBY
Exclusive invitation code: RC67WKBY
What if you have already registered? I can give you a tutorial. You don't need to change your mobile phone number or identity to re-authenticate. It only takes about ten minutes to get it done!
币安聊天室链接!
$BNB
PINNED
As someone whose account peaked at 17 million dollars but has now withdrawn to over 500, I’d like to offer some advice. 这是回撤之后的持仓!
Videos cannot write long articles; I will write in the next article and reference this one. These are my reflections and insights from the past few months, explaining why we are in the current situation.
The video is from March 2024, when $ICP made a significant profit. If there are critics who want me to record a screen with over 10 million dollars in holdings, I wouldn’t be able to do it because my current position is not that large anymore.
However, I am very confident that I can return to my peak and even surpass it. I spent three months reflecting on this mistake and realized that no matter how much I lost, it was a valuable lesson.
Videos cannot write long articles; I will write in the next article and reference this one. These are my reflections and insights from the past few months, explaining why we are in the current situation.
The video is from March 2024, when $ICP made a significant profit. If there are critics who want me to record a screen with over 10 million dollars in holdings, I wouldn’t be able to do it because my current position is not that large anymore.
However, I am very confident that I can return to my peak and even surpass it. I spent three months reflecting on this mistake and realized that no matter how much I lost, it was a valuable lesson.
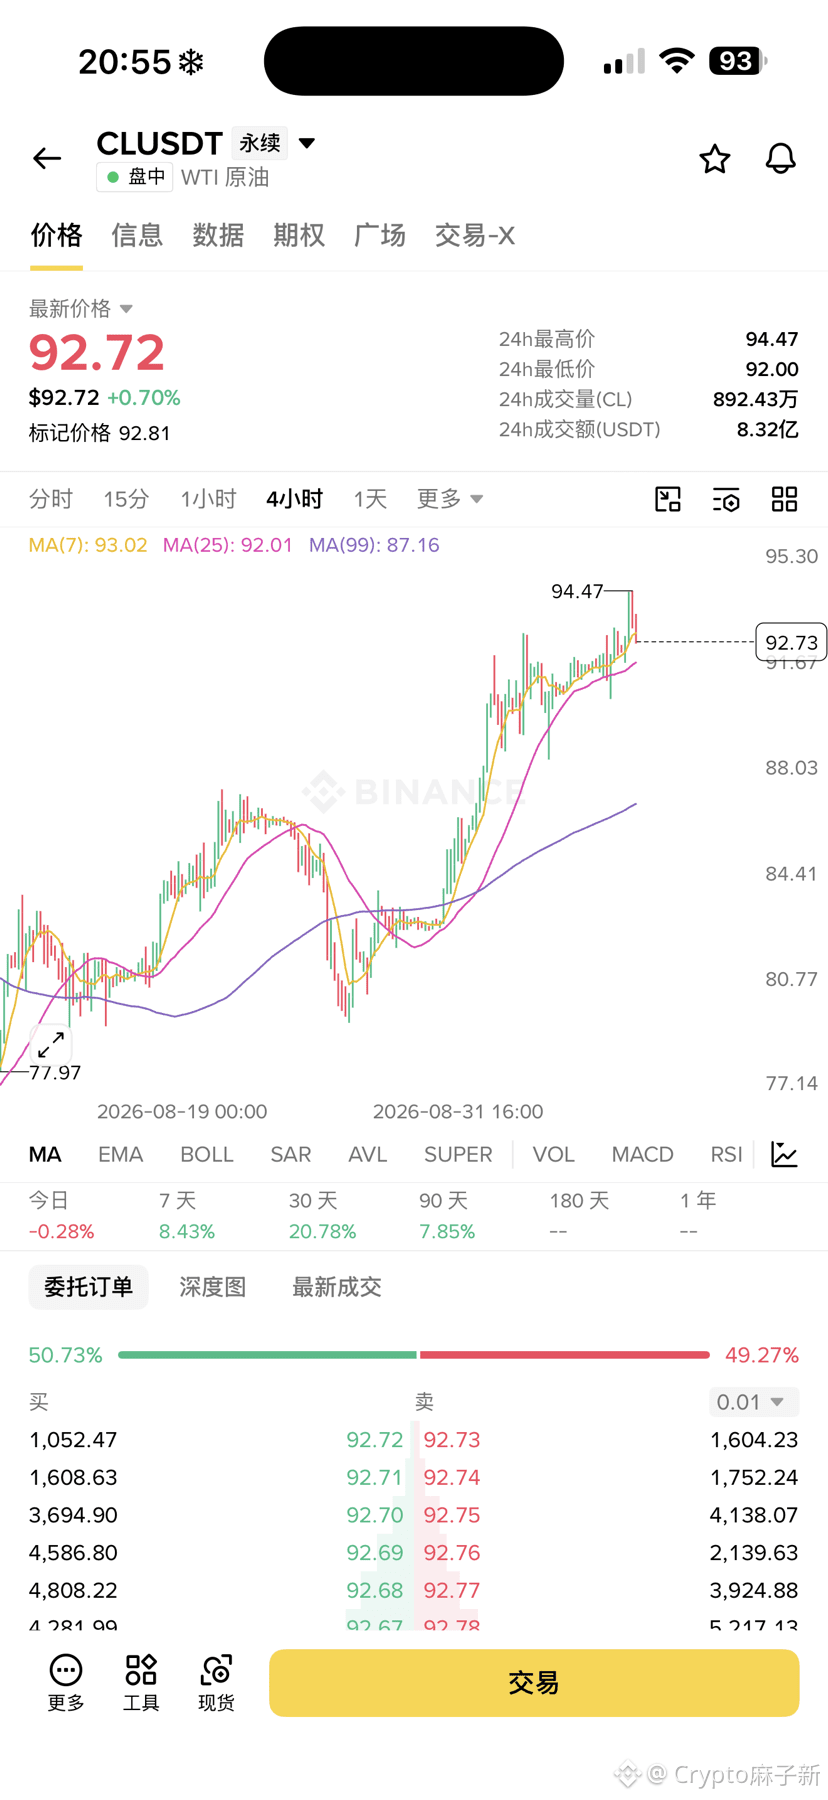
In the past two days, people have asked a lot about shorting crude oil at $CL —can it really be done? First, let me ask a question: if it goes sideways here for two weeks and the funding rate stays at a certain level, can you hold up?
If you can’t, then right now as prices rise above 90, more and more people will short, and the funding rate will also rise/accelerate. Another point is that everyone has formed a consensus: short above 90, and go long below 80.
But I think this may break that consensus. This move may not only involve a long period of sideways trading, but in the end it may very possibly push above 100. If you really want to short, I suggest waiting.
I have a hunch that the shorts around 90 and those above 90 may first have their principal gradually eaten away by the funding rate, and then get squeezed/liquidated as the market rallies.
If you can’t, then right now as prices rise above 90, more and more people will short, and the funding rate will also rise/accelerate. Another point is that everyone has formed a consensus: short above 90, and go long below 80.
But I think this may break that consensus. This move may not only involve a long period of sideways trading, but in the end it may very possibly push above 100. If you really want to short, I suggest waiting.
I have a hunch that the shorts around 90 and those above 90 may first have their principal gradually eaten away by the funding rate, and then get squeezed/liquidated as the market rallies.
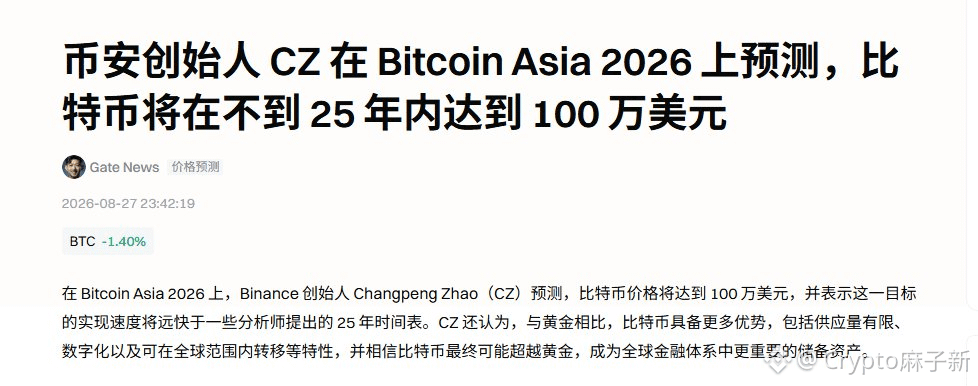
In the next 25 years, by $BTC 25, there will be 1 million USD per coin. Will the encryption market disappear if we don’t wait 25 years?
Verified
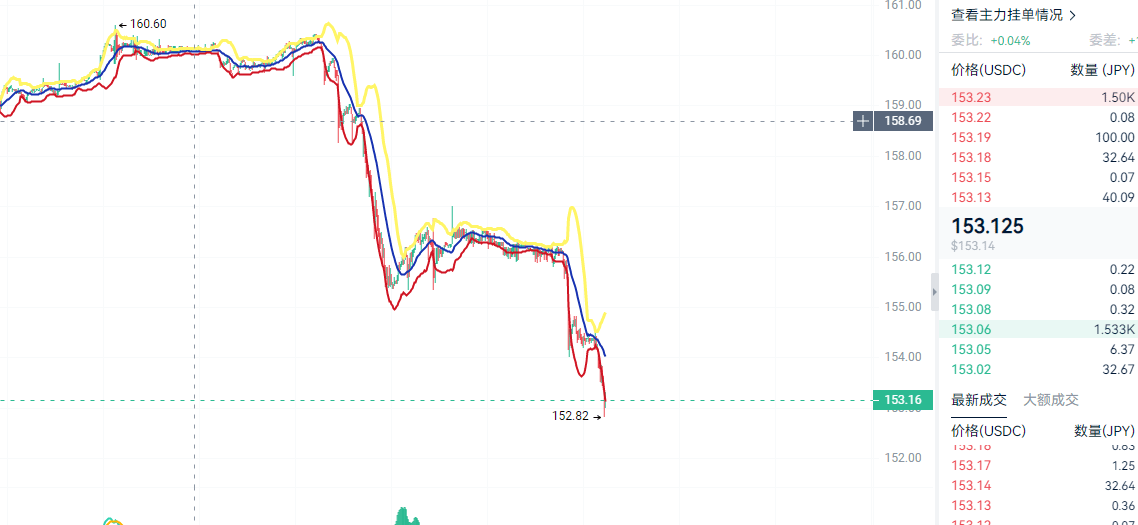
What you really need to be wary of isn’t the yen appreciating itself, but the fact that once USD/JPY breaks below the key range of 152–150, carry trades may switch from an “active unwind” to a “forced deleveraging.”
From 158 down to where it is now, earlier on it has mostly been a process of institutions actively buying yen and repaying borrowed funds. Position sizes can be controlled, so although the yen’s appreciation is clearly visible, the overall move has still been relatively orderly. But as the exchange rate keeps pressing toward the risk threshold, some high-leverage, high-margin carry-trade positions begin facing pressure from risk controls: either you top up margin, reduce leverage proactively, or wait for the system to liquidate positions. In essence, no matter which route, it comes down to selling USD-denominated assets to buy back yen.
So after USD/JPY breaks below 155, the speed of the yen’s appreciation noticeably accelerates—and that’s already worth watching closely.
The real danger is 152–150. If it continues breaking downward, more and more risk-control models and mechanical liquidation mechanisms may be triggered. At that point, carry trades shift from “whether to close positions” to “must close positions.” Then the assets being dumped wouldn’t be limited to U.S. stocks—gold and other highly liquid assets could also become sources of funds to top up margin.
So going forward, don’t focus only on USD/JPY. What’s more important to monitor is whether the yen continues to accelerate in its appreciation, whether U.S. Treasury yields start rising “because assets are being sold,” whether U.S. equities weaken in parallel, and whether gold also begins to fall.
If these signals appear at the same time, be careful—this may no longer be an ordinary pullback in risk assets, but the forced deleveraging phase of yen carry trades.
From 158 down to where it is now, earlier on it has mostly been a process of institutions actively buying yen and repaying borrowed funds. Position sizes can be controlled, so although the yen’s appreciation is clearly visible, the overall move has still been relatively orderly. But as the exchange rate keeps pressing toward the risk threshold, some high-leverage, high-margin carry-trade positions begin facing pressure from risk controls: either you top up margin, reduce leverage proactively, or wait for the system to liquidate positions. In essence, no matter which route, it comes down to selling USD-denominated assets to buy back yen.
So after USD/JPY breaks below 155, the speed of the yen’s appreciation noticeably accelerates—and that’s already worth watching closely.
The real danger is 152–150. If it continues breaking downward, more and more risk-control models and mechanical liquidation mechanisms may be triggered. At that point, carry trades shift from “whether to close positions” to “must close positions.” Then the assets being dumped wouldn’t be limited to U.S. stocks—gold and other highly liquid assets could also become sources of funds to top up margin.
So going forward, don’t focus only on USD/JPY. What’s more important to monitor is whether the yen continues to accelerate in its appreciation, whether U.S. Treasury yields start rising “because assets are being sold,” whether U.S. equities weaken in parallel, and whether gold also begins to fall.
If these signals appear at the same time, be careful—this may no longer be an ordinary pullback in risk assets, but the forced deleveraging phase of yen carry trades.
Crypto麻子新
·
--
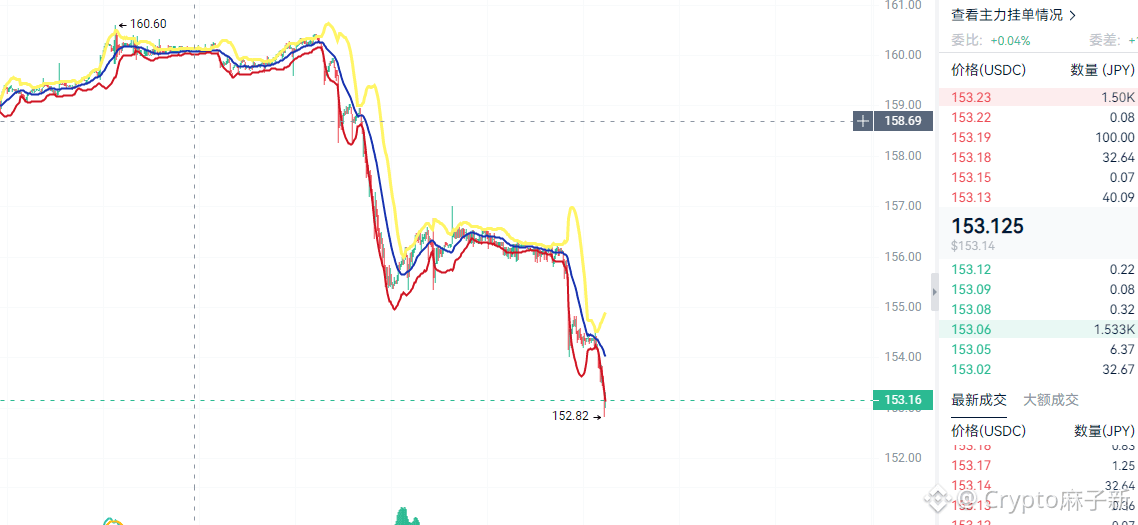
The yen is once again strengthening, and USD/JPY has already pulled back to around 152. Although the short-term move has completed a downward breakout, there has not been any clear sign of acceleration so far—something that is actually worth paying attention to.
What matters now is not just how much the yen is rising, but what kind of de-leveraging process the USD/JPY interest-rate differential trade is going through. As Japan’s 2-year JGB yields continue to stay at elevated levels, the return space for trades that previously relied on low-yield yen funding and buying other assets has been steadily squeezed. If the yen continues to appreciate, it can easily form a self-reinforcing loop: first selling risky assets to get back dollars, then selling dollars to buy yen to repay funding. The stronger the yen, the larger the losses on carry-trade positions; more capital is forced to cut losses, which means selling assets and buying yen again—ultimately further pushing the yen up.
At the moment, the yen is appreciating, but not particularly fast, suggesting that carry-trade unwinding and de-leveraging are still at relatively early stages. What truly needs to be watched out for is the acceleration in appreciation later on. Because if the yen strengthens rapidly, it implies that more and more carry-trade positions are shifting from主动调整 (active adjustment) to passive liquidation. In essence, this process is continuously withdrawing liquidity from global risk assets.
So next, I will focus on two things: the pace of yen appreciation, and the key level for USD/JPY. If USD/JPY continues to break below 150, it would enter an extreme zone that warrants heightened concern. At that stage, the risks may no longer be as simple as “the yen rises and assets fall,” but could evolve into a round of systematic selloff driven by de-leveraging.
Therefore, there is no need to panic excessively just because the yen has recently pulled back to 152. The truly dangerous signal is not “yen appreciation,” but when the yen starts to accelerate higher.
Once that pace shows a clear change, global risk assets should all remain on high alert.
What matters now is not just how much the yen is rising, but what kind of de-leveraging process the USD/JPY interest-rate differential trade is going through. As Japan’s 2-year JGB yields continue to stay at elevated levels, the return space for trades that previously relied on low-yield yen funding and buying other assets has been steadily squeezed. If the yen continues to appreciate, it can easily form a self-reinforcing loop: first selling risky assets to get back dollars, then selling dollars to buy yen to repay funding. The stronger the yen, the larger the losses on carry-trade positions; more capital is forced to cut losses, which means selling assets and buying yen again—ultimately further pushing the yen up.
At the moment, the yen is appreciating, but not particularly fast, suggesting that carry-trade unwinding and de-leveraging are still at relatively early stages. What truly needs to be watched out for is the acceleration in appreciation later on. Because if the yen strengthens rapidly, it implies that more and more carry-trade positions are shifting from主动调整 (active adjustment) to passive liquidation. In essence, this process is continuously withdrawing liquidity from global risk assets.
So next, I will focus on two things: the pace of yen appreciation, and the key level for USD/JPY. If USD/JPY continues to break below 150, it would enter an extreme zone that warrants heightened concern. At that stage, the risks may no longer be as simple as “the yen rises and assets fall,” but could evolve into a round of systematic selloff driven by de-leveraging.
Therefore, there is no need to panic excessively just because the yen has recently pulled back to 152. The truly dangerous signal is not “yen appreciation,” but when the yen starts to accelerate higher.
Once that pace shows a clear change, global risk assets should all remain on high alert.
Money and stocks bringing momentum to U.S. stocks is also a new thing—wow, you’re really something, fellow players!

Crypto麻子新
·
--
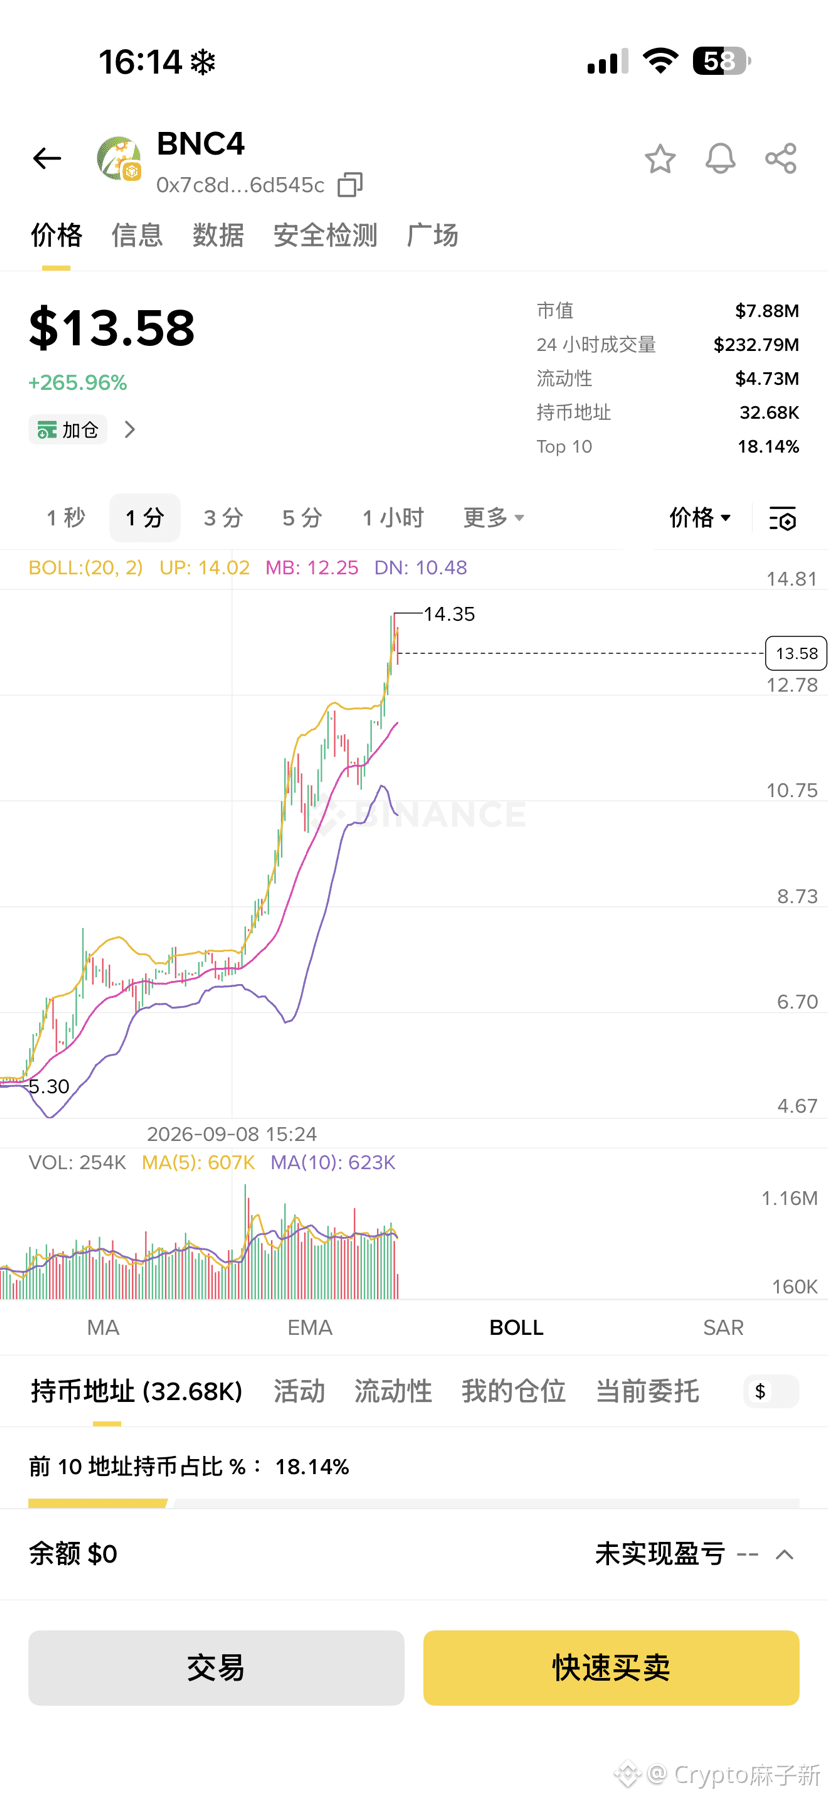
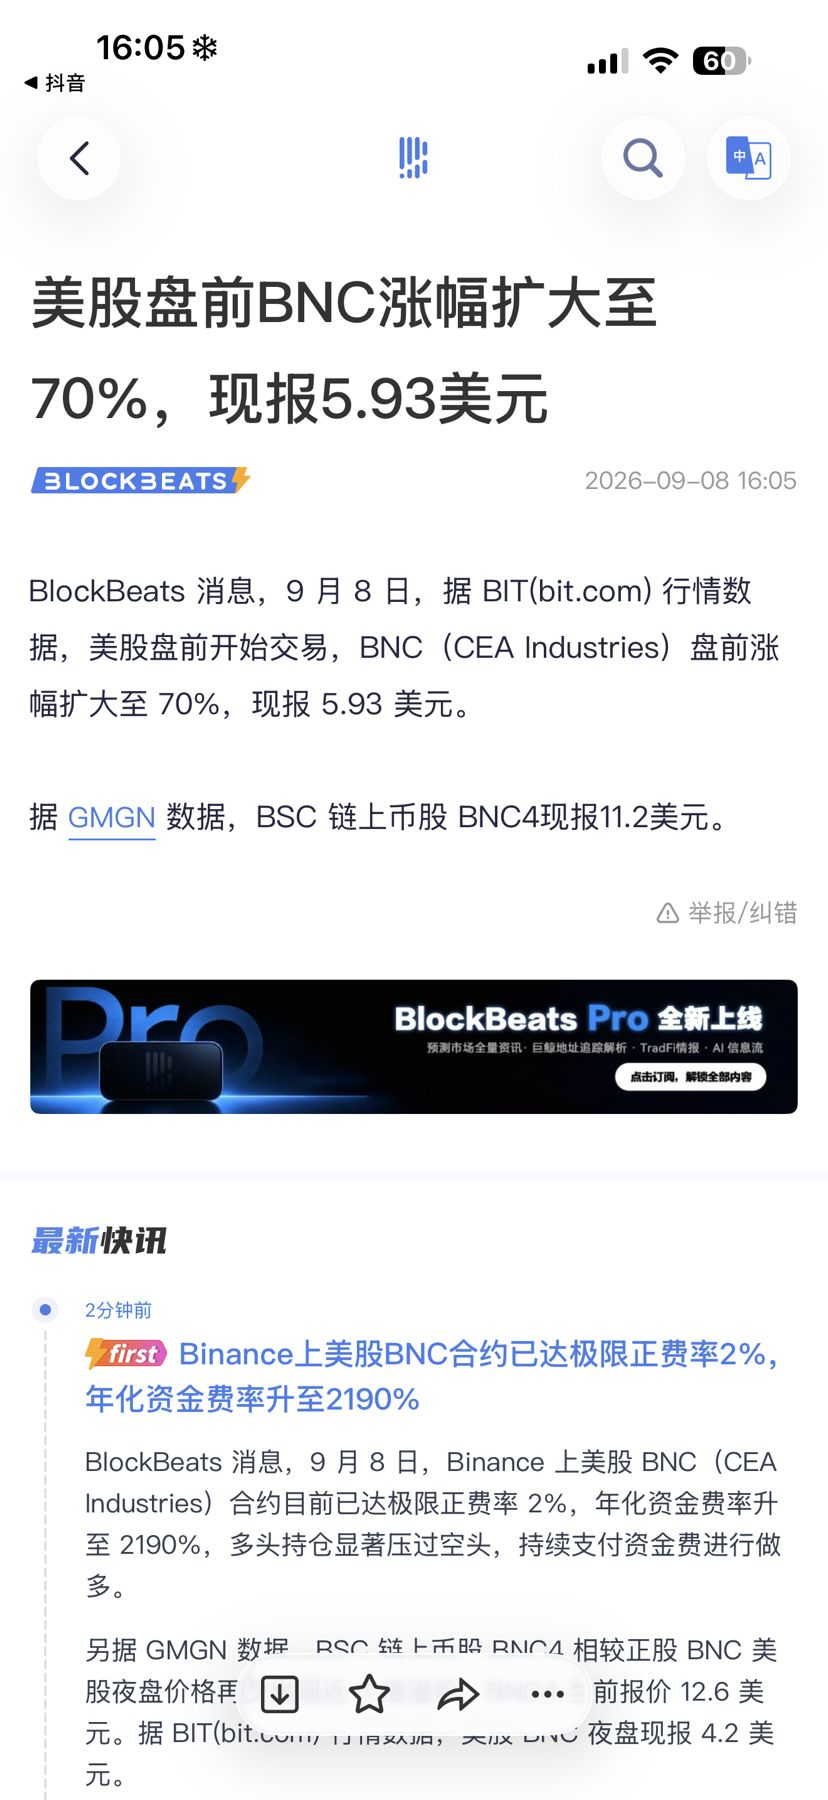
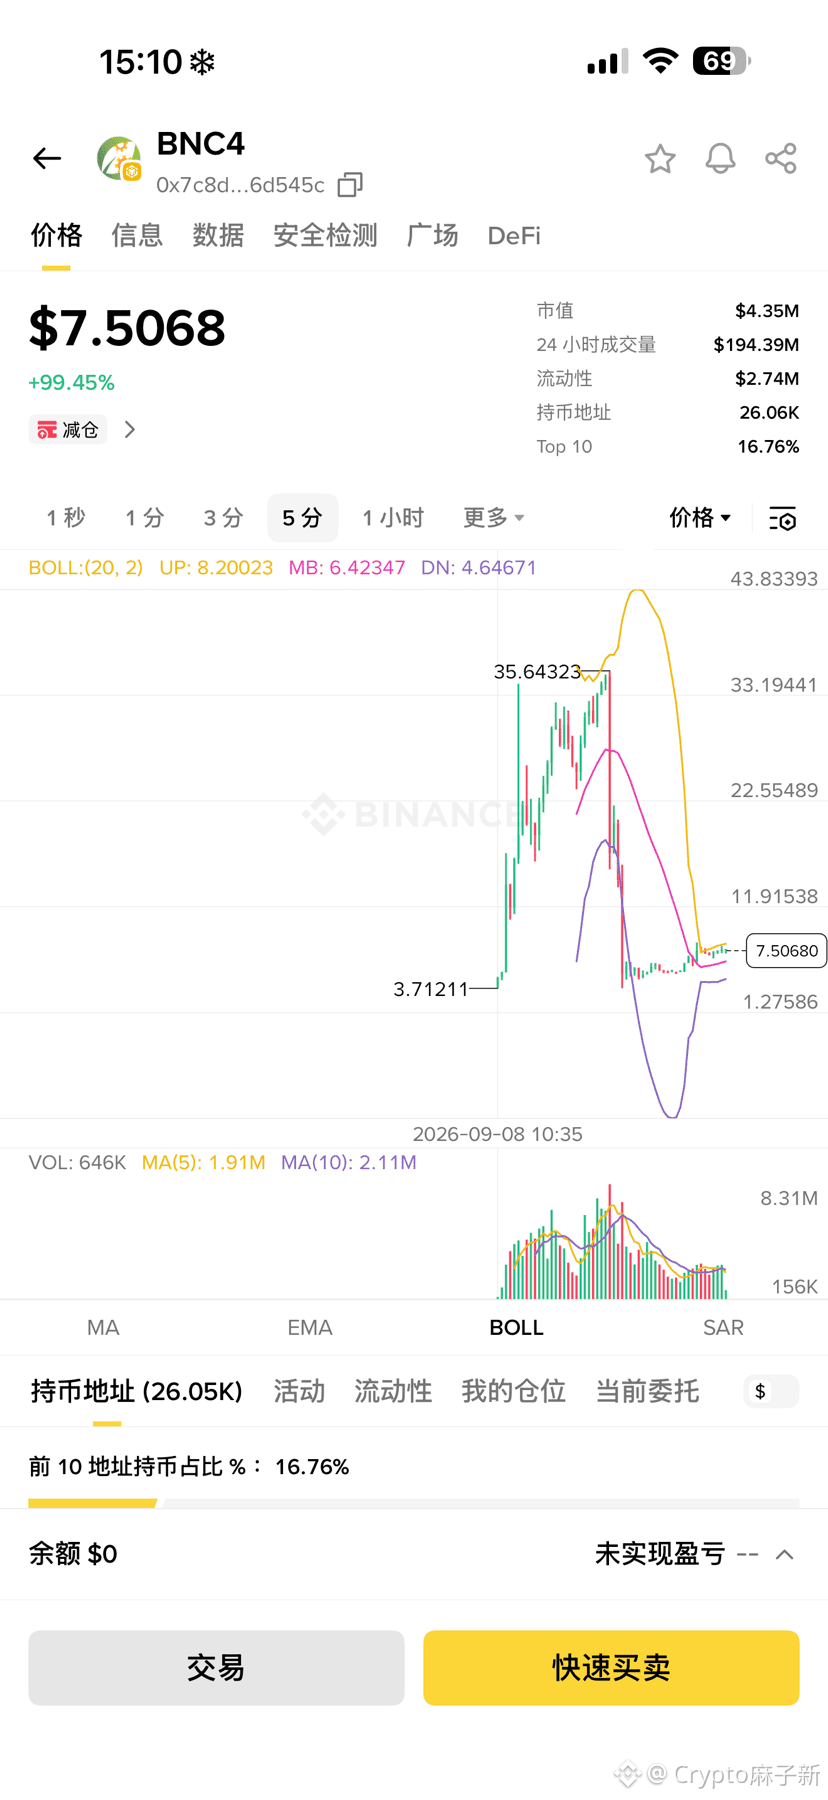
$bnc4 Now 4m, what about 40m? Or what about the next 400m?
$bnc4 Now 4m, what about 40m? Or what about the next 400m?
$FORM Went out to play stock pair-trading memes and then pumped the price. Sure enough, it’s still BN’s son. Maybe not everyone is familiar with this name—before it was renamed, it was called Bnx. It once had a history of strong, centralized control over the price.
But now is the real test: whether the news narrative behind it can keep sustaining. The coin’s fundamentals are essentially a platform token. If there’s a pullback, you can get in, and there should be good room ahead.
But now is the real test: whether the news narrative behind it can keep sustaining. The coin’s fundamentals are essentially a platform token. If there’s a pullback, you can get in, and there should be good room ahead.

This crypto market is really interesting—whenever the weirdos and chaos merchants make a big push on the weekend to drive the price up, then next week it will definitely pull back. But for now, there is support on the daily chart. Later, we’ll see whether it can hold. If it can’t, then it will be a daily-chart-level pullback.
Actually, if we’re talking about breaking through the weekly resistance, it should have gone up already. There wouldn’t have been three straight tests. Instead, going lower to find liquidity might be the better option.
Actually, if we’re talking about breaking through the weekly resistance, it should have gone up already. There wouldn’t have been three straight tests. Instead, going lower to find liquidity might be the better option.
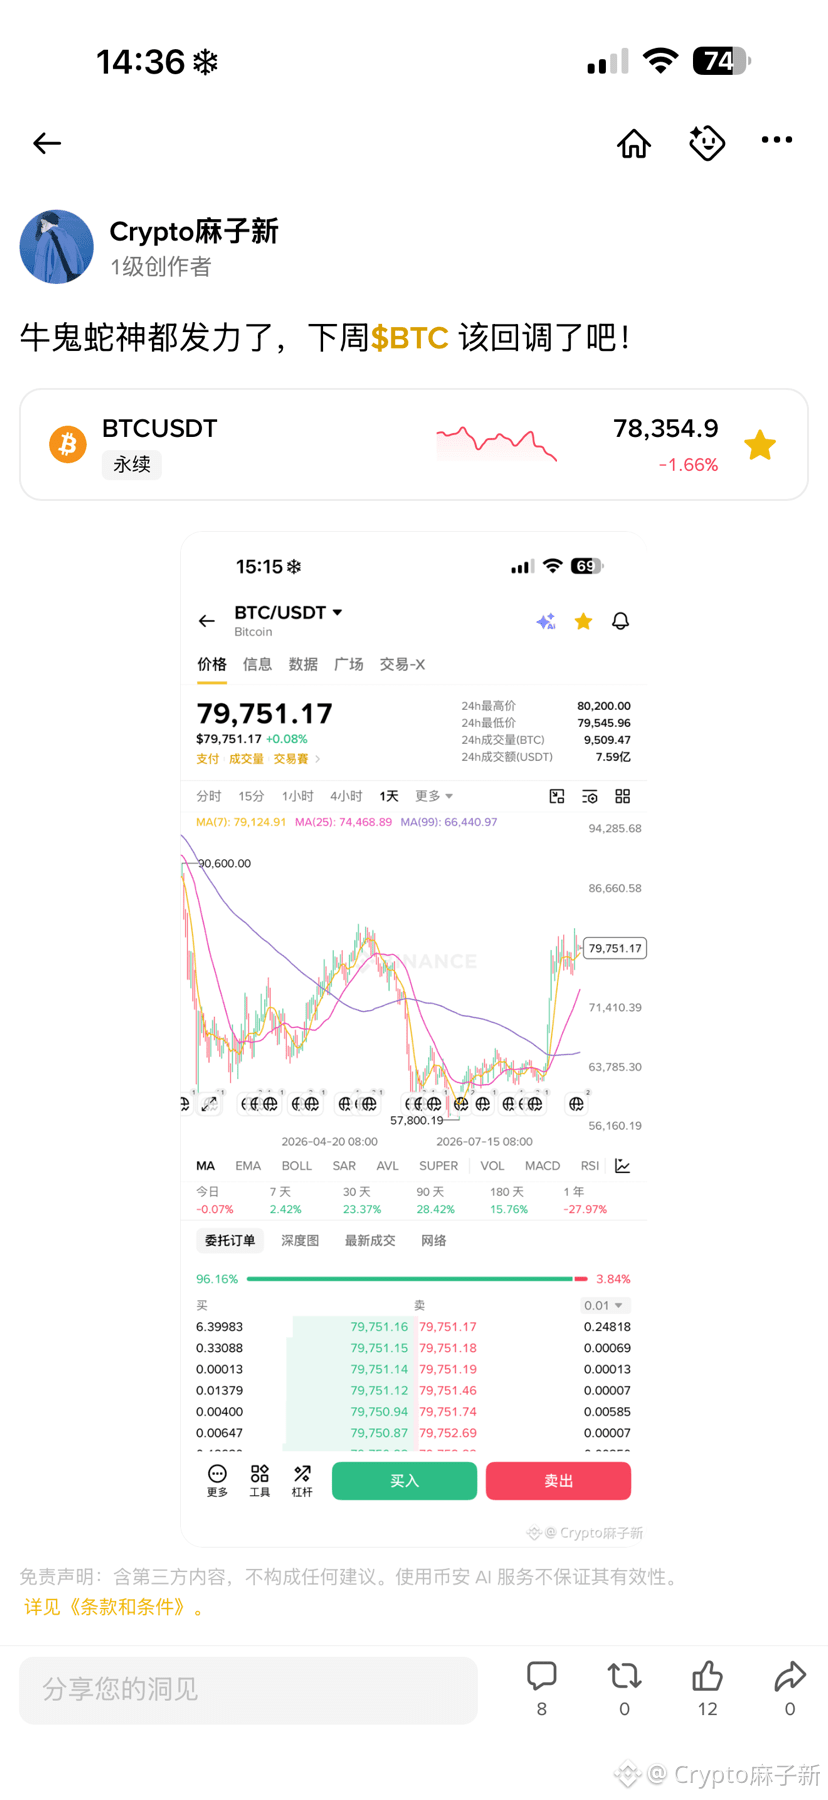
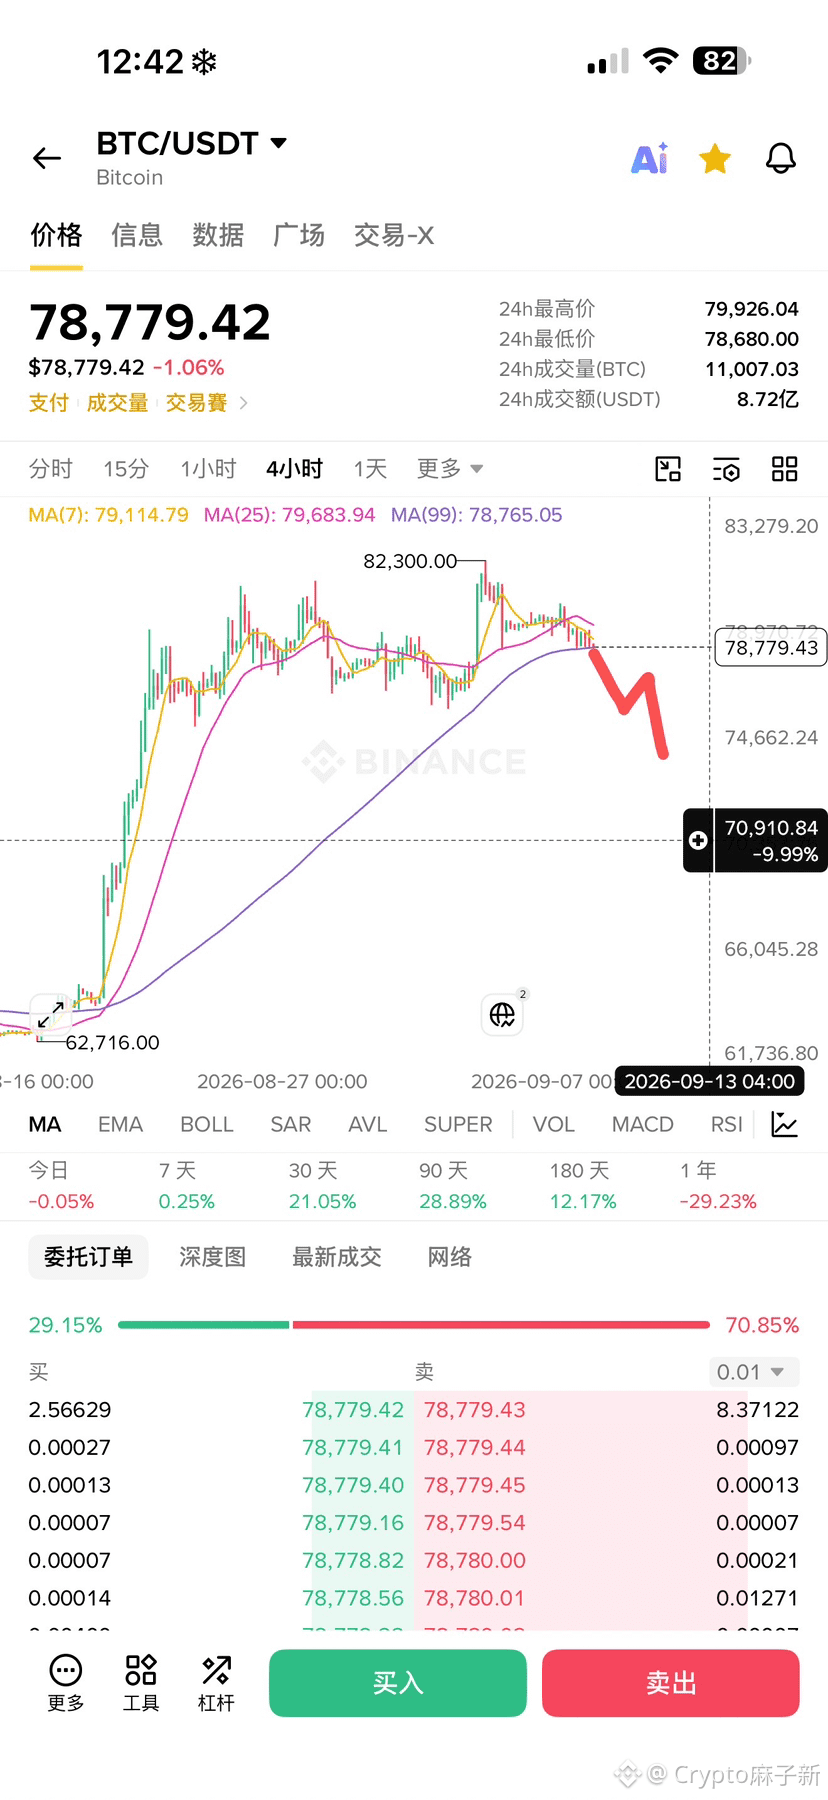
Not sure whether the $BTC around 72 can get on board, but around 72 it should at least go and check once.
Crypto麻子新
·
--
The big pie may not fall for the time being, but it is only limited to oscillating here. Then, after a wave of negative news comes into play, it will retrace to around 72 later.
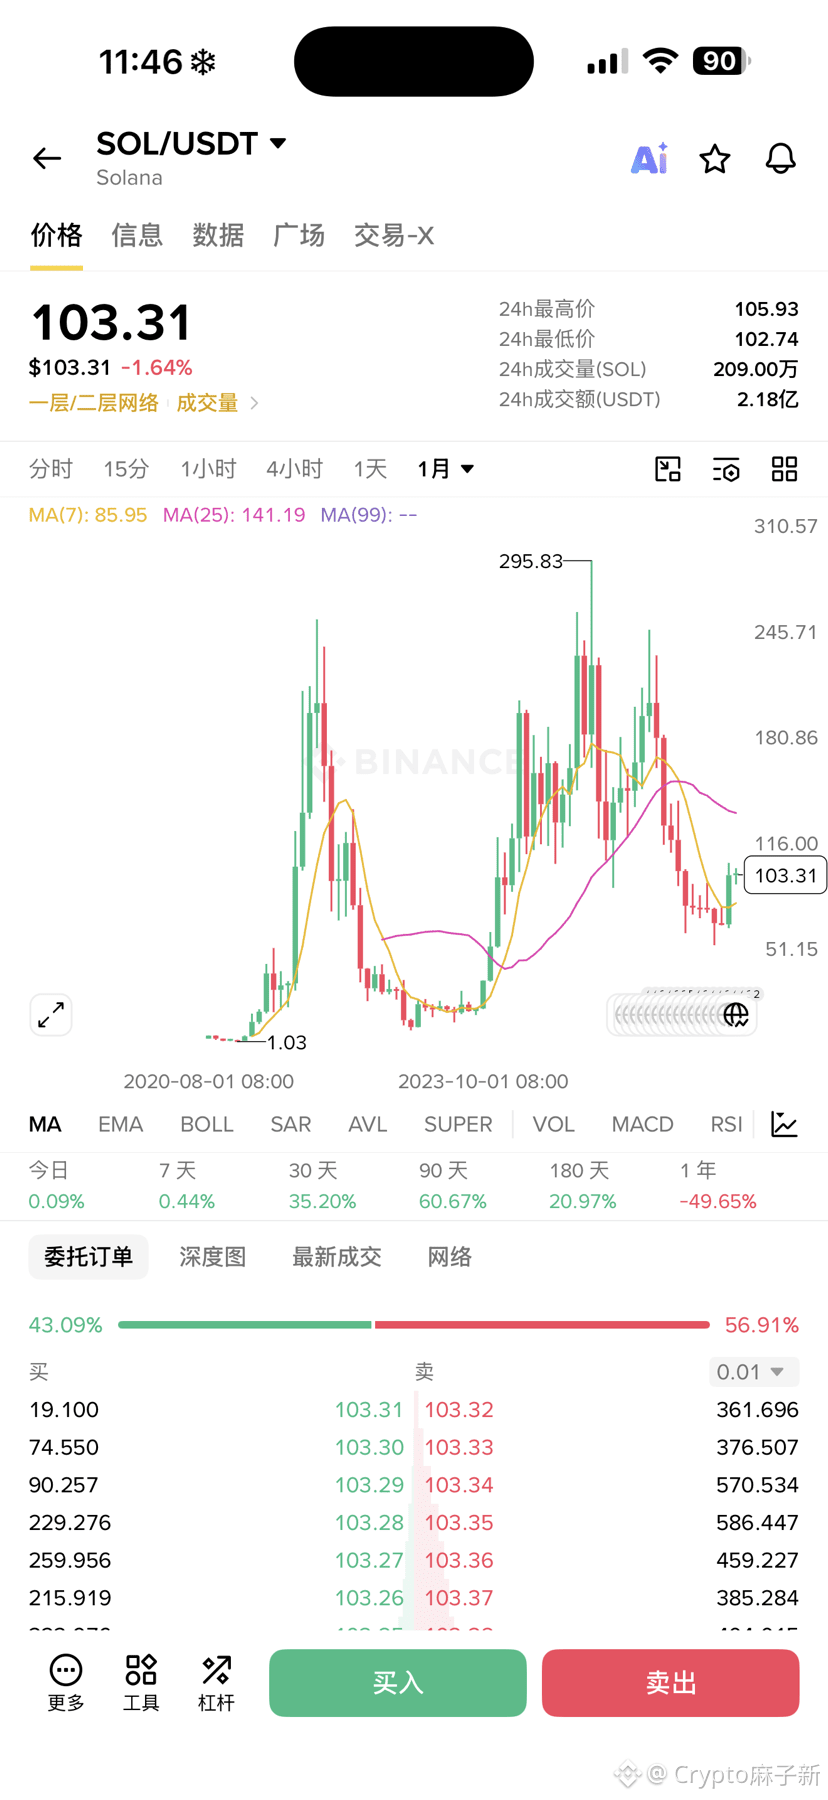
$SOL Is there still a big opportunity in the next bull cycle? Probably not. Most likely it will just track the broader market and won’t have an independent trend. Let me explain why the last cycle had an independent opportunity.
First of all, in 2022, after SBF and the “bald guy” were jailed and FTX collapsed, SOL went through a chain liquidation. It fell from around 259 all the way to $8. You could say the order book and market structure were as clean as they could possibly get.
After that, institutions created momentum and SOL’s meme ecosystem exploded. SOL then ran far ahead of everything else.
But now SOL is like Ethereum in the last cycle. Too many people hold expectations that it’ll be “on the car,” and since the “car” is already heavy, there aren’t new stories to drive it—so it would probably just follow.
Ironically, this cycle Ethereum’s “car” feels lighter. Even recently popular tokens like Robin and some memes are issuing on the Ethereum chain. Perhaps this cycle’s meme narrative will explode on Ethereum. You can shift the expectations you had for SOL over to Ethereum.
First of all, in 2022, after SBF and the “bald guy” were jailed and FTX collapsed, SOL went through a chain liquidation. It fell from around 259 all the way to $8. You could say the order book and market structure were as clean as they could possibly get.
After that, institutions created momentum and SOL’s meme ecosystem exploded. SOL then ran far ahead of everything else.
But now SOL is like Ethereum in the last cycle. Too many people hold expectations that it’ll be “on the car,” and since the “car” is already heavy, there aren’t new stories to drive it—so it would probably just follow.
Ironically, this cycle Ethereum’s “car” feels lighter. Even recently popular tokens like Robin and some memes are issuing on the Ethereum chain. Perhaps this cycle’s meme narrative will explode on Ethereum. You can shift the expectations you had for SOL over to Ethereum.
Partly True
The yen is once again strengthening, and USD/JPY has already pulled back to around 152. Although the short-term move has completed a downward breakout, there has not been any clear sign of acceleration so far—something that is actually worth paying attention to.
What matters now is not just how much the yen is rising, but what kind of de-leveraging process the USD/JPY interest-rate differential trade is going through. As Japan’s 2-year JGB yields continue to stay at elevated levels, the return space for trades that previously relied on low-yield yen funding and buying other assets has been steadily squeezed. If the yen continues to appreciate, it can easily form a self-reinforcing loop: first selling risky assets to get back dollars, then selling dollars to buy yen to repay funding. The stronger the yen, the larger the losses on carry-trade positions; more capital is forced to cut losses, which means selling assets and buying yen again—ultimately further pushing the yen up.
At the moment, the yen is appreciating, but not particularly fast, suggesting that carry-trade unwinding and de-leveraging are still at relatively early stages. What truly needs to be watched out for is the acceleration in appreciation later on. Because if the yen strengthens rapidly, it implies that more and more carry-trade positions are shifting from主动调整 (active adjustment) to passive liquidation. In essence, this process is continuously withdrawing liquidity from global risk assets.
So next, I will focus on two things: the pace of yen appreciation, and the key level for USD/JPY. If USD/JPY continues to break below 150, it would enter an extreme zone that warrants heightened concern. At that stage, the risks may no longer be as simple as “the yen rises and assets fall,” but could evolve into a round of systematic selloff driven by de-leveraging.
Therefore, there is no need to panic excessively just because the yen has recently pulled back to 152. The truly dangerous signal is not “yen appreciation,” but when the yen starts to accelerate higher.
Once that pace shows a clear change, global risk assets should all remain on high alert.
What matters now is not just how much the yen is rising, but what kind of de-leveraging process the USD/JPY interest-rate differential trade is going through. As Japan’s 2-year JGB yields continue to stay at elevated levels, the return space for trades that previously relied on low-yield yen funding and buying other assets has been steadily squeezed. If the yen continues to appreciate, it can easily form a self-reinforcing loop: first selling risky assets to get back dollars, then selling dollars to buy yen to repay funding. The stronger the yen, the larger the losses on carry-trade positions; more capital is forced to cut losses, which means selling assets and buying yen again—ultimately further pushing the yen up.
At the moment, the yen is appreciating, but not particularly fast, suggesting that carry-trade unwinding and de-leveraging are still at relatively early stages. What truly needs to be watched out for is the acceleration in appreciation later on. Because if the yen strengthens rapidly, it implies that more and more carry-trade positions are shifting from主动调整 (active adjustment) to passive liquidation. In essence, this process is continuously withdrawing liquidity from global risk assets.
So next, I will focus on two things: the pace of yen appreciation, and the key level for USD/JPY. If USD/JPY continues to break below 150, it would enter an extreme zone that warrants heightened concern. At that stage, the risks may no longer be as simple as “the yen rises and assets fall,” but could evolve into a round of systematic selloff driven by de-leveraging.
Therefore, there is no need to panic excessively just because the yen has recently pulled back to 152. The truly dangerous signal is not “yen appreciation,” but when the yen starts to accelerate higher.
Once that pace shows a clear change, global risk assets should all remain on high alert.
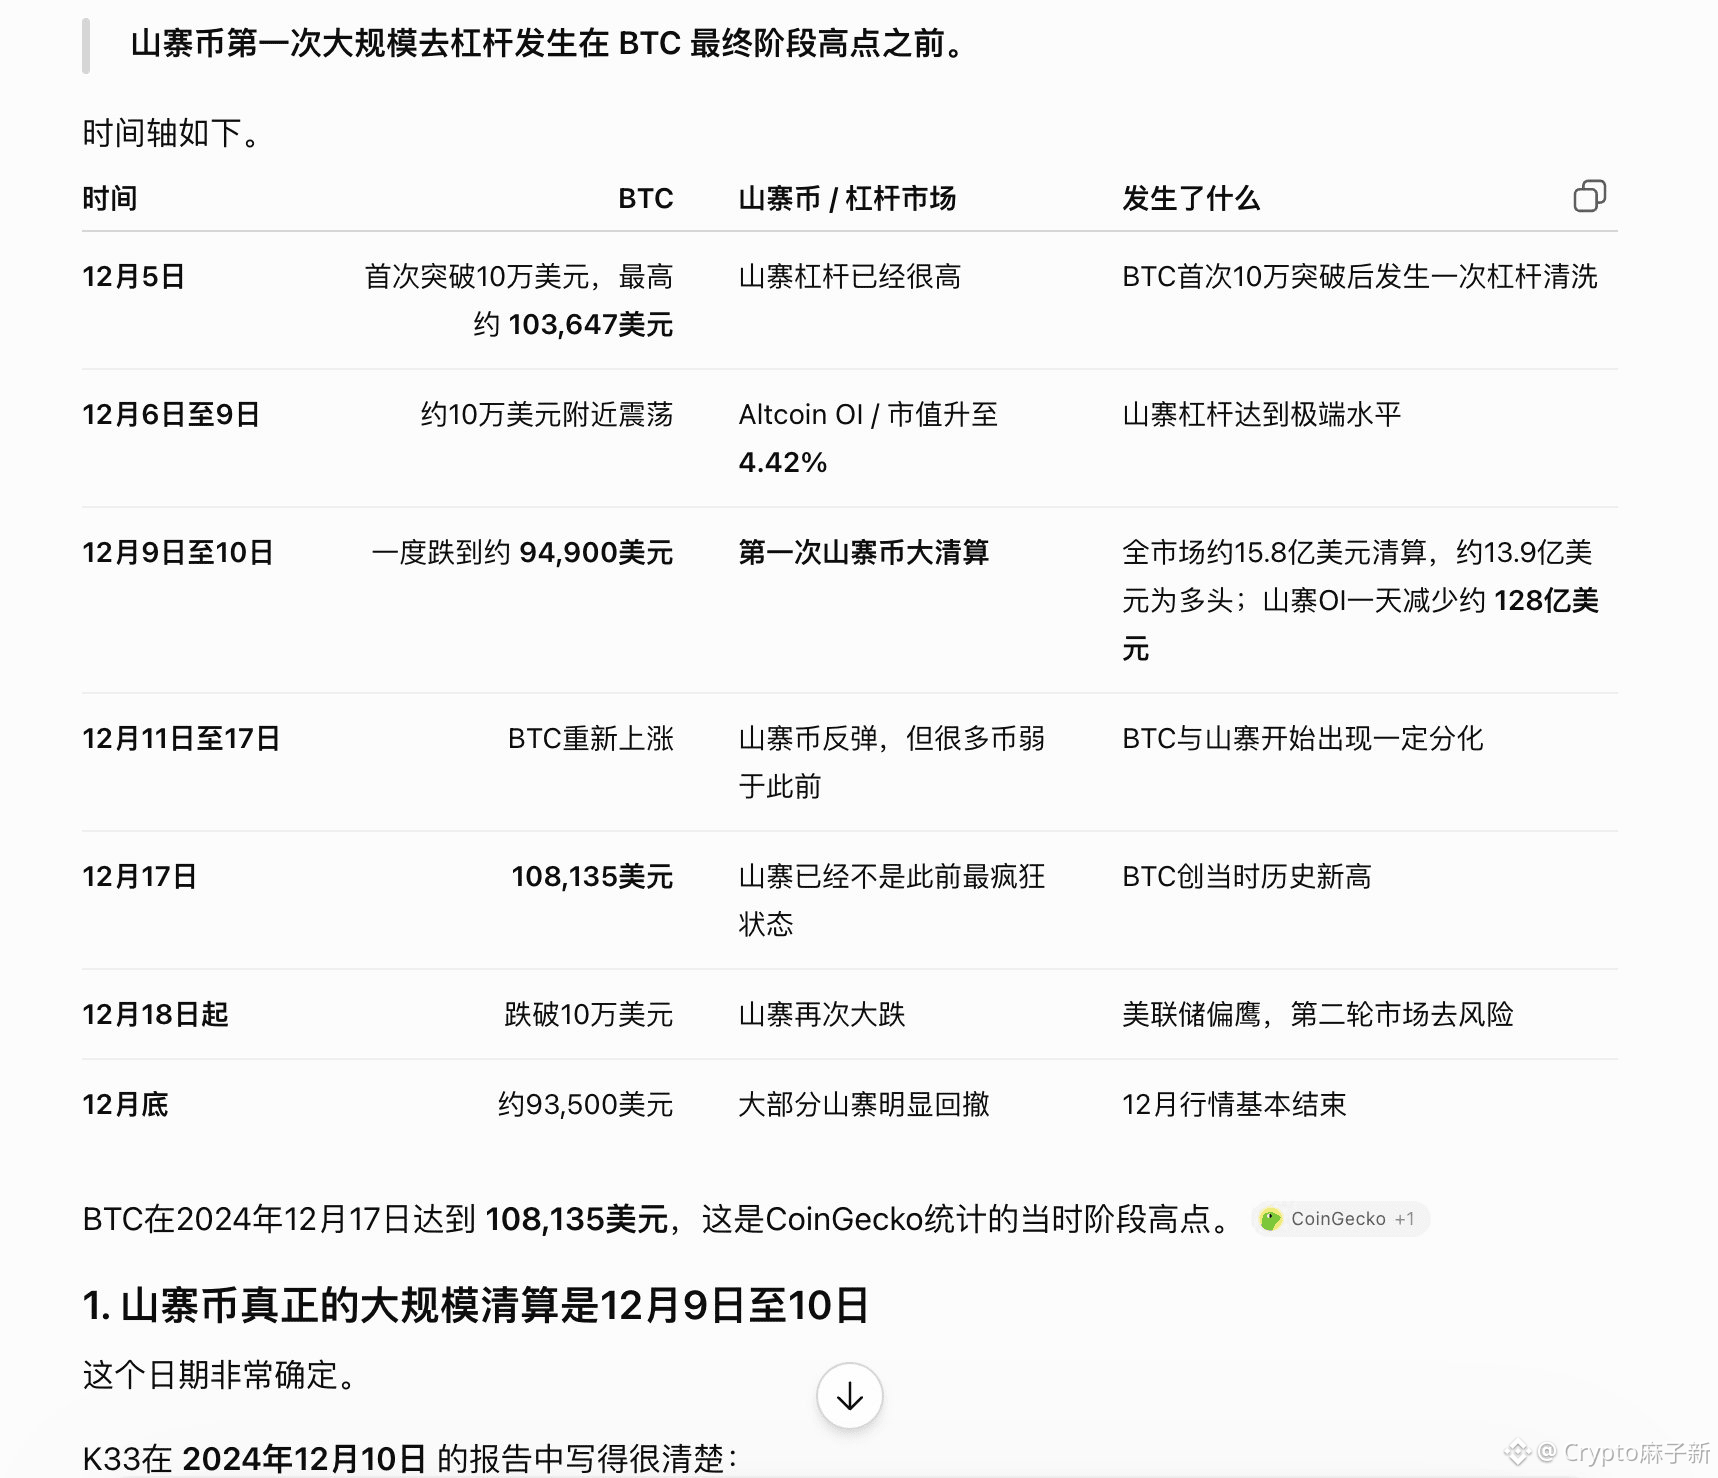
One noteworthy signal is that the open interest in the altcoin market has already overtaken BTC.
What does that mean?
Simply put, leverage in the market is now clearly piling into altcoins. A lot of people aren’t without positions—they’ve already opened long positions in advance, just waiting for a further rally.
A similar situation also appeared in December 2024, after which altcoins directly went through a very sharp deleveraging wave.
So even though I don’t think altcoins have necessarily topped yet, and it’s not impossible for the whole market to rise another 20% afterward, this kind of heavily crowded bullish setup is exactly where sudden downside spikes are most likely to happen.
What’s truly dangerous is often not that the market can’t go up anymore, but that when everyone is waiting for it to keep rising, a fast drop comes first and wipes out the leveraged positions.
So lately, with altcoins, chase less and use less leverage. It’s better to miss a bit than to become the liquidity for the next round of liquidations.
What does that mean?
Simply put, leverage in the market is now clearly piling into altcoins. A lot of people aren’t without positions—they’ve already opened long positions in advance, just waiting for a further rally.
A similar situation also appeared in December 2024, after which altcoins directly went through a very sharp deleveraging wave.
So even though I don’t think altcoins have necessarily topped yet, and it’s not impossible for the whole market to rise another 20% afterward, this kind of heavily crowded bullish setup is exactly where sudden downside spikes are most likely to happen.
What’s truly dangerous is often not that the market can’t go up anymore, but that when everyone is waiting for it to keep rising, a fast drop comes first and wipes out the leveraged positions.
So lately, with altcoins, chase less and use less leverage. It’s better to miss a bit than to become the liquidity for the next round of liquidations.
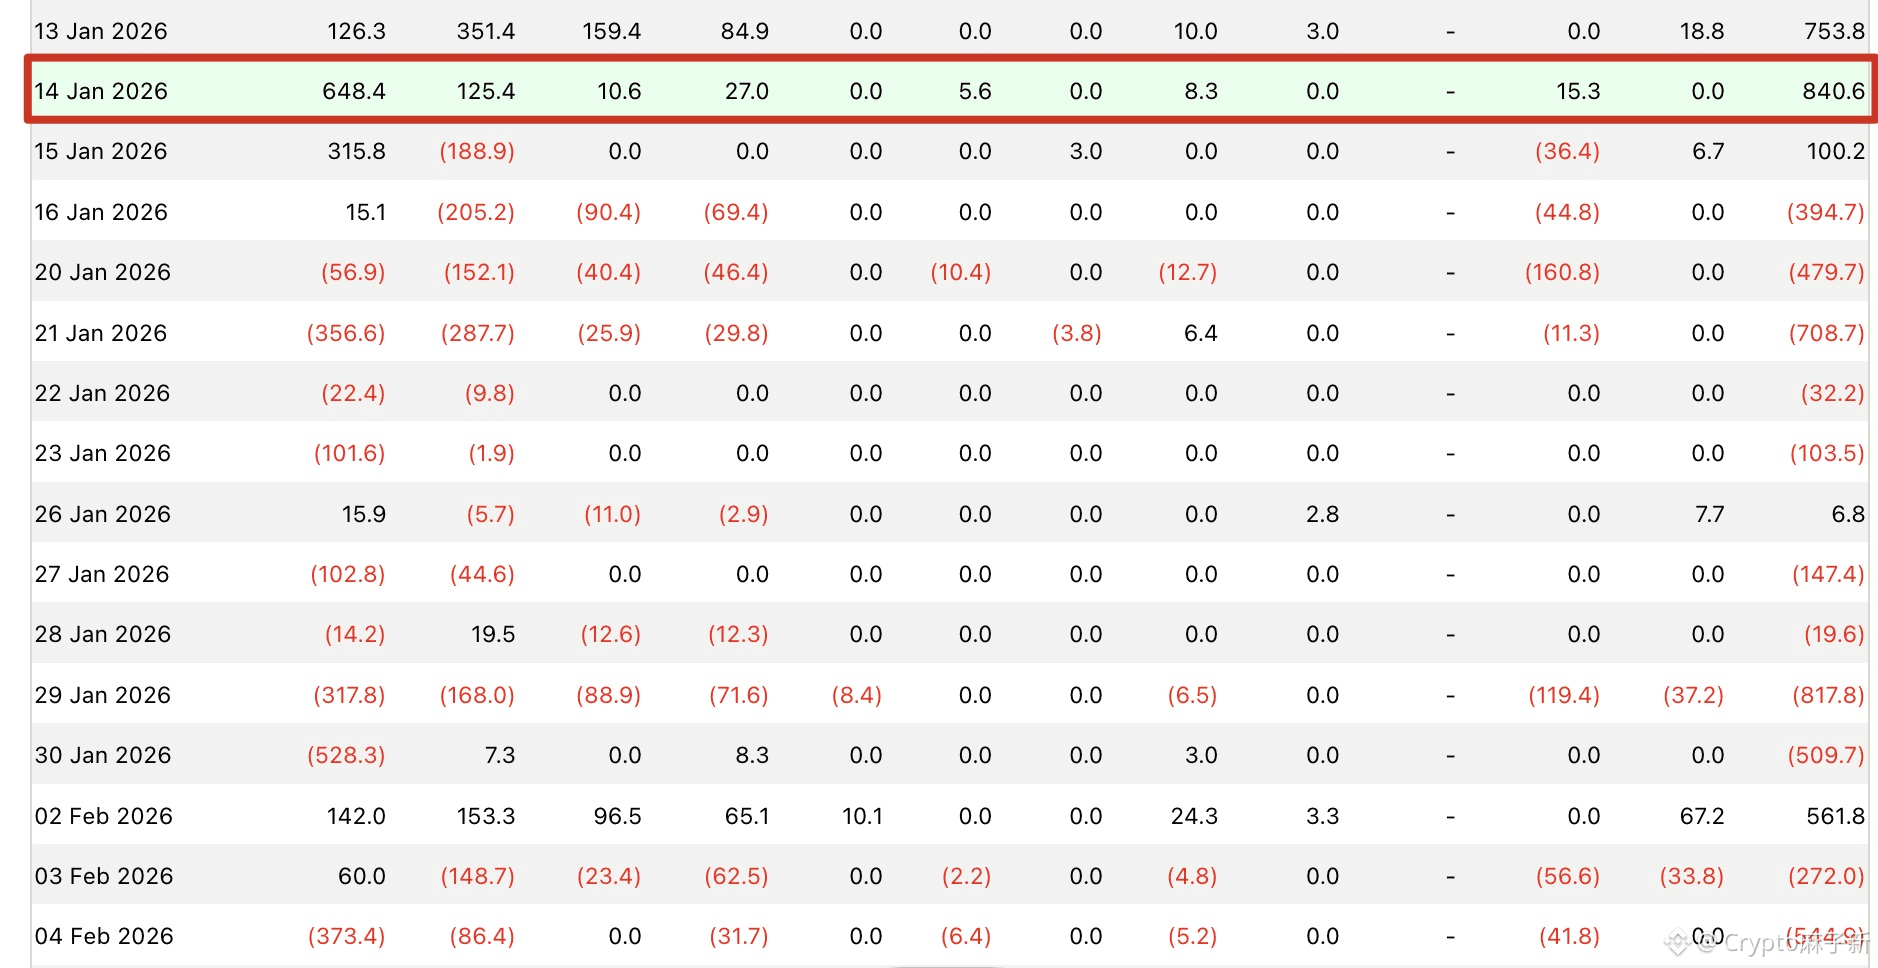
After BTC surged to around 82,400 on September 21, it began to pull back. The price action on the second trading day is quite similar to January 15, and the weekend market has also been getting weaker.
So now we can use ETF data to do a “citing-the-boat-to-find-the-sword” style comparison.
On January 14, BTC ETF net inflows reached $840.6 million, the highest single-day inflow in the first half of the year, but on the 15th it dropped sharply to $100.2 million, on the 16th it turned into net outflows, and then continued to see outflows, with BTC also weakening all the way.
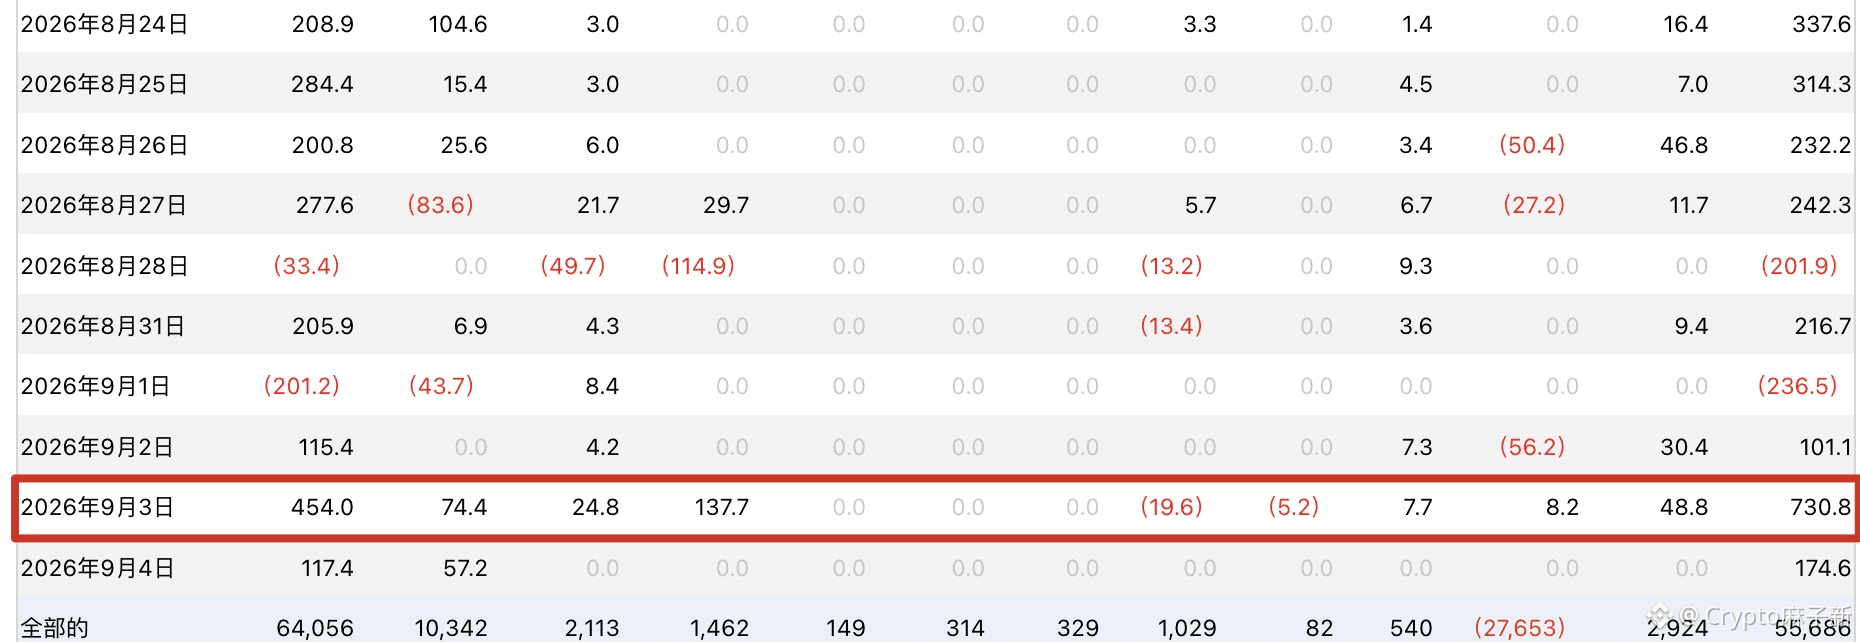
This time is somewhat similar. On September 3, ETF net inflows reached $730.8 million, the highest in the second half of the year and the second highest since January 14, but on September 4 it quickly fell to $174.6 million.
So the ETF data for next Monday and Tuesday will be crucial.
If net inflows keep declining, or even turn into net outflows, it means ETF demand, the main source of buying, is starting to weaken. Then the “citing-the-boat” comparison may hold, and we can refer to the price action after January 14.
Conversely, if inflows return to $300 million to $500 million or even higher, prices will still have support in the short term, and the probability of entering a correction will drop. Simply put, $300 million to $500 million counts as strong inflow; below $300 million is normal inflow; and if even $174.6 million cannot be sustained, then we need to be wary of further weakening in capital flows.
So whether this comparison can work this time depends not only on the candlestick chart; ETF data must also cooperate.
If the comparison fails and ETFs continue to see strong inflows, BTC still has a chance to push toward 82,600 again, or even test 84,200.
But if the comparison succeeds and a correction follows, I think the first stage may still be 15 to 20 days of choppy pullback, after which an accelerated decline cannot be ruled out.
That is the scenario I least want to see.
Because if the January pattern is repeated, the 58,000 to 60,000 support zone may be broken. Once this level gives way, it will not just look bad on price; market confidence in the next trend launch will also be affected.
So for now, don’t rush to guess the top. First watch how ETFs move on Monday and Tuesday. If capital keeps flowing in, the comparison may fail; if capital clearly weakens, then we need to guard against a repeat of January’s script.
So now we can use ETF data to do a “citing-the-boat-to-find-the-sword” style comparison.
On January 14, BTC ETF net inflows reached $840.6 million, the highest single-day inflow in the first half of the year, but on the 15th it dropped sharply to $100.2 million, on the 16th it turned into net outflows, and then continued to see outflows, with BTC also weakening all the way.
This time is somewhat similar. On September 3, ETF net inflows reached $730.8 million, the highest in the second half of the year and the second highest since January 14, but on September 4 it quickly fell to $174.6 million.
So the ETF data for next Monday and Tuesday will be crucial.
If net inflows keep declining, or even turn into net outflows, it means ETF demand, the main source of buying, is starting to weaken. Then the “citing-the-boat” comparison may hold, and we can refer to the price action after January 14.
Conversely, if inflows return to $300 million to $500 million or even higher, prices will still have support in the short term, and the probability of entering a correction will drop. Simply put, $300 million to $500 million counts as strong inflow; below $300 million is normal inflow; and if even $174.6 million cannot be sustained, then we need to be wary of further weakening in capital flows.
So whether this comparison can work this time depends not only on the candlestick chart; ETF data must also cooperate.
If the comparison fails and ETFs continue to see strong inflows, BTC still has a chance to push toward 82,600 again, or even test 84,200.
But if the comparison succeeds and a correction follows, I think the first stage may still be 15 to 20 days of choppy pullback, after which an accelerated decline cannot be ruled out.
That is the scenario I least want to see.
Because if the January pattern is repeated, the 58,000 to 60,000 support zone may be broken. Once this level gives way, it will not just look bad on price; market confidence in the next trend launch will also be affected.
So for now, don’t rush to guess the top. First watch how ETFs move on Monday and Tuesday. If capital keeps flowing in, the comparison may fail; if capital clearly weakens, then we need to guard against a repeat of January’s script.
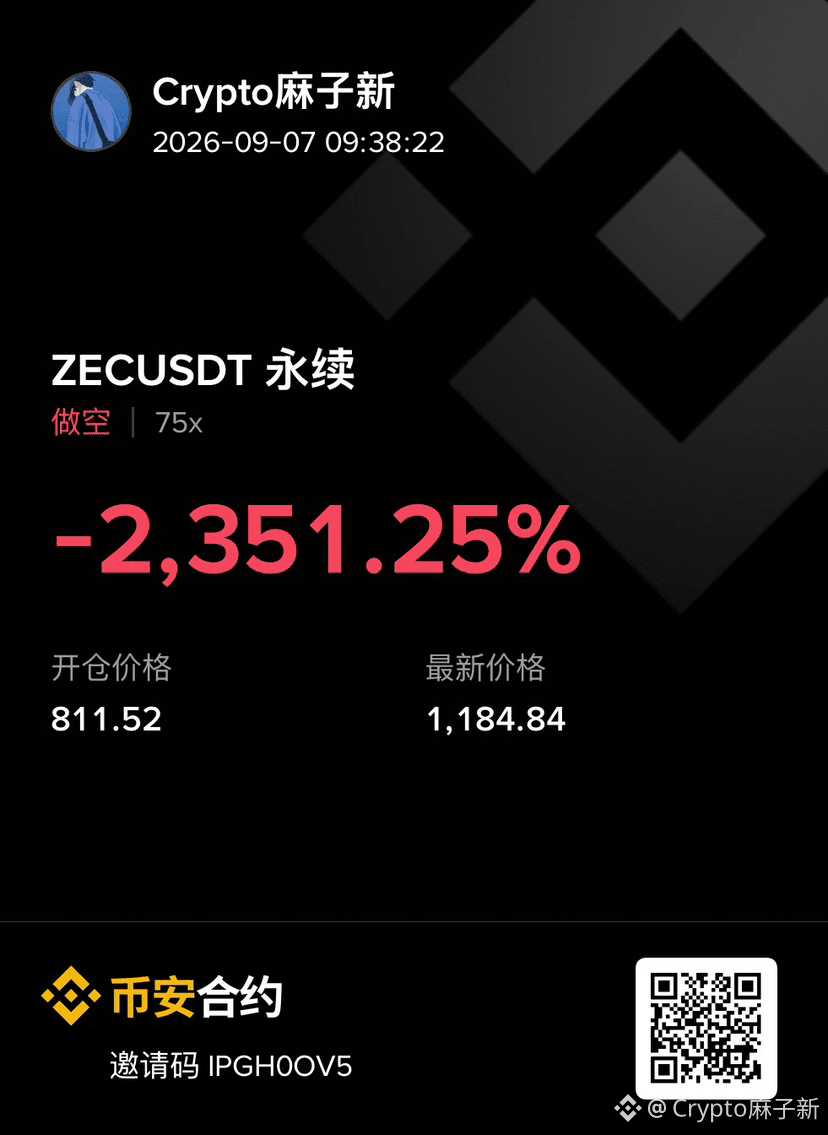
$ZEC The control is really amazing; is this trying to wipe out all the shorts? I casually opened a position, and I had so many positions that I didn’t even realize I still had this one. I don’t know if my liquidation price of 13390 can get me blown out 😆
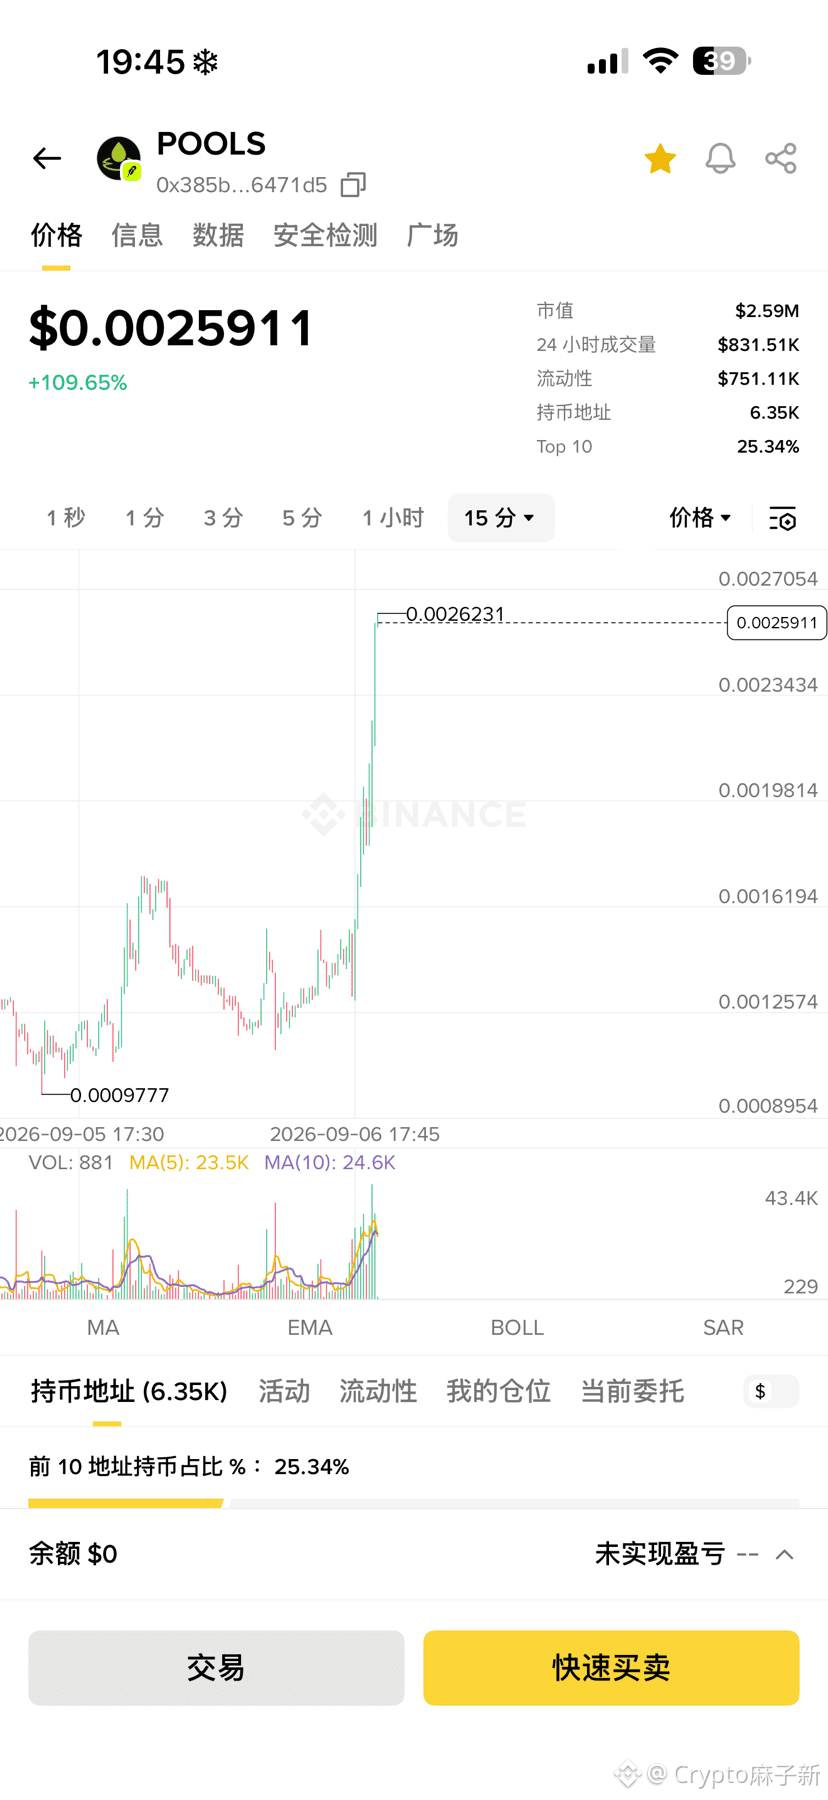
The $UNI mentioned this morning, the official launch of this first-level token pools has already more than doubled. My plan is to take out my principal here and then hold a bit longer to see.
It’s only around a little over 2 million in market cap right now; since the official has stepped in, it shouldn’t stop at just this much, right? For example, if it later reaches more than 20 million in market cap, that would be 20x. If luck is a bit better and it breaks through 200 million in market cap, that would be more than 200x.
It’s only around a little over 2 million in market cap right now; since the official has stepped in, it shouldn’t stop at just this much, right? For example, if it later reaches more than 20 million in market cap, that would be 20x. If luck is a bit better and it breaks through 200 million in market cap, that would be more than 200x.

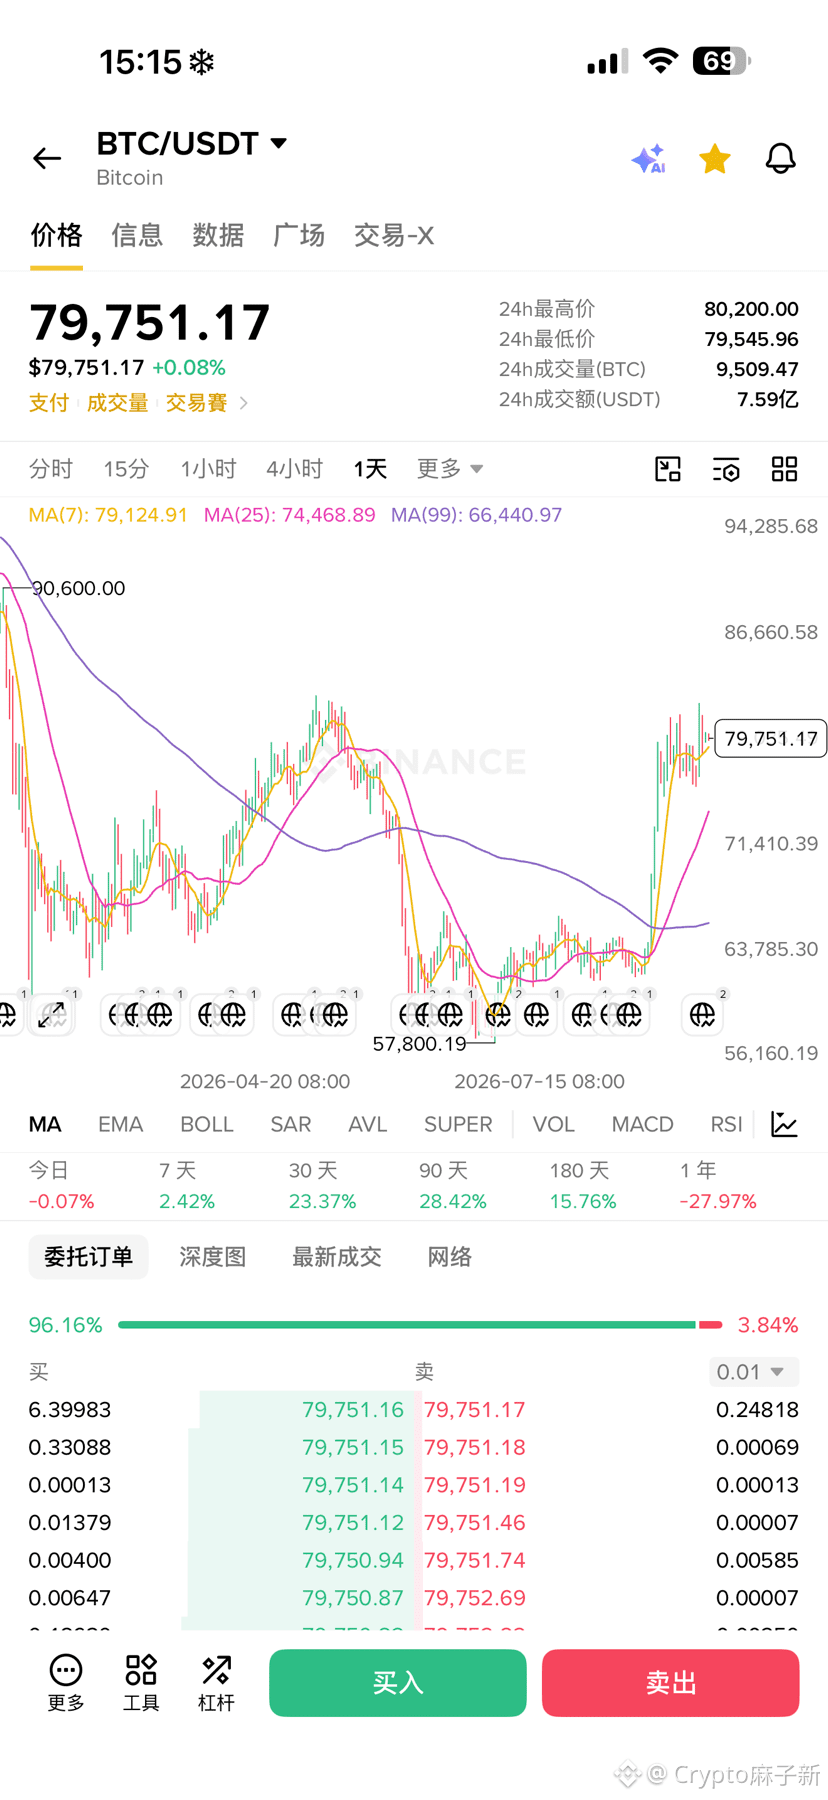
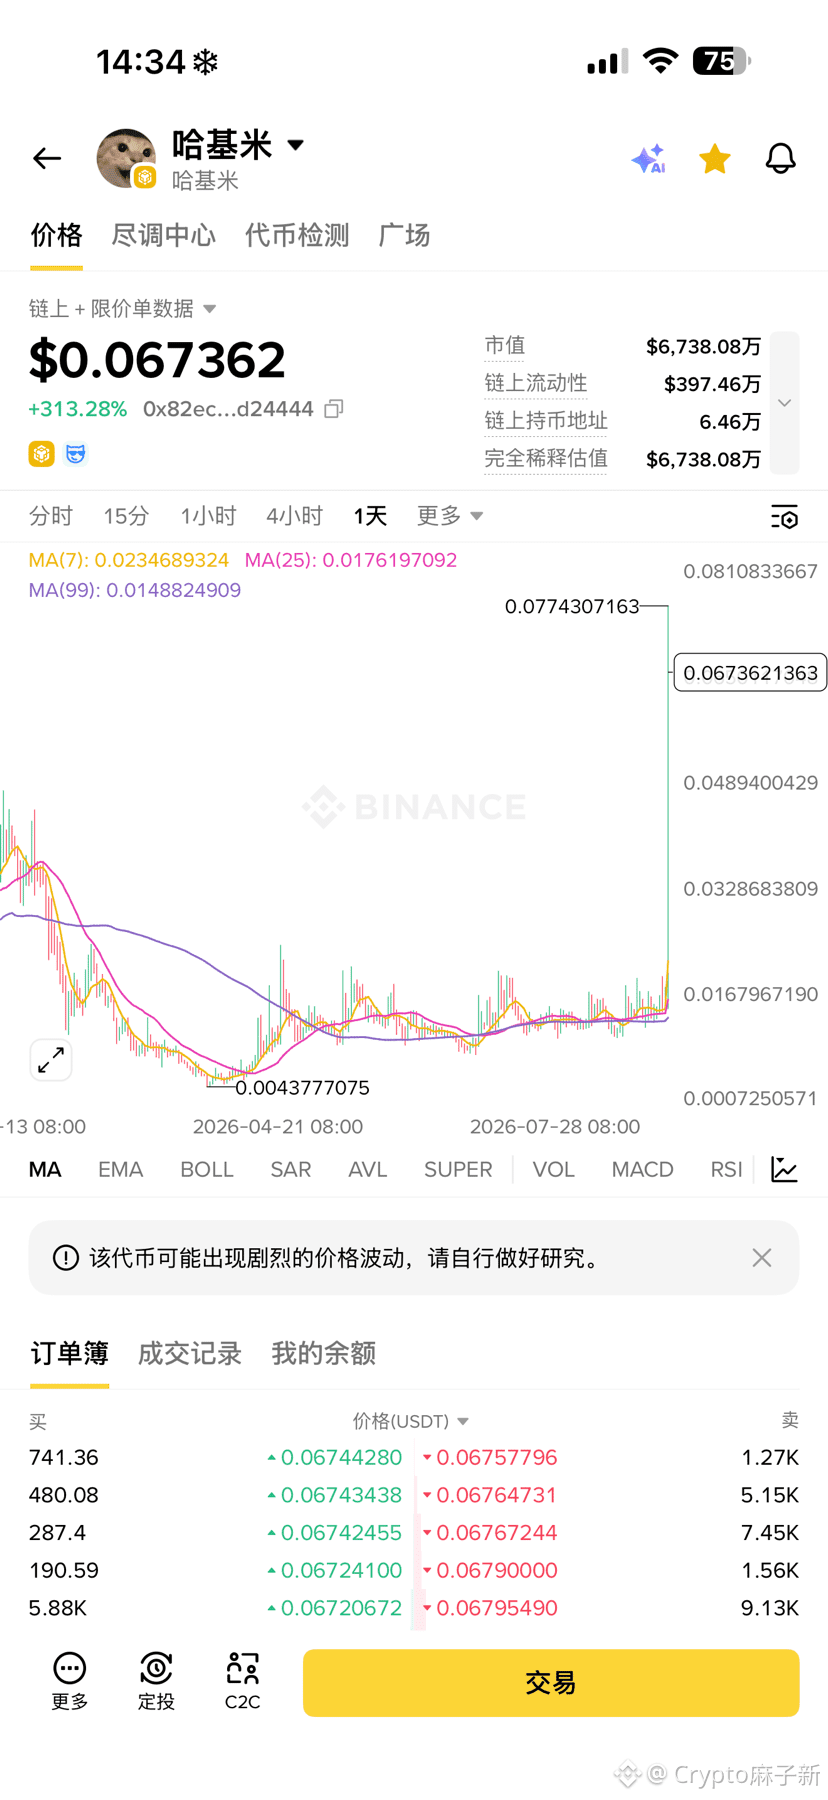
$哈基米 What kind of crazy is Hakimi having? It suddenly did 3x in a single day. Yesterday I was still talking about this thing. A brother asked how $我踏马来了 was, and I was still saying it might not be as good as Hakimi, because this thing is an independent IP.
Too bad I didn’t buy it, but I’ll wait for a pullback and see if I can buy a hand.
Too bad I didn’t buy it, but I’ll wait for a pullback and see if I can buy a hand.

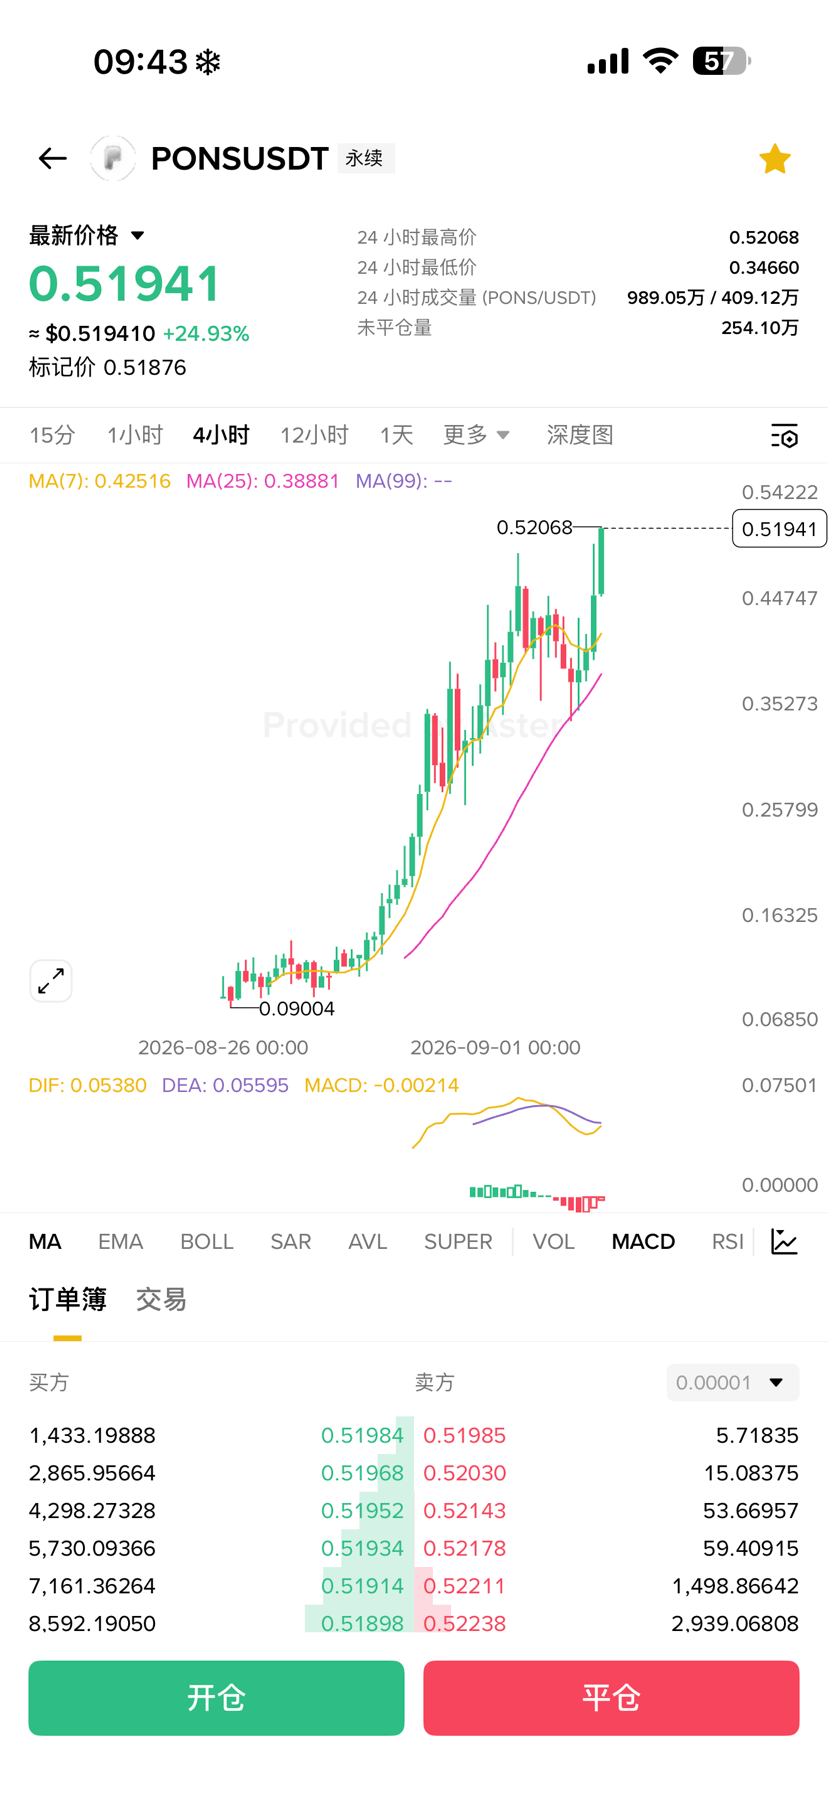
This Robin might really become an innovation in the future, something epoch-making. Once he rises, the platform coins all soar too. UNI, SUSHI, ARB, and BNB should also count as following along, right?
Crypto麻子新
·
--
Robin $pons 昨d年稍微回调了一些又创了新高,可能以后真要像当初多单铭文那样,带来革命性的东西。

Log in to explore more content