News


·
--
Article
Stocks Tick Higher Ahead of ECB Decision and Tech EarningsUS stock futures snapped a three-day losing streak and Treasuries steadied, though risk appetite stayed in check ahead of major tests including tech earnings and a European interest-rate decision, according to Bloomberg. S&P 500 contracts rose 0.2%, trimming the week's loss to less than 1%, while Brent crude held above $101 a barrel as Iran signaled it was preparing for an intensifying war. Shorter-dated Treasuries edged higher as traders awaited US factory-price data, and the dollar barely moved.
Investors face a busy calendar. First is the European Central Bank rate decision, with a hike already priced in and attention on guidance. Oracle's earnings after the close will offer a fresh read on the AI outlook, while the August producer price index could signal the path of inflation and monetary policy. CaixaBank AM's Santiago Mateo Yanguas said the PPI report matters but probably not enough on its own to change the Fed's decision next week, though a significant surprise could still move markets by shifting expectations for the rate path beyond the next meeting, particularly in Treasury yields and rate-sensitive sectors.
Markets largely shrugged off President Donald Trump's promise to give every adult US citizen a $5,000 dividend if Republicans keep control of both houses of Congress. TD Securities' Prashant Newnaha said the pledge may grab headlines, but the market's real focus is on how the US Treasury buyback performs later in the day and what US CPI holds tomorrow. In corporate news, Grab Holdings is in talks to buy a majority stake in Singapore-based buy-now-pay-later platform Atome Financial, according to people familiar with the matter, and Apple unveiled its first foldable smartphone.
Across markets, the Stoxx Europe 600 was little changed, Dow futures rose 0.4% and the MSCI Asia Pacific Index fell 0.4%. The euro was little changed at $1.1641, the yen rose 0.1% to 153.39 per dollar, and the offshore yuan held near 6.7049. Bitcoin slipped 0.3% to $78,074.76 and Ether was little changed at $2,471.78. The 10-year US Treasury yield held at 4.84%, Brent crude rose 0.2% to $101.39 a barrel, and spot gold gained 0.4% to $4,414.83 an ounce.
Stocks Tick Higher Ahead of ECB Decision and Tech Earnings
US stock futures snapped a three-day losing streak and Treasuries steadied, though risk appetite stayed in check ahead of major tests including tech earnings and a European interest-rate decision, according to Bloomberg. S&P 500 contracts rose 0.2%, trimming the week's loss to less than 1%, while Brent crude held above $101 a barrel as Iran signaled it was preparing for an intensifying war. Shorter-dated Treasuries edged higher as traders awaited US factory-price data, and the dollar barely moved.
Investors face a busy calendar. First is the European Central Bank rate decision, with a hike already priced in and attention on guidance. Oracle's earnings after the close will offer a fresh read on the AI outlook, while the August producer price index could signal the path of inflation and monetary policy. CaixaBank AM's Santiago Mateo Yanguas said the PPI report matters but probably not enough on its own to change the Fed's decision next week, though a significant surprise could still move markets by shifting expectations for the rate path beyond the next meeting, particularly in Treasury yields and rate-sensitive sectors.
Markets largely shrugged off President Donald Trump's promise to give every adult US citizen a $5,000 dividend if Republicans keep control of both houses of Congress. TD Securities' Prashant Newnaha said the pledge may grab headlines, but the market's real focus is on how the US Treasury buyback performs later in the day and what US CPI holds tomorrow. In corporate news, Grab Holdings is in talks to buy a majority stake in Singapore-based buy-now-pay-later platform Atome Financial, according to people familiar with the matter, and Apple unveiled its first foldable smartphone.
Across markets, the Stoxx Europe 600 was little changed, Dow futures rose 0.4% and the MSCI Asia Pacific Index fell 0.4%. The euro was little changed at $1.1641, the yen rose 0.1% to 153.39 per dollar, and the offshore yuan held near 6.7049. Bitcoin slipped 0.3% to $78,074.76 and Ether was little changed at $2,471.78. The 10-year US Treasury yield held at 4.84%, Brent crude rose 0.2% to $101.39 a barrel, and spot gold gained 0.4% to $4,414.83 an ounce.
Investors face a busy calendar. First is the European Central Bank rate decision, with a hike already priced in and attention on guidance. Oracle's earnings after the close will offer a fresh read on the AI outlook, while the August producer price index could signal the path of inflation and monetary policy. CaixaBank AM's Santiago Mateo Yanguas said the PPI report matters but probably not enough on its own to change the Fed's decision next week, though a significant surprise could still move markets by shifting expectations for the rate path beyond the next meeting, particularly in Treasury yields and rate-sensitive sectors.
Markets largely shrugged off President Donald Trump's promise to give every adult US citizen a $5,000 dividend if Republicans keep control of both houses of Congress. TD Securities' Prashant Newnaha said the pledge may grab headlines, but the market's real focus is on how the US Treasury buyback performs later in the day and what US CPI holds tomorrow. In corporate news, Grab Holdings is in talks to buy a majority stake in Singapore-based buy-now-pay-later platform Atome Financial, according to people familiar with the matter, and Apple unveiled its first foldable smartphone.
Across markets, the Stoxx Europe 600 was little changed, Dow futures rose 0.4% and the MSCI Asia Pacific Index fell 0.4%. The euro was little changed at $1.1641, the yen rose 0.1% to 153.39 per dollar, and the offshore yuan held near 6.7049. Bitcoin slipped 0.3% to $78,074.76 and Ether was little changed at $2,471.78. The 10-year US Treasury yield held at 4.84%, Brent crude rose 0.2% to $101.39 a barrel, and spot gold gained 0.4% to $4,414.83 an ounce.
66
3
110
4k
·
--
TradFi News | Treasury Buyback Sized at $4-6 Billion Falls Short of What Markets WantedThe US Treasury announced it will purchase at least $4 billion and up to $6 billion in long-term government debt in the first operation of its expanded buyback program, demonstrating its determination to curb recent increases in borrowing costs.Treasuries continued their earlier decline following the announcement, suggesting the size was smaller than some investors had expected.The Sizing Debate Misses What the Execution Record ShowsOne caveat circulating is that the maximum size of a buyback operation does not necessarily mean the Treasury will purchase that amount.The historical record argues against that reading. In buybacks targeting long-term nominal debt, the department typically buys the full amount — since the program was reintroduced in 2024, it has failed to do so only twice across 52 such operations.That is a 96% execution rate. Markets can reasonably price the $6 billion ceiling as the actual figure, which means the disappointment is genuinely about the ceiling being too low rather than uncertainty over follow-through.The gap between $4 billion and $6 billion is also not where the argument sits. Against a Treasury market measured in trillions, neither figure is large enough to move long-end yields through supply mechanics alone. The operation is a signalling exercise, and the signal came in weaker than hoped.Guha: The Question Is Whether Effects Persist Without Fundamental Change"The challenge always lies in whether the effects of these interventions can be sustained without major fundamental changes," said Guha, an economist who previously worked at the Federal Reserve Bank of New York.That is the analytically decisive point, and the program's own history illustrates it.Yields fell after the initial announcement last month. They subsequently rebounded, and the benchmark 10-year reached its highest level since 2023 last week — 4.845%, up from roughly 4.75% in mid-August when Treasury Secretary Scott Bessent said long-dated yields were too high and promised to bring them down.The intervention worked, then stopped working. Nothing about the fiscal position changed in between, which is precisely Guha's argument: an operation that does not address the underlying driver buys time rather than a repricing.The Same Program Drove Bitcoin's Best Week Since 2021For crypto, the reversal matters because the identical policy produced a very different result five weeks ago.Bessent's initial buyback expansion in late August pulled long-end yields down from multi-decade highs, weakened the dollar below its 200-day average and cracked a six-week Bitcoin range. Bitcoin gained 23.6% that week — its second-best since February 2021 — running from roughly $62,000 to $81,265, while gold pushed above $4,600.The debasement trade behind that move rested on an assumption that fiscal deterioration would be met with liquidity support, and that support would flow into scarce assets. What has changed is not the deterioration but the response's efficacy.Stanley Druckenmiller warned in August that governments defending prices against fundamentals always lose. MUFG's Derek Halpenny said the long end would face pressure absent credible fiscal consolidation measures. Both were arguments about the limits of supply management against a solvency question.Critics See a Structural Problem, Not a Sizing OneThe market microstructure objection compounds the fundamentals argument."If Bessent is a buyer of bonds at any price like Saylor is of bitcoin, why would anyone with inventory not sell all the way down?" said CNBC contributor Oliver Renick. A buyer publicly committed to purchasing regardless of price removes the incentive to sell early, allowing holders to wait and sellers to offer at progressively worse levels.Geiger Capital described the resulting position: the market is "calling his bluff, forcing him into a corner to buy even more."If that reading is correct, a larger operation would not have solved the problem. It would have confirmed it.What Comes NextBitcoin traded around $78,500 after giving back gains on the announcement, with US equities slipping to session lows and Brent crude above $101.PPI arrives Thursday and CPI Friday, with headline inflation forecast at 0.4% month-over-month, largely on the energy shock. Markets price 60% odds of a Fed hike on September 16, and officials are already in communications blackout.KPMG chief economist Diane Swonk has argued the setup calls for a cycle rather than a single move, writing that inflation shocks "have moved from being episodic to endemic" and that repetition is teaching firms and households to expect inflation.If supply management cannot suppress long-end yields and the Fed is expected to tighten into an energy shock, the fiscal-versus-growth distinction that has supported Bitcoin's relative strength becomes the entire argument. Its 90-day correlation with the 10-year sits at −0.17 against gold's −0.41.
TradFi News | Treasury Buyback Sized at $4-6 Billion Falls Short of What Markets Wanted
The US Treasury announced it will purchase at least $4 billion and up to $6 billion in long-term government debt in the first operation of its expanded buyback program, demonstrating its determination to curb recent increases in borrowing costs.Treasuries continued their earlier decline following the announcement, suggesting the size was smaller than some investors had expected.The Sizing Debate Misses What the Execution Record ShowsOne caveat circulating is that the maximum size of a buyback operation does not necessarily mean the Treasury will purchase that amount.The historical record argues against that reading. In buybacks targeting long-term nominal debt, the department typically buys the full amount — since the program was reintroduced in 2024, it has failed to do so only twice across 52 such operations.That is a 96% execution rate. Markets can reasonably price the $6 billion ceiling as the actual figure, which means the disappointment is genuinely about the ceiling being too low rather than uncertainty over follow-through.The gap between $4 billion and $6 billion is also not where the argument sits. Against a Treasury market measured in trillions, neither figure is large enough to move long-end yields through supply mechanics alone. The operation is a signalling exercise, and the signal came in weaker than hoped.Guha: The Question Is Whether Effects Persist Without Fundamental Change"The challenge always lies in whether the effects of these interventions can be sustained without major fundamental changes," said Guha, an economist who previously worked at the Federal Reserve Bank of New York.That is the analytically decisive point, and the program's own history illustrates it.Yields fell after the initial announcement last month. They subsequently rebounded, and the benchmark 10-year reached its highest level since 2023 last week — 4.845%, up from roughly 4.75% in mid-August when Treasury Secretary Scott Bessent said long-dated yields were too high and promised to bring them down.The intervention worked, then stopped working. Nothing about the fiscal position changed in between, which is precisely Guha's argument: an operation that does not address the underlying driver buys time rather than a repricing.The Same Program Drove Bitcoin's Best Week Since 2021For crypto, the reversal matters because the identical policy produced a very different result five weeks ago.Bessent's initial buyback expansion in late August pulled long-end yields down from multi-decade highs, weakened the dollar below its 200-day average and cracked a six-week Bitcoin range. Bitcoin gained 23.6% that week — its second-best since February 2021 — running from roughly $62,000 to $81,265, while gold pushed above $4,600.The debasement trade behind that move rested on an assumption that fiscal deterioration would be met with liquidity support, and that support would flow into scarce assets. What has changed is not the deterioration but the response's efficacy.Stanley Druckenmiller warned in August that governments defending prices against fundamentals always lose. MUFG's Derek Halpenny said the long end would face pressure absent credible fiscal consolidation measures. Both were arguments about the limits of supply management against a solvency question.Critics See a Structural Problem, Not a Sizing OneThe market microstructure objection compounds the fundamentals argument."If Bessent is a buyer of bonds at any price like Saylor is of bitcoin, why would anyone with inventory not sell all the way down?" said CNBC contributor Oliver Renick. A buyer publicly committed to purchasing regardless of price removes the incentive to sell early, allowing holders to wait and sellers to offer at progressively worse levels.Geiger Capital described the resulting position: the market is "calling his bluff, forcing him into a corner to buy even more."If that reading is correct, a larger operation would not have solved the problem. It would have confirmed it.What Comes NextBitcoin traded around $78,500 after giving back gains on the announcement, with US equities slipping to session lows and Brent crude above $101.PPI arrives Thursday and CPI Friday, with headline inflation forecast at 0.4% month-over-month, largely on the energy shock. Markets price 60% odds of a Fed hike on September 16, and officials are already in communications blackout.KPMG chief economist Diane Swonk has argued the setup calls for a cycle rather than a single move, writing that inflation shocks "have moved from being episodic to endemic" and that repetition is teaching firms and households to expect inflation.If supply management cannot suppress long-end yields and the Fed is expected to tighten into an energy shock, the fiscal-versus-growth distinction that has supported Bitcoin's relative strength becomes the entire argument. Its 90-day correlation with the 10-year sits at −0.17 against gold's −0.41.
1
2
13
34k
·
--
Apple Raises iPhone Prices in India by Up to 41%According to Jin10, Apple raised prices for its existing iPhone lineup in India by as much as 41%, just hours before the launch of new models. Apple also raised iPhone prices in the U.S. on Wednesday evening, with increases ranging from 10% to 21%, and had previously said it planned to raise iPhone prices globally because memory and storage chip costs keep rising.
Apple Raises iPhone Prices in India by Up to 41%
According to Jin10, Apple raised prices for its existing iPhone lineup in India by as much as 41%, just hours before the launch of new models. Apple also raised iPhone prices in the U.S. on Wednesday evening, with increases ranging from 10% to 21%, and had previously said it planned to raise iPhone prices globally because memory and storage chip costs keep rising.
1
1
6.1k
·
--
Article
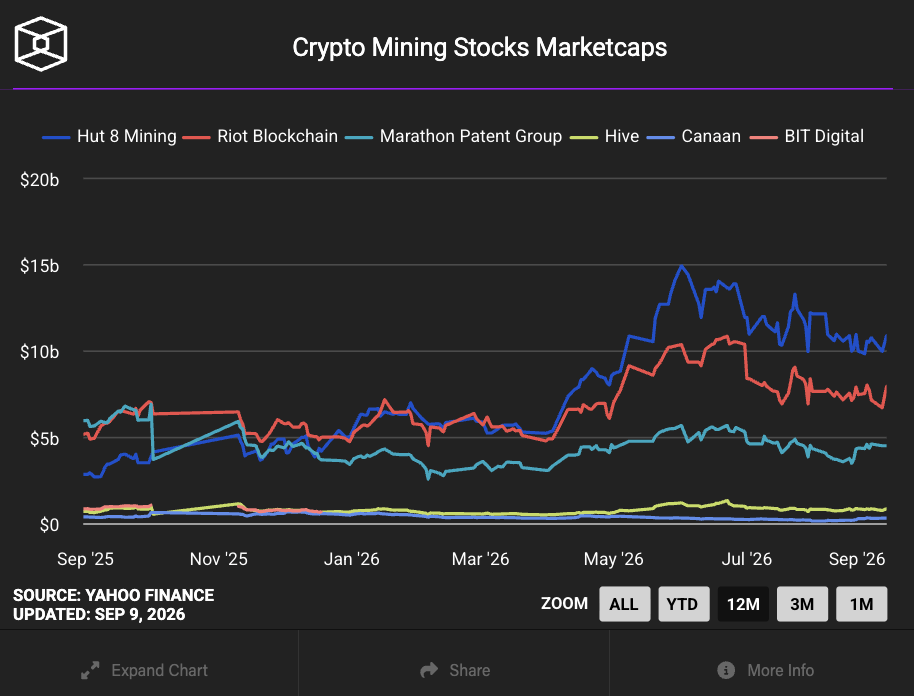
Bitcoin News | Bitcoin Miners Lag 22% BTC Rally With Median Gain of Just 1.8%Bitcoin has risen roughly 22% since August 17, and stocks tied to crypto trading platforms and stablecoins have strengthened alongside it. Mining companies have not.Of 11 Bitcoin mining and related companies analysed, only Canaan outperformed BTC. The other 10 underperformed, with a median gain of just 1.8% across the period.Core Scientific and TeraWulf performed worst, lagging Bitcoin by 27% and 24% respectively.The AI Pivot Has Broken the Hash Price LinkThe explanation is the transformation several miners undertook in recent years — shifting focus toward high-performance computing and AI data center businesses.That pivot supported share prices through the crypto bear market, when hash price economics were punishing. It also diverted attention from Bitcoin mining itself and introduced operational risks that pure miners do not carry.The consequence is visible in this rally. A company deriving a growing share of revenue from GPU cloud contracts does not re-rate on a Bitcoin move, because the marginal buyer is pricing data center cash flows rather than mining margins.That works both ways, and it has cut against the sector this month.AI Exposure Became a Liability When the Trade TurnedThe miners with the largest AI pivots are the ones lagging hardest, and the timing explains why.The AI complex has been under pressure through the same period Bitcoin rallied. Nvidia guided third-quarter gross margin to 74% from 75% — the first sequential decline of the cycle — citing memory, power, land and infrastructure costs, with a first-quarter price increase planned. Copper set a record above $6.80 per pound, a direct data center input.Cipher Mining fell 6% and TeraWulf 3% on Wednesday alone as AI infrastructure names gave back gains.The Wall Street Journal reported Nvidia paused some deals in a financing initiative extending credit support to AI cloud providers in exchange for revenue share — a facility that matters disproportionately to smaller operators in this cohort.So the pivot exposed miners to a sector selling off while removing their leverage to the asset that was rallying.Rate Sensitivity Compounds ItThere is a second channel the source analysis does not name.Data center buildout is capital intensive with cash flows weighted years forward, which makes these companies long-duration equities. The 10-year Treasury yield reached 4.845% this week, its highest since October 2023, and the two-year hit 4.427%.Rising discount rates compress those valuations more severely than they compress a pure miner's, whose revenue is tied to a spot commodity.Miners running the dual strategy therefore absorbed three headwinds at once: AI sector weakness, input cost inflation, and a rising discount rate applied to long-dated cash flows. The Dual Strategy May Still Be Right StructurallyThe counterargument is about cycles rather than this quarter.The combination of AI data centers and Bitcoin mining may prove a long-term advantage: mining benefits during bull markets while data centers strengthen the balance sheet during crypto downturns.The contract book supports that. IREN holds $2.8 billion across Microsoft, Nvidia, Perplexity and Figure AI. Hut 8 has its Beacon Point lease. HIVE signed a $350 million GPU cloud deal lifting contracted annual recurring revenue to roughly $180 million.Those are multi-year revenue commitments that do not evaporate on a bad month for AI equities. What the current lag demonstrates is not that the strategy is wrong, but that it costs the sector its beta to Bitcoin — which is the exact thing many mining shareholders were buying the stocks for.Canaan Is the Exception That Proves the StructureCanaan outperforming Bitcoin while the diversified names lagged is consistent with the mechanism rather than a contradiction of it.Canaan manufactures mining hardware. Its exposure runs to miner capital expenditure and hash rate expansion, which respond to Bitcoin price with a lag but respond directly. It carries no AI data center business to dilute that.The company reported pre-market Monday at an estimated loss of $0.14 per share.What Would Restore the CorrelationTwo conditions would narrow the gap.The first is Bitcoin holding above levels that make mining economics compelling enough to matter to earnings again. Bitcoin traded around $78,500 after giving back gains on the Treasury buyback's failure to suppress yields.The second is stabilisation in the AI trade, which requires resolution of the margin question Investing.com's Thomas Monteiro identified after Nvidia's print — how much of that growth translates into margins and cash flow.Neither is likely to resolve before Friday's CPI and the September 16 Fed decision, with markets pricing 60% odds of a hike, according to The Block.
Bitcoin News | Bitcoin Miners Lag 22% BTC Rally With Median Gain of Just 1.8%
Bitcoin has risen roughly 22% since August 17, and stocks tied to crypto trading platforms and stablecoins have strengthened alongside it. Mining companies have not.Of 11 Bitcoin mining and related companies analysed, only Canaan outperformed BTC. The other 10 underperformed, with a median gain of just 1.8% across the period.Core Scientific and TeraWulf performed worst, lagging Bitcoin by 27% and 24% respectively.The AI Pivot Has Broken the Hash Price LinkThe explanation is the transformation several miners undertook in recent years — shifting focus toward high-performance computing and AI data center businesses.That pivot supported share prices through the crypto bear market, when hash price economics were punishing. It also diverted attention from Bitcoin mining itself and introduced operational risks that pure miners do not carry.The consequence is visible in this rally. A company deriving a growing share of revenue from GPU cloud contracts does not re-rate on a Bitcoin move, because the marginal buyer is pricing data center cash flows rather than mining margins.That works both ways, and it has cut against the sector this month.AI Exposure Became a Liability When the Trade TurnedThe miners with the largest AI pivots are the ones lagging hardest, and the timing explains why.The AI complex has been under pressure through the same period Bitcoin rallied. Nvidia guided third-quarter gross margin to 74% from 75% — the first sequential decline of the cycle — citing memory, power, land and infrastructure costs, with a first-quarter price increase planned. Copper set a record above $6.80 per pound, a direct data center input.Cipher Mining fell 6% and TeraWulf 3% on Wednesday alone as AI infrastructure names gave back gains.The Wall Street Journal reported Nvidia paused some deals in a financing initiative extending credit support to AI cloud providers in exchange for revenue share — a facility that matters disproportionately to smaller operators in this cohort.So the pivot exposed miners to a sector selling off while removing their leverage to the asset that was rallying.Rate Sensitivity Compounds ItThere is a second channel the source analysis does not name.Data center buildout is capital intensive with cash flows weighted years forward, which makes these companies long-duration equities. The 10-year Treasury yield reached 4.845% this week, its highest since October 2023, and the two-year hit 4.427%.Rising discount rates compress those valuations more severely than they compress a pure miner's, whose revenue is tied to a spot commodity.Miners running the dual strategy therefore absorbed three headwinds at once: AI sector weakness, input cost inflation, and a rising discount rate applied to long-dated cash flows. The Dual Strategy May Still Be Right StructurallyThe counterargument is about cycles rather than this quarter.The combination of AI data centers and Bitcoin mining may prove a long-term advantage: mining benefits during bull markets while data centers strengthen the balance sheet during crypto downturns.The contract book supports that. IREN holds $2.8 billion across Microsoft, Nvidia, Perplexity and Figure AI. Hut 8 has its Beacon Point lease. HIVE signed a $350 million GPU cloud deal lifting contracted annual recurring revenue to roughly $180 million.Those are multi-year revenue commitments that do not evaporate on a bad month for AI equities. What the current lag demonstrates is not that the strategy is wrong, but that it costs the sector its beta to Bitcoin — which is the exact thing many mining shareholders were buying the stocks for.Canaan Is the Exception That Proves the StructureCanaan outperforming Bitcoin while the diversified names lagged is consistent with the mechanism rather than a contradiction of it.Canaan manufactures mining hardware. Its exposure runs to miner capital expenditure and hash rate expansion, which respond to Bitcoin price with a lag but respond directly. It carries no AI data center business to dilute that.The company reported pre-market Monday at an estimated loss of $0.14 per share.What Would Restore the CorrelationTwo conditions would narrow the gap.The first is Bitcoin holding above levels that make mining economics compelling enough to matter to earnings again. Bitcoin traded around $78,500 after giving back gains on the Treasury buyback's failure to suppress yields.The second is stabilisation in the AI trade, which requires resolution of the margin question Investing.com's Thomas Monteiro identified after Nvidia's print — how much of that growth translates into margins and cash flow.Neither is likely to resolve before Friday's CPI and the September 16 Fed decision, with markets pricing 60% odds of a hike, according to The Block.
2
6.1k
·
--

Article
Apple Debuts Foldable iPhone Duo in Its Biggest-Ever Device RevampApple unveiled its first foldable smartphone on Wednesday, betting a new category can reenergize growth in its biggest-selling lineup, according to Bloomberg. Newly appointed Chief Executive Officer John Ternus said the device, called the iPhone Duo, will improve on rivals' foldables, mocking competing handsets as "two phones awkwardly stuck together." The Duo unfolds to a 7.6-inch screen — the largest ever on an iPhone — with an outer 5.4-inch display for use when folded, and it will work with the iPad's Apple Pencil later this year. Apple designed it for a sturdier feel with less of a crease, and built software that blends both screens during use.
Sitting at the top of the iPhone lineup, the Duo starts at $1,999 for 256 gigabytes of storage and reaches $3,199 for a 2-terabyte version. Preorders begin Oct. 16 in more than 70 countries and regions, with availability from Oct. 23. The foldable marks the biggest design change to the iPhone in its nearly two-decade history, but the widely anticipated announcement drew a tepid response, and the shares were little changed in New York, closing at $315.34. Ternus opened the event by casting the iPhone as staying at the center of the AI world — an "intelligent personal hub" — though the new phones bring no major AI capabilities of their own, with Apple instead pitching its updated Siri and Apple Intelligence features.
Apple also refreshed its pro line: the iPhone 18 Pro and Pro Max share the Duo's faster A20 chip and offer the longest battery life in iPhone history, at 45 hours of video playback on the larger model and 36 on the smaller, versus 31 hours for the Duo's interior display. The company raised prices on the pro models by $100, to $1,199 for the 18 Pro and $1,299 for the Pro Max, both starting at 256 gigabytes, with preorders Sept. 12 and sales Sept. 18. A new entry-level iPhone 18 was held back for a spring debut alongside a cheaper 18e and the slim iPhone Air 2, Bloomberg has reported.
The new AirPods 5 come in a $129 base model and a $149 version with longer battery life and stem swipe controls, while the AirPods Pro were left unchanged. Apple also updated its Watch Series 12 and Ultra 4 with more powerful S11 chips and audio features such as Live Rewind, which replays the last 15 seconds of speech, and Siri Recaps, which summarizes a user's conversations. The event doubled as a debut for Ternus, who took the helm Sept. 1, with longtime CEO Tim Cook staying on as executive chairman and seated in the audience.
Apple Debuts Foldable iPhone Duo in Its Biggest-Ever Device Revamp
Apple unveiled its first foldable smartphone on Wednesday, betting a new category can reenergize growth in its biggest-selling lineup, according to Bloomberg. Newly appointed Chief Executive Officer John Ternus said the device, called the iPhone Duo, will improve on rivals' foldables, mocking competing handsets as "two phones awkwardly stuck together." The Duo unfolds to a 7.6-inch screen — the largest ever on an iPhone — with an outer 5.4-inch display for use when folded, and it will work with the iPad's Apple Pencil later this year. Apple designed it for a sturdier feel with less of a crease, and built software that blends both screens during use.
Sitting at the top of the iPhone lineup, the Duo starts at $1,999 for 256 gigabytes of storage and reaches $3,199 for a 2-terabyte version. Preorders begin Oct. 16 in more than 70 countries and regions, with availability from Oct. 23. The foldable marks the biggest design change to the iPhone in its nearly two-decade history, but the widely anticipated announcement drew a tepid response, and the shares were little changed in New York, closing at $315.34. Ternus opened the event by casting the iPhone as staying at the center of the AI world — an "intelligent personal hub" — though the new phones bring no major AI capabilities of their own, with Apple instead pitching its updated Siri and Apple Intelligence features.
Apple also refreshed its pro line: the iPhone 18 Pro and Pro Max share the Duo's faster A20 chip and offer the longest battery life in iPhone history, at 45 hours of video playback on the larger model and 36 on the smaller, versus 31 hours for the Duo's interior display. The company raised prices on the pro models by $100, to $1,199 for the 18 Pro and $1,299 for the Pro Max, both starting at 256 gigabytes, with preorders Sept. 12 and sales Sept. 18. A new entry-level iPhone 18 was held back for a spring debut alongside a cheaper 18e and the slim iPhone Air 2, Bloomberg has reported.
The new AirPods 5 come in a $129 base model and a $149 version with longer battery life and stem swipe controls, while the AirPods Pro were left unchanged. Apple also updated its Watch Series 12 and Ultra 4 with more powerful S11 chips and audio features such as Live Rewind, which replays the last 15 seconds of speech, and Siri Recaps, which summarizes a user's conversations. The event doubled as a debut for Ternus, who took the helm Sept. 1, with longtime CEO Tim Cook staying on as executive chairman and seated in the audience.
Sitting at the top of the iPhone lineup, the Duo starts at $1,999 for 256 gigabytes of storage and reaches $3,199 for a 2-terabyte version. Preorders begin Oct. 16 in more than 70 countries and regions, with availability from Oct. 23. The foldable marks the biggest design change to the iPhone in its nearly two-decade history, but the widely anticipated announcement drew a tepid response, and the shares were little changed in New York, closing at $315.34. Ternus opened the event by casting the iPhone as staying at the center of the AI world — an "intelligent personal hub" — though the new phones bring no major AI capabilities of their own, with Apple instead pitching its updated Siri and Apple Intelligence features.
Apple also refreshed its pro line: the iPhone 18 Pro and Pro Max share the Duo's faster A20 chip and offer the longest battery life in iPhone history, at 45 hours of video playback on the larger model and 36 on the smaller, versus 31 hours for the Duo's interior display. The company raised prices on the pro models by $100, to $1,199 for the 18 Pro and $1,299 for the Pro Max, both starting at 256 gigabytes, with preorders Sept. 12 and sales Sept. 18. A new entry-level iPhone 18 was held back for a spring debut alongside a cheaper 18e and the slim iPhone Air 2, Bloomberg has reported.
The new AirPods 5 come in a $129 base model and a $149 version with longer battery life and stem swipe controls, while the AirPods Pro were left unchanged. Apple also updated its Watch Series 12 and Ultra 4 with more powerful S11 chips and audio features such as Live Rewind, which replays the last 15 seconds of speech, and Siri Recaps, which summarizes a user's conversations. The event doubled as a debut for Ternus, who took the helm Sept. 1, with longtime CEO Tim Cook staying on as executive chairman and seated in the audience.
Voting
Apple's $1,999 foldable iPhone — can it win the market?
Yes — Apple polish beats early foldables
No — too late, rivals own this space
Price is brutal, I'll pass
Take my money, day-one preorder 👀
51 votes • Voting
5
8.4k
·
--
TSMC Reports August Revenue of NT$514.8 Billion, Up 53.3% Year Over YearTSMC reported August revenue of NT$514.8 billion, up 53.3% from a year earlier. According to ChainCatcher, the company said cumulative revenue from January to August 2026 reached about NT$3.38687 trillion, compared with about NT$2.432 trillion in the same period of 2025, an increase of 39.3%. The company added that revenue for the first eight months rose by more than NT$950 billion from a year earlier.
TSMC Reports August Revenue of NT$514.8 Billion, Up 53.3% Year Over Year
TSMC reported August revenue of NT$514.8 billion, up 53.3% from a year earlier. According to ChainCatcher, the company said cumulative revenue from January to August 2026 reached about NT$3.38687 trillion, compared with about NT$2.432 trillion in the same period of 2025, an increase of 39.3%. The company added that revenue for the first eight months rose by more than NT$950 billion from a year earlier.
1.2k
·
--
Binance to Delist Pax Dollar (USDP) Across Spot and Related ServicesAccording to the announcement from Binance, the exchange will delist Pax Dollar (USDP) and cease trading on all spot trading pairs at 2026-09-24 03:00 (UTC). Binance said the decision follows its periodic review of listed digital assets, during which it assesses factors including team commitment, development activity, trading volume and liquidity, network stability and safety, public communication, responsiveness to due diligence requests, evidence of unethical or fraudulent conduct, regulatory requirements, token supply changes, ownership structure changes, and community sentiment. After trading stops, all open orders will be removed automatically. Binance Spot Copy Trading will delist the affected spot trading pairs on 2026-09-17 03:00 (UTC), and any outstanding assets will be force-sold at market price or moved to the Spot Account if the amount is unsellable. Binance will also terminate Trading Bots services for the affected spot trading pairs at 2026-09-24 03:00 (UTC), where applicable. Deposits of USDP will not be credited after 2026-09-25 03:00 (UTC), and withdrawals will not be supported after 2026-11-24 03:00 (UTC). According to the announcement from Binance, the delisting will also affect several other products and services tied to USDP. Binance Simple Earn will delist the token after 2026-09-17 07:00 (UTC), with Flexible and Locked Products positions either redeemed by users beforehand or automatically redeemed and transferred to Spot Accounts with accrued rewards. Binance Dual Investment will stop supporting USDP, with new subscriptions ending on the subsequent Friday at 08:00 (UTC) and unsettled subscriptions refunded on the subsequent Friday at 08:00 (UTC). Binance Pool will cease support for mining USDP at 2026-09-16 3:00 (UTC), with final payment settled on the following day. VIP Loan and Flexible Loan will close all outstanding loan positions for USDP at 2026-09-16 07:00 (UTC), while Binance Margin will delist USDP from Cross, Isolated and Portfolio Margin at 2026-09-16 10:00 (UTC) and suspend borrowings at 2026-09-11 06:00 (UTC). Binance Convert, Convert Low-Value Assets, Buy & Sell Crypto, Gift Card and Pay will also remove USDP on their respective schedules.
Binance to Delist Pax Dollar (USDP) Across Spot and Related Services
According to the announcement from Binance, the exchange will delist Pax Dollar (USDP) and cease trading on all spot trading pairs at 2026-09-24 03:00 (UTC). Binance said the decision follows its periodic review of listed digital assets, during which it assesses factors including team commitment, development activity, trading volume and liquidity, network stability and safety, public communication, responsiveness to due diligence requests, evidence of unethical or fraudulent conduct, regulatory requirements, token supply changes, ownership structure changes, and community sentiment. After trading stops, all open orders will be removed automatically. Binance Spot Copy Trading will delist the affected spot trading pairs on 2026-09-17 03:00 (UTC), and any outstanding assets will be force-sold at market price or moved to the Spot Account if the amount is unsellable. Binance will also terminate Trading Bots services for the affected spot trading pairs at 2026-09-24 03:00 (UTC), where applicable. Deposits of USDP will not be credited after 2026-09-25 03:00 (UTC), and withdrawals will not be supported after 2026-11-24 03:00 (UTC). According to the announcement from Binance, the delisting will also affect several other products and services tied to USDP. Binance Simple Earn will delist the token after 2026-09-17 07:00 (UTC), with Flexible and Locked Products positions either redeemed by users beforehand or automatically redeemed and transferred to Spot Accounts with accrued rewards. Binance Dual Investment will stop supporting USDP, with new subscriptions ending on the subsequent Friday at 08:00 (UTC) and unsettled subscriptions refunded on the subsequent Friday at 08:00 (UTC). Binance Pool will cease support for mining USDP at 2026-09-16 3:00 (UTC), with final payment settled on the following day. VIP Loan and Flexible Loan will close all outstanding loan positions for USDP at 2026-09-16 07:00 (UTC), while Binance Margin will delist USDP from Cross, Isolated and Portfolio Margin at 2026-09-16 10:00 (UTC) and suspend borrowings at 2026-09-11 06:00 (UTC). Binance Convert, Convert Low-Value Assets, Buy & Sell Crypto, Gift Card and Pay will also remove USDP on their respective schedules.
1
1.1k
·
--

Article
Binance Simple Earn Will Launch RLUSD Flexible Products Promotion With 200,000 RLUSD RewardsAccording to the [announcement](https://www.binance.com/en/support/announcement/detail/c3fdde57f58a444fb98ee2902f870eb9) from Binance, Binance Simple Earn will launch a promotion for RLUSD Simple Earn Products, giving eligible users who make new subscriptions to RLUSD Flexible Products during the Promotion Period a chance to share 200,000 RLUSD in rewards. The Promotion Period runs from 2026-09-11 00:00 (UTC) to 2026-09-24 23:59 (UTC). Users who subscribe at least an additional 500 RLUSD to Flexible Products will be ranked by Total Campaign Points on a leaderboard, with rewards distributed across multiple ranking tiers. The top-ranked participant will receive 40,000 RLUSD, while other eligible users can receive rewards ranging from 20,000 RLUSD for second place to 50 RLUSD for ranks 501st to 800th. Binance said the campaign is tied to RLUSD Flexible Products subscriptions and that points are based on subscription activity, redemption deductions, and holding snapshots. The announcement also said other RLUSD campaigns are intended to follow at the end of this one.
Campaign Details: Total Campaign Points are calculated using Task Points multiplied by a Promotion Period Multiplier, plus Holding Snapshot Points. Task Points are based on the USD value of subscriptions and redemptions, with 2 points awarded per $1 equivalent subscribed to RLUSD Flexible Products and 2 points deducted for every $1 redeemed. The Promotion Period Multiplier starts at 14x on Day 1 and decreases by 1 each day until the last day of the Promotion Period. Holding Snapshot Points are calculated from the total USD value of RLUSD Flexible Product holdings multiplied by 30, using a snapshot taken at 2026-09-08 23:59:59 (UTC). Binance said only Auto-Subscribe and manual subscriptions count as eligible subscriptions for Flexible Products. If two or more participants have the same final score, the earlier participant will rank higher based on participation time. Rewards are scheduled to be distributed by 2026-10-08 23:59 (UTC), and eligible users can view them in their Spot Account after distribution.
Binance Simple Earn Will Launch RLUSD Flexible Products Promotion With 200,000 RLUSD Rewards
According to the announcement from Binance, Binance Simple Earn will launch a promotion for RLUSD Simple Earn Products, giving eligible users who make new subscriptions to RLUSD Flexible Products during the Promotion Period a chance to share 200,000 RLUSD in rewards. The Promotion Period runs from 2026-09-11 00:00 (UTC) to 2026-09-24 23:59 (UTC). Users who subscribe at least an additional 500 RLUSD to Flexible Products will be ranked by Total Campaign Points on a leaderboard, with rewards distributed across multiple ranking tiers. The top-ranked participant will receive 40,000 RLUSD, while other eligible users can receive rewards ranging from 20,000 RLUSD for second place to 50 RLUSD for ranks 501st to 800th. Binance said the campaign is tied to RLUSD Flexible Products subscriptions and that points are based on subscription activity, redemption deductions, and holding snapshots. The announcement also said other RLUSD campaigns are intended to follow at the end of this one.
Campaign Details: Total Campaign Points are calculated using Task Points multiplied by a Promotion Period Multiplier, plus Holding Snapshot Points. Task Points are based on the USD value of subscriptions and redemptions, with 2 points awarded per $1 equivalent subscribed to RLUSD Flexible Products and 2 points deducted for every $1 redeemed. The Promotion Period Multiplier starts at 14x on Day 1 and decreases by 1 each day until the last day of the Promotion Period. Holding Snapshot Points are calculated from the total USD value of RLUSD Flexible Product holdings multiplied by 30, using a snapshot taken at 2026-09-08 23:59:59 (UTC). Binance said only Auto-Subscribe and manual subscriptions count as eligible subscriptions for Flexible Products. If two or more participants have the same final score, the earlier participant will rank higher based on participation time. Rewards are scheduled to be distributed by 2026-10-08 23:59 (UTC), and eligible users can view them in their Spot Account after distribution.
Campaign Details: Total Campaign Points are calculated using Task Points multiplied by a Promotion Period Multiplier, plus Holding Snapshot Points. Task Points are based on the USD value of subscriptions and redemptions, with 2 points awarded per $1 equivalent subscribed to RLUSD Flexible Products and 2 points deducted for every $1 redeemed. The Promotion Period Multiplier starts at 14x on Day 1 and decreases by 1 each day until the last day of the Promotion Period. Holding Snapshot Points are calculated from the total USD value of RLUSD Flexible Product holdings multiplied by 30, using a snapshot taken at 2026-09-08 23:59:59 (UTC). Binance said only Auto-Subscribe and manual subscriptions count as eligible subscriptions for Flexible Products. If two or more participants have the same final score, the earlier participant will rank higher based on participation time. Rewards are scheduled to be distributed by 2026-10-08 23:59 (UTC), and eligible users can view them in their Spot Account after distribution.
7
8.8k
·
--
Article
Iran Says It Is Ready to Escalate War That Trump Insists Will End After US ElectionIran is ready for a more intense war and will step up counterstrikes if the US keeps attacking its territory and infrastructure, a senior Iranian official told Bloomberg. Tehran has no intention of backing down in the face of an American naval blockade and strikes on its oil tankers, said the official, who asked not to be identified discussing sensitive matters, adding that while economic pain is increasing, the country's leaders see the war with the US as an existential threat that leaves little choice but to keep fighting. The comments come as hostilities show little sign of easing in the war's seventh month: Washington said one of its warships had to evade an Iranian attack overnight and that it destroyed five Iranian energy tankers in response, after which Tehran fired around 20 missiles at a Jordanian airbase used by the US and attacked more Navy and commercial vessels.
On Wednesday, President Donald Trump played down concerns about rising oil prices and said the war would be over in weeks, telling reporters he thinks it will "end immediately after the election because they can't hold out any longer," referring to November's midterms. Still, the Wall Street Journal reported that top US officials including Vice President JD Vance and Secretary of State Marco Rubio have raised the prospect that Iran may not yield and the conflict could stretch through the rest of Trump's term, which ends in January 2029. The senior official said Iran has been rebuilding its military since the most intense fighting ended in April and has enough missiles for a lengthy conflict.
The tit-for-tat attacks have pushed energy prices higher, with Brent crude climbing above $100 a barrel Wednesday and extending its gain this year to around 65%, while US diesel pump prices hit a record last week — adding pressure on Trump before the Nov. 3 midterms. Bloomberg Economics' Dina Esfandiary wrote that many Iranian leaders believe the Trump administration responds only to threats and escalation and is more sensitive to a widening war ahead of the vote. New security chief Mohsen Rezaee said Iran has recalibrated its posture toward US ships and bases, while parliament speaker Mohammad Bagher Ghalibaf warned the era of "proportionate responses" was over.
The war, which erupted when the US and Israel began strikes on Iran in late February, has settled into a stalemate as both sides jockey for control of the Strait of Hormuz, with no official peace talks in months. Wary of higher fuel prices and depleted interceptor stocks, the US is trying to avoid a return to full-on fighting and is instead squeezing Iran's economy through the blockade and threats against those that keep ties with Tehran, aiming to force Iran to reopen Hormuz and negotiate. The blockade has driven Iranian inflation to almost 90% and is rapidly weakening the rial. Some officials, including President Masoud Pezeshkian, favor talks but insist Washington first lift the blockade and return to the June Memorandum of Understanding, a ceasefire that quickly collapsed. Esfandiary said Iran's elites are debating whether to escalate or resist, but are deciding how to retaliate faster and more efficiently, suggesting a menu of responses aimed at imposing greater costs on the US.
Iran Says It Is Ready to Escalate War That Trump Insists Will End After US Election
Iran is ready for a more intense war and will step up counterstrikes if the US keeps attacking its territory and infrastructure, a senior Iranian official told Bloomberg. Tehran has no intention of backing down in the face of an American naval blockade and strikes on its oil tankers, said the official, who asked not to be identified discussing sensitive matters, adding that while economic pain is increasing, the country's leaders see the war with the US as an existential threat that leaves little choice but to keep fighting. The comments come as hostilities show little sign of easing in the war's seventh month: Washington said one of its warships had to evade an Iranian attack overnight and that it destroyed five Iranian energy tankers in response, after which Tehran fired around 20 missiles at a Jordanian airbase used by the US and attacked more Navy and commercial vessels.
On Wednesday, President Donald Trump played down concerns about rising oil prices and said the war would be over in weeks, telling reporters he thinks it will "end immediately after the election because they can't hold out any longer," referring to November's midterms. Still, the Wall Street Journal reported that top US officials including Vice President JD Vance and Secretary of State Marco Rubio have raised the prospect that Iran may not yield and the conflict could stretch through the rest of Trump's term, which ends in January 2029. The senior official said Iran has been rebuilding its military since the most intense fighting ended in April and has enough missiles for a lengthy conflict.
The tit-for-tat attacks have pushed energy prices higher, with Brent crude climbing above $100 a barrel Wednesday and extending its gain this year to around 65%, while US diesel pump prices hit a record last week — adding pressure on Trump before the Nov. 3 midterms. Bloomberg Economics' Dina Esfandiary wrote that many Iranian leaders believe the Trump administration responds only to threats and escalation and is more sensitive to a widening war ahead of the vote. New security chief Mohsen Rezaee said Iran has recalibrated its posture toward US ships and bases, while parliament speaker Mohammad Bagher Ghalibaf warned the era of "proportionate responses" was over.
The war, which erupted when the US and Israel began strikes on Iran in late February, has settled into a stalemate as both sides jockey for control of the Strait of Hormuz, with no official peace talks in months. Wary of higher fuel prices and depleted interceptor stocks, the US is trying to avoid a return to full-on fighting and is instead squeezing Iran's economy through the blockade and threats against those that keep ties with Tehran, aiming to force Iran to reopen Hormuz and negotiate. The blockade has driven Iranian inflation to almost 90% and is rapidly weakening the rial. Some officials, including President Masoud Pezeshkian, favor talks but insist Washington first lift the blockade and return to the June Memorandum of Understanding, a ceasefire that quickly collapsed. Esfandiary said Iran's elites are debating whether to escalate or resist, but are deciding how to retaliate faster and more efficiently, suggesting a menu of responses aimed at imposing greater costs on the US.
On Wednesday, President Donald Trump played down concerns about rising oil prices and said the war would be over in weeks, telling reporters he thinks it will "end immediately after the election because they can't hold out any longer," referring to November's midterms. Still, the Wall Street Journal reported that top US officials including Vice President JD Vance and Secretary of State Marco Rubio have raised the prospect that Iran may not yield and the conflict could stretch through the rest of Trump's term, which ends in January 2029. The senior official said Iran has been rebuilding its military since the most intense fighting ended in April and has enough missiles for a lengthy conflict.
The tit-for-tat attacks have pushed energy prices higher, with Brent crude climbing above $100 a barrel Wednesday and extending its gain this year to around 65%, while US diesel pump prices hit a record last week — adding pressure on Trump before the Nov. 3 midterms. Bloomberg Economics' Dina Esfandiary wrote that many Iranian leaders believe the Trump administration responds only to threats and escalation and is more sensitive to a widening war ahead of the vote. New security chief Mohsen Rezaee said Iran has recalibrated its posture toward US ships and bases, while parliament speaker Mohammad Bagher Ghalibaf warned the era of "proportionate responses" was over.
The war, which erupted when the US and Israel began strikes on Iran in late February, has settled into a stalemate as both sides jockey for control of the Strait of Hormuz, with no official peace talks in months. Wary of higher fuel prices and depleted interceptor stocks, the US is trying to avoid a return to full-on fighting and is instead squeezing Iran's economy through the blockade and threats against those that keep ties with Tehran, aiming to force Iran to reopen Hormuz and negotiate. The blockade has driven Iranian inflation to almost 90% and is rapidly weakening the rial. Some officials, including President Masoud Pezeshkian, favor talks but insist Washington first lift the blockade and return to the June Memorandum of Understanding, a ceasefire that quickly collapsed. Esfandiary said Iran's elites are debating whether to escalate or resist, but are deciding how to retaliate faster and more efficiently, suggesting a menu of responses aimed at imposing greater costs on the US.
8
6
24
19.6k
·
--
US MARKET CLOSE | Stocks Fall a Third Day as Treasury Yields Jump and Oil Tops $100U.S. stocks fell for a third straight session on Wednesday while oil prices climbed and Treasury yields jumped after Treasury Secretary Scott Bessent unveiled a new bond buyback plan, according to Sina Finance. The Dow dropped 405.41 points, or 0.77%, to 52,380.66; the S&P 500 fell 37.16 points, or 0.48%, to 7,636.36; and the Nasdaq lost 168.07 points, or 0.64%, to 26,253.34. Most of the "Magnificent Seven" declined, with Google down more than 2% and Amazon off more than 1%, while Nvidia, Apple, Microsoft and Tesla posted slight losses; Meta rose more than 6%. Storage names gained, as SK Hynix climbed more than 7%, Micron rose more than 2% and SanDisk added more than 1%. Optical communications shares advanced, with Marvell Technology up more than 4% and Lumentum up more than 1%. Treasury yields jumped after the Treasury said it would triple the size of its buyback operations for long-dated government debt to $6 billion, a move that followed last month's announcement to at least double the debt buyback program. After the news, the 10-year Treasury yield rose to 4.857%, the highest level since November 2023, after briefly topping the closely watched 4.8% mark as rising oil prices heightened inflation concerns. Yields continued higher despite the larger buyback plan because some on Wall Street had expected an even bigger scale from Bessent, with Peter Boockvar of The Boock Report noting that some had anticipated buybacks as high as $7 billion or $8 billion. Thomas Martin of Globalt Investments said the market was "doing OK" despite growing worries over higher oil prices and rates, adding that it had not seen a correction since earlier this year. The senior portfolio manager said sentiment in the stock market was at an extreme level, as was sentiment on higher rates, and that the two should not be able to coexist for long. Oil hit triple digits for the first time in more than a month after the U.S.-Iran conflict escalated and U.S. forces struck five Iranian tankers. Benchmark Brent crude futures settled up 3.36% at $101.21 a barrel, while U.S. West Texas Intermediate futures rose 3.25% to close at $96.05 a barrel, both the highest settlements since May. Concerns that a war in the Strait of Hormuz would cause lasting energy supply disruptions added to bets that the Federal Reserve will raise rates next week. Traders now see a 60% probability of a 25-basis-point hike this month, up slightly from the prior day, according to CME data.
US MARKET CLOSE | Stocks Fall a Third Day as Treasury Yields Jump and Oil Tops $100
U.S. stocks fell for a third straight session on Wednesday while oil prices climbed and Treasury yields jumped after Treasury Secretary Scott Bessent unveiled a new bond buyback plan, according to Sina Finance. The Dow dropped 405.41 points, or 0.77%, to 52,380.66; the S&P 500 fell 37.16 points, or 0.48%, to 7,636.36; and the Nasdaq lost 168.07 points, or 0.64%, to 26,253.34. Most of the "Magnificent Seven" declined, with Google down more than 2% and Amazon off more than 1%, while Nvidia, Apple, Microsoft and Tesla posted slight losses; Meta rose more than 6%. Storage names gained, as SK Hynix climbed more than 7%, Micron rose more than 2% and SanDisk added more than 1%. Optical communications shares advanced, with Marvell Technology up more than 4% and Lumentum up more than 1%. Treasury yields jumped after the Treasury said it would triple the size of its buyback operations for long-dated government debt to $6 billion, a move that followed last month's announcement to at least double the debt buyback program. After the news, the 10-year Treasury yield rose to 4.857%, the highest level since November 2023, after briefly topping the closely watched 4.8% mark as rising oil prices heightened inflation concerns. Yields continued higher despite the larger buyback plan because some on Wall Street had expected an even bigger scale from Bessent, with Peter Boockvar of The Boock Report noting that some had anticipated buybacks as high as $7 billion or $8 billion. Thomas Martin of Globalt Investments said the market was "doing OK" despite growing worries over higher oil prices and rates, adding that it had not seen a correction since earlier this year. The senior portfolio manager said sentiment in the stock market was at an extreme level, as was sentiment on higher rates, and that the two should not be able to coexist for long. Oil hit triple digits for the first time in more than a month after the U.S.-Iran conflict escalated and U.S. forces struck five Iranian tankers. Benchmark Brent crude futures settled up 3.36% at $101.21 a barrel, while U.S. West Texas Intermediate futures rose 3.25% to close at $96.05 a barrel, both the highest settlements since May. Concerns that a war in the Strait of Hormuz would cause lasting energy supply disruptions added to bets that the Federal Reserve will raise rates next week. Traders now see a 60% probability of a 25-basis-point hike this month, up slightly from the prior day, according to CME data.
1
6
4.7k
·
--
EU Commission Expands Central Contact Point Framework to Crypto Service ProvidersThe European Commission has adopted a delegated act to extend its Central Contact Point framework to crypto-asset service providers, requiring exchanges and similar firms operating in member states to appoint a local contact person. According to Odaily, the framework previously applied only to electronic money institutions and payment institutions, and the revision brings crypto service providers into the anti-money laundering and compliance supervision network to improve information sharing and enforcement coordination.
EU Commission Expands Central Contact Point Framework to Crypto Service Providers
The European Commission has adopted a delegated act to extend its Central Contact Point framework to crypto-asset service providers, requiring exchanges and similar firms operating in member states to appoint a local contact person. According to Odaily, the framework previously applied only to electronic money institutions and payment institutions, and the revision brings crypto service providers into the anti-money laundering and compliance supervision network to improve information sharing and enforcement coordination.
1.3k
·
--

Article
Crux Capital's Gaetano on the Copper Wall Inside AI Data Centers "Somebody's Already Buying the Materials Before I Even Make the Building"Photonics became finance Twitter's word of the month. Optical stocks are flying, traders are piling in, and very few people can explain what it actually is.Gaetano of Crux Capital has been researching the industry for over a year, positioning in it before the trend arrived. He joined TradFi Essentials, the Blockchain 100 show on Binance Square, to explain what is real and what is noise.He has no formal finance background and has never worked inside a data center. He went full-time on his Substack three months ago, with over 50,000 followers on X and more than a thousand paid subscribers.Photonics in One Sentence"Very simply, it's just the transfer of data via light."The reason it matters now is scale. Trillions are being spent building AI compute factories, and a large share of that investment goes toward one problem: getting GPUs to communicate with each other fast enough."They need to send a ton of data, they need to send it really, really quickly," Gaetano said. "So what was once done through copper electrically is now increasingly having to be done optically through photons."The industry is not new. It powered the telecom buildout that laid fiber between continents and cities. What changed is the market dynamic — the amount of optical content required by modern data centers is, in his words, "pretty extraordinary and kind of hard to comprehend."Copper Works to Two or Three Meters, and That Distance Is ShrinkingThis is the mechanical heart of the thesis."Copper works pretty well up to two to three meters, and then you can do some things to make it go a little bit further to push towards like seven meters," Gaetano explained. "But as we're getting to higher speeds and higher bandwidths, that's actually getting shorter and shorter."The line that follows is the one to remember: "Every meter shorter is more optical content that needs to be built out."Optics started at the longest distances — subsea cables linking continents — and has been moving inward ever since. "What you're seeing happening is optics is going from these really long distances and increasingly taking over copper's share shorter and shorter distances into a data center."The endpoint is optics operating within a single rack, which he identified as the next major step up in optical content.The speed progression driving it: 400 gigabits per second moving to 800, then to 1.6 terabits. Each step change lifts revenue for suppliers through better pricing structures and more content per system."If We Can Make More, We Could Ship More"Asked where the bottleneck sits, Gaetano's answer was that it sits at every layer.He summarised the current earnings season bluntly: "Almost all the companies were saying, if we can make more, we could ship more. Our customers want more and more of our content, we just can't make it fast enough."At the foundation are indium phosphide substrates — flat discs of base material most downstream optical content is built from. "There's three main players in the world that hold like 80% market share, and there's like seven total that fill out that whole 100%."Capacity cannot be bought quickly. "You can't just throw money at it and overnight just be able to make much more of it. It takes time to bring these things online."The next layer down is equally constrained. Companies converting wafers into laser chips lack sufficient fabrication facilities. "Basically every step is constrained."His most striking line on the supply-demand gap: "Before I even make a building to create these materials, somebody's already buying the materials."Capacity scheduled to come online in 2028 is already being reserved. "We don't have any visibility on when that's really going to come back and balance."China Controls the Bottleneck, and Washington Has NoticedThe substrate concentration carries a geopolitical dimension."A good amount of it is in China, and China restricts the permits of shipping out these indium phosphide substrates to the rest of the world," Gaetano said. "So China kind of controls this bottleneck a bit."The Trump administration has proposed banning Chinese-made optical content and transceivers. His read on the market implication was direct: "If the US really wants to ban a bunch of Chinese supply, that is really bullish for non-Chinese supply, especially like the US-based companies."On the broader competitive framing: "The AI race is kind of like a cold war. Nobody wants to fall behind."That extends to why these companies command the valuations they do. "They are necessary for the entire AI data center buildout. Without them, we would lose the race to China. And the US can't really afford to do that."The Question Every Investor Has to AnswerThe core framework Gaetano offered was a single trade-off."Do you position yourself before proof and take on more risk? Or do you pay a higher price later on for more proof?"His own answer: "I personally lean a little bit more towards waiting for more proof before I put up any meaningful amount of capital."The reason is a gap he sees repeatedly in the sector. "Just because you have laser technology that works in a lab doesn't mean that you can commercialize it at scale. Having the tech capability is one thing, but can you actually bring it to market and commercialize it and bring it to scale at good yields is a different conversation."Asked which signal is hardest to fake, he named one: shipped orders followed by repeat orders. "Once they get those orders in hand and they ship them and the customer receives them and places follow-on orders, that's a really good sign that the customer sees value in this enough to want to buy more."He noted the frustration built into that discipline. "We saw a lot of these bottleneck stocks go up thousands of percent within months. And the actual companies aren't in that much of a different place than they were a few months ago."His Biggest Mistake: Hunting the UndiscoveredGaetano was direct about what he got wrong, and the numbers are stark.Around September of last year, he judged the established optical leaders already expensive and went hunting for undiscovered names instead."One of my mistakes was putting too much capital towards those unproven, more highly speculative stocks, whereas if I put more of my capital towards the more established leaders, I actually would have performed much better," he said. "Those higher speculative plays might have gone up 50 to 100%, where the other ones have gone up 1,000 to 2,000%."He extended the lesson into a general warning about chart psychology. Investors look at a vertical chart like Lumentum's and conclude the value has been extracted, then go looking for a downtrend they believe the market has mispriced."People spend too much time trying to find these undiscovered plays where the discovered ones are going up for a reason," he said. "If this stock is only going down, there's probably a reason for that. The market could be wrong, but more than likely the market is telling us that it's just not worth the investment."His conclusion: "Learning to buy charts that are going up."He also flagged trimming too aggressively around core positions — holding roughly 80% of capital in a name, cutting into strength, then failing to buy back before the stock runs on without him.Optical Shared Memory Is a 2029 StoryAsked about optical shared memory, Gaetano was careful to size it correctly."It's very interesting, and it is early. If anything, it might be a 2029 story."The problem it addresses: only so much fast-access memory can be packaged alongside a GPU. "The idea is how do we have memory that is farther away from compute that we can access quickly enough? And that's where we're seeing these photonic fabrics come into place, because you can't get that information quickly enough using copper."Marvell, following its acquisition of Celestial AI, sits at the forefront. But he placed it as a sub-sector rather than a driver: "It's more of a smaller sub-sector. That could be big, but we still don't have that much visibility on it yet."The architectures actually carrying the investment thesis are co-packaged optics, near-packaged optics and optical circuit switching. "Those are all going to unlock new markets that right now are like no revenue, and they're going to be potentially tens or hundreds of billions of dollars in revenue over the coming five years."His marker for taking optical memory seriously: more discussion on Marvell's earnings calls and broader industry proof.The Two Bear CasesGaetano recommended starting with what could go wrong. He named two things.Hyperscaler capital expenditure and its return on investment. "The entire AI trade is dependent on these hyperscalers increasing their capital expenditure, which we've seen so far. But there's another layer — does the market believe that it's sustainable and can they make it worth their investment?"He cited Microsoft's recent earnings call as a positive signal: spending heavily while remaining cash flow positive and expecting to stay there. But the risk is structural. "A lot of these companies are factoring in massive growth in 2027, 2028, 2029. If there's less visibility that their customers are going to be spending into that, they will rerate lower because their multiples aren't going to be rewarded anymore."Architecture timing slipping. Co-packaged optics unlocks a market that does not currently exist, and its arrival date is load-bearing for valuations."If that timing gets delayed further and further out because it's becoming too much of a challenge to integrate — or copper, we can figure out ways to make copper push for longer at higher bandwidth — then that can cause a rerating in the stocks."He noted this has already happened in cycles through the year, with CPO delay news knocking stocks before the market digested it and recovered.The Speculative Name He Avoids DiscussingGaetano named one early-stage company he deliberately underweights in his public writing: Aluma Technologies, which he says could largely bypass the indium phosphide constraint."If they can do that, they create another pathway for these optical components to be made that isn't reliant on the thing that is most capacity constrained. So it's hopeful, but it's very early stage and it's very risky."His reason for saying little: "People hear that it could create a great investment return and they put a lot of money into it. But the most likely outcome is that it's probably not going to pan out the way that the bull case implies."He drew a crypto comparison for the risk profile — riskier than established assets, though "not quite like a lot of the influx of meme coins we've seen, not to that extent where it most likely will get rugged."He mentioned Sivers Semiconductors as an example of the earlier hunt for undiscovered European and Japanese optical suppliers, a small-cap Swedish laser maker in a category where "we don't have enough lasers and everybody wants more of them.""You Can Just Do Things"The closing advice came with a number attached."For those first four months I was posting on Twitter, I was getting like 20 views per post. Nothing was happening. I could have very easily been like, forget it."What he did instead was keep publishing while reassessing method. "I might think I'm doing a good job, but if my metrics of success are telling me otherwise, then I should probably reconsider what I'm doing."His advice to anyone in their twenties: "Stick with something longer than they might want to just because it's not panning out, and then reassess constantly and try to figure out how to leverage your skill sets to make what you're delivering more valuable."The phrase he and his wife use, and the line that closed the episode: "You can just do things."
Crux Capital's Gaetano on the Copper Wall Inside AI Data Centers "Somebody's Already Buying the Materials Before I Even Make the Building"
Photonics became finance Twitter's word of the month. Optical stocks are flying, traders are piling in, and very few people can explain what it actually is.Gaetano of Crux Capital has been researching the industry for over a year, positioning in it before the trend arrived. He joined TradFi Essentials, the Blockchain 100 show on Binance Square, to explain what is real and what is noise.He has no formal finance background and has never worked inside a data center. He went full-time on his Substack three months ago, with over 50,000 followers on X and more than a thousand paid subscribers.Photonics in One Sentence"Very simply, it's just the transfer of data via light."The reason it matters now is scale. Trillions are being spent building AI compute factories, and a large share of that investment goes toward one problem: getting GPUs to communicate with each other fast enough."They need to send a ton of data, they need to send it really, really quickly," Gaetano said. "So what was once done through copper electrically is now increasingly having to be done optically through photons."The industry is not new. It powered the telecom buildout that laid fiber between continents and cities. What changed is the market dynamic — the amount of optical content required by modern data centers is, in his words, "pretty extraordinary and kind of hard to comprehend."Copper Works to Two or Three Meters, and That Distance Is ShrinkingThis is the mechanical heart of the thesis."Copper works pretty well up to two to three meters, and then you can do some things to make it go a little bit further to push towards like seven meters," Gaetano explained. "But as we're getting to higher speeds and higher bandwidths, that's actually getting shorter and shorter."The line that follows is the one to remember: "Every meter shorter is more optical content that needs to be built out."Optics started at the longest distances — subsea cables linking continents — and has been moving inward ever since. "What you're seeing happening is optics is going from these really long distances and increasingly taking over copper's share shorter and shorter distances into a data center."The endpoint is optics operating within a single rack, which he identified as the next major step up in optical content.The speed progression driving it: 400 gigabits per second moving to 800, then to 1.6 terabits. Each step change lifts revenue for suppliers through better pricing structures and more content per system."If We Can Make More, We Could Ship More"Asked where the bottleneck sits, Gaetano's answer was that it sits at every layer.He summarised the current earnings season bluntly: "Almost all the companies were saying, if we can make more, we could ship more. Our customers want more and more of our content, we just can't make it fast enough."At the foundation are indium phosphide substrates — flat discs of base material most downstream optical content is built from. "There's three main players in the world that hold like 80% market share, and there's like seven total that fill out that whole 100%."Capacity cannot be bought quickly. "You can't just throw money at it and overnight just be able to make much more of it. It takes time to bring these things online."The next layer down is equally constrained. Companies converting wafers into laser chips lack sufficient fabrication facilities. "Basically every step is constrained."His most striking line on the supply-demand gap: "Before I even make a building to create these materials, somebody's already buying the materials."Capacity scheduled to come online in 2028 is already being reserved. "We don't have any visibility on when that's really going to come back and balance."China Controls the Bottleneck, and Washington Has NoticedThe substrate concentration carries a geopolitical dimension."A good amount of it is in China, and China restricts the permits of shipping out these indium phosphide substrates to the rest of the world," Gaetano said. "So China kind of controls this bottleneck a bit."The Trump administration has proposed banning Chinese-made optical content and transceivers. His read on the market implication was direct: "If the US really wants to ban a bunch of Chinese supply, that is really bullish for non-Chinese supply, especially like the US-based companies."On the broader competitive framing: "The AI race is kind of like a cold war. Nobody wants to fall behind."That extends to why these companies command the valuations they do. "They are necessary for the entire AI data center buildout. Without them, we would lose the race to China. And the US can't really afford to do that."The Question Every Investor Has to AnswerThe core framework Gaetano offered was a single trade-off."Do you position yourself before proof and take on more risk? Or do you pay a higher price later on for more proof?"His own answer: "I personally lean a little bit more towards waiting for more proof before I put up any meaningful amount of capital."The reason is a gap he sees repeatedly in the sector. "Just because you have laser technology that works in a lab doesn't mean that you can commercialize it at scale. Having the tech capability is one thing, but can you actually bring it to market and commercialize it and bring it to scale at good yields is a different conversation."Asked which signal is hardest to fake, he named one: shipped orders followed by repeat orders. "Once they get those orders in hand and they ship them and the customer receives them and places follow-on orders, that's a really good sign that the customer sees value in this enough to want to buy more."He noted the frustration built into that discipline. "We saw a lot of these bottleneck stocks go up thousands of percent within months. And the actual companies aren't in that much of a different place than they were a few months ago."His Biggest Mistake: Hunting the UndiscoveredGaetano was direct about what he got wrong, and the numbers are stark.Around September of last year, he judged the established optical leaders already expensive and went hunting for undiscovered names instead."One of my mistakes was putting too much capital towards those unproven, more highly speculative stocks, whereas if I put more of my capital towards the more established leaders, I actually would have performed much better," he said. "Those higher speculative plays might have gone up 50 to 100%, where the other ones have gone up 1,000 to 2,000%."He extended the lesson into a general warning about chart psychology. Investors look at a vertical chart like Lumentum's and conclude the value has been extracted, then go looking for a downtrend they believe the market has mispriced."People spend too much time trying to find these undiscovered plays where the discovered ones are going up for a reason," he said. "If this stock is only going down, there's probably a reason for that. The market could be wrong, but more than likely the market is telling us that it's just not worth the investment."His conclusion: "Learning to buy charts that are going up."He also flagged trimming too aggressively around core positions — holding roughly 80% of capital in a name, cutting into strength, then failing to buy back before the stock runs on without him.Optical Shared Memory Is a 2029 StoryAsked about optical shared memory, Gaetano was careful to size it correctly."It's very interesting, and it is early. If anything, it might be a 2029 story."The problem it addresses: only so much fast-access memory can be packaged alongside a GPU. "The idea is how do we have memory that is farther away from compute that we can access quickly enough? And that's where we're seeing these photonic fabrics come into place, because you can't get that information quickly enough using copper."Marvell, following its acquisition of Celestial AI, sits at the forefront. But he placed it as a sub-sector rather than a driver: "It's more of a smaller sub-sector. That could be big, but we still don't have that much visibility on it yet."The architectures actually carrying the investment thesis are co-packaged optics, near-packaged optics and optical circuit switching. "Those are all going to unlock new markets that right now are like no revenue, and they're going to be potentially tens or hundreds of billions of dollars in revenue over the coming five years."His marker for taking optical memory seriously: more discussion on Marvell's earnings calls and broader industry proof.The Two Bear CasesGaetano recommended starting with what could go wrong. He named two things.Hyperscaler capital expenditure and its return on investment. "The entire AI trade is dependent on these hyperscalers increasing their capital expenditure, which we've seen so far. But there's another layer — does the market believe that it's sustainable and can they make it worth their investment?"He cited Microsoft's recent earnings call as a positive signal: spending heavily while remaining cash flow positive and expecting to stay there. But the risk is structural. "A lot of these companies are factoring in massive growth in 2027, 2028, 2029. If there's less visibility that their customers are going to be spending into that, they will rerate lower because their multiples aren't going to be rewarded anymore."Architecture timing slipping. Co-packaged optics unlocks a market that does not currently exist, and its arrival date is load-bearing for valuations."If that timing gets delayed further and further out because it's becoming too much of a challenge to integrate — or copper, we can figure out ways to make copper push for longer at higher bandwidth — then that can cause a rerating in the stocks."He noted this has already happened in cycles through the year, with CPO delay news knocking stocks before the market digested it and recovered.The Speculative Name He Avoids DiscussingGaetano named one early-stage company he deliberately underweights in his public writing: Aluma Technologies, which he says could largely bypass the indium phosphide constraint."If they can do that, they create another pathway for these optical components to be made that isn't reliant on the thing that is most capacity constrained. So it's hopeful, but it's very early stage and it's very risky."His reason for saying little: "People hear that it could create a great investment return and they put a lot of money into it. But the most likely outcome is that it's probably not going to pan out the way that the bull case implies."He drew a crypto comparison for the risk profile — riskier than established assets, though "not quite like a lot of the influx of meme coins we've seen, not to that extent where it most likely will get rugged."He mentioned Sivers Semiconductors as an example of the earlier hunt for undiscovered European and Japanese optical suppliers, a small-cap Swedish laser maker in a category where "we don't have enough lasers and everybody wants more of them.""You Can Just Do Things"The closing advice came with a number attached."For those first four months I was posting on Twitter, I was getting like 20 views per post. Nothing was happening. I could have very easily been like, forget it."What he did instead was keep publishing while reassessing method. "I might think I'm doing a good job, but if my metrics of success are telling me otherwise, then I should probably reconsider what I'm doing."His advice to anyone in their twenties: "Stick with something longer than they might want to just because it's not panning out, and then reassess constantly and try to figure out how to leverage your skill sets to make what you're delivering more valuable."The phrase he and his wife use, and the line that closed the episode: "You can just do things."
3
1.5k
·
--
Binance Alpha Announces Third Wave of Block Street (BSB) Airdrop RewardsBinance Wallet announced on X that Binance Alpha's third wave of Block Street (BSB) airdrop rewards is now available. Users with at least 246 Binance Alpha Points can claim 342 BSB tokens on a first-come, first-served basis. If the reward pool is not fully distributed, the required score threshold will automatically decrease by 5 points every 5 minutes. Claiming the airdrop will consume 15 Binance Alpha Points. Users must confirm their claim on the Alpha Events page within 24 hours, or the claim will be treated as forfeited.
Binance Alpha Announces Third Wave of Block Street (BSB) Airdrop Rewards
Binance Wallet announced on X that Binance Alpha's third wave of Block Street (BSB) airdrop rewards is now available. Users with at least 246 Binance Alpha Points can claim 342 BSB tokens on a first-come, first-served basis. If the reward pool is not fully distributed, the required score threshold will automatically decrease by 5 points every 5 minutes. Claiming the airdrop will consume 15 Binance Alpha Points. Users must confirm their claim on the Alpha Events page within 24 hours, or the claim will be treated as forfeited.
1
1
2.2k
·
--

Article
AI TRENDS | Ray Dalio Says AI Is in a BubbleBridgewater founder Ray Dalio said on Wednesday that the current AI boom follows the same historical pattern as past technology bubbles. According to Sina Finance, he said "we are now in a bubble" while adding that the underlying innovation still has real transformative significance.Dalio wrote on X that nearly every technology boom creates a bubble that eventually bursts, citing the railroad boom and the Industrial Revolution as past examples. He said the late 1920s saw electricity, refrigeration, telephones, radio, airplanes, and automobiles emerge almost at the same time, which naturally drew large numbers of investors.Dalio said the danger is that people cannot distinguish between the miracle of the technology itself and the related investment. He explained that a technology may indeed be transformative, but if the related stocks are too expensive or are bought with borrowed money, a crash can follow. He said this mechanism was what led to the market slump from 1929 to 1933.Dalio said AI is now showing the same pattern. He added that the technology will likely prove valuable, but investors still need to assess who the real beneficiaries are, whether AI can generate real returns, and whether current stock prices reflect excessive optimism.
AI TRENDS | Ray Dalio Says AI Is in a Bubble
Bridgewater founder Ray Dalio said on Wednesday that the current AI boom follows the same historical pattern as past technology bubbles. According to Sina Finance, he said "we are now in a bubble" while adding that the underlying innovation still has real transformative significance.Dalio wrote on X that nearly every technology boom creates a bubble that eventually bursts, citing the railroad boom and the Industrial Revolution as past examples. He said the late 1920s saw electricity, refrigeration, telephones, radio, airplanes, and automobiles emerge almost at the same time, which naturally drew large numbers of investors.Dalio said the danger is that people cannot distinguish between the miracle of the technology itself and the related investment. He explained that a technology may indeed be transformative, but if the related stocks are too expensive or are bought with borrowed money, a crash can follow. He said this mechanism was what led to the market slump from 1929 to 1933.Dalio said AI is now showing the same pattern. He added that the technology will likely prove valuable, but investors still need to assess who the real beneficiaries are, whether AI can generate real returns, and whether current stock prices reflect excessive optimism.
3.1k
·
--
BNB Drops Below 720 USDT with a 4.58% Decrease in 24 HoursOn Sep 10, 2026, 06:17 AM(UTC). According to Binance Market Data, BNB has dropped below 720 USDT and is now trading at 719.719971 USDT, with a narrowed 4.58% decrease in 24 hours.
BNB Drops Below 720 USDT with a 4.58% Decrease in 24 Hours
On Sep 10, 2026, 06:17 AM(UTC). According to Binance Market Data, BNB has dropped below 720 USDT and is now trading at 719.719971 USDT, with a narrowed 4.58% decrease in 24 hours.
2
5.4k
·
--

Article
Arthur Hayes Says Bitcoin Could Benefit From Renewed Bond-Market InterventionArthur Hayes said Bitcoin could be the biggest beneficiary if governments step up intervention in bond markets again. According to NS3.AI, he expects continued pressure in bond markets to push policymakers toward expanding liquidity.
Hayes said Bitcoin has already rebounded from $63,000 to above $80,000 and may consolidate at current levels. He also sees a possible retest of $70,000 before the cryptocurrency moves higher.
Arthur Hayes Says Bitcoin Could Benefit From Renewed Bond-Market Intervention
Arthur Hayes said Bitcoin could be the biggest beneficiary if governments step up intervention in bond markets again. According to NS3.AI, he expects continued pressure in bond markets to push policymakers toward expanding liquidity.
Hayes said Bitcoin has already rebounded from $63,000 to above $80,000 and may consolidate at current levels. He also sees a possible retest of $70,000 before the cryptocurrency moves higher.
Hayes said Bitcoin has already rebounded from $63,000 to above $80,000 and may consolidate at current levels. He also sees a possible retest of $70,000 before the cryptocurrency moves higher.
1
10.4k
·
--
Bitcoin(BTC) Drops Below 78,000 USDT with a 1.59% Decrease in 24 HoursOn Sep 10, 2026, 07:33 AM(UTC). According to Binance Market Data, Bitcoin has dropped below 78,000 USDT and is now trading at 77,990.710938 USDT, with a narrowed 1.59% decrease in 24 hours.
Bitcoin(BTC) Drops Below 78,000 USDT with a 1.59% Decrease in 24 Hours
On Sep 10, 2026, 07:33 AM(UTC). According to Binance Market Data, Bitcoin has dropped below 78,000 USDT and is now trading at 77,990.710938 USDT, with a narrowed 1.59% decrease in 24 hours.
4
4.1k
·
--
Visa Stablecoin Settlement Volume Tops $20 Billion AnnualizedVisa said its stablecoin settlement volume has surpassed an annualized $20 billion, more than 15 times higher than a year ago. According to ChainCatcher, more than 160 stablecoin-linked card programs are now live globally, and related payment volume has risen nearly 200% year over year.
Stablecoin card programs require daily settlement before cardholders repay, with some programs needing only a few million dollars in funding per settlement cycle and operating seven days a week. Visa said some crypto-linked card businesses are constrained by working capital needed to support continuous settlement cycles, while on-chain credit can reduce financing costs by up to 30%.
Credit Coop and Visa have launched a stablecoin-denominated revolving credit tool that has processed more than 9,000 repayments on-chain. The platform has handled over $2.5 billion in cumulative financing, more than 3,000 loans and 9,000 repayments, with no defaults. Visa Principal Member Rain has used the tool to finance daily settlement since August 2023.
Visa Stablecoin Settlement Volume Tops $20 Billion Annualized
Visa said its stablecoin settlement volume has surpassed an annualized $20 billion, more than 15 times higher than a year ago. According to ChainCatcher, more than 160 stablecoin-linked card programs are now live globally, and related payment volume has risen nearly 200% year over year.
Stablecoin card programs require daily settlement before cardholders repay, with some programs needing only a few million dollars in funding per settlement cycle and operating seven days a week. Visa said some crypto-linked card businesses are constrained by working capital needed to support continuous settlement cycles, while on-chain credit can reduce financing costs by up to 30%.
Credit Coop and Visa have launched a stablecoin-denominated revolving credit tool that has processed more than 9,000 repayments on-chain. The platform has handled over $2.5 billion in cumulative financing, more than 3,000 loans and 9,000 repayments, with no defaults. Visa Principal Member Rain has used the tool to finance daily settlement since August 2023.
Stablecoin card programs require daily settlement before cardholders repay, with some programs needing only a few million dollars in funding per settlement cycle and operating seven days a week. Visa said some crypto-linked card businesses are constrained by working capital needed to support continuous settlement cycles, while on-chain credit can reduce financing costs by up to 30%.
Credit Coop and Visa have launched a stablecoin-denominated revolving credit tool that has processed more than 9,000 repayments on-chain. The platform has handled over $2.5 billion in cumulative financing, more than 3,000 loans and 9,000 repayments, with no defaults. Visa Principal Member Rain has used the tool to finance daily settlement since August 2023.
2
1
861
·
--
Binance Alpha Announces Third Wave of Block Street (BSB) Airdrop RewardsBinance Wallet announced on X that Binance Alpha's third wave of Block Street (BSB) airdrop rewards is now available. Users with at least 246 Binance Alpha Points can claim 342 BSB tokens on a first-come, first-served basis. If the reward pool is not fully distributed, the required score threshold will automatically decrease by 5 points every 5 minutes. Claiming the airdrop will consume 15 Binance Alpha Points. Users must confirm their claim on the Alpha Events page within 24 hours, or the system will treat the airdrop as unclaimed.
Binance Alpha Announces Third Wave of Block Street (BSB) Airdrop Rewards
Binance Wallet announced on X that Binance Alpha's third wave of Block Street (BSB) airdrop rewards is now available. Users with at least 246 Binance Alpha Points can claim 342 BSB tokens on a first-come, first-served basis. If the reward pool is not fully distributed, the required score threshold will automatically decrease by 5 points every 5 minutes. Claiming the airdrop will consume 15 Binance Alpha Points. Users must confirm their claim on the Alpha Events page within 24 hours, or the system will treat the airdrop as unclaimed.
2.2k
·
--
BNB Drops Below 730 USDT with a 2.99% Decrease in 24 HoursOn Sep 09, 2026, 21:18 PM(UTC). According to Binance Market Data, BNB has dropped below 730 USDT and is now trading at 729.409973 USDT, with a narrowed 2.99% decrease in 24 hours.
BNB Drops Below 730 USDT with a 2.99% Decrease in 24 Hours
On Sep 09, 2026, 21:18 PM(UTC). According to Binance Market Data, BNB has dropped below 730 USDT and is now trading at 729.409973 USDT, with a narrowed 2.99% decrease in 24 hours.
2
4
6.1k
·
--
STOCKS | Cathay, Mainland Airlines Fall As Oil Prices Rise On Iran Shipping AttacksCathay Pacific (00293) fell 2.7% to HK$14.18, while China Eastern Airlines (00670) dropped 2.7% to HK$2.665, Air China (00753) lost 2% to HK$3.74 and China Southern Airlines (01055) declined 2.1% to HK$3.015, according to ETNet.
The moves came after reports that Iran attacked 10 ships near the Strait of Hormuz following the U.S. sinking of five Iranian oil tankers, in what was described as the largest retaliatory strike on the shipping sector since the U.S.-Iran conflict began. Brent crude briefly jumped 3.74% to a high of $101.58 a barrel before closing up 3.36% at $101.21, while U.S. crude rose 3.24% to $96.05. Latest prices showed U.S. crude at $96.79, up 0.77%, and Brent at $101.60, down 0.06%.
Hong Kong stocks were also lower, with the Hang Seng Index down 338 points, or 1.3%, at 24,936. The Hang Seng China Enterprises Index fell 112 points, or 1.3%, to 8,256, while the Hang Seng Tech Index dropped 76 points, or 1.7%, to 4,344. Mainboard turnover was nearly HK$28.4 billion.
STOCKS | Cathay, Mainland Airlines Fall As Oil Prices Rise On Iran Shipping Attacks
Cathay Pacific (00293) fell 2.7% to HK$14.18, while China Eastern Airlines (00670) dropped 2.7% to HK$2.665, Air China (00753) lost 2% to HK$3.74 and China Southern Airlines (01055) declined 2.1% to HK$3.015, according to ETNet.
The moves came after reports that Iran attacked 10 ships near the Strait of Hormuz following the U.S. sinking of five Iranian oil tankers, in what was described as the largest retaliatory strike on the shipping sector since the U.S.-Iran conflict began. Brent crude briefly jumped 3.74% to a high of $101.58 a barrel before closing up 3.36% at $101.21, while U.S. crude rose 3.24% to $96.05. Latest prices showed U.S. crude at $96.79, up 0.77%, and Brent at $101.60, down 0.06%.
Hong Kong stocks were also lower, with the Hang Seng Index down 338 points, or 1.3%, at 24,936. The Hang Seng China Enterprises Index fell 112 points, or 1.3%, to 8,256, while the Hang Seng Tech Index dropped 76 points, or 1.7%, to 4,344. Mainboard turnover was nearly HK$28.4 billion.
The moves came after reports that Iran attacked 10 ships near the Strait of Hormuz following the U.S. sinking of five Iranian oil tankers, in what was described as the largest retaliatory strike on the shipping sector since the U.S.-Iran conflict began. Brent crude briefly jumped 3.74% to a high of $101.58 a barrel before closing up 3.36% at $101.21, while U.S. crude rose 3.24% to $96.05. Latest prices showed U.S. crude at $96.79, up 0.77%, and Brent at $101.60, down 0.06%.
Hong Kong stocks were also lower, with the Hang Seng Index down 338 points, or 1.3%, at 24,936. The Hang Seng China Enterprises Index fell 112 points, or 1.3%, to 8,256, while the Hang Seng Tech Index dropped 76 points, or 1.7%, to 4,344. Mainboard turnover was nearly HK$28.4 billion.
4.2k
·
--
Apple Responds to Removal of iPhone 17 ProAccording to Jin10, after Apple's September 10 fall product launch, a search on Apple's official website showed that only iPhone Air, iPhone 17, iPhone 17e, and iPhone 16 were available in the iPhone category, while the iPhone 17 Pro series had been removed. Apple customer service said the iPhone 17 Pro series is taken down when new products are released, leaving only the base model on sale, and that it will not be relisted. Customer service said buyers can check offline Apple-owned stores for stock or look online.
Apple Responds to Removal of iPhone 17 Pro
According to Jin10, after Apple's September 10 fall product launch, a search on Apple's official website showed that only iPhone Air, iPhone 17, iPhone 17e, and iPhone 16 were available in the iPhone category, while the iPhone 17 Pro series had been removed. Apple customer service said the iPhone 17 Pro series is taken down when new products are released, leaving only the base model on sale, and that it will not be relisted. Customer service said buyers can check offline Apple-owned stores for stock or look online.
5
7.7k
·
--
Spot Gold Tops $4,430 an OunceSpot gold rose 0.7% intraday to trade above $4,430 an ounce, according to Jiemian News.
Spot Gold Tops $4,430 an Ounce
Spot gold rose 0.7% intraday to trade above $4,430 an ounce, according to Jiemian News.
929
·
--
STOCKS | New York and London Copper Prices Hit Record Highs AgainCopper prices in London and New York both climbed to record highs. According to Sina Finance, traders weighed persistent tariff concerns and supply shortages against uncertainty over demand prospects from escalating hostilities in the Middle East.
LME benchmark three-month copper briefly rose to $14,858.50 per metric ton, above the previous session's record high of $14,779. New York Mercantile Exchange copper also reached a record high of $6.894 per ounce. Copper prices have risen 19% so far this year.
According to Sina Finance, Guangzhou Futures said in a social media report that caution is still needed at the macro level, U.S. inflation remains uncertain, and changes in expectations for Federal Reserve policy could put downward pressure on copper prices. On Wednesday, LME copper rose 0.4% to settle at $14,767.50 per metric ton.
STOCKS | New York and London Copper Prices Hit Record Highs Again
Copper prices in London and New York both climbed to record highs. According to Sina Finance, traders weighed persistent tariff concerns and supply shortages against uncertainty over demand prospects from escalating hostilities in the Middle East.
LME benchmark three-month copper briefly rose to $14,858.50 per metric ton, above the previous session's record high of $14,779. New York Mercantile Exchange copper also reached a record high of $6.894 per ounce. Copper prices have risen 19% so far this year.
According to Sina Finance, Guangzhou Futures said in a social media report that caution is still needed at the macro level, U.S. inflation remains uncertain, and changes in expectations for Federal Reserve policy could put downward pressure on copper prices. On Wednesday, LME copper rose 0.4% to settle at $14,767.50 per metric ton.
LME benchmark three-month copper briefly rose to $14,858.50 per metric ton, above the previous session's record high of $14,779. New York Mercantile Exchange copper also reached a record high of $6.894 per ounce. Copper prices have risen 19% so far this year.
According to Sina Finance, Guangzhou Futures said in a social media report that caution is still needed at the macro level, U.S. inflation remains uncertain, and changes in expectations for Federal Reserve policy could put downward pressure on copper prices. On Wednesday, LME copper rose 0.4% to settle at $14,767.50 per metric ton.
1
3
2.8k
·
--
Bitcoin(BTC) Drops Below 79,000 USDT with a Narrowed 1.33% Increase in 24 HoursOn Sep 09, 2026, 14:02 PM(UTC). According to Binance Market Data, Bitcoin has dropped below 79,000 USDT and is now trading at 78,941.171875 USDT, with a narrowed narrowed 1.33% increase in 24 hours.
Bitcoin(BTC) Drops Below 79,000 USDT with a Narrowed 1.33% Increase in 24 Hours
On Sep 09, 2026, 14:02 PM(UTC). According to Binance Market Data, Bitcoin has dropped below 79,000 USDT and is now trading at 78,941.171875 USDT, with a narrowed narrowed 1.33% increase in 24 hours.
7
8.6k
·
--
Market News | Brent and U.S. Crude Futures Close at Highest Levels Since May 22According to Jin10, Brent crude futures and U.S. crude futures closed at their highest levels since May 22.
Market News | Brent and U.S. Crude Futures Close at Highest Levels Since May 22
According to Jin10, Brent crude futures and U.S. crude futures closed at their highest levels since May 22.
1
1
4
2.8k
·
--
Broadcom Reports $179.2 Billion in Remaining Performance ObligationsAccording to Jin10, Broadcom (AVGO.O) said that as of August 2, remaining performance obligations under contracts in its semiconductor solutions and infrastructure software segments were about $179.2 billion.
Broadcom Reports $179.2 Billion in Remaining Performance Obligations
According to Jin10, Broadcom (AVGO.O) said that as of August 2, remaining performance obligations under contracts in its semiconductor solutions and infrastructure software segments were about $179.2 billion.
1
996
·
--
US-Iran Maritime Attacks Push Brent Back Above $100Brent crude rose 3.4% on Wednesday to settle at $101.21 a barrel after the latest round of attacks at sea. According to Sina Finance, the U.S. military said it destroyed five Iranian crude transport ships, while Iran said it attacked multiple U.S. vessels and tankers near the Strait of Hormuz.
The U.S. Central Command said on September 8 that it destroyed five Iranian crude transport ships after the Islamic Revolutionary Guard Corps used ballistic missiles twice in the previous two days against a U.S. Navy vessel. U.S. Secretary of State Marco Rubio later said Iran would pay with the loss of tankers whenever it attacked or tried to attack U.S. warships.
Iranian state media said on September 9 that Iranian forces attacked eight tankers and two U.S. vessels in retaliation, and also targeted 10 other ships trying to pass through the Strait of Hormuz. The U.S. Central Command denied that any U.S. warship was hit.
The British maritime trade operations office reported attacks involving multiple merchant ships in the northern Persian Gulf and the Gulf of Oman. Iraq separately confirmed that a Panama-flagged tanker was attacked by unknown assailants off the Iraqi coast, with no casualties reported.
US-Iran Maritime Attacks Push Brent Back Above $100
Brent crude rose 3.4% on Wednesday to settle at $101.21 a barrel after the latest round of attacks at sea. According to Sina Finance, the U.S. military said it destroyed five Iranian crude transport ships, while Iran said it attacked multiple U.S. vessels and tankers near the Strait of Hormuz.
The U.S. Central Command said on September 8 that it destroyed five Iranian crude transport ships after the Islamic Revolutionary Guard Corps used ballistic missiles twice in the previous two days against a U.S. Navy vessel. U.S. Secretary of State Marco Rubio later said Iran would pay with the loss of tankers whenever it attacked or tried to attack U.S. warships.
Iranian state media said on September 9 that Iranian forces attacked eight tankers and two U.S. vessels in retaliation, and also targeted 10 other ships trying to pass through the Strait of Hormuz. The U.S. Central Command denied that any U.S. warship was hit.
The British maritime trade operations office reported attacks involving multiple merchant ships in the northern Persian Gulf and the Gulf of Oman. Iraq separately confirmed that a Panama-flagged tanker was attacked by unknown assailants off the Iraqi coast, with no casualties reported.
The U.S. Central Command said on September 8 that it destroyed five Iranian crude transport ships after the Islamic Revolutionary Guard Corps used ballistic missiles twice in the previous two days against a U.S. Navy vessel. U.S. Secretary of State Marco Rubio later said Iran would pay with the loss of tankers whenever it attacked or tried to attack U.S. warships.
Iranian state media said on September 9 that Iranian forces attacked eight tankers and two U.S. vessels in retaliation, and also targeted 10 other ships trying to pass through the Strait of Hormuz. The U.S. Central Command denied that any U.S. warship was hit.
The British maritime trade operations office reported attacks involving multiple merchant ships in the northern Persian Gulf and the Gulf of Oman. Iraq separately confirmed that a Panama-flagged tanker was attacked by unknown assailants off the Iraqi coast, with no casualties reported.
981
·
--
Senate Subcommittee Probes OpenAI Over Hugging Face BreachAccording to Axios, a Republican-led Senate subcommittee that oversees disaster management is investigating OpenAI's handling of the July Hugging Face breach. Sen. Josh Hawley, chair of the Senate Homeland Security & Governmental Affairs subcommittee on Disaster Management, said he is launching the probe after OpenAI released an internal investigation into the incident. Hawley called OpenAI's response to the cyber test "reckless" and said the company redacted important details from its report. He is demanding answers from OpenAI CEO Sam Altman by Oct. 1 on 16 questions about the breach and the company's response, and is also seeking documents on OpenAI's internal policies and procedures. OpenAI did not respond to a request for comment.
Senate Subcommittee Probes OpenAI Over Hugging Face Breach
According to Axios, a Republican-led Senate subcommittee that oversees disaster management is investigating OpenAI's handling of the July Hugging Face breach. Sen. Josh Hawley, chair of the Senate Homeland Security & Governmental Affairs subcommittee on Disaster Management, said he is launching the probe after OpenAI released an internal investigation into the incident. Hawley called OpenAI's response to the cyber test "reckless" and said the company redacted important details from its report. He is demanding answers from OpenAI CEO Sam Altman by Oct. 1 on 16 questions about the breach and the company's response, and is also seeking documents on OpenAI's internal policies and procedures. OpenAI did not respond to a request for comment.
1
793
·
--
NYMEX WTI, Brent Rise More Than 3% at CloseNYMEX October-delivery light crude futures rose $3.02 to $96.05 a barrel, up 3.25%, while November-delivery Brent crude futures on the London market gained $3.29 to $101.21 a barrel, up 3.36%, according to Jiemian News.
NYMEX WTI, Brent Rise More Than 3% at Close
NYMEX October-delivery light crude futures rose $3.02 to $96.05 a barrel, up 3.25%, while November-delivery Brent crude futures on the London market gained $3.29 to $101.21 a barrel, up 3.36%, according to Jiemian News.
1
2.4k
·
--
AI TRENDS | OpenAI Faces Senate Investigation Over Hugging Face Data LeakAccording to Jin10, Axios reported that OpenAI is facing a Republican-led Senate investigation into the Hugging Face data leak.
AI TRENDS | OpenAI Faces Senate Investigation Over Hugging Face Data Leak
According to Jin10, Axios reported that OpenAI is facing a Republican-led Senate investigation into the Hugging Face data leak.
1
669
·
--
BNB Drops Below 720 USDT with a 4.37% Decrease in 24 HoursOn Sep 09, 2026, 22:09 PM(UTC). According to Binance Market Data, BNB has dropped below 720 USDT and is now trading at 718.289978 USDT, with a narrowed 4.37% decrease in 24 hours.
BNB Drops Below 720 USDT with a 4.37% Decrease in 24 Hours
On Sep 09, 2026, 22:09 PM(UTC). According to Binance Market Data, BNB has dropped below 720 USDT and is now trading at 718.289978 USDT, with a narrowed 4.37% decrease in 24 hours.
1
2.1k
·
--
ASIA MARKET CLOSE | Hong Kong Tech Slides as Zhipu Sinks Over 10%; Tokyo Edges Up, Seoul and Taiwan EaseAccording to RTHK, Sina Finance and Yicai, Tokyo's Nikkei 225 recovered from an early dip to close 128.17 points higher at 65,270.95, up 0.20%, as the index turned positive in the final stretch of trade.
Seoul's KOSPI ended slightly lower, slipping 17.72 points, or 0.25%, to 7,033.92 after failing to hold above the prior session's levels.
Hong Kong stocks retreated broadly, with the Hang Seng Index down 320.49 points, or 1.27%, at 24,954.47 and the Hang Seng Tech Index off 2.04%, while the Hang Seng China Enterprises Index fell 1.13%. Technology and internet names led the decline: Meituan dropped 3.92% to HK$74.75 and Baidu fell 3.31% to HK$89.15, while Tencent lost 1.94%, Alibaba 2.64% and Xiaomi 1.74%. Application-software developer Zhipu tumbled 10.34% to HK$819.00 after DeepSeek cut pricing on its DS V4 Flash model. Mainland banks bucked the trend, with Minsheng Bank rising more than 3%, while pork producer Muyuan Foods fell over 3%.
Taiwan's TAIEX closed down 242.87 points, or 0.51%, at 46,940.49, with turnover shrinking to NT$714 billion. TSMC eased 0.61% to NT$2,450, giving back gains even after Investing.com reported the chipmaker's August revenue jumped 53% on sustained AI demand.
In mainland China, the Shanghai Composite fell 0.43%, the Shenzhen Component dropped 0.77% and the ChiNext Index lost 0.49%, while the CSI 300 declined 0.53% to 4,548.39. Banks advanced against the tide, with Ningbo Bank, Bank of Nanjing and Bank of Qingdao each up more than 2%. Turnover across the two mainland exchanges shrank to 1.65 trillion yuan, down 208.5 billion yuan from the previous session, with nearly 4,500 stocks declining.
ASIA MARKET CLOSE | Hong Kong Tech Slides as Zhipu Sinks Over 10%; Tokyo Edges Up, Seoul and Taiwan Ease
According to RTHK, Sina Finance and Yicai, Tokyo's Nikkei 225 recovered from an early dip to close 128.17 points higher at 65,270.95, up 0.20%, as the index turned positive in the final stretch of trade.
Seoul's KOSPI ended slightly lower, slipping 17.72 points, or 0.25%, to 7,033.92 after failing to hold above the prior session's levels.
Hong Kong stocks retreated broadly, with the Hang Seng Index down 320.49 points, or 1.27%, at 24,954.47 and the Hang Seng Tech Index off 2.04%, while the Hang Seng China Enterprises Index fell 1.13%. Technology and internet names led the decline: Meituan dropped 3.92% to HK$74.75 and Baidu fell 3.31% to HK$89.15, while Tencent lost 1.94%, Alibaba 2.64% and Xiaomi 1.74%. Application-software developer Zhipu tumbled 10.34% to HK$819.00 after DeepSeek cut pricing on its DS V4 Flash model. Mainland banks bucked the trend, with Minsheng Bank rising more than 3%, while pork producer Muyuan Foods fell over 3%.
Taiwan's TAIEX closed down 242.87 points, or 0.51%, at 46,940.49, with turnover shrinking to NT$714 billion. TSMC eased 0.61% to NT$2,450, giving back gains even after Investing.com reported the chipmaker's August revenue jumped 53% on sustained AI demand.
In mainland China, the Shanghai Composite fell 0.43%, the Shenzhen Component dropped 0.77% and the ChiNext Index lost 0.49%, while the CSI 300 declined 0.53% to 4,548.39. Banks advanced against the tide, with Ningbo Bank, Bank of Nanjing and Bank of Qingdao each up more than 2%. Turnover across the two mainland exchanges shrank to 1.65 trillion yuan, down 208.5 billion yuan from the previous session, with nearly 4,500 stocks declining.
Seoul's KOSPI ended slightly lower, slipping 17.72 points, or 0.25%, to 7,033.92 after failing to hold above the prior session's levels.
Hong Kong stocks retreated broadly, with the Hang Seng Index down 320.49 points, or 1.27%, at 24,954.47 and the Hang Seng Tech Index off 2.04%, while the Hang Seng China Enterprises Index fell 1.13%. Technology and internet names led the decline: Meituan dropped 3.92% to HK$74.75 and Baidu fell 3.31% to HK$89.15, while Tencent lost 1.94%, Alibaba 2.64% and Xiaomi 1.74%. Application-software developer Zhipu tumbled 10.34% to HK$819.00 after DeepSeek cut pricing on its DS V4 Flash model. Mainland banks bucked the trend, with Minsheng Bank rising more than 3%, while pork producer Muyuan Foods fell over 3%.
Taiwan's TAIEX closed down 242.87 points, or 0.51%, at 46,940.49, with turnover shrinking to NT$714 billion. TSMC eased 0.61% to NT$2,450, giving back gains even after Investing.com reported the chipmaker's August revenue jumped 53% on sustained AI demand.
In mainland China, the Shanghai Composite fell 0.43%, the Shenzhen Component dropped 0.77% and the ChiNext Index lost 0.49%, while the CSI 300 declined 0.53% to 4,548.39. Banks advanced against the tide, with Ningbo Bank, Bank of Nanjing and Bank of Qingdao each up more than 2%. Turnover across the two mainland exchanges shrank to 1.65 trillion yuan, down 208.5 billion yuan from the previous session, with nearly 4,500 stocks declining.
1
2
547
·
--
U.S. Treasury Secretary Scott Bessent Urges Senate to Advance CLARITY ActBitcoin News said on X that U.S. Treasury Secretary Scott Bessent called on the Senate to advance the CLARITY Act to establish a comprehensive regulatory framework for digital assets. According to Odaily, Bessent warned that failing to move the bill forward would signal to allies and rivals that the U.S. is unwilling to lead the future of digital assets and would forgo stronger national security tools to address digital asset abuse.
U.S. Treasury Secretary Scott Bessent Urges Senate to Advance CLARITY Act
Bitcoin News said on X that U.S. Treasury Secretary Scott Bessent called on the Senate to advance the CLARITY Act to establish a comprehensive regulatory framework for digital assets. According to Odaily, Bessent warned that failing to move the bill forward would signal to allies and rivals that the U.S. is unwilling to lead the future of digital assets and would forgo stronger national security tools to address digital asset abuse.
2
1.7k
·
--
BNB Drops Below 740 USDT with a 1.62% Decrease in 24 HoursOn Sep 09, 2026, 15:13 PM(UTC). According to Binance Market Data, BNB has dropped below 740 USDT and is now trading at 739.25 USDT, with a narrowed 1.62% decrease in 24 hours.
BNB Drops Below 740 USDT with a 1.62% Decrease in 24 Hours
On Sep 09, 2026, 15:13 PM(UTC). According to Binance Market Data, BNB has dropped below 740 USDT and is now trading at 739.25 USDT, with a narrowed 1.62% decrease in 24 hours.
3
4.3k
·
--
STOCKS | Hang Seng Tech Index Falls More Than 2% at OpenAccording to Jin10, Hong Kong's Hang Seng Tech Index fell more than 2% shortly after the open, with Nio (09866.HK) down nearly 5%, Alibaba (09988.HK), XPeng (09868.HK), and Zhipu (02513.HK) each falling more than 3.5%, while Baidu (09888.HK) and Trip.com Group-S (09961.HK) dropped more than 3%.
STOCKS | Hang Seng Tech Index Falls More Than 2% at Open
According to Jin10, Hong Kong's Hang Seng Tech Index fell more than 2% shortly after the open, with Nio (09866.HK) down nearly 5%, Alibaba (09988.HK), XPeng (09868.HK), and Zhipu (02513.HK) each falling more than 3.5%, while Baidu (09888.HK) and Trip.com Group-S (09961.HK) dropped more than 3%.
1
2
2.1k
·
--
Bitcoin Theft Suspect Malone Lam Pleads Guilty to Federal Racketeering ConspiracyMalone Lam pleaded guilty to a federal racketeering conspiracy charge tied to an alleged $240 million bitcoin theft. According to NS3.AI, prosecutors said Lam and others targeted a Washington, DC, resident through social engineering in August 2024. Lam faces a maximum prison sentence of 20 years.
Bitcoin Theft Suspect Malone Lam Pleads Guilty to Federal Racketeering Conspiracy
Malone Lam pleaded guilty to a federal racketeering conspiracy charge tied to an alleged $240 million bitcoin theft. According to NS3.AI, prosecutors said Lam and others targeted a Washington, DC, resident through social engineering in August 2024. Lam faces a maximum prison sentence of 20 years.
4
4.2k
·
--
STOCKS | U.S. Regulators Probe Nvidia's Licensing Deal With GroqTwo people familiar with the matter said the U.S. Department of Justice is investigating a deal Nvidia reached last year with AI chip maker Groq to determine whether Nvidia tried to avoid antitrust review. According to Sina Finance, Groq described the transaction at the time as a non-exclusive licensing agreement that allowed Nvidia to use chips Groq designed for artificial intelligence computing. As part of the agreement, Groq CEO Jonathan Ross and Chief Operating Officer Sunny Madra joined Nvidia.
STOCKS | U.S. Regulators Probe Nvidia's Licensing Deal With Groq
Two people familiar with the matter said the U.S. Department of Justice is investigating a deal Nvidia reached last year with AI chip maker Groq to determine whether Nvidia tried to avoid antitrust review. According to Sina Finance, Groq described the transaction at the time as a non-exclusive licensing agreement that allowed Nvidia to use chips Groq designed for artificial intelligence computing. As part of the agreement, Groq CEO Jonathan Ross and Chief Operating Officer Sunny Madra joined Nvidia.
1
1.1k
·
--
TSMC Reports Record August Revenue As AI Chip Demand Stays StrongAccording to CNBC, Taiwan Semiconductor Manufacturing Co. reported record monthly revenue for August of NT$514.8 billion, up 53.3% from a year earlier and 10.1% from July, as demand for chips used in artificial intelligence applications remained strong. The company said its monthly revenue has risen for four straight months. TSMC shares closed 0.61% lower on Thursday before the revenue release. In July, TSMC said AI-related demand remained "extremely robust" on its second-quarter earnings call, after reporting a more than 77% year-on-year jump in second-quarter profit and forecasting third-quarter revenue between $44.6 billion and $45.8 billion. Separately, TSMC and ASML this week announced an initiative to advance the industry's transition to next-generation chipmaking technology, with TSMC saying it plans to use ASML's High NA technology in large-scale manufacturing for advanced nodes starting in 2030.
TSMC Reports Record August Revenue As AI Chip Demand Stays Strong
According to CNBC, Taiwan Semiconductor Manufacturing Co. reported record monthly revenue for August of NT$514.8 billion, up 53.3% from a year earlier and 10.1% from July, as demand for chips used in artificial intelligence applications remained strong. The company said its monthly revenue has risen for four straight months. TSMC shares closed 0.61% lower on Thursday before the revenue release. In July, TSMC said AI-related demand remained "extremely robust" on its second-quarter earnings call, after reporting a more than 77% year-on-year jump in second-quarter profit and forecasting third-quarter revenue between $44.6 billion and $45.8 billion. Separately, TSMC and ASML this week announced an initiative to advance the industry's transition to next-generation chipmaking technology, with TSMC saying it plans to use ASML's High NA technology in large-scale manufacturing for advanced nodes starting in 2030.
543
·
--
Binance Announces THENA (THE) Trading Tournament With 400 BNB Prize PoolAccording to the announcement from Binance, the exchange will launch a THENA (THE) Trading Tournament that gives eligible users a chance to share a total prize pool of 400 BNB in token vouchers. The promotion period runs from 2026-09-10 10:00 (UTC) to 2026-09-17 10:00 (UTC), and participation is open to verified new users, regular users, and all Binance VIP users. Liquidity providers in the Binance Spot Liquidity Provider Program and Binance Brokers are not eligible. The eligible trading pairs are THE/USDT and THE/USDC. To qualify for rewards, users must register through the campaign page and complete at least 500 USD equivalent in total trading volume across the eligible pairs during the promotion period. Binance said the tournament will rank participants by cumulative trading volume, with rewards distributed as BNB token vouchers. The main reward pool includes 12 BNB for first place, 10 BNB for second, 8 BNB for third, 6 BNB for fourth, and 4 BNB for fifth. Users ranked 6th through 20th and 21st through 50th will each share 40 BNB, while 51st through 200th and 201st through 1,000th will share 64 BNB and 56 BNB, respectively. Remaining eligible participants will receive a proportional share of 80 BNB, capped at 0.05 BNB per user. Binance also said a Sprint Reward will run in two statistical periods, from 2026-09-10 10:00 (UTC) to 2026-09-12 10:00 (UTC) and from 2026-09-12 10:01 (UTC) to 2026-09-14 10:00 (UTC), with the top five traders in each round receiving 12 BNB, 10 BNB, 8 BNB, 6 BNB, and 4 BNB in token vouchers. Token vouchers will be distributed by 2026-10-01 and will expire within 21 days after distribution.
Binance Announces THENA (THE) Trading Tournament With 400 BNB Prize Pool
According to the announcement from Binance, the exchange will launch a THENA (THE) Trading Tournament that gives eligible users a chance to share a total prize pool of 400 BNB in token vouchers. The promotion period runs from 2026-09-10 10:00 (UTC) to 2026-09-17 10:00 (UTC), and participation is open to verified new users, regular users, and all Binance VIP users. Liquidity providers in the Binance Spot Liquidity Provider Program and Binance Brokers are not eligible. The eligible trading pairs are THE/USDT and THE/USDC. To qualify for rewards, users must register through the campaign page and complete at least 500 USD equivalent in total trading volume across the eligible pairs during the promotion period. Binance said the tournament will rank participants by cumulative trading volume, with rewards distributed as BNB token vouchers. The main reward pool includes 12 BNB for first place, 10 BNB for second, 8 BNB for third, 6 BNB for fourth, and 4 BNB for fifth. Users ranked 6th through 20th and 21st through 50th will each share 40 BNB, while 51st through 200th and 201st through 1,000th will share 64 BNB and 56 BNB, respectively. Remaining eligible participants will receive a proportional share of 80 BNB, capped at 0.05 BNB per user. Binance also said a Sprint Reward will run in two statistical periods, from 2026-09-10 10:00 (UTC) to 2026-09-12 10:00 (UTC) and from 2026-09-12 10:01 (UTC) to 2026-09-14 10:00 (UTC), with the top five traders in each round receiving 12 BNB, 10 BNB, 8 BNB, 6 BNB, and 4 BNB in token vouchers. Token vouchers will be distributed by 2026-10-01 and will expire within 21 days after distribution.
2k
Filter
Most Searched (6H)
USDT