
Tim0930
49 Posts

Tim0930
Report
Block User
223 Following
175 Followers
63 Liked
Posts
·
--
🔥 ZEC surges again! Is there going to be a second wave tonight?
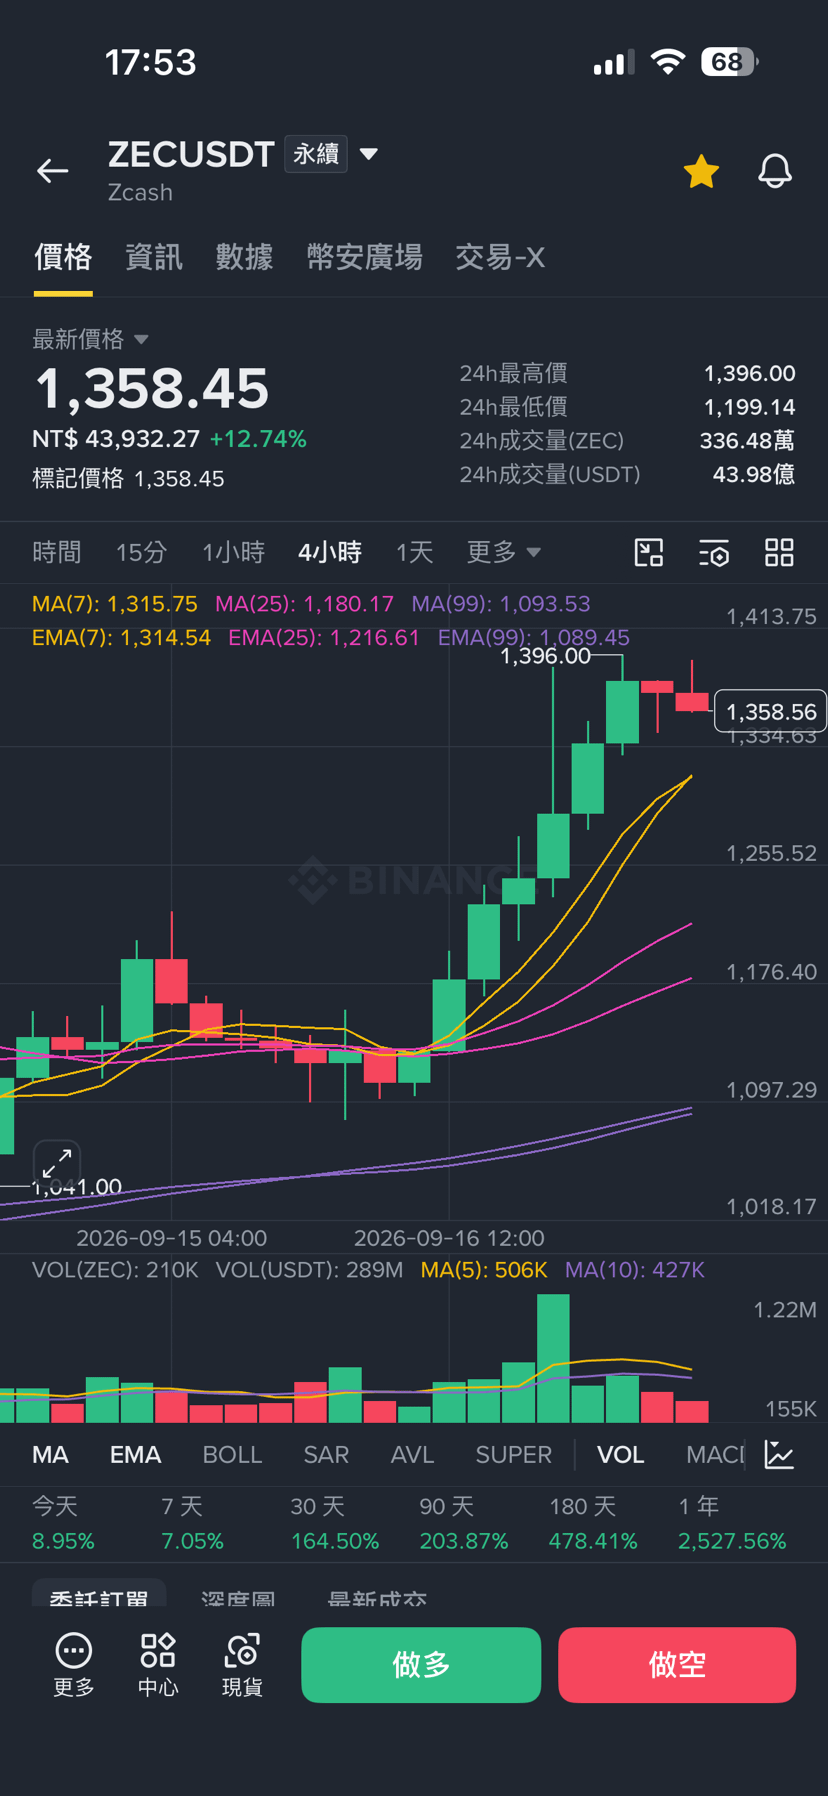
ZEC has completely carved out its own momentum these past few days. After a big jump yesterday, today’s high is already approaching $1,390, and bullish momentum remains extremely strong.
More importantly, this time isn’t just a simple follow-through of BTC.
🔥 The most important level for ZEC tonight is $1,400!
Once it truly breaks through and holds above it, the market’s next focus will very likely shift directly to the $1,500 psychological integer level.
High volatility = high opportunity, and it also means high risk. Be sure to manage leverage and set stop-losses on contracts.
👇 Click below to trade ZEC contracts$ZEC
{future}(ZECUSDT)
🔥 ZEC surges again! Is there going to be a second wave tonight?
ZEC has completely carved out its own momentum these past few days. After a big jump yesterday, today’s high is already approaching $1,390, and bullish momentum remains extremely strong.
More importantly, this time isn’t just a simple follow-through of BTC.
🔥 The most important level for ZEC tonight is $1,400!
Once it truly breaks through and holds above it, the market’s next focus will very likely shift directly to the $1,500 psychological integer level.
High volatility = high opportunity, and it also means high risk. Be sure to manage leverage and set stop-losses on contracts.
👇 Click below to trade ZEC contracts$ZEC
ZEC has completely carved out its own momentum these past few days. After a big jump yesterday, today’s high is already approaching $1,390, and bullish momentum remains extremely strong.
More importantly, this time isn’t just a simple follow-through of BTC.
🔥 The most important level for ZEC tonight is $1,400!
Once it truly breaks through and holds above it, the market’s next focus will very likely shift directly to the $1,500 psychological integer level.
High volatility = high opportunity, and it also means high risk. Be sure to manage leverage and set stop-losses on contracts.
👇 Click below to trade ZEC contracts$ZEC
1
95
·
--
🔥 Is BTC & ETH about to break down tonight? The key is after the US stock market opens!
The Fed has officially raised rates by 25 basis points and signaled that further rate hikes may still be on the way. In theory, that’s bearish for risk assets—but BTC and ETH haven’t directly collapsed. Instead, they’ve started showing signs of stabilizing and rebounding.
Right now, BTC is trading around $76,000–$77,000, and ETH has returned above $2,400.
📊 My trading plan for tonight:
🟠 $BTC
{future}(BTCUSDT)
As long as we hold $75,000–$75,500, there’s still a chance for a short-term rebound.
For the upside, first look at $77,000 → $78,200 → $80,000.
If price falls back below $75,000 again, be careful—bearish momentum may accelerate.
🔵 $ETH
{future}(ETHUSDT)
The strength of ETH’s rebound is worth watching. As long as $2,380–$2,400 doesn’t break, I’ll likely wait for a pullback and then look for long opportunities.
Upward targets:
🎯 TP1: 2,460
🎯 TP2: 2,500
🎯 TP3: 2,580
If it breaks below 2,370, the long-side structure will need to be reassessed.
⚠️ What you really need to pay attention to tonight is around the time the US stock market opens!
Besides the market continuing to digest the Fed’s rate hike, tonight there will also be US unemployment benefits, housing, and manufacturing data releases. If the data causes the market to raise expectations for further hikes again, the US dollar and Treasury yields may strengthen, putting renewed pressure on BTC and ETH. On the other hand, if market risk sentiment improves, watch for quick rallies caused by short-covering.
🔥 Tonight is not about blindly chasing longs, and it’s also not about shorting just because of the rate hike.
My plan is: as long as BTC holds around 75K and ETH holds around 2,400, we’ll observe whether the rebound continues. Once key support is lost, then we switch to a bearish mindset.
When market volatility increases, opportunities will show up as well—but you must control leverage and set stop-losses.
#BTC #ETH
🔥 Is BTC & ETH about to break down tonight? The key is after the US stock market opens!
The Fed has officially raised rates by 25 basis points and signaled that further rate hikes may still be on the way. In theory, that’s bearish for risk assets—but BTC and ETH haven’t directly collapsed. Instead, they’ve started showing signs of stabilizing and rebounding.
Right now, BTC is trading around $76,000–$77,000, and ETH has returned above $2,400.
📊 My trading plan for tonight:
🟠 $BTC
As long as we hold $75,000–$75,500, there’s still a chance for a short-term rebound.
For the upside, first look at $77,000 → $78,200 → $80,000.
If price falls back below $75,000 again, be careful—bearish momentum may accelerate.
🔵 $ETH
The strength of ETH’s rebound is worth watching. As long as $2,380–$2,400 doesn’t break, I’ll likely wait for a pullback and then look for long opportunities.
Upward targets:
🎯 TP1: 2,460
🎯 TP2: 2,500
🎯 TP3: 2,580
If it breaks below 2,370, the long-side structure will need to be reassessed.
⚠️ What you really need to pay attention to tonight is around the time the US stock market opens!
Besides the market continuing to digest the Fed’s rate hike, tonight there will also be US unemployment benefits, housing, and manufacturing data releases. If the data causes the market to raise expectations for further hikes again, the US dollar and Treasury yields may strengthen, putting renewed pressure on BTC and ETH. On the other hand, if market risk sentiment improves, watch for quick rallies caused by short-covering.
🔥 Tonight is not about blindly chasing longs, and it’s also not about shorting just because of the rate hike.
My plan is: as long as BTC holds around 75K and ETH holds around 2,400, we’ll observe whether the rebound continues. Once key support is lost, then we switch to a bearish mindset.
When market volatility increases, opportunities will show up as well—but you must control leverage and set stop-losses.
#BTC #ETH
The Fed has officially raised rates by 25 basis points and signaled that further rate hikes may still be on the way. In theory, that’s bearish for risk assets—but BTC and ETH haven’t directly collapsed. Instead, they’ve started showing signs of stabilizing and rebounding.
Right now, BTC is trading around $76,000–$77,000, and ETH has returned above $2,400.
📊 My trading plan for tonight:
🟠 $BTC
As long as we hold $75,000–$75,500, there’s still a chance for a short-term rebound.
For the upside, first look at $77,000 → $78,200 → $80,000.
If price falls back below $75,000 again, be careful—bearish momentum may accelerate.
🔵 $ETH
The strength of ETH’s rebound is worth watching. As long as $2,380–$2,400 doesn’t break, I’ll likely wait for a pullback and then look for long opportunities.
Upward targets:
🎯 TP1: 2,460
🎯 TP2: 2,500
🎯 TP3: 2,580
If it breaks below 2,370, the long-side structure will need to be reassessed.
⚠️ What you really need to pay attention to tonight is around the time the US stock market opens!
Besides the market continuing to digest the Fed’s rate hike, tonight there will also be US unemployment benefits, housing, and manufacturing data releases. If the data causes the market to raise expectations for further hikes again, the US dollar and Treasury yields may strengthen, putting renewed pressure on BTC and ETH. On the other hand, if market risk sentiment improves, watch for quick rallies caused by short-covering.
🔥 Tonight is not about blindly chasing longs, and it’s also not about shorting just because of the rate hike.
My plan is: as long as BTC holds around 75K and ETH holds around 2,400, we’ll observe whether the rebound continues. Once key support is lost, then we switch to a bearish mindset.
When market volatility increases, opportunities will show up as well—but you must control leverage and set stop-losses.
#BTC #ETH
1
209
·
--
🔥 NEAR surges strongly upward! Is it still worth chasing near 2.85?
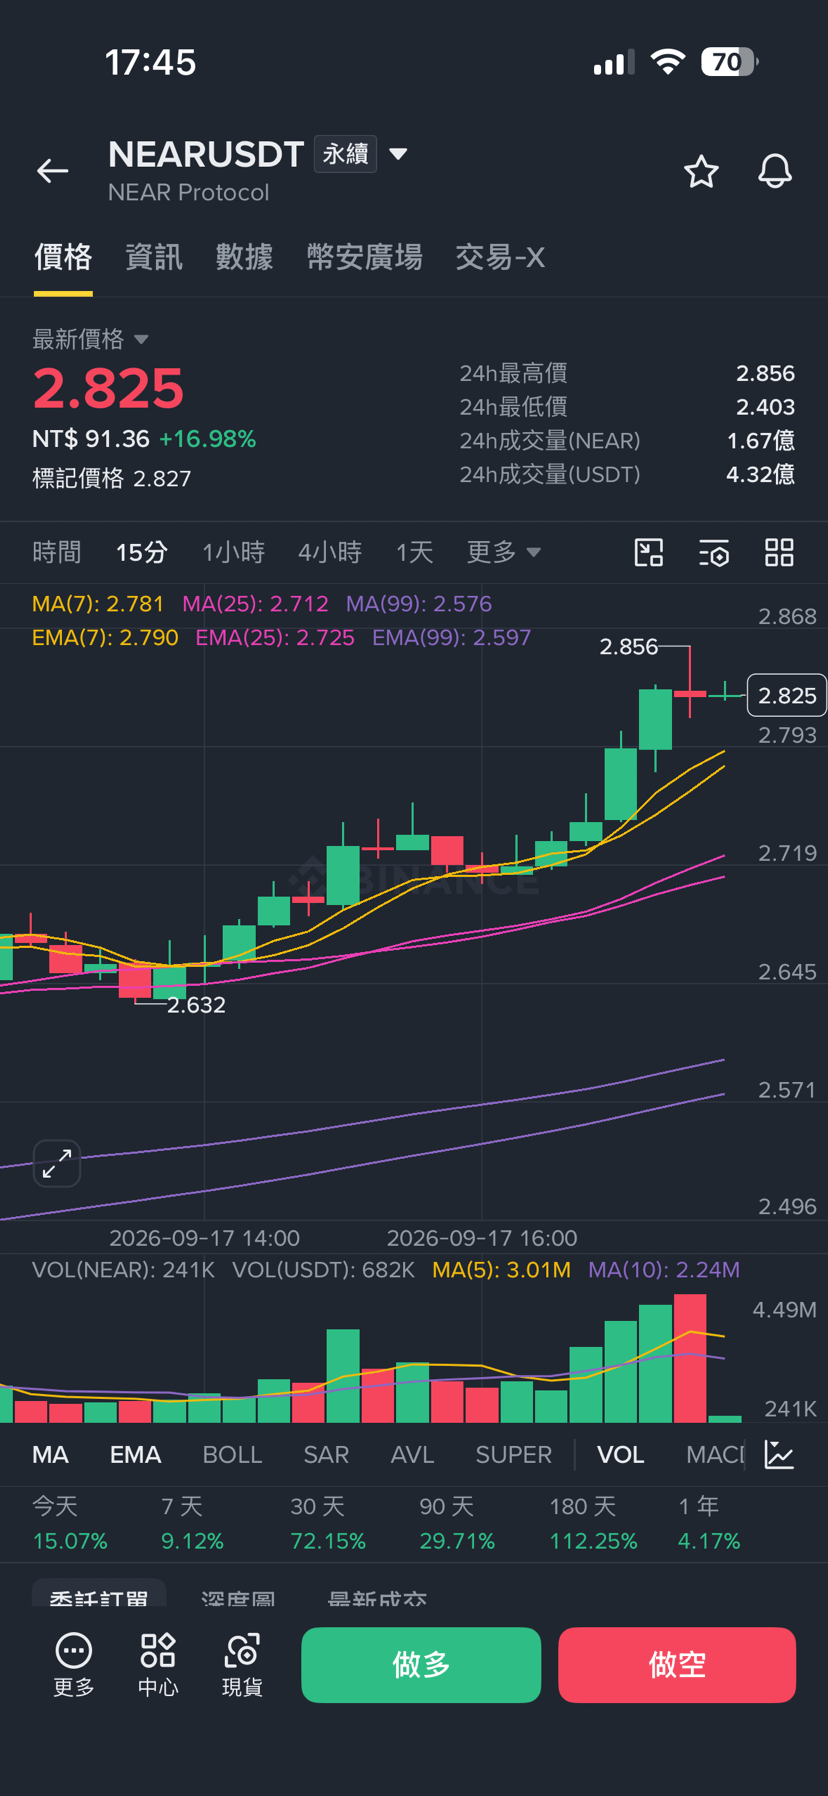
NEAR’s bulls have clearly gained momentum this round. Personally, I remain bullish, but after consecutive rallies it’s not advisable to blindly chase the highs. It’s better to wait for a pullback to confirm support, then look for a long entry.
📈 Long ideas
Entry reference: 2.78~2.85
Stop loss (SL): 2.68
🎯 TP1: 2.95
🎯 TP2: 3.08
🎯 TP3: 3.25
As long as NEAR can hold the 2.75~2.80 zone, I’ll keep the main strategy as buying on pullbacks. If there’s a breakout with volume above 2.95, the next thing to watch is whether 3.00~3.10 can hold firmly.
⚠️ NEAR’s volatility today has already been extremely high—use leverage carefully, control your position size, and always set a proper stop loss. My main strategy remains: generally bullish in trend, looking for opportunities on pullbacks rather than hard chasing at high levels.
🚀 If NEAR breaks above $3 next, volatility could expand even further.
👇 Click below to trade futures$NEAR
{future}(NEARUSDT)
🔥 NEAR surges strongly upward! Is it still worth chasing near 2.85?
NEAR’s bulls have clearly gained momentum this round. Personally, I remain bullish, but after consecutive rallies it’s not advisable to blindly chase the highs. It’s better to wait for a pullback to confirm support, then look for a long entry.
📈 Long ideas
Entry reference: 2.78~2.85
Stop loss (SL): 2.68
🎯 TP1: 2.95
🎯 TP2: 3.08
🎯 TP3: 3.25
As long as NEAR can hold the 2.75~2.80 zone, I’ll keep the main strategy as buying on pullbacks. If there’s a breakout with volume above 2.95, the next thing to watch is whether 3.00~3.10 can hold firmly.
⚠️ NEAR’s volatility today has already been extremely high—use leverage carefully, control your position size, and always set a proper stop loss. My main strategy remains: generally bullish in trend, looking for opportunities on pullbacks rather than hard chasing at high levels.
🚀 If NEAR breaks above $3 next, volatility could expand even further.
👇 Click below to trade futures$NEAR
NEAR’s bulls have clearly gained momentum this round. Personally, I remain bullish, but after consecutive rallies it’s not advisable to blindly chase the highs. It’s better to wait for a pullback to confirm support, then look for a long entry.
📈 Long ideas
Entry reference: 2.78~2.85
Stop loss (SL): 2.68
🎯 TP1: 2.95
🎯 TP2: 3.08
🎯 TP3: 3.25
As long as NEAR can hold the 2.75~2.80 zone, I’ll keep the main strategy as buying on pullbacks. If there’s a breakout with volume above 2.95, the next thing to watch is whether 3.00~3.10 can hold firmly.
⚠️ NEAR’s volatility today has already been extremely high—use leverage carefully, control your position size, and always set a proper stop loss. My main strategy remains: generally bullish in trend, looking for opportunities on pullbacks rather than hard chasing at high levels.
🚀 If NEAR breaks above $3 next, volatility could expand even further.
👇 Click below to trade futures$NEAR
1
84
·
--
🚨 Key turning point may come for U.S. stocks tonight! After the rate hike is finalized, should contracts go long or short?
The Fed officially raised rates by 25 basis points last night, bringing the interest rate range to 3.75%~4.00%. The latest rate projections also show there is still room for further rate hikes this year. This means the market is no longer focused on the question of “whether the Fed will hike,” but instead on—“how many more times will the Fed raise rates?” (Federal Reserve System)
After the rate hike announcement last night, U.S. stocks were under pressure for a time: the Dow fell about 1.2% and the S&P 500 dropped about 0.45%. But pre-market sentiment tonight has clearly improved. Currently, Nasdaq and S&P 500 futures have both rebounded. In addition, oil prices have pulled back, and Treasury yields have cooled off from their highs—giving risk assets a chance to catch their breath. (Reuters)
📈 My trading plan for tonight: first look for the rebound, but don’t chase it.
If after the open Nasdaq / S&P 500 can hold onto the pre-market gains, and Treasury yields continue to fall, then in the short term, it may be best to prioritize looking for pullback-long opportunities in tech stocks, semiconductors, and high-beta names.
However, keep in mind: the Fed’s stance this time is still somewhat hawkish, and the market has even started pricing in the possibility of the next rate hike. (Reuters)
So if tonight shows a high-open/low-close pattern along with yields rising again, be careful—bulls may only be seeing a temporary rebound. In that case, the contract direction could shift to waiting for short opportunities after the rebound hits resistance levels.
🔥 Don’t rush to guess the top or the bottom tonight—let the direction after the open tell you the answer first.
After a rate hike, price action usually comes with high volatility. Controlling leverage and setting stop-losses is more important than simply guessing long versus short.
$SNDK $MUU $SPCX
👇 If you’re preparing to trade tonight’s market, you can click below to enter the trading platform and capture the volatility opportunities after the rate hike!
{future}(SPCXUSDT)
{future}(SNDKUSDT)
🚨 Key turning point may come for U.S. stocks tonight! After the rate hike is finalized, should contracts go long or short?
The Fed officially raised rates by 25 basis points last night, bringing the interest rate range to 3.75%~4.00%. The latest rate projections also show there is still room for further rate hikes this year. This means the market is no longer focused on the question of “whether the Fed will hike,” but instead on—“how many more times will the Fed raise rates?” (Federal Reserve System)
After the rate hike announcement last night, U.S. stocks were under pressure for a time: the Dow fell about 1.2% and the S&P 500 dropped about 0.45%. But pre-market sentiment tonight has clearly improved. Currently, Nasdaq and S&P 500 futures have both rebounded. In addition, oil prices have pulled back, and Treasury yields have cooled off from their highs—giving risk assets a chance to catch their breath. (Reuters)
📈 My trading plan for tonight: first look for the rebound, but don’t chase it.
If after the open Nasdaq / S&P 500 can hold onto the pre-market gains, and Treasury yields continue to fall, then in the short term, it may be best to prioritize looking for pullback-long opportunities in tech stocks, semiconductors, and high-beta names.
However, keep in mind: the Fed’s stance this time is still somewhat hawkish, and the market has even started pricing in the possibility of the next rate hike. (Reuters)
So if tonight shows a high-open/low-close pattern along with yields rising again, be careful—bulls may only be seeing a temporary rebound. In that case, the contract direction could shift to waiting for short opportunities after the rebound hits resistance levels.
🔥 Don’t rush to guess the top or the bottom tonight—let the direction after the open tell you the answer first.
After a rate hike, price action usually comes with high volatility. Controlling leverage and setting stop-losses is more important than simply guessing long versus short.
$SNDK $MUU $SPCX
👇 If you’re preparing to trade tonight’s market, you can click below to enter the trading platform and capture the volatility opportunities after the rate hike!
The Fed officially raised rates by 25 basis points last night, bringing the interest rate range to 3.75%~4.00%. The latest rate projections also show there is still room for further rate hikes this year. This means the market is no longer focused on the question of “whether the Fed will hike,” but instead on—“how many more times will the Fed raise rates?” (Federal Reserve System)
After the rate hike announcement last night, U.S. stocks were under pressure for a time: the Dow fell about 1.2% and the S&P 500 dropped about 0.45%. But pre-market sentiment tonight has clearly improved. Currently, Nasdaq and S&P 500 futures have both rebounded. In addition, oil prices have pulled back, and Treasury yields have cooled off from their highs—giving risk assets a chance to catch their breath. (Reuters)
📈 My trading plan for tonight: first look for the rebound, but don’t chase it.
If after the open Nasdaq / S&P 500 can hold onto the pre-market gains, and Treasury yields continue to fall, then in the short term, it may be best to prioritize looking for pullback-long opportunities in tech stocks, semiconductors, and high-beta names.
However, keep in mind: the Fed’s stance this time is still somewhat hawkish, and the market has even started pricing in the possibility of the next rate hike. (Reuters)
So if tonight shows a high-open/low-close pattern along with yields rising again, be careful—bulls may only be seeing a temporary rebound. In that case, the contract direction could shift to waiting for short opportunities after the rebound hits resistance levels.
🔥 Don’t rush to guess the top or the bottom tonight—let the direction after the open tell you the answer first.
After a rate hike, price action usually comes with high volatility. Controlling leverage and setting stop-losses is more important than simply guessing long versus short.
$SNDK $MUU $SPCX
👇 If you’re preparing to trade tonight’s market, you can click below to enter the trading platform and capture the volatility opportunities after the rate hike!
1
343
·
--
🚀 SPCX|Is the Next Market Wave for SpaceX Brewing?
SPCX has recently returned to the spotlight in the market, but what’s truly worth paying attention to may not be just the stock price itself.
SpaceX’s upcoming Starship test flights, Starlink satellite deployments, and AI and space computing initiatives are all likely to continue gaining momentum. In particular, Starship Flight 14 is expected to become an important milestone, and any progress beyond expectations could directly amplify SPCX’s short-term volatility.
📈 Bullish to watch:
If the price breaks through recent resistance and manages to hold, then after funds return to chase higher, it could kick off a new round of upward momentum.
📉 Bearish to watch:
If positive catalysts fail to push the price higher, or instead you see a high-volume breakout followed by a pullback, be careful— the market may be pricing in the news early, and the short-term could see a rapid retracement.
⚠️ What matters most for SPCX right now isn’t guessing whether it will go up or down, but waiting for both “direction + trading volume” to confirm together.
The next major development with Starship is very likely to act as the catalyst for market volatility.
🔥 Do you think SPCX will break through first this time, or pull back first?
👇 Click below to enter the trade and get ahead of SPCX’s next market wave!
$SPCX
#SPCX #SpaceX #行情分析📈
{future}(SPCXUSDT)
🚀 SPCX|Is the Next Market Wave for SpaceX Brewing?
SPCX has recently returned to the spotlight in the market, but what’s truly worth paying attention to may not be just the stock price itself.
SpaceX’s upcoming Starship test flights, Starlink satellite deployments, and AI and space computing initiatives are all likely to continue gaining momentum. In particular, Starship Flight 14 is expected to become an important milestone, and any progress beyond expectations could directly amplify SPCX’s short-term volatility.
📈 Bullish to watch:
If the price breaks through recent resistance and manages to hold, then after funds return to chase higher, it could kick off a new round of upward momentum.
📉 Bearish to watch:
If positive catalysts fail to push the price higher, or instead you see a high-volume breakout followed by a pullback, be careful— the market may be pricing in the news early, and the short-term could see a rapid retracement.
⚠️ What matters most for SPCX right now isn’t guessing whether it will go up or down, but waiting for both “direction + trading volume” to confirm together.
The next major development with Starship is very likely to act as the catalyst for market volatility.
🔥 Do you think SPCX will break through first this time, or pull back first?
👇 Click below to enter the trade and get ahead of SPCX’s next market wave!
$SPCX
#SPCX #SpaceX #行情分析📈
SPCX has recently returned to the spotlight in the market, but what’s truly worth paying attention to may not be just the stock price itself.
SpaceX’s upcoming Starship test flights, Starlink satellite deployments, and AI and space computing initiatives are all likely to continue gaining momentum. In particular, Starship Flight 14 is expected to become an important milestone, and any progress beyond expectations could directly amplify SPCX’s short-term volatility.
📈 Bullish to watch:
If the price breaks through recent resistance and manages to hold, then after funds return to chase higher, it could kick off a new round of upward momentum.
📉 Bearish to watch:
If positive catalysts fail to push the price higher, or instead you see a high-volume breakout followed by a pullback, be careful— the market may be pricing in the news early, and the short-term could see a rapid retracement.
⚠️ What matters most for SPCX right now isn’t guessing whether it will go up or down, but waiting for both “direction + trading volume” to confirm together.
The next major development with Starship is very likely to act as the catalyst for market volatility.
🔥 Do you think SPCX will break through first this time, or pull back first?
👇 Click below to enter the trade and get ahead of SPCX’s next market wave!
$SPCX
#SPCX #SpaceX #行情分析📈
1
179
·
--
Verified
🚨 The Fed officially raises rates! BTC & ETH’s real market move may just be starting
This time, the Fed announced a 25-basis-point hike, raising the interest rate range to 3.75%–4.00%, and it was unanimously approved 12:0. More importantly, the Fed’s latest rate projections remain hawkish, meaning the market can’t just focus on “this rate hike” anymore—it needs to start trading “whether further hikes will continue.”
📉 What impact does this have on BTC and ETH?
Rate hikes usually mean higher funding costs, with upward pressure on the dollar and U.S. Treasury yields—conditions that are generally not friendly for risk assets like BTC and ETH in the short term. After the announcement, BTC briefly fluctuated between $75,000 and $76,500, while ETH saw sharp swings around $2,370–$2,430.
🔥 The real focus now is futures trading
At the moment, I’m paying more attention to whether rebounds can hold, rather than chasing shorts when there’s a sudden drop or chasing longs when there’s a quick rally.
If BTC can reclaim a key resistance zone and show a breakout with increased volume, then there’s a chance to see a rebound after the rate-hike “bad news” is priced in. Otherwise, if it breaks below recent support again, the bears may continue testing lower levels.
ETH tends to be more volatile than BTC—both long and short opportunities can appear in the short term—but with leverage, especially, position sizing and stop-losses must be strictly controlled.
⚠️ The Fed’s rate-hike outcome has already been announced, but what the market is truly pricing is “what happens next.” Every time BTC and ETH break above or below key levels going forward, it could create fresh futures trading opportunities.
$BTC $ETH $ZEC
#加息
{future}(ZECUSDT)
{future}(ETHUSDT)
{future}(BTCUSDT)
👇 Click below to enter futures trading and catch the next wave for BTC & ETH
🚨 The Fed officially raises rates! BTC & ETH’s real market move may just be starting
This time, the Fed announced a 25-basis-point hike, raising the interest rate range to 3.75%–4.00%, and it was unanimously approved 12:0. More importantly, the Fed’s latest rate projections remain hawkish, meaning the market can’t just focus on “this rate hike” anymore—it needs to start trading “whether further hikes will continue.”
📉 What impact does this have on BTC and ETH?
Rate hikes usually mean higher funding costs, with upward pressure on the dollar and U.S. Treasury yields—conditions that are generally not friendly for risk assets like BTC and ETH in the short term. After the announcement, BTC briefly fluctuated between $75,000 and $76,500, while ETH saw sharp swings around $2,370–$2,430.
🔥 The real focus now is futures trading
At the moment, I’m paying more attention to whether rebounds can hold, rather than chasing shorts when there’s a sudden drop or chasing longs when there’s a quick rally.
If BTC can reclaim a key resistance zone and show a breakout with increased volume, then there’s a chance to see a rebound after the rate-hike “bad news” is priced in. Otherwise, if it breaks below recent support again, the bears may continue testing lower levels.
ETH tends to be more volatile than BTC—both long and short opportunities can appear in the short term—but with leverage, especially, position sizing and stop-losses must be strictly controlled.
⚠️ The Fed’s rate-hike outcome has already been announced, but what the market is truly pricing is “what happens next.” Every time BTC and ETH break above or below key levels going forward, it could create fresh futures trading opportunities.
$BTC $ETH $ZEC
#加息
👇 Click below to enter futures trading and catch the next wave for BTC & ETH
This time, the Fed announced a 25-basis-point hike, raising the interest rate range to 3.75%–4.00%, and it was unanimously approved 12:0. More importantly, the Fed’s latest rate projections remain hawkish, meaning the market can’t just focus on “this rate hike” anymore—it needs to start trading “whether further hikes will continue.”
📉 What impact does this have on BTC and ETH?
Rate hikes usually mean higher funding costs, with upward pressure on the dollar and U.S. Treasury yields—conditions that are generally not friendly for risk assets like BTC and ETH in the short term. After the announcement, BTC briefly fluctuated between $75,000 and $76,500, while ETH saw sharp swings around $2,370–$2,430.
🔥 The real focus now is futures trading
At the moment, I’m paying more attention to whether rebounds can hold, rather than chasing shorts when there’s a sudden drop or chasing longs when there’s a quick rally.
If BTC can reclaim a key resistance zone and show a breakout with increased volume, then there’s a chance to see a rebound after the rate-hike “bad news” is priced in. Otherwise, if it breaks below recent support again, the bears may continue testing lower levels.
ETH tends to be more volatile than BTC—both long and short opportunities can appear in the short term—but with leverage, especially, position sizing and stop-losses must be strictly controlled.
⚠️ The Fed’s rate-hike outcome has already been announced, but what the market is truly pricing is “what happens next.” Every time BTC and ETH break above or below key levels going forward, it could create fresh futures trading opportunities.
$BTC $ETH $ZEC
#加息
👇 Click below to enter futures trading and catch the next wave for BTC & ETH
1
261
·
--
🚨 ONE Is about to make a big move next? Attention contract traders!
Recently, market attention on ONE has been gradually heating up, and short-term volatility has started to intensify. For contract traders, this kind of market often means more opportunities, but it also makes quick spikes and wick-driven stop hunts more likely.
📈 Bullish scenario:
If ONE can break above resistance with increased volume, and after a pullback it manages to hold and stand its ground, there’s a chance that short-term bullish momentum could continue—possibly even triggering the next leg of a rally.
📉 Bearish scenario:
If the price spikes higher but volume can’t keep up, or after breaking out it rapidly falls back into the original range, be cautious of a false breakout—followed by a swift pullback may be on the way.
🔥 Key points for contract trading:
Don’t see a sudden surge and immediately chase longs. Also, don’t see a big bullish candle and rush to short. Wait for direction confirmation, manage leverage, and set stop-losses—this is more suitable for handling ONE’s high-volatility environment.
Now it’s all about whether ONE can break through the key levels. Once volume and price move in sync, the market may truly start!
👇 Click below to trade ONE contracts
$ONE
#one #ONEUSDT
{future}(ONEUSDT)
🚨 ONE Is about to make a big move next? Attention contract traders!
Recently, market attention on ONE has been gradually heating up, and short-term volatility has started to intensify. For contract traders, this kind of market often means more opportunities, but it also makes quick spikes and wick-driven stop hunts more likely.
📈 Bullish scenario:
If ONE can break above resistance with increased volume, and after a pullback it manages to hold and stand its ground, there’s a chance that short-term bullish momentum could continue—possibly even triggering the next leg of a rally.
📉 Bearish scenario:
If the price spikes higher but volume can’t keep up, or after breaking out it rapidly falls back into the original range, be cautious of a false breakout—followed by a swift pullback may be on the way.
🔥 Key points for contract trading:
Don’t see a sudden surge and immediately chase longs. Also, don’t see a big bullish candle and rush to short. Wait for direction confirmation, manage leverage, and set stop-losses—this is more suitable for handling ONE’s high-volatility environment.
Now it’s all about whether ONE can break through the key levels. Once volume and price move in sync, the market may truly start!
👇 Click below to trade ONE contracts
$ONE
#one #ONEUSDT
Recently, market attention on ONE has been gradually heating up, and short-term volatility has started to intensify. For contract traders, this kind of market often means more opportunities, but it also makes quick spikes and wick-driven stop hunts more likely.
📈 Bullish scenario:
If ONE can break above resistance with increased volume, and after a pullback it manages to hold and stand its ground, there’s a chance that short-term bullish momentum could continue—possibly even triggering the next leg of a rally.
📉 Bearish scenario:
If the price spikes higher but volume can’t keep up, or after breaking out it rapidly falls back into the original range, be cautious of a false breakout—followed by a swift pullback may be on the way.
🔥 Key points for contract trading:
Don’t see a sudden surge and immediately chase longs. Also, don’t see a big bullish candle and rush to short. Wait for direction confirmation, manage leverage, and set stop-losses—this is more suitable for handling ONE’s high-volatility environment.
Now it’s all about whether ONE can break through the key levels. Once volume and price move in sync, the market may truly start!
👇 Click below to trade ONE contracts
$ONE
#one #ONEUSDT
1
402
·
--
🚨 The Korean stock market is about to open! Can SK Hynix withstand the pressure from a Fed rate hike?
After the Fed raised rates, market risk sentiment cooled, and tech and semiconductor stocks may face short-term volatility.
🇰🇷 KORU: Watch whether capital quickly returns after the market opens
🔥 SK Hynix: The AI + HBM theme still has support. If there’s a strong pullback in the early session followed by solid buying support, it’s not out of the question that it could move into a “drop first, then rally.”
Today’s opening performance of SK Hynix may directly determine the direction for Korean semiconductor stocks!
$KORU $SKHYNIX #KORU #海力士
👇 Click below to trade and catch the market’s fluctuations!
{future}(KORUUSDT)
{future}(SKHYNIXUSDT)
🚨 The Korean stock market is about to open! Can SK Hynix withstand the pressure from a Fed rate hike?
After the Fed raised rates, market risk sentiment cooled, and tech and semiconductor stocks may face short-term volatility.
🇰🇷 KORU: Watch whether capital quickly returns after the market opens
🔥 SK Hynix: The AI + HBM theme still has support. If there’s a strong pullback in the early session followed by solid buying support, it’s not out of the question that it could move into a “drop first, then rally.”
Today’s opening performance of SK Hynix may directly determine the direction for Korean semiconductor stocks!
$KORU $SKHYNIX #KORU #海力士
👇 Click below to trade and catch the market’s fluctuations!
After the Fed raised rates, market risk sentiment cooled, and tech and semiconductor stocks may face short-term volatility.
🇰🇷 KORU: Watch whether capital quickly returns after the market opens
🔥 SK Hynix: The AI + HBM theme still has support. If there’s a strong pullback in the early session followed by solid buying support, it’s not out of the question that it could move into a “drop first, then rally.”
Today’s opening performance of SK Hynix may directly determine the direction for Korean semiconductor stocks!
$KORU $SKHYNIX #KORU #海力士
👇 Click below to trade and catch the market’s fluctuations!
1
605
·
--
🚨 The Fed’s rate hike is officially in! Where will BTC and ETH’s next leg of the market go?
The Fed raised rates by 25 basis points, bringing a new round of volatility to the market! The real key next is the future rate policy and the direction of capital flows.
📈 BTC: Watch the $75,000 support level. If it holds, there’s a chance for a rebound—if it breaks, be alert to downside risk.
🔥 ETH: Keep an eye on the $2,350 support level. If it can regain and hold above $2,430, the rebound momentum in the short term is worth monitoring.
⚡ Futures/contract strategy: Consider going long after a breakout of resistance and a pullback for confirmation; consider going short if support breaks and rebounds lack strength. Avoid chasing pumps and selling crashes—set a stop-loss without fail!
💰 Big moves in the market often come with high risk. Good risk management is what lets you seize opportunities!
👇 Click below to trade and catch the next leg for BTC and ETH!
#BTC #ETH #美联储加息是否已成定局
$BTC $ETH
{future}(ETHUSDT)
{future}(BTCUSDT)
🚨 The Fed’s rate hike is officially in! Where will BTC and ETH’s next leg of the market go?
The Fed raised rates by 25 basis points, bringing a new round of volatility to the market! The real key next is the future rate policy and the direction of capital flows.
📈 BTC: Watch the $75,000 support level. If it holds, there’s a chance for a rebound—if it breaks, be alert to downside risk.
🔥 ETH: Keep an eye on the $2,350 support level. If it can regain and hold above $2,430, the rebound momentum in the short term is worth monitoring.
⚡ Futures/contract strategy: Consider going long after a breakout of resistance and a pullback for confirmation; consider going short if support breaks and rebounds lack strength. Avoid chasing pumps and selling crashes—set a stop-loss without fail!
💰 Big moves in the market often come with high risk. Good risk management is what lets you seize opportunities!
👇 Click below to trade and catch the next leg for BTC and ETH!
#BTC #ETH #美联储加息是否已成定局
$BTC $ETH
The Fed raised rates by 25 basis points, bringing a new round of volatility to the market! The real key next is the future rate policy and the direction of capital flows.
📈 BTC: Watch the $75,000 support level. If it holds, there’s a chance for a rebound—if it breaks, be alert to downside risk.
🔥 ETH: Keep an eye on the $2,350 support level. If it can regain and hold above $2,430, the rebound momentum in the short term is worth monitoring.
⚡ Futures/contract strategy: Consider going long after a breakout of resistance and a pullback for confirmation; consider going short if support breaks and rebounds lack strength. Avoid chasing pumps and selling crashes—set a stop-loss without fail!
💰 Big moves in the market often come with high risk. Good risk management is what lets you seize opportunities!
👇 Click below to trade and catch the next leg for BTC and ETH!
#BTC #ETH #美联储加息是否已成定局
$BTC $ETH
3
3.6k
·
--
$BTC $ETH
🚨 The Fed’s interest rate decision ignites the market! Will BTC and ETH be heading for a major shakeout soon? The real行情 is only just beginning!
September 17, 2026|In-depth analysis of the cryptocurrency market
The latest Fed interest rate decision is officially out!
Global financial markets are once again focused on the Federal Reserve, and Bitcoin and Ethereum have also reached a critical moment.
This time, it may not be the interest rate number itself that determines the direction of the market, but rather how the market interprets the Fed’s policy path going forward!
Has the downside already been priced in? Can BTC break through key resistance? Will ETH become the target of the next wave of capital chasing?
🔥 I. The rate decision lands—why BTC may not necessarily crash
Many people think that Fed rate hikes are bearish, so Bitcoin must fall. But the market is never that simple.
Rate hikes usually mean higher funding costs, stronger appeal of the USD and U.S. Treasuries, and potential selling pressure on risk assets.
However, if the market has already priced in the rate-hike expectations in advance, then after the decision is announced, you may actually see a rebound as the “bad news” is fully digested.
📈 Bull case: bad news fully digested, funds return. If BTC holds key support and then breaks back above the overhead resistance zone, the market could see a round of short-covering rallies.
📉 Bear case: hawkish signals trigger selling. If the Fed releases signals of maintaining high rates for a longer period, with the USD and U.S. Treasury yields continuing to strengthen, BTC could face renewed pressure.
What really matters is not the immediate spike or drop at the announcement, but whether the trend can continue!
🎯 How to look at the next BTC and ETH moves
BTC|Focus on key support and breakouts. Holding the resistance zone and seeing trading volume expand could open further rebound space; if support breaks, downside risk must be watched.
ETH|Focus on fund flows and relative strength. If ETH/BTC keeps strengthening and ETH breaks through major resistance, it may suggest the market’s risk appetite is improving.
👉 Click below to trade and seize opportunities from market volatility!
#BTC #ETH #fomc #加密货币
{future}(ETHUSDT)
{future}(BTCUSDT)
$BTC $ETH
🚨 The Fed’s interest rate decision ignites the market! Will BTC and ETH be heading for a major shakeout soon? The real行情 is only just beginning!
September 17, 2026|In-depth analysis of the cryptocurrency market
The latest Fed interest rate decision is officially out!
Global financial markets are once again focused on the Federal Reserve, and Bitcoin and Ethereum have also reached a critical moment.
This time, it may not be the interest rate number itself that determines the direction of the market, but rather how the market interprets the Fed’s policy path going forward!
Has the downside already been priced in? Can BTC break through key resistance? Will ETH become the target of the next wave of capital chasing?
🔥 I. The rate decision lands—why BTC may not necessarily crash
Many people think that Fed rate hikes are bearish, so Bitcoin must fall. But the market is never that simple.
Rate hikes usually mean higher funding costs, stronger appeal of the USD and U.S. Treasuries, and potential selling pressure on risk assets.
However, if the market has already priced in the rate-hike expectations in advance, then after the decision is announced, you may actually see a rebound as the “bad news” is fully digested.
📈 Bull case: bad news fully digested, funds return. If BTC holds key support and then breaks back above the overhead resistance zone, the market could see a round of short-covering rallies.
📉 Bear case: hawkish signals trigger selling. If the Fed releases signals of maintaining high rates for a longer period, with the USD and U.S. Treasury yields continuing to strengthen, BTC could face renewed pressure.
What really matters is not the immediate spike or drop at the announcement, but whether the trend can continue!
🎯 How to look at the next BTC and ETH moves
BTC|Focus on key support and breakouts. Holding the resistance zone and seeing trading volume expand could open further rebound space; if support breaks, downside risk must be watched.
ETH|Focus on fund flows and relative strength. If ETH/BTC keeps strengthening and ETH breaks through major resistance, it may suggest the market’s risk appetite is improving.
👉 Click below to trade and seize opportunities from market volatility!
#BTC #ETH #fomc #加密货币
🚨 The Fed’s interest rate decision ignites the market! Will BTC and ETH be heading for a major shakeout soon? The real行情 is only just beginning!
September 17, 2026|In-depth analysis of the cryptocurrency market
The latest Fed interest rate decision is officially out!
Global financial markets are once again focused on the Federal Reserve, and Bitcoin and Ethereum have also reached a critical moment.
This time, it may not be the interest rate number itself that determines the direction of the market, but rather how the market interprets the Fed’s policy path going forward!
Has the downside already been priced in? Can BTC break through key resistance? Will ETH become the target of the next wave of capital chasing?
🔥 I. The rate decision lands—why BTC may not necessarily crash
Many people think that Fed rate hikes are bearish, so Bitcoin must fall. But the market is never that simple.
Rate hikes usually mean higher funding costs, stronger appeal of the USD and U.S. Treasuries, and potential selling pressure on risk assets.
However, if the market has already priced in the rate-hike expectations in advance, then after the decision is announced, you may actually see a rebound as the “bad news” is fully digested.
📈 Bull case: bad news fully digested, funds return. If BTC holds key support and then breaks back above the overhead resistance zone, the market could see a round of short-covering rallies.
📉 Bear case: hawkish signals trigger selling. If the Fed releases signals of maintaining high rates for a longer period, with the USD and U.S. Treasury yields continuing to strengthen, BTC could face renewed pressure.
What really matters is not the immediate spike or drop at the announcement, but whether the trend can continue!
🎯 How to look at the next BTC and ETH moves
BTC|Focus on key support and breakouts. Holding the resistance zone and seeing trading volume expand could open further rebound space; if support breaks, downside risk must be watched.
ETH|Focus on fund flows and relative strength. If ETH/BTC keeps strengthening and ETH breaks through major resistance, it may suggest the market’s risk appetite is improving.
👉 Click below to trade and seize opportunities from market volatility!
#BTC #ETH #fomc #加密货币
1
1.3k
·
--
30D trade $ZEC 25.8K USDT
$ZEC 🚀 ZEC Goes Berserk! Is there still a chance for those who didn’t get on board yesterday? The long/short contract showdown is about to begin!
From yesterday to today, it has continued to surge strongly, and market attention is once again focused on this privacy coin!
While many traders are still watching the direction of BTC and ETH, ZEC has already shown astonishing volatility.
But the most important question now isn’t how much it has already risen—it’s:
🔥 Is this rally just the continuation of the main upswing, or the final celebration of the bulls?
📈 1. Why is ZEC so strong?
Recently, ZEC’s price action has been influenced by the privacy-coin narrative, capital attention, and leveraged positions in the futures market.
When the price climbs rapidly, short positions are forced to cover, which can trigger a continuous short-squeeze—further accelerating the rally.
But also keep in mind: rallies driven by futures funding are often accompanied by violent fluctuations.
The faster it rises, it doesn’t necessarily mean it will keep rising!
⚔️ 2. Long/short trading opportunities ahead
🟢 Bullish scenario: Pullback holds—continue to challenge new highs
If after ZEC pulls back, it can hold the prior breakout range, and the trading volume continues to expand, there’s a chance it will test the recent highs again.
What’s truly worth watching isn’t chasing every big bullish candle—it’s whether it can stand firm after breaking out!
🔴 Bearish scenario: A false breakout—profit-taking starts to rush out
If ZEC repeatedly fails to break the highs, and the 15-minute and 1-hour candles show clear weakening, you should pay attention to the pressure from short-term profit-taking.
Especially if the price breaks below the key support from the prior wave, it could trigger a chain of stop-losses for leveraged long positions, causing the pullback to happen faster than expected.
💰 3. What should contract traders pay attention to right now?
The biggest feature of ZEC right now is volatility!
Higher volatility means more trading opportunities, but it also means the liquidation risk increases at the same time.
Next, focus on observing:
▪️ Whether recent highs can be broken effectively
▪️ Whether trading volume shrinks during the pullback
▪️ Changes in open interest and funding rates
▪️ Whether BTC and ETH show simultaneous weakening
Real opportunities often appear when the market direction becomes increasingly clear.
Comment and tell me—are you on the bulls’ side or the bears’ side?
👇 Click below to trade, and let’s keep an eye on ZEC’s next long/short行情!
#zec #Zcash
$ZEC 🚀 ZEC Goes Berserk! Is there still a chance for those who didn’t get on board yesterday? The long/short contract showdown is about to begin!
From yesterday to today, it has continued to surge strongly, and market attention is once again focused on this privacy coin!
While many traders are still watching the direction of BTC and ETH, ZEC has already shown astonishing volatility.
But the most important question now isn’t how much it has already risen—it’s:
🔥 Is this rally just the continuation of the main upswing, or the final celebration of the bulls?
📈 1. Why is ZEC so strong?
Recently, ZEC’s price action has been influenced by the privacy-coin narrative, capital attention, and leveraged positions in the futures market.
When the price climbs rapidly, short positions are forced to cover, which can trigger a continuous short-squeeze—further accelerating the rally.
But also keep in mind: rallies driven by futures funding are often accompanied by violent fluctuations.
The faster it rises, it doesn’t necessarily mean it will keep rising!
⚔️ 2. Long/short trading opportunities ahead
🟢 Bullish scenario: Pullback holds—continue to challenge new highs
If after ZEC pulls back, it can hold the prior breakout range, and the trading volume continues to expand, there’s a chance it will test the recent highs again.
What’s truly worth watching isn’t chasing every big bullish candle—it’s whether it can stand firm after breaking out!
🔴 Bearish scenario: A false breakout—profit-taking starts to rush out
If ZEC repeatedly fails to break the highs, and the 15-minute and 1-hour candles show clear weakening, you should pay attention to the pressure from short-term profit-taking.
Especially if the price breaks below the key support from the prior wave, it could trigger a chain of stop-losses for leveraged long positions, causing the pullback to happen faster than expected.
💰 3. What should contract traders pay attention to right now?
The biggest feature of ZEC right now is volatility!
Higher volatility means more trading opportunities, but it also means the liquidation risk increases at the same time.
Next, focus on observing:
▪️ Whether recent highs can be broken effectively
▪️ Whether trading volume shrinks during the pullback
▪️ Changes in open interest and funding rates
▪️ Whether BTC and ETH show simultaneous weakening
Real opportunities often appear when the market direction becomes increasingly clear.
Comment and tell me—are you on the bulls’ side or the bears’ side?
👇 Click below to trade, and let’s keep an eye on ZEC’s next long/short行情!
#zec #Zcash
From yesterday to today, it has continued to surge strongly, and market attention is once again focused on this privacy coin!
While many traders are still watching the direction of BTC and ETH, ZEC has already shown astonishing volatility.
But the most important question now isn’t how much it has already risen—it’s:
🔥 Is this rally just the continuation of the main upswing, or the final celebration of the bulls?
📈 1. Why is ZEC so strong?
Recently, ZEC’s price action has been influenced by the privacy-coin narrative, capital attention, and leveraged positions in the futures market.
When the price climbs rapidly, short positions are forced to cover, which can trigger a continuous short-squeeze—further accelerating the rally.
But also keep in mind: rallies driven by futures funding are often accompanied by violent fluctuations.
The faster it rises, it doesn’t necessarily mean it will keep rising!
⚔️ 2. Long/short trading opportunities ahead
🟢 Bullish scenario: Pullback holds—continue to challenge new highs
If after ZEC pulls back, it can hold the prior breakout range, and the trading volume continues to expand, there’s a chance it will test the recent highs again.
What’s truly worth watching isn’t chasing every big bullish candle—it’s whether it can stand firm after breaking out!
🔴 Bearish scenario: A false breakout—profit-taking starts to rush out
If ZEC repeatedly fails to break the highs, and the 15-minute and 1-hour candles show clear weakening, you should pay attention to the pressure from short-term profit-taking.
Especially if the price breaks below the key support from the prior wave, it could trigger a chain of stop-losses for leveraged long positions, causing the pullback to happen faster than expected.
💰 3. What should contract traders pay attention to right now?
The biggest feature of ZEC right now is volatility!
Higher volatility means more trading opportunities, but it also means the liquidation risk increases at the same time.
Next, focus on observing:
▪️ Whether recent highs can be broken effectively
▪️ Whether trading volume shrinks during the pullback
▪️ Changes in open interest and funding rates
▪️ Whether BTC and ETH show simultaneous weakening
Real opportunities often appear when the market direction becomes increasingly clear.
Comment and tell me—are you on the bulls’ side or the bears’ side?
👇 Click below to trade, and let’s keep an eye on ZEC’s next long/short行情!
#zec #Zcash
1
2
391
·
--
$BULLA
{future}(BULLAUSDT)
🚨 BULLA Contract Long/Short Battle! Is the next move a violent surge, or a jump down from the high? Check these signals before you trade!
Recently, altcoin market action has been getting more and more intense, and BULLAUSDT has also become a contract trading target worth paying attention to!
For short-term traders, the most important question is not how much the price has already risen, but whether there is enough buying pressure to support the next move.
🔥 I. What to watch next for BULLA?
When small- and mid-cap tokens see a rapid rally, the market usually needs to monitor three signals:
① Is trading volume continuing to increase?
② Is open interest rising in sync?
③ Does the funding rate show an overconcentration of long or short positions?
If the price is rising and volume is increasing, it may indicate buyers are stepping in.
But if the price rapidly spikes while volume fades, be careful—short-term momentum may be weakening.
📊 II. Key price levels for the BULLA contract
For now, observe the recent high and low points on the 15-minute and 1-hour candlestick charts.
Resistance: the recent high and the heavy-traded zone from the previous move.
Long/Short line: the pullback area after the most recent breakout.
Support: the recent low and the consolidation platform from the previous range.
These levels need to be confirmed with the live candlestick chart—you can’t judge based on round-number prices alone.
🟢 III. Bullish scenario: conditions for the next surge
If BULLA breaks out above the recent high with strong volume, and continues to hold above it on the 15-minute and 1-hour charts, then you can watch how it performs during the pullback after the breakout.
If the pullback holds (doesn’t break) and volume keeps increasing, the upward momentum may continue in the short term.
However, if it quickly falls back into the original range right after the breakout, beware of a false breakout.
🔴 IV. Bearish scenario: risk of a pullback from high levels
If BULLA repeatedly attempts to break the recent high but fails, and then breaks below short-term support, you should watch for profit-taking and sell pressure.
If the price keeps making lower highs and lower lows, and rallies can’t regain the broken area, the short-term downtrend may continue.
That said, small- and mid-cap tokens can easily squeeze shorts after sharp rallies—don’t assume it must fall just because the percentage gain was large.
🔥 Want to catch the next BULLA move?
👇 Click below to trade!
#BULLA #行情分析📈
$BULLA
🚨 BULLA Contract Long/Short Battle! Is the next move a violent surge, or a jump down from the high? Check these signals before you trade!
Recently, altcoin market action has been getting more and more intense, and BULLAUSDT has also become a contract trading target worth paying attention to!
For short-term traders, the most important question is not how much the price has already risen, but whether there is enough buying pressure to support the next move.
🔥 I. What to watch next for BULLA?
When small- and mid-cap tokens see a rapid rally, the market usually needs to monitor three signals:
① Is trading volume continuing to increase?
② Is open interest rising in sync?
③ Does the funding rate show an overconcentration of long or short positions?
If the price is rising and volume is increasing, it may indicate buyers are stepping in.
But if the price rapidly spikes while volume fades, be careful—short-term momentum may be weakening.
📊 II. Key price levels for the BULLA contract
For now, observe the recent high and low points on the 15-minute and 1-hour candlestick charts.
Resistance: the recent high and the heavy-traded zone from the previous move.
Long/Short line: the pullback area after the most recent breakout.
Support: the recent low and the consolidation platform from the previous range.
These levels need to be confirmed with the live candlestick chart—you can’t judge based on round-number prices alone.
🟢 III. Bullish scenario: conditions for the next surge
If BULLA breaks out above the recent high with strong volume, and continues to hold above it on the 15-minute and 1-hour charts, then you can watch how it performs during the pullback after the breakout.
If the pullback holds (doesn’t break) and volume keeps increasing, the upward momentum may continue in the short term.
However, if it quickly falls back into the original range right after the breakout, beware of a false breakout.
🔴 IV. Bearish scenario: risk of a pullback from high levels
If BULLA repeatedly attempts to break the recent high but fails, and then breaks below short-term support, you should watch for profit-taking and sell pressure.
If the price keeps making lower highs and lower lows, and rallies can’t regain the broken area, the short-term downtrend may continue.
That said, small- and mid-cap tokens can easily squeeze shorts after sharp rallies—don’t assume it must fall just because the percentage gain was large.
🔥 Want to catch the next BULLA move?
👇 Click below to trade!
#BULLA #行情分析📈
🚨 BULLA Contract Long/Short Battle! Is the next move a violent surge, or a jump down from the high? Check these signals before you trade!
Recently, altcoin market action has been getting more and more intense, and BULLAUSDT has also become a contract trading target worth paying attention to!
For short-term traders, the most important question is not how much the price has already risen, but whether there is enough buying pressure to support the next move.
🔥 I. What to watch next for BULLA?
When small- and mid-cap tokens see a rapid rally, the market usually needs to monitor three signals:
① Is trading volume continuing to increase?
② Is open interest rising in sync?
③ Does the funding rate show an overconcentration of long or short positions?
If the price is rising and volume is increasing, it may indicate buyers are stepping in.
But if the price rapidly spikes while volume fades, be careful—short-term momentum may be weakening.
📊 II. Key price levels for the BULLA contract
For now, observe the recent high and low points on the 15-minute and 1-hour candlestick charts.
Resistance: the recent high and the heavy-traded zone from the previous move.
Long/Short line: the pullback area after the most recent breakout.
Support: the recent low and the consolidation platform from the previous range.
These levels need to be confirmed with the live candlestick chart—you can’t judge based on round-number prices alone.
🟢 III. Bullish scenario: conditions for the next surge
If BULLA breaks out above the recent high with strong volume, and continues to hold above it on the 15-minute and 1-hour charts, then you can watch how it performs during the pullback after the breakout.
If the pullback holds (doesn’t break) and volume keeps increasing, the upward momentum may continue in the short term.
However, if it quickly falls back into the original range right after the breakout, beware of a false breakout.
🔴 IV. Bearish scenario: risk of a pullback from high levels
If BULLA repeatedly attempts to break the recent high but fails, and then breaks below short-term support, you should watch for profit-taking and sell pressure.
If the price keeps making lower highs and lower lows, and rallies can’t regain the broken area, the short-term downtrend may continue.
That said, small- and mid-cap tokens can easily squeeze shorts after sharp rallies—don’t assume it must fall just because the percentage gain was large.
🔥 Want to catch the next BULLA move?
👇 Click below to trade!
#BULLA #行情分析📈
1
235
·
--
$BR
{future}(BRUSDT)
🚨 BR contract long/short battle! Will the next move be a volume breakout, or a sharp drop from the high? These signals must be watched!
In the recent crypto market, altcoin price action is getting more and more worth paying attention to!
Against the backdrop of continued consolidation in BTC and ETH, some mid- to small-cap tokens have shown noticeable volatility, and BRUSDT is also a trading candidate worth observing.
Will BR see a new round of upswing next, or will the bulls quickly retrace after taking profits?
🔥 I. What is BR?
BR is a token in the Bedrock ecosystem, mainly related to liquidity staking and restaking services. Besides BTC and ETH price movements, ecosystem development, token supply, and capital flow are also important to watch.
📊 II. BRUSDT key things to watch
Recent high: After a volume breakout, check whether it can hold.
Recent mid-term range: Observe whether both long and short sides keep fighting back and forth.
Recent low: If it breaks down, watch whether sell pressure expands.
🟢 III. Bullish scenarios
If BRUSDT breaks out of the recent high with strong volume, and stays strong on the 15-minute and 1-hour candlestick charts, you can observe how price behaves during the post-breakout pullback.
If the pullback doesn’t break down and volume keeps increasing, it suggests buying demand may still be continuing. But if, right after breaking out, price quickly falls back into the original range, be careful—this could be a false breakout.
🔴 IV. Bearish scenarios
If BR repeatedly attempts the recent high but fails, and then breaks below short-term support, you should pay attention to sell pressure from profit-taking.
If price keeps making lower highs and lower lows, and rebounds still can’t reclaim the breached area, the short-term downtrend may continue.
However, mid- to small-cap tokens can experience sudden short squeezes/rapid rallies—just because the price has risen sharply doesn’t automatically mean it will definitely fall.
⚡ V. The three most important signals for futures trading
① Is trading volume suddenly increasing?
② Does open interest rise in sync?
③ Does the funding rate show long/short positions are overly concentrated?
Tokens like BR may show slippage when liquidity is insufficient, and high leverage can also magnify losses. Confirm the price, volume, and risks first, then decide whether to enter.
🔥 Want to catch BR’s next wave of action?
👇 Click below to trade!
#BR #defi #行情分析📈
$BR
🚨 BR contract long/short battle! Will the next move be a volume breakout, or a sharp drop from the high? These signals must be watched!
In the recent crypto market, altcoin price action is getting more and more worth paying attention to!
Against the backdrop of continued consolidation in BTC and ETH, some mid- to small-cap tokens have shown noticeable volatility, and BRUSDT is also a trading candidate worth observing.
Will BR see a new round of upswing next, or will the bulls quickly retrace after taking profits?
🔥 I. What is BR?
BR is a token in the Bedrock ecosystem, mainly related to liquidity staking and restaking services. Besides BTC and ETH price movements, ecosystem development, token supply, and capital flow are also important to watch.
📊 II. BRUSDT key things to watch
Recent high: After a volume breakout, check whether it can hold.
Recent mid-term range: Observe whether both long and short sides keep fighting back and forth.
Recent low: If it breaks down, watch whether sell pressure expands.
🟢 III. Bullish scenarios
If BRUSDT breaks out of the recent high with strong volume, and stays strong on the 15-minute and 1-hour candlestick charts, you can observe how price behaves during the post-breakout pullback.
If the pullback doesn’t break down and volume keeps increasing, it suggests buying demand may still be continuing. But if, right after breaking out, price quickly falls back into the original range, be careful—this could be a false breakout.
🔴 IV. Bearish scenarios
If BR repeatedly attempts the recent high but fails, and then breaks below short-term support, you should pay attention to sell pressure from profit-taking.
If price keeps making lower highs and lower lows, and rebounds still can’t reclaim the breached area, the short-term downtrend may continue.
However, mid- to small-cap tokens can experience sudden short squeezes/rapid rallies—just because the price has risen sharply doesn’t automatically mean it will definitely fall.
⚡ V. The three most important signals for futures trading
① Is trading volume suddenly increasing?
② Does open interest rise in sync?
③ Does the funding rate show long/short positions are overly concentrated?
Tokens like BR may show slippage when liquidity is insufficient, and high leverage can also magnify losses. Confirm the price, volume, and risks first, then decide whether to enter.
🔥 Want to catch BR’s next wave of action?
👇 Click below to trade!
#BR #defi #行情分析📈
🚨 BR contract long/short battle! Will the next move be a volume breakout, or a sharp drop from the high? These signals must be watched!
In the recent crypto market, altcoin price action is getting more and more worth paying attention to!
Against the backdrop of continued consolidation in BTC and ETH, some mid- to small-cap tokens have shown noticeable volatility, and BRUSDT is also a trading candidate worth observing.
Will BR see a new round of upswing next, or will the bulls quickly retrace after taking profits?
🔥 I. What is BR?
BR is a token in the Bedrock ecosystem, mainly related to liquidity staking and restaking services. Besides BTC and ETH price movements, ecosystem development, token supply, and capital flow are also important to watch.
📊 II. BRUSDT key things to watch
Recent high: After a volume breakout, check whether it can hold.
Recent mid-term range: Observe whether both long and short sides keep fighting back and forth.
Recent low: If it breaks down, watch whether sell pressure expands.
🟢 III. Bullish scenarios
If BRUSDT breaks out of the recent high with strong volume, and stays strong on the 15-minute and 1-hour candlestick charts, you can observe how price behaves during the post-breakout pullback.
If the pullback doesn’t break down and volume keeps increasing, it suggests buying demand may still be continuing. But if, right after breaking out, price quickly falls back into the original range, be careful—this could be a false breakout.
🔴 IV. Bearish scenarios
If BR repeatedly attempts the recent high but fails, and then breaks below short-term support, you should pay attention to sell pressure from profit-taking.
If price keeps making lower highs and lower lows, and rebounds still can’t reclaim the breached area, the short-term downtrend may continue.
However, mid- to small-cap tokens can experience sudden short squeezes/rapid rallies—just because the price has risen sharply doesn’t automatically mean it will definitely fall.
⚡ V. The three most important signals for futures trading
① Is trading volume suddenly increasing?
② Does open interest rise in sync?
③ Does the funding rate show long/short positions are overly concentrated?
Tokens like BR may show slippage when liquidity is insufficient, and high leverage can also magnify losses. Confirm the price, volume, and risks first, then decide whether to enter.
🔥 Want to catch BR’s next wave of action?
👇 Click below to trade!
#BR #defi #行情分析📈
1
659
·
--
$BTC $ETH
{future}(ETHUSDT)
{future}(BTCUSDT)
🚨 Early this morning at 2:00 AM, the Fed rate-hike storm hits! BTC and ETH—ready for a big move?
The biggest variable in crypto circles tonight isn’t that some coin suddenly pumps. It’s the U.S. Federal Reserve’s upcoming interest rate decision!
⏰ 2:00 AM Taiwan time, September 17: Fed releases the rate decision
⏰ 2:30 AM: The Fed Chair holds a press conference
According to the CME FedWatch market pricing for September 16, the probability of a 1-step hike (0.25 percentage points) is about 93%. This means the market has already priced in a substantial portion of the rate-hike expectations in advance.
The real question worth watching is: after the rate-hike is announced, will BTC and ETH continue to fall, or will we see a rebound after “bad news is out of the way”?
📉 Scenario 1: 1-step hike + hawkish remarks
If the Fed hints that future rate hikes may continue after raising rates, the U.S. dollar and U.S. Treasury yields could strengthen, putting pressure on risk assets. BTC may test downside support, and ETH could also see bigger swings as market risk appetite declines.
📈 Scenario 2: 1-step hike + a mildly optimistic tone
If the hike matches expectations, but the Chair signals that the pace of future hikes may slow, the market may see a rebound after bad news is out. If BTC can regain and hold above short-term resistance, ETH may rise as well.
🔥 Scenario 3: Unexpectedly keeps rates unchanged
If the Fed doesn’t hike rates, the outcome would differ significantly from current market expectations. BTC and ETH could then experience rapid volatility. However, not hiking doesn’t guarantee a rally either—you still need to watch the Fed’s comments on inflation and future policy.
⚠️ My focus points:
1️⃣ Can BTC hold the short-term support level before the announcement?
2️⃣ After BTC stabilizes, can ETH show relative strength?
3️⃣ In the first breakout after the release, is there volume support?
The most dangerous thing tonight isn’t just getting the direction wrong—it’s treating the first big bullish or bearish candlestick as the final answer. High-leverage trading especially requires attention to slippage and liquidation risk.
Do you think tonight BTC and ETH will dip first and then rise, or break through directly?
👇 Comment with your view and follow along as we watch tonight’s market together!
🔥 Click below to trade
#BTC #ETH #Fed #fomc
$BTC $ETH
🚨 Early this morning at 2:00 AM, the Fed rate-hike storm hits! BTC and ETH—ready for a big move?
The biggest variable in crypto circles tonight isn’t that some coin suddenly pumps. It’s the U.S. Federal Reserve’s upcoming interest rate decision!
⏰ 2:00 AM Taiwan time, September 17: Fed releases the rate decision
⏰ 2:30 AM: The Fed Chair holds a press conference
According to the CME FedWatch market pricing for September 16, the probability of a 1-step hike (0.25 percentage points) is about 93%. This means the market has already priced in a substantial portion of the rate-hike expectations in advance.
The real question worth watching is: after the rate-hike is announced, will BTC and ETH continue to fall, or will we see a rebound after “bad news is out of the way”?
📉 Scenario 1: 1-step hike + hawkish remarks
If the Fed hints that future rate hikes may continue after raising rates, the U.S. dollar and U.S. Treasury yields could strengthen, putting pressure on risk assets. BTC may test downside support, and ETH could also see bigger swings as market risk appetite declines.
📈 Scenario 2: 1-step hike + a mildly optimistic tone
If the hike matches expectations, but the Chair signals that the pace of future hikes may slow, the market may see a rebound after bad news is out. If BTC can regain and hold above short-term resistance, ETH may rise as well.
🔥 Scenario 3: Unexpectedly keeps rates unchanged
If the Fed doesn’t hike rates, the outcome would differ significantly from current market expectations. BTC and ETH could then experience rapid volatility. However, not hiking doesn’t guarantee a rally either—you still need to watch the Fed’s comments on inflation and future policy.
⚠️ My focus points:
1️⃣ Can BTC hold the short-term support level before the announcement?
2️⃣ After BTC stabilizes, can ETH show relative strength?
3️⃣ In the first breakout after the release, is there volume support?
The most dangerous thing tonight isn’t just getting the direction wrong—it’s treating the first big bullish or bearish candlestick as the final answer. High-leverage trading especially requires attention to slippage and liquidation risk.
Do you think tonight BTC and ETH will dip first and then rise, or break through directly?
👇 Comment with your view and follow along as we watch tonight’s market together!
🔥 Click below to trade
#BTC #ETH #Fed #fomc
🚨 Early this morning at 2:00 AM, the Fed rate-hike storm hits! BTC and ETH—ready for a big move?
The biggest variable in crypto circles tonight isn’t that some coin suddenly pumps. It’s the U.S. Federal Reserve’s upcoming interest rate decision!
⏰ 2:00 AM Taiwan time, September 17: Fed releases the rate decision
⏰ 2:30 AM: The Fed Chair holds a press conference
According to the CME FedWatch market pricing for September 16, the probability of a 1-step hike (0.25 percentage points) is about 93%. This means the market has already priced in a substantial portion of the rate-hike expectations in advance.
The real question worth watching is: after the rate-hike is announced, will BTC and ETH continue to fall, or will we see a rebound after “bad news is out of the way”?
📉 Scenario 1: 1-step hike + hawkish remarks
If the Fed hints that future rate hikes may continue after raising rates, the U.S. dollar and U.S. Treasury yields could strengthen, putting pressure on risk assets. BTC may test downside support, and ETH could also see bigger swings as market risk appetite declines.
📈 Scenario 2: 1-step hike + a mildly optimistic tone
If the hike matches expectations, but the Chair signals that the pace of future hikes may slow, the market may see a rebound after bad news is out. If BTC can regain and hold above short-term resistance, ETH may rise as well.
🔥 Scenario 3: Unexpectedly keeps rates unchanged
If the Fed doesn’t hike rates, the outcome would differ significantly from current market expectations. BTC and ETH could then experience rapid volatility. However, not hiking doesn’t guarantee a rally either—you still need to watch the Fed’s comments on inflation and future policy.
⚠️ My focus points:
1️⃣ Can BTC hold the short-term support level before the announcement?
2️⃣ After BTC stabilizes, can ETH show relative strength?
3️⃣ In the first breakout after the release, is there volume support?
The most dangerous thing tonight isn’t just getting the direction wrong—it’s treating the first big bullish or bearish candlestick as the final answer. High-leverage trading especially requires attention to slippage and liquidation risk.
Do you think tonight BTC and ETH will dip first and then rise, or break through directly?
👇 Comment with your view and follow along as we watch tonight’s market together!
🔥 Click below to trade
#BTC #ETH #Fed #fomc
1
288
·
--
$LSK
{future}(LSKUSDT)
🚨 After LSK’s wild run, it comes to 0.54! Next challenge: 0.60—will the long side soon face liquidation?
LSK’s recent price action has really left many futures traders unable to sit still!
Starting from the sharp surge around $0.10 in early September, on September 16 the intraday move even briefly touched about $0.57—short-term volatility has been extremely intense.
Now that LSK is hovering around $0.54, is this the start of the next leg up, or a pullback signal after consolidating in a high range?
🔥 I. Why has LSK suddenly drawn market attention?
Lisk’s official announcement says it is transforming into an enterprise funds management platform, and the existing Lisk Chain will be shut down on October 31, 2026.
This means the market is re-evaluating the use cases, future development, and token value of LSK. However, a project transition does not guarantee that the token price will keep rising.
For futures traders, it’s especially important to pay attention to volume, open interest, and whether large-scale liquidations are appearing.
📊 II. Key LSK futures levels
0.6000 USDT: upside scenario target
0.5700 USDT: near the recent high
0.5400 USDT: current reference price
0.5000 USDT: downside psychological level
🟢 III. Bullish scenario
If LSK can hold above $0.54, and it breaks above $0.57 with expanding volume, you can watch whether buy orders keep stepping in.
If it holds after breaking out and the pullback doesn’t break the level, the next scenario target to watch would be $0.60.
However, assets that surge quickly are prone to fake breakouts—you can’t determine that the trend will definitely continue just because of one big bullish candle.
🔴 IV. Bearish scenario
If LSK fails to break above $0.57, and instead falls below $0.54, then in the short term you need to watch for profit-taking and selling pressure.
If it further loses $0.50, and any rebound cannot regain the level, a deeper pullback may occur.
But keep in mind: LSK’s recent volatility is very high. Even if your direction is correct, excessively high leverage can still lead to liquidation due to brief adverse price swings.
⚡ V. The three most important signals for futures trading
① Trading volume: Is there enough buy-side support when it breaks out?
② Open interest: Is a large amount of new leveraged capital entering the market?
③ Funding rate: Are long/short positions overly crowded?
💬 Finally, where do you think LSK will go next?
🔥 Want to catch LSK’s next market move?
👇 Click below to trade!
#LSK
$LSK
🚨 After LSK’s wild run, it comes to 0.54! Next challenge: 0.60—will the long side soon face liquidation?
LSK’s recent price action has really left many futures traders unable to sit still!
Starting from the sharp surge around $0.10 in early September, on September 16 the intraday move even briefly touched about $0.57—short-term volatility has been extremely intense.
Now that LSK is hovering around $0.54, is this the start of the next leg up, or a pullback signal after consolidating in a high range?
🔥 I. Why has LSK suddenly drawn market attention?
Lisk’s official announcement says it is transforming into an enterprise funds management platform, and the existing Lisk Chain will be shut down on October 31, 2026.
This means the market is re-evaluating the use cases, future development, and token value of LSK. However, a project transition does not guarantee that the token price will keep rising.
For futures traders, it’s especially important to pay attention to volume, open interest, and whether large-scale liquidations are appearing.
📊 II. Key LSK futures levels
0.6000 USDT: upside scenario target
0.5700 USDT: near the recent high
0.5400 USDT: current reference price
0.5000 USDT: downside psychological level
🟢 III. Bullish scenario
If LSK can hold above $0.54, and it breaks above $0.57 with expanding volume, you can watch whether buy orders keep stepping in.
If it holds after breaking out and the pullback doesn’t break the level, the next scenario target to watch would be $0.60.
However, assets that surge quickly are prone to fake breakouts—you can’t determine that the trend will definitely continue just because of one big bullish candle.
🔴 IV. Bearish scenario
If LSK fails to break above $0.57, and instead falls below $0.54, then in the short term you need to watch for profit-taking and selling pressure.
If it further loses $0.50, and any rebound cannot regain the level, a deeper pullback may occur.
But keep in mind: LSK’s recent volatility is very high. Even if your direction is correct, excessively high leverage can still lead to liquidation due to brief adverse price swings.
⚡ V. The three most important signals for futures trading
① Trading volume: Is there enough buy-side support when it breaks out?
② Open interest: Is a large amount of new leveraged capital entering the market?
③ Funding rate: Are long/short positions overly crowded?
💬 Finally, where do you think LSK will go next?
🔥 Want to catch LSK’s next market move?
👇 Click below to trade!
#LSK
🚨 After LSK’s wild run, it comes to 0.54! Next challenge: 0.60—will the long side soon face liquidation?
LSK’s recent price action has really left many futures traders unable to sit still!
Starting from the sharp surge around $0.10 in early September, on September 16 the intraday move even briefly touched about $0.57—short-term volatility has been extremely intense.
Now that LSK is hovering around $0.54, is this the start of the next leg up, or a pullback signal after consolidating in a high range?
🔥 I. Why has LSK suddenly drawn market attention?
Lisk’s official announcement says it is transforming into an enterprise funds management platform, and the existing Lisk Chain will be shut down on October 31, 2026.
This means the market is re-evaluating the use cases, future development, and token value of LSK. However, a project transition does not guarantee that the token price will keep rising.
For futures traders, it’s especially important to pay attention to volume, open interest, and whether large-scale liquidations are appearing.
📊 II. Key LSK futures levels
0.6000 USDT: upside scenario target
0.5700 USDT: near the recent high
0.5400 USDT: current reference price
0.5000 USDT: downside psychological level
🟢 III. Bullish scenario
If LSK can hold above $0.54, and it breaks above $0.57 with expanding volume, you can watch whether buy orders keep stepping in.
If it holds after breaking out and the pullback doesn’t break the level, the next scenario target to watch would be $0.60.
However, assets that surge quickly are prone to fake breakouts—you can’t determine that the trend will definitely continue just because of one big bullish candle.
🔴 IV. Bearish scenario
If LSK fails to break above $0.57, and instead falls below $0.54, then in the short term you need to watch for profit-taking and selling pressure.
If it further loses $0.50, and any rebound cannot regain the level, a deeper pullback may occur.
But keep in mind: LSK’s recent volatility is very high. Even if your direction is correct, excessively high leverage can still lead to liquidation due to brief adverse price swings.
⚡ V. The three most important signals for futures trading
① Trading volume: Is there enough buy-side support when it breaks out?
② Open interest: Is a large amount of new leveraged capital entering the market?
③ Funding rate: Are long/short positions overly crowded?
💬 Finally, where do you think LSK will go next?
🔥 Want to catch LSK’s next market move?
👇 Click below to trade!
#LSK
1
282
·
--
$SYN
🚨 SYN blasts through 0.21! Up more than 130%—are you chasing long now or waiting for a pullback? The next market move is worth watching!
SYN—this rally is absolutely wild!
From 0.09 all the way up to around 0.21, it’s up over 130%!
For futures traders, the most important thing now isn’t guessing how much higher it can go—it’s judging whether this uptrend has enough buy-side support to hold.
Is 0.21 the start of a new leg higher, or is it a zone where short-term profit-taking will kick in?
📊 I. SYN Key Price Levels
0.2500: Upside scenario target
0.2300: Post-breakout observation zone
0.2100: Current reference price
0.2000: Major psychological level (whole number)
0.1800: Deep pullback—watching area
The levels above are scenario prices, not confirmed real-time support/resistance.
🟢 II. Bullish Scenario
If SYN breaks above $0.21 and the 15-minute and 1-hour candles continue to hold there, and trading volume increases in sync, it suggests that short-term buying may still be ongoing.
Next, watch $0.23—if it can be held after the breakout, then look for potential price reaction around $0.25.
However, if it rapidly surges and then quickly falls back into the breakout area, be careful of a false breakout.
🔴 III. Bearish Scenario
If SYN fails to maintain above $0.21 and breaks below $0.20, watch for selling pressure from short-term profit-taking.
If the pullback comes with rising volume, and the rebound can’t reclaim $0.20, it may further test the downside zone.
But remember: rapidly-rising coins can also squeeze shorts. Don’t assume it will definitely fall just because the move has been large.
⚡ IV. Three Important Signals for Futures Traders
① Trading volume: Is the rally accompanied by increased buying?
② Open interest: Is there a large influx of new leveraged capital?
③ Funding rate: Are long/short positions becoming overly crowded?
Managing position size and setting stop-losses in advance is especially important.
🔥 Want to catch SYN’s next move?
👇 Click below to trade!
#SYN #加密貨幣 #行情分析📈
{future}(SYNUSDT)
$SYN
🚨 SYN blasts through 0.21! Up more than 130%—are you chasing long now or waiting for a pullback? The next market move is worth watching!
SYN—this rally is absolutely wild!
From 0.09 all the way up to around 0.21, it’s up over 130%!
For futures traders, the most important thing now isn’t guessing how much higher it can go—it’s judging whether this uptrend has enough buy-side support to hold.
Is 0.21 the start of a new leg higher, or is it a zone where short-term profit-taking will kick in?
📊 I. SYN Key Price Levels
0.2500: Upside scenario target
0.2300: Post-breakout observation zone
0.2100: Current reference price
0.2000: Major psychological level (whole number)
0.1800: Deep pullback—watching area
The levels above are scenario prices, not confirmed real-time support/resistance.
🟢 II. Bullish Scenario
If SYN breaks above $0.21 and the 15-minute and 1-hour candles continue to hold there, and trading volume increases in sync, it suggests that short-term buying may still be ongoing.
Next, watch $0.23—if it can be held after the breakout, then look for potential price reaction around $0.25.
However, if it rapidly surges and then quickly falls back into the breakout area, be careful of a false breakout.
🔴 III. Bearish Scenario
If SYN fails to maintain above $0.21 and breaks below $0.20, watch for selling pressure from short-term profit-taking.
If the pullback comes with rising volume, and the rebound can’t reclaim $0.20, it may further test the downside zone.
But remember: rapidly-rising coins can also squeeze shorts. Don’t assume it will definitely fall just because the move has been large.
⚡ IV. Three Important Signals for Futures Traders
① Trading volume: Is the rally accompanied by increased buying?
② Open interest: Is there a large influx of new leveraged capital?
③ Funding rate: Are long/short positions becoming overly crowded?
Managing position size and setting stop-losses in advance is especially important.
🔥 Want to catch SYN’s next move?
👇 Click below to trade!
#SYN #加密貨幣 #行情分析📈
🚨 SYN blasts through 0.21! Up more than 130%—are you chasing long now or waiting for a pullback? The next market move is worth watching!
SYN—this rally is absolutely wild!
From 0.09 all the way up to around 0.21, it’s up over 130%!
For futures traders, the most important thing now isn’t guessing how much higher it can go—it’s judging whether this uptrend has enough buy-side support to hold.
Is 0.21 the start of a new leg higher, or is it a zone where short-term profit-taking will kick in?
📊 I. SYN Key Price Levels
0.2500: Upside scenario target
0.2300: Post-breakout observation zone
0.2100: Current reference price
0.2000: Major psychological level (whole number)
0.1800: Deep pullback—watching area
The levels above are scenario prices, not confirmed real-time support/resistance.
🟢 II. Bullish Scenario
If SYN breaks above $0.21 and the 15-minute and 1-hour candles continue to hold there, and trading volume increases in sync, it suggests that short-term buying may still be ongoing.
Next, watch $0.23—if it can be held after the breakout, then look for potential price reaction around $0.25.
However, if it rapidly surges and then quickly falls back into the breakout area, be careful of a false breakout.
🔴 III. Bearish Scenario
If SYN fails to maintain above $0.21 and breaks below $0.20, watch for selling pressure from short-term profit-taking.
If the pullback comes with rising volume, and the rebound can’t reclaim $0.20, it may further test the downside zone.
But remember: rapidly-rising coins can also squeeze shorts. Don’t assume it will definitely fall just because the move has been large.
⚡ IV. Three Important Signals for Futures Traders
① Trading volume: Is the rally accompanied by increased buying?
② Open interest: Is there a large influx of new leveraged capital?
③ Funding rate: Are long/short positions becoming overly crowded?
Managing position size and setting stop-losses in advance is especially important.
🔥 Want to catch SYN’s next move?
👇 Click below to trade!
#SYN #加密貨幣 #行情分析📈
1
241
·
--
$ZEC
🚨 After ZEC’s Sharp Surge, Volatility Begins! Will Giant Whales’ Short Positions Trigger a Squeeze and Explosive Rally, or Will Bulls Get Trampled?
Recently, ZEC is definitely one of the cryptocurrencies worth closely watching!
From breaking through $1,000 to surging above $1,200, ZEC’s wild swings have attracted a large number of derivatives traders.
The question is: Will it challenge the previous high again, or is a high-leverage trend reversal about to unfold?
🔥 Why Is ZEC Getting Attention from the Market?
ZEC is a privacy-focused cryptocurrency. Besides the privacy-coin narrative, another key factor is the participation of significant leveraged capital in trading.
Large short positions don’t necessarily mean the price must fall. If the price keeps rising, shorts may be forced to close, which could instead trigger a short squeeze rally. But if buy pressure can’t continue, high-leverage long positions may also face a chain liquidation.
📊 Key Price Levels for ZEC
1,260 USDT: Near the recent peak
1,200 USDT: Upper psychological level
1,150 USDT: Short-term bull/bear observation zone
1,100 USDT: Lower psychological level
1,000 USDT: Important round-number level
🟢 Bullish Scenario
If ZEC regains stability above $1,150 and breaks through $1,200, the market may retest the previous high again. You’ll also need to watch whether the rally is driven by fresh buying or just a temporary squeeze.
🔴 Bearish Scenario
If it breaks below $1,100 and rebounds can’t reclaim that level, watch for the downtrend to continue. If open interest declines while price weakens at the same time, it may indicate that some leveraged capital is exiting.
🎯 Three Important Signals
① Whether it can regain stability above $1,150.
② Whether open interest and funding rates are abnormal.
③ When BTC falls, whether ZEC can maintain relative strength.
💬 Do you think ZEC’s next move will be a breakout above 1,260 or a drop below 1,100? Feel free to leave a comment sharing your cost basis and trading direction!
#zec #zcash #隱私幣 #加密貨幣 #行情分析📈
This article is for market analysis only and does not constitute investment advice. The prices mentioned are not real-time quotes. Please be aware of the risks of leverage and liquidation.
⚡ It’s a fierce battle between bulls and bears for ZEC—are you ready for the next wave of market action?
👇 Click below to trade!
{future}(ZECUSDT)
$ZEC
🚨 After ZEC’s Sharp Surge, Volatility Begins! Will Giant Whales’ Short Positions Trigger a Squeeze and Explosive Rally, or Will Bulls Get Trampled?
Recently, ZEC is definitely one of the cryptocurrencies worth closely watching!
From breaking through $1,000 to surging above $1,200, ZEC’s wild swings have attracted a large number of derivatives traders.
The question is: Will it challenge the previous high again, or is a high-leverage trend reversal about to unfold?
🔥 Why Is ZEC Getting Attention from the Market?
ZEC is a privacy-focused cryptocurrency. Besides the privacy-coin narrative, another key factor is the participation of significant leveraged capital in trading.
Large short positions don’t necessarily mean the price must fall. If the price keeps rising, shorts may be forced to close, which could instead trigger a short squeeze rally. But if buy pressure can’t continue, high-leverage long positions may also face a chain liquidation.
📊 Key Price Levels for ZEC
1,260 USDT: Near the recent peak
1,200 USDT: Upper psychological level
1,150 USDT: Short-term bull/bear observation zone
1,100 USDT: Lower psychological level
1,000 USDT: Important round-number level
🟢 Bullish Scenario
If ZEC regains stability above $1,150 and breaks through $1,200, the market may retest the previous high again. You’ll also need to watch whether the rally is driven by fresh buying or just a temporary squeeze.
🔴 Bearish Scenario
If it breaks below $1,100 and rebounds can’t reclaim that level, watch for the downtrend to continue. If open interest declines while price weakens at the same time, it may indicate that some leveraged capital is exiting.
🎯 Three Important Signals
① Whether it can regain stability above $1,150.
② Whether open interest and funding rates are abnormal.
③ When BTC falls, whether ZEC can maintain relative strength.
💬 Do you think ZEC’s next move will be a breakout above 1,260 or a drop below 1,100? Feel free to leave a comment sharing your cost basis and trading direction!
#zec #zcash #隱私幣 #加密貨幣 #行情分析📈
This article is for market analysis only and does not constitute investment advice. The prices mentioned are not real-time quotes. Please be aware of the risks of leverage and liquidation.
⚡ It’s a fierce battle between bulls and bears for ZEC—are you ready for the next wave of market action?
👇 Click below to trade!
🚨 After ZEC’s Sharp Surge, Volatility Begins! Will Giant Whales’ Short Positions Trigger a Squeeze and Explosive Rally, or Will Bulls Get Trampled?
Recently, ZEC is definitely one of the cryptocurrencies worth closely watching!
From breaking through $1,000 to surging above $1,200, ZEC’s wild swings have attracted a large number of derivatives traders.
The question is: Will it challenge the previous high again, or is a high-leverage trend reversal about to unfold?
🔥 Why Is ZEC Getting Attention from the Market?
ZEC is a privacy-focused cryptocurrency. Besides the privacy-coin narrative, another key factor is the participation of significant leveraged capital in trading.
Large short positions don’t necessarily mean the price must fall. If the price keeps rising, shorts may be forced to close, which could instead trigger a short squeeze rally. But if buy pressure can’t continue, high-leverage long positions may also face a chain liquidation.
📊 Key Price Levels for ZEC
1,260 USDT: Near the recent peak
1,200 USDT: Upper psychological level
1,150 USDT: Short-term bull/bear observation zone
1,100 USDT: Lower psychological level
1,000 USDT: Important round-number level
🟢 Bullish Scenario
If ZEC regains stability above $1,150 and breaks through $1,200, the market may retest the previous high again. You’ll also need to watch whether the rally is driven by fresh buying or just a temporary squeeze.
🔴 Bearish Scenario
If it breaks below $1,100 and rebounds can’t reclaim that level, watch for the downtrend to continue. If open interest declines while price weakens at the same time, it may indicate that some leveraged capital is exiting.
🎯 Three Important Signals
① Whether it can regain stability above $1,150.
② Whether open interest and funding rates are abnormal.
③ When BTC falls, whether ZEC can maintain relative strength.
💬 Do you think ZEC’s next move will be a breakout above 1,260 or a drop below 1,100? Feel free to leave a comment sharing your cost basis and trading direction!
#zec #zcash #隱私幣 #加密貨幣 #行情分析📈
This article is for market analysis only and does not constitute investment advice. The prices mentioned are not real-time quotes. Please be aware of the risks of leverage and liquidation.
⚡ It’s a fierce battle between bulls and bears for ZEC—are you ready for the next wave of market action?
👇 Click below to trade!
1
153
·
--
$SOL
🔥 SOL dips below $100! Are the majors washing the market? This bounce may decide the next direction!
SOL is back at a tense moment for both longs and shorts! The $100 psychological level—can it hold and regain stability?
📊 SOL key levels
110 USDT: upside rebound target
105 USDT: short-term resistance
100 USDT: long/short psychological level
98 USDT: near recent lows
95 USDT: downside watch zone
⚡ Why is SOL worth watching?
DeFi trading volume within the Solana ecosystem, stablecoin activity, and on-chain fund flows are all indicators worth tracking.
But there’s one risk you can’t ignore: leverage. When the market hits unexpected news, mass contract liquidations can accelerate price volatility.
🟢 Bull case
If SOL can reclaim $100 and, after breaking above $105, it can hold—then the short-term rebound could continue further. Watch whether the pullback holds and whether trading volume increases.
🔴 Bear case
If it drops below $98 again and the rebound fails to reclaim $100, then be alert to whether selling pressure is expanding.
🎯 Next, I’ll pay special attention to whether SOL can gain or lose $100—and whether BTC shows a directional breakout at the same time.
💬 Do you think SOL will reach 110 first, or break below 95 first? Feel free to comment with your entry cost and your long/short view!
#sol #solana #BTC #加密貨幣 #行情分析📈
This article is for market observation only and does not constitute investment advice. The prices mentioned are not real-time quotes—please confirm the latest price before trading.
🔥 The next SOL market move is about to be revealed by the market!
👇 Click below to trade!
{future}(SOLUSDT)
$SOL
🔥 SOL dips below $100! Are the majors washing the market? This bounce may decide the next direction!
SOL is back at a tense moment for both longs and shorts! The $100 psychological level—can it hold and regain stability?
📊 SOL key levels
110 USDT: upside rebound target
105 USDT: short-term resistance
100 USDT: long/short psychological level
98 USDT: near recent lows
95 USDT: downside watch zone
⚡ Why is SOL worth watching?
DeFi trading volume within the Solana ecosystem, stablecoin activity, and on-chain fund flows are all indicators worth tracking.
But there’s one risk you can’t ignore: leverage. When the market hits unexpected news, mass contract liquidations can accelerate price volatility.
🟢 Bull case
If SOL can reclaim $100 and, after breaking above $105, it can hold—then the short-term rebound could continue further. Watch whether the pullback holds and whether trading volume increases.
🔴 Bear case
If it drops below $98 again and the rebound fails to reclaim $100, then be alert to whether selling pressure is expanding.
🎯 Next, I’ll pay special attention to whether SOL can gain or lose $100—and whether BTC shows a directional breakout at the same time.
💬 Do you think SOL will reach 110 first, or break below 95 first? Feel free to comment with your entry cost and your long/short view!
#sol #solana #BTC #加密貨幣 #行情分析📈
This article is for market observation only and does not constitute investment advice. The prices mentioned are not real-time quotes—please confirm the latest price before trading.
🔥 The next SOL market move is about to be revealed by the market!
👇 Click below to trade!
🔥 SOL dips below $100! Are the majors washing the market? This bounce may decide the next direction!
SOL is back at a tense moment for both longs and shorts! The $100 psychological level—can it hold and regain stability?
📊 SOL key levels
110 USDT: upside rebound target
105 USDT: short-term resistance
100 USDT: long/short psychological level
98 USDT: near recent lows
95 USDT: downside watch zone
⚡ Why is SOL worth watching?
DeFi trading volume within the Solana ecosystem, stablecoin activity, and on-chain fund flows are all indicators worth tracking.
But there’s one risk you can’t ignore: leverage. When the market hits unexpected news, mass contract liquidations can accelerate price volatility.
🟢 Bull case
If SOL can reclaim $100 and, after breaking above $105, it can hold—then the short-term rebound could continue further. Watch whether the pullback holds and whether trading volume increases.
🔴 Bear case
If it drops below $98 again and the rebound fails to reclaim $100, then be alert to whether selling pressure is expanding.
🎯 Next, I’ll pay special attention to whether SOL can gain or lose $100—and whether BTC shows a directional breakout at the same time.
💬 Do you think SOL will reach 110 first, or break below 95 first? Feel free to comment with your entry cost and your long/short view!
#sol #solana #BTC #加密貨幣 #行情分析📈
This article is for market observation only and does not constitute investment advice. The prices mentioned are not real-time quotes—please confirm the latest price before trading.
🔥 The next SOL market move is about to be revealed by the market!
👇 Click below to trade!
1
172
·
--
$SNDK $MUU $SKHYNIX
🚨 SanDisk, Micron, and SK hynix all sell off together! Has the memory cycle ended? Or is this just a shakeout before the next big surge?
Recently, memory stock investors have really been unable to sit still! On September 14, market reports said that Micron and SanDisk briefly fell by around 6% during the day, and SK hynix also showed a clear downtrend.
🔥 SanDisk (SNDK): Focus on NAND price quotes, enterprise SSD order demand, and storage needs. A DRAM shortage doesn’t necessarily mean NAND prices will rise at the same time—observe them separately.
⚡ Micron (MU): The company demonstrated 512GB DDR5 memory modules for AI servers, with mass production expected in the second half of 2027. The next key points are DRAM and HBM demand, gross margin, and earnings guidance.
🇰🇷 SK hynix: HBM demand is closely tied to the AI GPU supply chain. News that DeepSeek’s new model reduces memory usage sparked market concerns, but improved efficiency in a single model doesn’t automatically mean overall industry demand will decline. Meanwhile, SK hynix is also discussing the possibility of producing memory chips in the U.S. with Intel, though no agreement has been confirmed yet.
📊 Three key things to watch
SanDisk: NAND price quotes, SSD orders
Micron: DRAM, HBM, earnings guidance
SK hynix: HBM shipments, AI orders
🎯 Two trading scenarios
🟢 Bulls: The Philadelphia Semiconductor Index strengthens; SanDisk and Micron expand volume to break above the previous trading day’s high and hold it. Then watch whether the pullback is successful.
🔴 Bears: Gap up and then fall; if it breaks below the previous trading day’s low and the semiconductor sector also weakens at the same time, watch for the continuation of selling pressure.
Tight memory supply remains the market focus, but strong demand doesn’t mean the stock price won’t correct. Next, it depends on whether the stock price can once again reflect fundamentals, or whether the market continues to cut expectations for AI growth.
💬 Which are you more focused on—SanDisk, Micron, or SK hynix? Feel free to comment with your cost basis, your reasons for being bullish or bearish, and the entry levels you’re watching. Follow me to track the next market move together.
#美股 #SNDK #Aİ #半导体 #幣安廣場
🚀 Want to catch the next wave of U.S. stock market momentum?
👇 Click below to trade!
{future}(SKHYNIXUSDT)
{future}(MUUUSDT)
{future}(SNDKUSDT)
$SNDK $MUU $SKHYNIX
🚨 SanDisk, Micron, and SK hynix all sell off together! Has the memory cycle ended? Or is this just a shakeout before the next big surge?
Recently, memory stock investors have really been unable to sit still! On September 14, market reports said that Micron and SanDisk briefly fell by around 6% during the day, and SK hynix also showed a clear downtrend.
🔥 SanDisk (SNDK): Focus on NAND price quotes, enterprise SSD order demand, and storage needs. A DRAM shortage doesn’t necessarily mean NAND prices will rise at the same time—observe them separately.
⚡ Micron (MU): The company demonstrated 512GB DDR5 memory modules for AI servers, with mass production expected in the second half of 2027. The next key points are DRAM and HBM demand, gross margin, and earnings guidance.
🇰🇷 SK hynix: HBM demand is closely tied to the AI GPU supply chain. News that DeepSeek’s new model reduces memory usage sparked market concerns, but improved efficiency in a single model doesn’t automatically mean overall industry demand will decline. Meanwhile, SK hynix is also discussing the possibility of producing memory chips in the U.S. with Intel, though no agreement has been confirmed yet.
📊 Three key things to watch
SanDisk: NAND price quotes, SSD orders
Micron: DRAM, HBM, earnings guidance
SK hynix: HBM shipments, AI orders
🎯 Two trading scenarios
🟢 Bulls: The Philadelphia Semiconductor Index strengthens; SanDisk and Micron expand volume to break above the previous trading day’s high and hold it. Then watch whether the pullback is successful.
🔴 Bears: Gap up and then fall; if it breaks below the previous trading day’s low and the semiconductor sector also weakens at the same time, watch for the continuation of selling pressure.
Tight memory supply remains the market focus, but strong demand doesn’t mean the stock price won’t correct. Next, it depends on whether the stock price can once again reflect fundamentals, or whether the market continues to cut expectations for AI growth.
💬 Which are you more focused on—SanDisk, Micron, or SK hynix? Feel free to comment with your cost basis, your reasons for being bullish or bearish, and the entry levels you’re watching. Follow me to track the next market move together.
#美股 #SNDK #Aİ #半导体 #幣安廣場
🚀 Want to catch the next wave of U.S. stock market momentum?
👇 Click below to trade!
🚨 SanDisk, Micron, and SK hynix all sell off together! Has the memory cycle ended? Or is this just a shakeout before the next big surge?
Recently, memory stock investors have really been unable to sit still! On September 14, market reports said that Micron and SanDisk briefly fell by around 6% during the day, and SK hynix also showed a clear downtrend.
🔥 SanDisk (SNDK): Focus on NAND price quotes, enterprise SSD order demand, and storage needs. A DRAM shortage doesn’t necessarily mean NAND prices will rise at the same time—observe them separately.
⚡ Micron (MU): The company demonstrated 512GB DDR5 memory modules for AI servers, with mass production expected in the second half of 2027. The next key points are DRAM and HBM demand, gross margin, and earnings guidance.
🇰🇷 SK hynix: HBM demand is closely tied to the AI GPU supply chain. News that DeepSeek’s new model reduces memory usage sparked market concerns, but improved efficiency in a single model doesn’t automatically mean overall industry demand will decline. Meanwhile, SK hynix is also discussing the possibility of producing memory chips in the U.S. with Intel, though no agreement has been confirmed yet.
📊 Three key things to watch
SanDisk: NAND price quotes, SSD orders
Micron: DRAM, HBM, earnings guidance
SK hynix: HBM shipments, AI orders
🎯 Two trading scenarios
🟢 Bulls: The Philadelphia Semiconductor Index strengthens; SanDisk and Micron expand volume to break above the previous trading day’s high and hold it. Then watch whether the pullback is successful.
🔴 Bears: Gap up and then fall; if it breaks below the previous trading day’s low and the semiconductor sector also weakens at the same time, watch for the continuation of selling pressure.
Tight memory supply remains the market focus, but strong demand doesn’t mean the stock price won’t correct. Next, it depends on whether the stock price can once again reflect fundamentals, or whether the market continues to cut expectations for AI growth.
💬 Which are you more focused on—SanDisk, Micron, or SK hynix? Feel free to comment with your cost basis, your reasons for being bullish or bearish, and the entry levels you’re watching. Follow me to track the next market move together.
#美股 #SNDK #Aİ #半导体 #幣安廣場
🚀 Want to catch the next wave of U.S. stock market momentum?
👇 Click below to trade!
1
505
·
--
$BTC $ETH 🚨
After BTC and ETH crash, should you go long or short now? Tonight is when the real market action starts!
Yesterday, the market was still bullish, but today it suddenly came with a sharp sell-off! BTC dropped to around $75,000 at one point, and ETH also slid back to the $2,400 area. Is this just major-player “washing” of positions, or the start of a brand-new downtrend?
🔥 1. Why did BTC and ETH suddenly drop?
The U.S. crypto market structure bill, the CLARITY Act, failed to advance in the Senate procedural vote with a 49:50 result, followed by a sell-off. On the other hand, the market is waiting for the Federal Reserve’s interest rate decision—rate expectations, the U.S. dollar, and U.S. Treasury yields could all affect risk assets.
📊 2. Key BTC price levels
78,000~78,200 USDT: overhead resistance
76,000 USDT: short-term boundary
75,000 USDT: important support
If it regains and holds above 76,000 and recovers 78,000, you can reassess the rebound structure. If it breaks below 75,000 and the rebound cannot get back up, you need to guard against downside risk.
⚡ 3. Key ETH price levels
2,500 USDT: rebound resistance
2,450 USDT: short-term boundary
2,400 USDT: recent support
2,390 USDT: lower observation zone
If it reclaims above 2,450 and holds on the retest without breaking, the short-term buying momentum may return. If the rebound stalls and loses 2,400, watch for continued selling pressure. The above ranges are observation levels, not a guarantee of validity.
🎯 4. Two trading scenarios
🟢 Bullish counterattack: BTC holds 76,000, ETH recovers 2,450, and watch trading volume to see whether the pullback is successful.
🔴 Bearish continuation: BTC breaks below 75,000, ETH loses 2,400, and when the rebound still cannot regain those levels, observe the opportunities for shorts.
Before and after major news is released, pay attention to leverage, position sizing, and stop-losses—don’t chase prices blindly.
💬 Do you think this is a rebound after a washout, or the start of a new downtrend? Feel free to comment with the entry price you’re watching! Follow me and let’s track the next moves for BTC and ETH together.
🚀 Want to catch the next BTC & ETH move?
👇 Click below to trade!
#比特幣走勢分析 #以太坊 #幣安合約 #行情分析📈 #加密貨幣
{future}(ETHUSDT)
{future}(BTCUSDT)
$BTC $ETH 🚨
After BTC and ETH crash, should you go long or short now? Tonight is when the real market action starts!
Yesterday, the market was still bullish, but today it suddenly came with a sharp sell-off! BTC dropped to around $75,000 at one point, and ETH also slid back to the $2,400 area. Is this just major-player “washing” of positions, or the start of a brand-new downtrend?
🔥 1. Why did BTC and ETH suddenly drop?
The U.S. crypto market structure bill, the CLARITY Act, failed to advance in the Senate procedural vote with a 49:50 result, followed by a sell-off. On the other hand, the market is waiting for the Federal Reserve’s interest rate decision—rate expectations, the U.S. dollar, and U.S. Treasury yields could all affect risk assets.
📊 2. Key BTC price levels
78,000~78,200 USDT: overhead resistance
76,000 USDT: short-term boundary
75,000 USDT: important support
If it regains and holds above 76,000 and recovers 78,000, you can reassess the rebound structure. If it breaks below 75,000 and the rebound cannot get back up, you need to guard against downside risk.
⚡ 3. Key ETH price levels
2,500 USDT: rebound resistance
2,450 USDT: short-term boundary
2,400 USDT: recent support
2,390 USDT: lower observation zone
If it reclaims above 2,450 and holds on the retest without breaking, the short-term buying momentum may return. If the rebound stalls and loses 2,400, watch for continued selling pressure. The above ranges are observation levels, not a guarantee of validity.
🎯 4. Two trading scenarios
🟢 Bullish counterattack: BTC holds 76,000, ETH recovers 2,450, and watch trading volume to see whether the pullback is successful.
🔴 Bearish continuation: BTC breaks below 75,000, ETH loses 2,400, and when the rebound still cannot regain those levels, observe the opportunities for shorts.
Before and after major news is released, pay attention to leverage, position sizing, and stop-losses—don’t chase prices blindly.
💬 Do you think this is a rebound after a washout, or the start of a new downtrend? Feel free to comment with the entry price you’re watching! Follow me and let’s track the next moves for BTC and ETH together.
🚀 Want to catch the next BTC & ETH move?
👇 Click below to trade!
#比特幣走勢分析 #以太坊 #幣安合約 #行情分析📈 #加密貨幣
After BTC and ETH crash, should you go long or short now? Tonight is when the real market action starts!
Yesterday, the market was still bullish, but today it suddenly came with a sharp sell-off! BTC dropped to around $75,000 at one point, and ETH also slid back to the $2,400 area. Is this just major-player “washing” of positions, or the start of a brand-new downtrend?
🔥 1. Why did BTC and ETH suddenly drop?
The U.S. crypto market structure bill, the CLARITY Act, failed to advance in the Senate procedural vote with a 49:50 result, followed by a sell-off. On the other hand, the market is waiting for the Federal Reserve’s interest rate decision—rate expectations, the U.S. dollar, and U.S. Treasury yields could all affect risk assets.
📊 2. Key BTC price levels
78,000~78,200 USDT: overhead resistance
76,000 USDT: short-term boundary
75,000 USDT: important support
If it regains and holds above 76,000 and recovers 78,000, you can reassess the rebound structure. If it breaks below 75,000 and the rebound cannot get back up, you need to guard against downside risk.
⚡ 3. Key ETH price levels
2,500 USDT: rebound resistance
2,450 USDT: short-term boundary
2,400 USDT: recent support
2,390 USDT: lower observation zone
If it reclaims above 2,450 and holds on the retest without breaking, the short-term buying momentum may return. If the rebound stalls and loses 2,400, watch for continued selling pressure. The above ranges are observation levels, not a guarantee of validity.
🎯 4. Two trading scenarios
🟢 Bullish counterattack: BTC holds 76,000, ETH recovers 2,450, and watch trading volume to see whether the pullback is successful.
🔴 Bearish continuation: BTC breaks below 75,000, ETH loses 2,400, and when the rebound still cannot regain those levels, observe the opportunities for shorts.
Before and after major news is released, pay attention to leverage, position sizing, and stop-losses—don’t chase prices blindly.
💬 Do you think this is a rebound after a washout, or the start of a new downtrend? Feel free to comment with the entry price you’re watching! Follow me and let’s track the next moves for BTC and ETH together.
🚀 Want to catch the next BTC & ETH move?
👇 Click below to trade!
#比特幣走勢分析 #以太坊 #幣安合約 #行情分析📈 #加密貨幣
1
241
Log in to explore more content
Join global crypto users on Binance Square
⚡️ Get latest and useful information about crypto.
💬 Trusted by the world’s largest crypto exchange.
👍 Discover real insights from verified creators.
Email / Phone number
Trending Topics
MemeLaunchpads82%OfArcDayOneVolume
4,083 views
182 Discussing
#MemeLaunchpads82%OfArcDayOneVolume
Circle Built an Institutional Chain and Meme Traders Showed Up to the Wrong Party Anyway 🎉🏦
September 16. Circle's Arc mainnet went live, producing $410.8 million in DEX volume and 7.76 million transactions on day one. Meme coin launchpads accounted for 82% of that, roughly $336.3 million. A single launchpad, arguspad.io, handled $202.35 million alone, close to half the entire chain's activity, and minted 83,751 of the 97,025 tokens created that day. More tokens in 24 hours than pump.fun's best day on record, on a chain built by the company that issues USDC. 😂
Here is the irony worth sitting with 🧠
Circle marketed Arc as an economic operating system for financial markets, real-time money movement, and AI agents transacting autonomously. Founding validators include BlackRock, Visa, Mastercard, DTCC, and ICE. Bitwise and Janus Henderson are moving tokenized funds onto the chain. Visa and MoneyGram plan stablecoin settlement through it. And on opening day, none of that set the tone at all. Speculative meme traders did. 💎
The number that puts this in perspective 🎯
Strip the launchpads out entirely and Arc's actual institutional and non-speculative volume was about $74.6 million, still respectable for a two day old chain, just not the headline story. Robinhood Chain's own July 1 debut did a comparatively tiny $14.74 million, meaning Arc launched nearly 28 times larger. 💡
The honest caveat worth remembering 🎭
Robinhood Chain cooled through August before hitting a $3.7 billion daily record this month. Early volume tells you almost nothing about where a chain ends up. Whether Arc becomes genuine institutional plumbing or just another temporary meme playground is a question these first 24 hours cannot actually answer. 🚀
$ARC $BTC
Philboom
·0 Likes
·24 views
OstiumLoanDisputeHearingSetInNYFederalCourt
5,388 views
173 Discussing
HyperliquidUSDCSupplyOvertakesSolana
48 views
22 Discussing