
Dark king The noob
67 Posts

Dark king The noob
Report
Block User

Top 30D Traders by Volume
6 Following
53 Followers
169 Liked
1 Badges
Posts
All
Quotes
$SOL Perfect example how to spot good entry point see market 97.95 to 99.23 maintain sequence den stayed there market sometimes suddenly up for 99.72 then again came back to area . There is high chance to revisit 97.95 area whether a bit up or more down . den we will know our long entry point.
$SOL Perfect example how to spot good entry point see market 97.95 to 99.23 maintain sequence den stayed there market sometimes suddenly up for 99.72 then again came back to area . There is high chance to revisit 97.95 area whether a bit up or more down . den we will know our long entry point.
4
1
148
$SOL Market has stayed 4-5 h around 101.50 to 100 area thats the clue . den you will see big displacement red candle 97.98 amother clue . this is the area we will watch closely . there is chance to go 97-96 area or stay around 97 den again push for 103
$SOL Market has stayed 4-5 h around 101.50 to 100 area thats the clue . den you will see big displacement red candle 97.98 amother clue . this is the area we will watch closely . there is chance to go 97-96 area or stay around 97 den again push for 103
100
damn 104 area long entry that was damn late long . now market will try from 99-97 area. if you can hold thats fine if not this is chanceto close
damn 104 area long entry that was damn late long . now market will try from 99-97 area. if you can hold thats fine if not this is chanceto close

Rozanne Rotando HSjM
·
--
$SOL
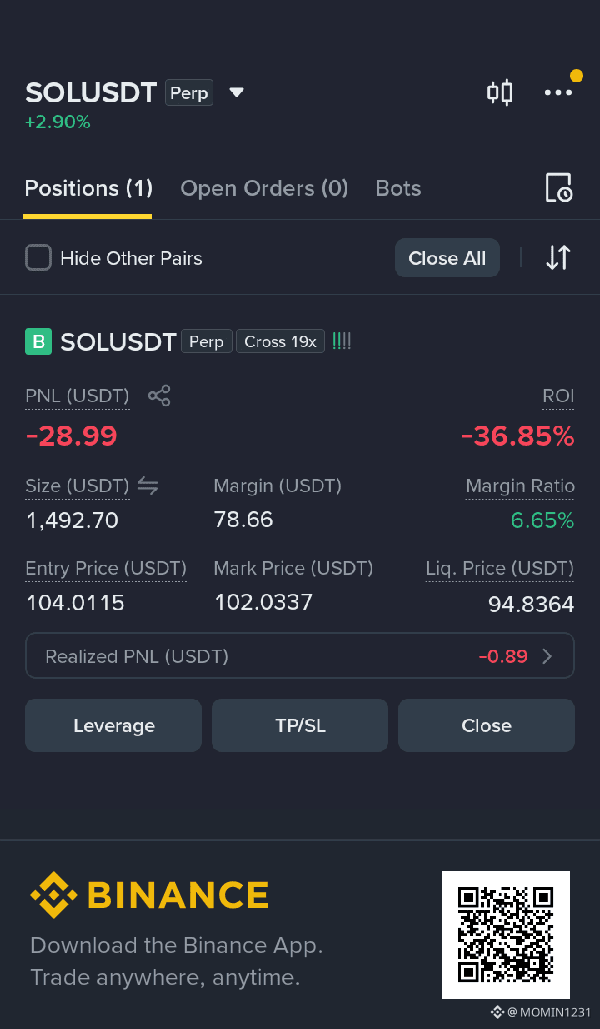
😭😭😭😭😭😭😭😭hold or close?
help plz
😭😭😭😭😭😭😭😭hold or close?
help plz
2
34
$SOL — Why I’m Watching 97–99 👀
Look at the reaction from the same area.
Previously:
105.77 → 100.30
Then the first reaction pushed back to around 103.10.
That was a strong counter-reaction.
This time:
104.81 → 100.50
Then the first reaction only reached around 101.54 before selling pressure returned.
Same general area.
Similar downside move.
But the counter-reaction is much smaller.
For me, that is information.
It suggests buyers are not showing the same strength as before, so the probability of a deeper visit toward 99–98 becomes more interesting.
If SOL reaches 99–98, then I want to watch the time spent there.
If price spends something like 8–10+ hours building around that area, followed by another $1–$2 downside displacement, and then starts rejecting/reclaiming instead of accepting lower, that could become an important clue.
For example:
99–98 → time build → downside push → failed acceptance → reclaim
If that structure develops, I would start watching for a potential upside move toward 102 → 103–104.
The point is not:
“SOL must go to 97.”
The point is:
The weaker reaction from 100.50 changes the probability of needing a deeper stopover.
I’m watching the reaction, time spent, and acceptance — not trying to predict every candle.
Not financial advice. Just sharing my market-structure observation
$SOL — Why I’m Watching 97–99 👀
Look at the reaction from the same area.
Previously:
105.77 → 100.30
Then the first reaction pushed back to around 103.10.
That was a strong counter-reaction.
This time:
104.81 → 100.50
Then the first reaction only reached around 101.54 before selling pressure returned.
Same general area.
Similar downside move.
But the counter-reaction is much smaller.
For me, that is information.
It suggests buyers are not showing the same strength as before, so the probability of a deeper visit toward 99–98 becomes more interesting.
If SOL reaches 99–98, then I want to watch the time spent there.
If price spends something like 8–10+ hours building around that area, followed by another $1–$2 downside displacement, and then starts rejecting/reclaiming instead of accepting lower, that could become an important clue.
For example:
99–98 → time build → downside push → failed acceptance → reclaim
If that structure develops, I would start watching for a potential upside move toward 102 → 103–104.
The point is not:
“SOL must go to 97.”
The point is:
The weaker reaction from 100.50 changes the probability of needing a deeper stopover.
I’m watching the reaction, time spent, and acceptance — not trying to predict every candle.
Not financial advice. Just sharing my market-structure observation
Look at the reaction from the same area.
Previously:
105.77 → 100.30
Then the first reaction pushed back to around 103.10.
That was a strong counter-reaction.
This time:
104.81 → 100.50
Then the first reaction only reached around 101.54 before selling pressure returned.
Same general area.
Similar downside move.
But the counter-reaction is much smaller.
For me, that is information.
It suggests buyers are not showing the same strength as before, so the probability of a deeper visit toward 99–98 becomes more interesting.
If SOL reaches 99–98, then I want to watch the time spent there.
If price spends something like 8–10+ hours building around that area, followed by another $1–$2 downside displacement, and then starts rejecting/reclaiming instead of accepting lower, that could become an important clue.
For example:
99–98 → time build → downside push → failed acceptance → reclaim
If that structure develops, I would start watching for a potential upside move toward 102 → 103–104.
The point is not:
“SOL must go to 97.”
The point is:
The weaker reaction from 100.50 changes the probability of needing a deeper stopover.
I’m watching the reaction, time spent, and acceptance — not trying to predict every candle.
Not financial advice. Just sharing my market-structure observation
2
160
$SOL Now no trade zone that's building zone now - keep on eye if market stay 100.80 to 102.50 area around 7-8h or more den suddenly drop with big red or continued red Candle for 99.80 -100.30
that can be a long-entry clue”
Better to enter edge. when market revisit again 102 may stop or slow dont get panic or close trade . even market again fall for 100 area be patience hold and TP - 104-106 .
$SOL Now no trade zone that's building zone now - keep on eye if market stay 100.80 to 102.50 area around 7-8h or more den suddenly drop with big red or continued red Candle for 99.80 -100.30
that can be a long-entry clue”
Better to enter edge. when market revisit again 102 may stop or slow dont get panic or close trade . even market again fall for 100 area be patience hold and TP - 104-106 .
that can be a long-entry clue”
Better to enter edge. when market revisit again 102 may stop or slow dont get panic or close trade . even market again fall for 100 area be patience hold and TP - 104-106 .
2
7
6.3k
$SOL Long entry look up area 100.50 to 101.50 area . if market suddenly displacement with few red candle down thats sign of flip the market .
if you see market did same when market was going up from 98.91 to 104.81- 103.88 area market went same sequence but suddenly up 104.81 thats the flip sign we will use moving forward for the entry point .
now market going down exact same way until 103.08 . now we have to see suddenly drop thats the sign
$SOL Long entry look up area 100.50 to 101.50 area . if market suddenly displacement with few red candle down thats sign of flip the market .
if you see market did same when market was going up from 98.91 to 104.81- 103.88 area market went same sequence but suddenly up 104.81 thats the flip sign we will use moving forward for the entry point .
now market going down exact same way until 103.08 . now we have to see suddenly drop thats the sign
if you see market did same when market was going up from 98.91 to 104.81- 103.88 area market went same sequence but suddenly up 104.81 thats the flip sign we will use moving forward for the entry point .
now market going down exact same way until 103.08 . now we have to see suddenly drop thats the sign
2
2
4.4k
$SOL Long Entry set up 103.50- 103.80 area if more deep down better for long entry and SL 102.50 TP 105.80-106.50
$SOL Long Entry set up 103.50- 103.80 area if more deep down better for long entry and SL 102.50 TP 105.80-106.50
1
18
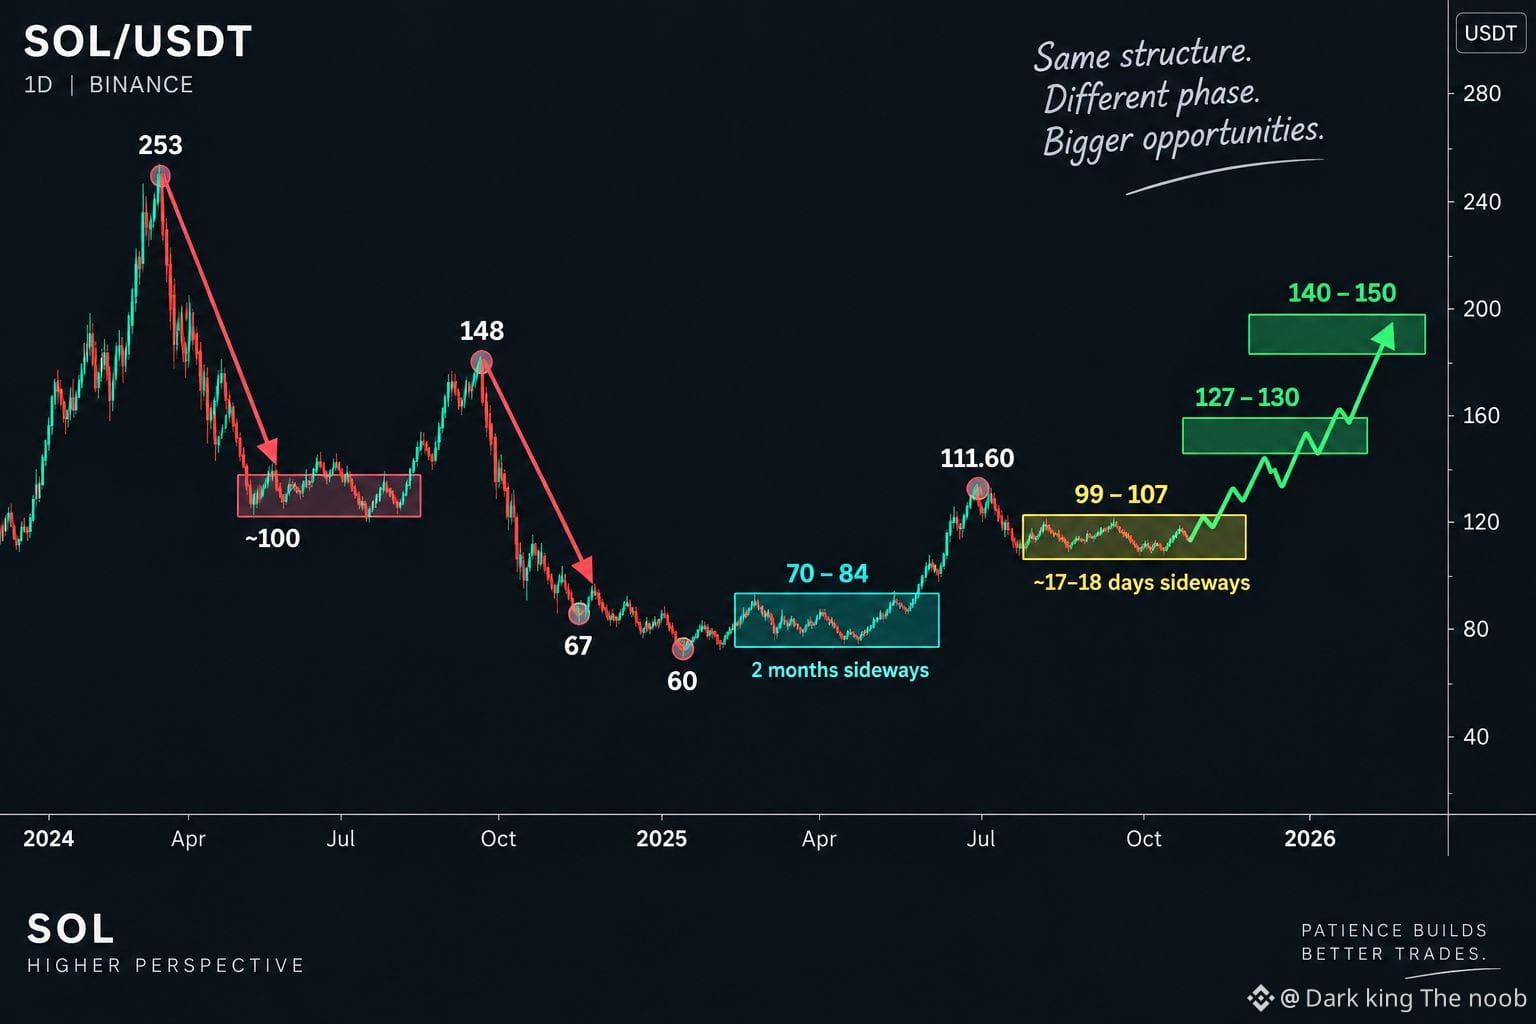
$SOL — The Bigger Picture
SOL has already shown this pattern before:
60 → 70–84 sideways for 2+ months → 111.60
Now, after 111.60, price has been spending around 17–18 days sideways near 99–107.
That’s what has my attention.
Sideways doesn’t automatically mean bullish — it can prepare for either direction. The key is how the range resolves.
If 99–107 holds, sellers fail to get acceptance below the range, and bulls continue defending the lower side, then I see a potential path:
107/108 → 111.60 → 127–130 → 140–150
A wick toward 95 or even 90 is possible, but what matters is whether price accepts there or quickly reclaims.
For me, the bigger question is simple:
Is 99–107 another power-building zone like 70–84 was?
If yes, the next expansion could be much bigger than the small reactions we're seeing inside the range.
Not a prediction. Just the structure I’m watching.
$SOL — The Bigger Picture
SOL has already shown this pattern before:
60 → 70–84 sideways for 2+ months → 111.60
Now, after 111.60, price has been spending around 17–18 days sideways near 99–107.
That’s what has my attention.
Sideways doesn’t automatically mean bullish — it can prepare for either direction. The key is how the range resolves.
If 99–107 holds, sellers fail to get acceptance below the range, and bulls continue defending the lower side, then I see a potential path:
107/108 → 111.60 → 127–130 → 140–150
A wick toward 95 or even 90 is possible, but what matters is whether price accepts there or quickly reclaims.
For me, the bigger question is simple:
Is 99–107 another power-building zone like 70–84 was?
If yes, the next expansion could be much bigger than the small reactions we're seeing inside the range.
Not a prediction. Just the structure I’m watching.
SOL has already shown this pattern before:
60 → 70–84 sideways for 2+ months → 111.60
Now, after 111.60, price has been spending around 17–18 days sideways near 99–107.
That’s what has my attention.
Sideways doesn’t automatically mean bullish — it can prepare for either direction. The key is how the range resolves.
If 99–107 holds, sellers fail to get acceptance below the range, and bulls continue defending the lower side, then I see a potential path:
107/108 → 111.60 → 127–130 → 140–150
A wick toward 95 or even 90 is possible, but what matters is whether price accepts there or quickly reclaims.
For me, the bigger question is simple:
Is 99–107 another power-building zone like 70–84 was?
If yes, the next expansion could be much bigger than the small reactions we're seeing inside the range.
Not a prediction. Just the structure I’m watching.
1
2
77
$SOL keep on eye around 103.28 . may be too early but keep on eye . we may get short set up here good one
$SOL keep on eye around 103.28 . may be too early but keep on eye . we may get short set up here good one
5
5
7k
$SOL Guys no more Shorts at this moment . seems like market will push for 105.77. if you wanna try any shorts wait until 105.77 or 106.50 area .
$SOL Guys no more Shorts at this moment . seems like market will push for 105.77. if you wanna try any shorts wait until 105.77 or 106.50 area .
8
25
28.2k
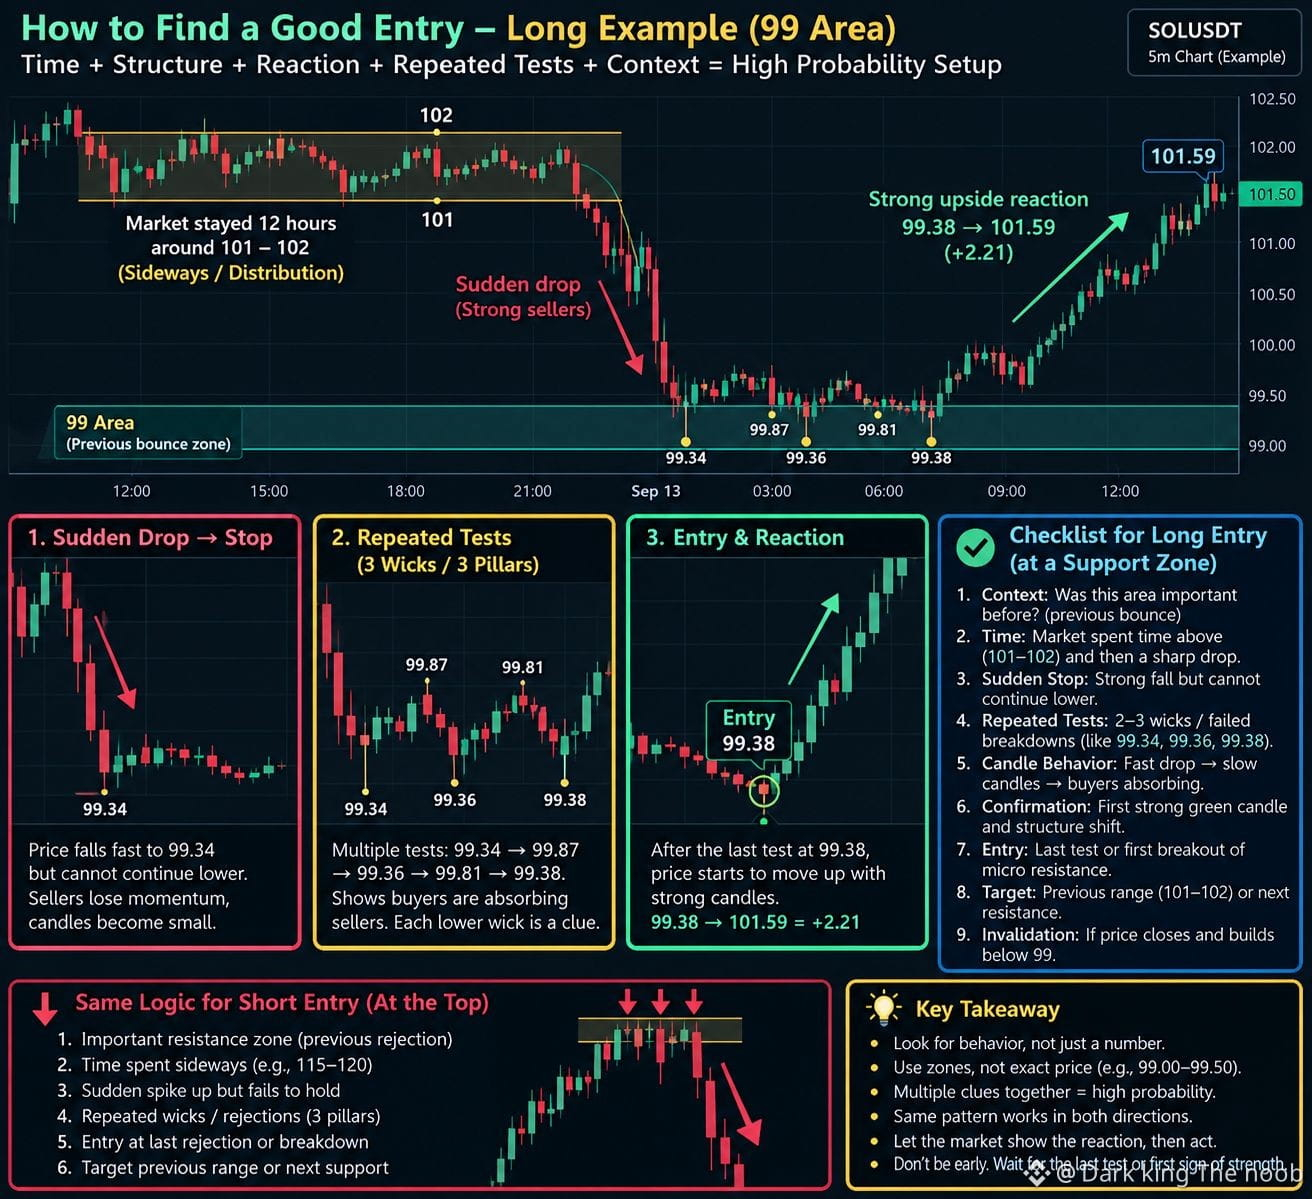
$SOL How to Find a Good Long Entry — Example: The 99 Area
Let me explain how I look for a good long entry.
The market spent around 12 hours between 101–102, then suddenly dropped hard toward 99.34.
But here’s what caught my attention:
1️⃣ Sudden drop → sudden slowdown
The market fell quickly, but once it reached the 99 area, the candles became much smaller. The downside momentum started disappearing.
2️⃣ Repeated tests / failed breakdowns
Look at the sequence:
99.34 → 99.87 → 99.36 → 99.81 → 99.38
The market kept testing the same area but couldn't properly expand lower.
3️⃣ Three clear “pillars” on the 1m/5m chart
You could see the market trying to push down, but every attempt was getting absorbed. Fast red candles suddenly became slow and weak.
4️⃣ Previous reaction zone
The 99 area was also a place where price had previously bounced back toward the upper range. That gives the zone additional context.
So now we have multiple clues together:
Big drop → sudden slowdown → repeated tests → failed breakdown → previous bounce zone.
That is where I start looking for a long.
The final clue was around 99.38. Once the market stopped making meaningful downside progress and started showing strength, that became the entry area.
And look what happened:
99.38 → 101.59 = +$2.21 🔥
The important lesson is:
Don't enter just because price reaches 99. Look at what price does when it gets there.
You want to see time + structure + reaction + repeated tests + location.
And the same logic works in reverse for shorts:
Important resistance → time spent → sudden spike up → slowdown → repeated failed pushes → rejection → short entry.
The exact price will always change.
The behavior is what matters.
$SOL How to Find a Good Long Entry — Example: The 99 Area
Let me explain how I look for a good long entry.
The market spent around 12 hours between 101–102, then suddenly dropped hard toward 99.34.
But here’s what caught my attention:
1️⃣ Sudden drop → sudden slowdown
The market fell quickly, but once it reached the 99 area, the candles became much smaller. The downside momentum started disappearing.
2️⃣ Repeated tests / failed breakdowns
Look at the sequence:
99.34 → 99.87 → 99.36 → 99.81 → 99.38
The market kept testing the same area but couldn't properly expand lower.
3️⃣ Three clear “pillars” on the 1m/5m chart
You could see the market trying to push down, but every attempt was getting absorbed. Fast red candles suddenly became slow and weak.
4️⃣ Previous reaction zone
The 99 area was also a place where price had previously bounced back toward the upper range. That gives the zone additional context.
So now we have multiple clues together:
Big drop → sudden slowdown → repeated tests → failed breakdown → previous bounce zone.
That is where I start looking for a long.
The final clue was around 99.38. Once the market stopped making meaningful downside progress and started showing strength, that became the entry area.
And look what happened:
99.38 → 101.59 = +$2.21 🔥
The important lesson is:
Don't enter just because price reaches 99. Look at what price does when it gets there.
You want to see time + structure + reaction + repeated tests + location.
And the same logic works in reverse for shorts:
Important resistance → time spent → sudden spike up → slowdown → repeated failed pushes → rejection → short entry.
The exact price will always change.
The behavior is what matters.
Let me explain how I look for a good long entry.
The market spent around 12 hours between 101–102, then suddenly dropped hard toward 99.34.
But here’s what caught my attention:
1️⃣ Sudden drop → sudden slowdown
The market fell quickly, but once it reached the 99 area, the candles became much smaller. The downside momentum started disappearing.
2️⃣ Repeated tests / failed breakdowns
Look at the sequence:
99.34 → 99.87 → 99.36 → 99.81 → 99.38
The market kept testing the same area but couldn't properly expand lower.
3️⃣ Three clear “pillars” on the 1m/5m chart
You could see the market trying to push down, but every attempt was getting absorbed. Fast red candles suddenly became slow and weak.
4️⃣ Previous reaction zone
The 99 area was also a place where price had previously bounced back toward the upper range. That gives the zone additional context.
So now we have multiple clues together:
Big drop → sudden slowdown → repeated tests → failed breakdown → previous bounce zone.
That is where I start looking for a long.
The final clue was around 99.38. Once the market stopped making meaningful downside progress and started showing strength, that became the entry area.
And look what happened:
99.38 → 101.59 = +$2.21 🔥
The important lesson is:
Don't enter just because price reaches 99. Look at what price does when it gets there.
You want to see time + structure + reaction + repeated tests + location.
And the same logic works in reverse for shorts:
Important resistance → time spent → sudden spike up → slowdown → repeated failed pushes → rejection → short entry.
The exact price will always change.
The behavior is what matters.
121
Article
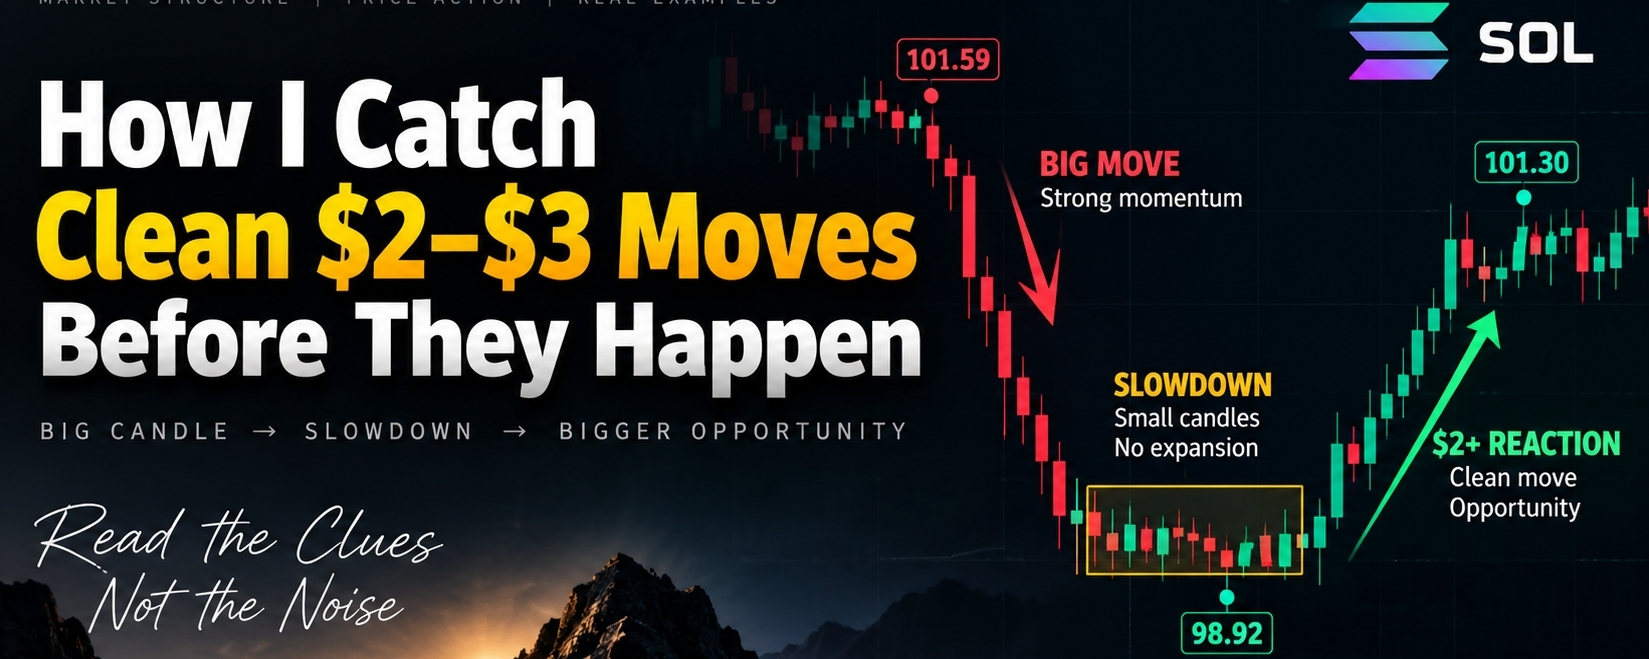
How I Catch Clean $2–$3 Moves Before They Happen$SOL One thing I’ve been learning from watching SOL is that catching a clean $2–$3 move is not always about predicting the direction.
Sometimes the biggest clue is what happens after a big move.
For example, SOL made a strong downside move from around 101.59 and came down toward the 99 area with big candles.
At first, everything looked bearish.
The market was going down, so naturally the brain starts thinking:
“It’s going lower. It’s going lower.”
But then something changed.
Around 99.30–99.50, the market became extremely slow.
Instead of continuing with strong downside candles, it started moving only around $0.10–$0.20 at a time:
99.35 → 99.45 → 99.24 → 99.10
This is where the real clue appeared.
The market was still moving down, but the expansion was disappearing.
That distinction is extremely important.
Big displacement → sudden slowdown
When a market makes a large move and then suddenly becomes very slow, I don't automatically assume that the same move will continue.
I start asking:
“Is the current move actually still working?”
Because if sellers were truly in control, I would expect continued expansion.
Instead, we saw:
101.59 → 99.8/99.9
Big move.
Then:
99.xx → extremely slow → stuck
That slowdown was telling us something.
Eventually the market reached around 98.92 and stayed there for roughly two hours.
No meaningful downside expansion.
Then the market started moving back upward.
And from:
98.92 → 100.80 → 101.30+
That became a clean $2+ reaction.
This is how I think about the $2–$3 move
I don't want to trade every small movement.
I want to find the moments where the market gives me a clean structural clue.
For example:
Big displacement
↓
Movement starts shrinking
↓
Market becomes slow
↓
Price spends time at the location
↓
No further expansion in the original direction
↓
Reaction starts
That is where I start looking for the next $2–$3 opportunity.
And there is another important lesson here.
The overall market can still be bearish.
That doesn't mean every move has to be down.
A bearish market can still give you a $2–$3 upside reaction from a lower zone.
Likewise, a bullish market can still give you a sharp downside reaction.
So I try to separate:
Overall direction
from
the reaction available at the current location.
The biggest mistake I made
The funny part is that I actually mapped the possibility around 98–99 before the move happened. 🤣
I had the feeling:
“If this gets stuck around 98–99, it can come back toward 100.80 or even higher.”
But I didn't fully trust myself because the market still felt bearish.
That was the noise.
The structure was saying one thing.
My brain was saying:
“But it's going down!”
And that's exactly where I need to improve.
Not by trying to predict every move.
But by trusting a clear structural clue when it appears.
My main takeaway
When a market comes down with a big candle, then suddenly becomes very slow and stuck, I don't automatically chase the continuation.
I watch for whether the move has finished for now.
Because sometimes:
Big move → stop → slow → reaction
is the beginning of the next juicy $2–$3 move.
And that's what makes trading interesting.
You don't need to catch everything.
You just need to recognize the clean moves when the market actually gives them.
Map the move.
Wait for the clue.
Ignore the noise.
Catch the juicy $2–$3. 🔥
$SOL
How I Catch Clean $2–$3 Moves Before They Happen
$SOL One thing I’ve been learning from watching SOL is that catching a clean $2–$3 move is not always about predicting the direction.
Sometimes the biggest clue is what happens after a big move.
For example, SOL made a strong downside move from around 101.59 and came down toward the 99 area with big candles.
At first, everything looked bearish.
The market was going down, so naturally the brain starts thinking:
“It’s going lower. It’s going lower.”
But then something changed.
Around 99.30–99.50, the market became extremely slow.
Instead of continuing with strong downside candles, it started moving only around $0.10–$0.20 at a time:
99.35 → 99.45 → 99.24 → 99.10
This is where the real clue appeared.
The market was still moving down, but the expansion was disappearing.
That distinction is extremely important.
Big displacement → sudden slowdown
When a market makes a large move and then suddenly becomes very slow, I don't automatically assume that the same move will continue.
I start asking:
“Is the current move actually still working?”
Because if sellers were truly in control, I would expect continued expansion.
Instead, we saw:
101.59 → 99.8/99.9
Big move.
Then:
99.xx → extremely slow → stuck
That slowdown was telling us something.
Eventually the market reached around 98.92 and stayed there for roughly two hours.
No meaningful downside expansion.
Then the market started moving back upward.
And from:
98.92 → 100.80 → 101.30+
That became a clean $2+ reaction.
This is how I think about the $2–$3 move
I don't want to trade every small movement.
I want to find the moments where the market gives me a clean structural clue.
For example:
Big displacement
↓
Movement starts shrinking
↓
Market becomes slow
↓
Price spends time at the location
↓
No further expansion in the original direction
↓
Reaction starts
That is where I start looking for the next $2–$3 opportunity.
And there is another important lesson here.
The overall market can still be bearish.
That doesn't mean every move has to be down.
A bearish market can still give you a $2–$3 upside reaction from a lower zone.
Likewise, a bullish market can still give you a sharp downside reaction.
So I try to separate:
Overall direction
from
the reaction available at the current location.
The biggest mistake I made
The funny part is that I actually mapped the possibility around 98–99 before the move happened. 🤣
I had the feeling:
“If this gets stuck around 98–99, it can come back toward 100.80 or even higher.”
But I didn't fully trust myself because the market still felt bearish.
That was the noise.
The structure was saying one thing.
My brain was saying:
“But it's going down!”
And that's exactly where I need to improve.
Not by trying to predict every move.
But by trusting a clear structural clue when it appears.
My main takeaway
When a market comes down with a big candle, then suddenly becomes very slow and stuck, I don't automatically chase the continuation.
I watch for whether the move has finished for now.
Because sometimes:
Big move → stop → slow → reaction
is the beginning of the next juicy $2–$3 move.
And that's what makes trading interesting.
You don't need to catch everything.
You just need to recognize the clean moves when the market actually gives them.
Map the move.
Wait for the clue.
Ignore the noise.
Catch the juicy $2–$3. 🔥
$SOL
Sometimes the biggest clue is what happens after a big move.
For example, SOL made a strong downside move from around 101.59 and came down toward the 99 area with big candles.
At first, everything looked bearish.
The market was going down, so naturally the brain starts thinking:
“It’s going lower. It’s going lower.”
But then something changed.
Around 99.30–99.50, the market became extremely slow.
Instead of continuing with strong downside candles, it started moving only around $0.10–$0.20 at a time:
99.35 → 99.45 → 99.24 → 99.10
This is where the real clue appeared.
The market was still moving down, but the expansion was disappearing.
That distinction is extremely important.
Big displacement → sudden slowdown
When a market makes a large move and then suddenly becomes very slow, I don't automatically assume that the same move will continue.
I start asking:
“Is the current move actually still working?”
Because if sellers were truly in control, I would expect continued expansion.
Instead, we saw:
101.59 → 99.8/99.9
Big move.
Then:
99.xx → extremely slow → stuck
That slowdown was telling us something.
Eventually the market reached around 98.92 and stayed there for roughly two hours.
No meaningful downside expansion.
Then the market started moving back upward.
And from:
98.92 → 100.80 → 101.30+
That became a clean $2+ reaction.
This is how I think about the $2–$3 move
I don't want to trade every small movement.
I want to find the moments where the market gives me a clean structural clue.
For example:
Big displacement
↓
Movement starts shrinking
↓
Market becomes slow
↓
Price spends time at the location
↓
No further expansion in the original direction
↓
Reaction starts
That is where I start looking for the next $2–$3 opportunity.
And there is another important lesson here.
The overall market can still be bearish.
That doesn't mean every move has to be down.
A bearish market can still give you a $2–$3 upside reaction from a lower zone.
Likewise, a bullish market can still give you a sharp downside reaction.
So I try to separate:
Overall direction
from
the reaction available at the current location.
The biggest mistake I made
The funny part is that I actually mapped the possibility around 98–99 before the move happened. 🤣
I had the feeling:
“If this gets stuck around 98–99, it can come back toward 100.80 or even higher.”
But I didn't fully trust myself because the market still felt bearish.
That was the noise.
The structure was saying one thing.
My brain was saying:
“But it's going down!”
And that's exactly where I need to improve.
Not by trying to predict every move.
But by trusting a clear structural clue when it appears.
My main takeaway
When a market comes down with a big candle, then suddenly becomes very slow and stuck, I don't automatically chase the continuation.
I watch for whether the move has finished for now.
Because sometimes:
Big move → stop → slow → reaction
is the beginning of the next juicy $2–$3 move.
And that's what makes trading interesting.
You don't need to catch everything.
You just need to recognize the clean moves when the market actually gives them.
Map the move.
Wait for the clue.
Ignore the noise.
Catch the juicy $2–$3. 🔥
$SOL
1
1
285
$SOL How to Catch a Clean $2–$3 Move
When the market came down from 101.59, it came down with a big candle and strong momentum.
It reached around 99.80–99.90, and then something very important happened.
The market became extremely slow.
Instead of continuing with big candles, it started moving down only $0.10–$0.20 at a time:
99.35 → 99.45 → 99.24 → 99.10
At that moment, it still looked like:
“Market is going down, down, down.”
But the important clue was not the direction.
The important clue was:
The downside expansion had stopped.
Think about it:
If the market came from 101.59 with a big move, and then suddenly becomes slow and stuck around 99.xx, sellers are no longer getting the same expansion.
That can be the first sign that the current move is finished for now.
And that's exactly what happened.
The market stopped around 98.92, stayed there for roughly 2 hours, and then started moving back up.
From 98.92 → 101.30+.
Almost a $2.40 reaction.
So when you're looking for a clean $2–$3 trade, don't only look at direction.
Look at:
Big displacement → sudden slowdown → no further expansion → time spent → reaction back toward the origin.
The market was telling us something at 99.xx.
I saw it, but at the time I didn't fully trust it. 🤣
The lesson: When a big move suddenly becomes extremely slow, don't automatically assume continuation. Sometimes the market has already finished that leg — for now.
$SOL How to Catch a Clean $2–$3 Move
When the market came down from 101.59, it came down with a big candle and strong momentum.
It reached around 99.80–99.90, and then something very important happened.
The market became extremely slow.
Instead of continuing with big candles, it started moving down only $0.10–$0.20 at a time:
99.35 → 99.45 → 99.24 → 99.10
At that moment, it still looked like:
“Market is going down, down, down.”
But the important clue was not the direction.
The important clue was:
The downside expansion had stopped.
Think about it:
If the market came from 101.59 with a big move, and then suddenly becomes slow and stuck around 99.xx, sellers are no longer getting the same expansion.
That can be the first sign that the current move is finished for now.
And that's exactly what happened.
The market stopped around 98.92, stayed there for roughly 2 hours, and then started moving back up.
From 98.92 → 101.30+.
Almost a $2.40 reaction.
So when you're looking for a clean $2–$3 trade, don't only look at direction.
Look at:
Big displacement → sudden slowdown → no further expansion → time spent → reaction back toward the origin.
The market was telling us something at 99.xx.
I saw it, but at the time I didn't fully trust it. 🤣
The lesson: When a big move suddenly becomes extremely slow, don't automatically assume continuation. Sometimes the market has already finished that leg — for now.
When the market came down from 101.59, it came down with a big candle and strong momentum.
It reached around 99.80–99.90, and then something very important happened.
The market became extremely slow.
Instead of continuing with big candles, it started moving down only $0.10–$0.20 at a time:
99.35 → 99.45 → 99.24 → 99.10
At that moment, it still looked like:
“Market is going down, down, down.”
But the important clue was not the direction.
The important clue was:
The downside expansion had stopped.
Think about it:
If the market came from 101.59 with a big move, and then suddenly becomes slow and stuck around 99.xx, sellers are no longer getting the same expansion.
That can be the first sign that the current move is finished for now.
And that's exactly what happened.
The market stopped around 98.92, stayed there for roughly 2 hours, and then started moving back up.
From 98.92 → 101.30+.
Almost a $2.40 reaction.
So when you're looking for a clean $2–$3 trade, don't only look at direction.
Look at:
Big displacement → sudden slowdown → no further expansion → time spent → reaction back toward the origin.
The market was telling us something at 99.xx.
I saw it, but at the time I didn't fully trust it. 🤣
The lesson: When a big move suddenly becomes extremely slow, don't automatically assume continuation. Sometimes the market has already finished that leg — for now.
1
108
$SOL There is chance high to go around 102-103 or more this time then fall down again - around 99 area market is kind of slow . even though dont take long blindly above 101. check for shorts and also long around 99
$SOL There is chance high to go around 102-103 or more this time then fall down again - around 99 area market is kind of slow . even though dont take long blindly above 101. check for shorts and also long around 99
1
1.8k
$SOL Dont fall in trap thats just ranging market will visit around 95-96 area
$SOL Dont fall in trap thats just ranging market will visit around 95-96 area
85
$SOL who has taken short as per my entry point 🤣🤣
$SOL who has taken short as per my entry point 🤣🤣
23
$SOL How I Find the “Juicy” $2–$3 Move
A lot of people ask me:
“After a big move, how do you know where the next $2–$3 reaction can come from?”
For me, I don't start by guessing the target.
I start by looking at where the market actually fought.
Here is a simple example from $SOL:
100 was a clear fight zone.
The market was spending time around 100.
Then we saw:
99 → 100.42 → 97.36
From around 100.42, the market suddenly dropped to 97.36.
Then something interesting happened:
97.36 → 105.77
A huge upside move.
Now the question becomes:
From 105.77, where can we expect a meaningful reaction?
For me, the first place I look is back toward the 100 area.
Why?
Because 100 was the original fight zone, and the major downside displacement started from around that area.
And we actually saw:
105.77 → 100.30
Then buyers tried again:
100.30 → 103.11
This is why I don't randomly choose a $2–$3 target.
I look at the history of the location.
If the market spent time fighting at a certain area, and then made a strong displacement away from it, that area can become important when price returns from the opposite side.
So my thought process is:
Fight zone → strong displacement → price travels away → price returns → look for the reaction.
The goal isn't to predict every candle.
The goal is to understand where the market previously spent its energy.
That's where the juicy reaction can appear. 👀🔥
Trade the structure, not the noise.
$SOL
$SOL How I Find the “Juicy” $2–$3 Move
A lot of people ask me:
“After a big move, how do you know where the next $2–$3 reaction can come from?”
For me, I don't start by guessing the target.
I start by looking at where the market actually fought.
Here is a simple example from $SOL :
100 was a clear fight zone.
The market was spending time around 100.
Then we saw:
99 → 100.42 → 97.36
From around 100.42, the market suddenly dropped to 97.36.
Then something interesting happened:
97.36 → 105.77
A huge upside move.
Now the question becomes:
From 105.77, where can we expect a meaningful reaction?
For me, the first place I look is back toward the 100 area.
Why?
Because 100 was the original fight zone, and the major downside displacement started from around that area.
And we actually saw:
105.77 → 100.30
Then buyers tried again:
100.30 → 103.11
This is why I don't randomly choose a $2–$3 target.
I look at the history of the location.
If the market spent time fighting at a certain area, and then made a strong displacement away from it, that area can become important when price returns from the opposite side.
So my thought process is:
Fight zone → strong displacement → price travels away → price returns → look for the reaction.
The goal isn't to predict every candle.
The goal is to understand where the market previously spent its energy.
That's where the juicy reaction can appear. 👀🔥
Trade the structure, not the noise.
$SOL
A lot of people ask me:
“After a big move, how do you know where the next $2–$3 reaction can come from?”
For me, I don't start by guessing the target.
I start by looking at where the market actually fought.
Here is a simple example from $SOL :
100 was a clear fight zone.
The market was spending time around 100.
Then we saw:
99 → 100.42 → 97.36
From around 100.42, the market suddenly dropped to 97.36.
Then something interesting happened:
97.36 → 105.77
A huge upside move.
Now the question becomes:
From 105.77, where can we expect a meaningful reaction?
For me, the first place I look is back toward the 100 area.
Why?
Because 100 was the original fight zone, and the major downside displacement started from around that area.
And we actually saw:
105.77 → 100.30
Then buyers tried again:
100.30 → 103.11
This is why I don't randomly choose a $2–$3 target.
I look at the history of the location.
If the market spent time fighting at a certain area, and then made a strong displacement away from it, that area can become important when price returns from the opposite side.
So my thought process is:
Fight zone → strong displacement → price travels away → price returns → look for the reaction.
The goal isn't to predict every candle.
The goal is to understand where the market previously spent its energy.
That's where the juicy reaction can appear. 👀🔥
Trade the structure, not the noise.
$SOL
21
$SOL Short set up - Entry point 100.80-101.50 SL 101.80 TP 95-96
$SOL Short set up - Entry point 100.80-101.50 SL 101.80 TP 95-96
18
$SOL long entry zone when market come 99.80-100.20 if you see stopped and wick or suddenly big red den entry for long tp 101.10 , SL 99.30 , if you see stuck around 101den tp please. as thats the destination
$SOL long entry zone when market come 99.80-100.20 if you see stopped and wick or suddenly big red den entry for long tp 101.10 , SL 99.30 , if you see stuck around 101den tp please. as thats the destination
3
5
7.5k
$SOL guys see the rejection from 101.31 to 101.83 that's the sign of weakness - ready for short
$SOL guys see the rejection from 101.31 to 101.83 that's the sign of weakness - ready for short
12
Log in to explore more content
Join global crypto users on Binance Square
⚡️ Get latest and useful information about crypto.
💬 Trusted by the world’s largest crypto exchange.
👍 Discover real insights from verified creators.
Email / Phone number
Trending Topics
FedRateWatch
353,387 views
2,124 Discussing
Share & Win Traffic Reward in our Trending Hashtag Campaign
✨Topic: FOMC September, What's The Fed's Next Move?
👉How to Join:
Publish a short post or article with hashtag #FedRateWatch
Create content based on the below angles:
- August core CPI rose 0.3% month-over-month, and the odds of a 25bp hike this week are now close to 90%. Do you anticipate a rate hike this week? Is it a one-off, or the start of a longer hiking cycle?
- If the hike lands, how does it play out for BTC, tech stocks, and gold? Bullish or bearish?
- How are you planning to trade next? Share your BTC, stocks or gold trade/holdings with our trade sharing widget.
⏰Campaign Period:
- 2026-09-15 11:00 - 2026-09-17 3:00 UTC
🎁Reward:
- Qualified posts that comply with the above guidelines and contain more than 100 words will be reviewed and may receive a random traffic boost of 500 to 3,000 views. You will receive a notification from your feed secretary if your post is selected.
- Get a chance to have your article featured on Binance Square Official
Need ideas for your post? Visit the topic page #FedRateWatch or the Square Guide on How to Post for Better Reach.
Binance Square Official
·339 Likes
·666k views
BitcoinSlidesTo$76000
7,117 views
81 Discussing
BitcoinReboundsTo$79K
54,828 views
377 Discussing