$SOL — The Bigger Picture
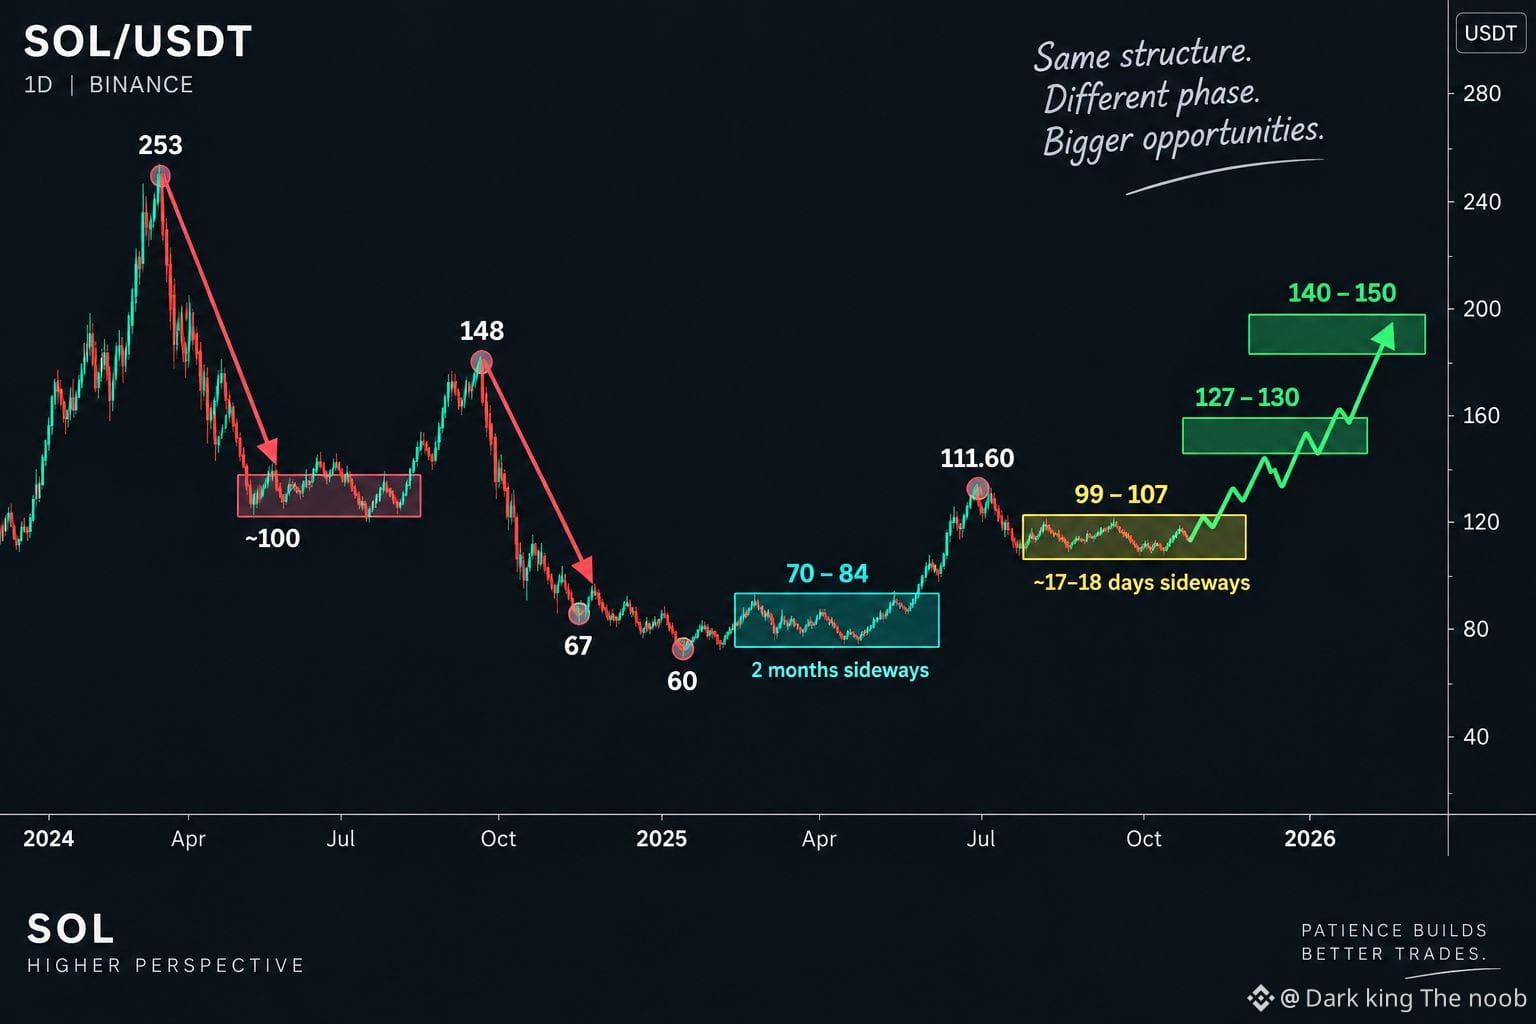
SOL has already shown this pattern before:
60 → 70–84 sideways for 2+ months → 111.60
Now, after 111.60, price has been spending around 17–18 days sideways near 99–107.
That’s what has my attention.
Sideways doesn’t automatically mean bullish — it can prepare for either direction. The key is how the range resolves.
If 99–107 holds, sellers fail to get acceptance below the range, and bulls continue defending the lower side, then I see a potential path:
107/108 → 111.60 → 127–130 → 140–150
A wick toward 95 or even 90 is possible, but what matters is whether price accepts there or quickly reclaims.
For me, the bigger question is simple:
Is 99–107 another power-building zone like 70–84 was?
If yes, the next expansion could be much bigger than the small reactions we're seeing inside the range.
Not a prediction. Just the structure I’m watching.
SOL has already shown this pattern before:
60 → 70–84 sideways for 2+ months → 111.60
Now, after 111.60, price has been spending around 17–18 days sideways near 99–107.
That’s what has my attention.
Sideways doesn’t automatically mean bullish — it can prepare for either direction. The key is how the range resolves.
If 99–107 holds, sellers fail to get acceptance below the range, and bulls continue defending the lower side, then I see a potential path:
107/108 → 111.60 → 127–130 → 140–150
A wick toward 95 or even 90 is possible, but what matters is whether price accepts there or quickly reclaims.
For me, the bigger question is simple:
Is 99–107 another power-building zone like 70–84 was?
If yes, the next expansion could be much bigger than the small reactions we're seeing inside the range.
Not a prediction. Just the structure I’m watching.