
cc陈一凡
3.5k Posts

cc陈一凡
Report
Block User
持认证专业证书,精研小短线快进快出、波段高抛低吸、微公众号cc陈一凡 趋势小长线布橘
0 Following
8.9K+ Followers
5.0K+ Liked
Posts
All
Quotes
PINNED
·
--
Binance chat room: you can directly chat with Yifan!!!
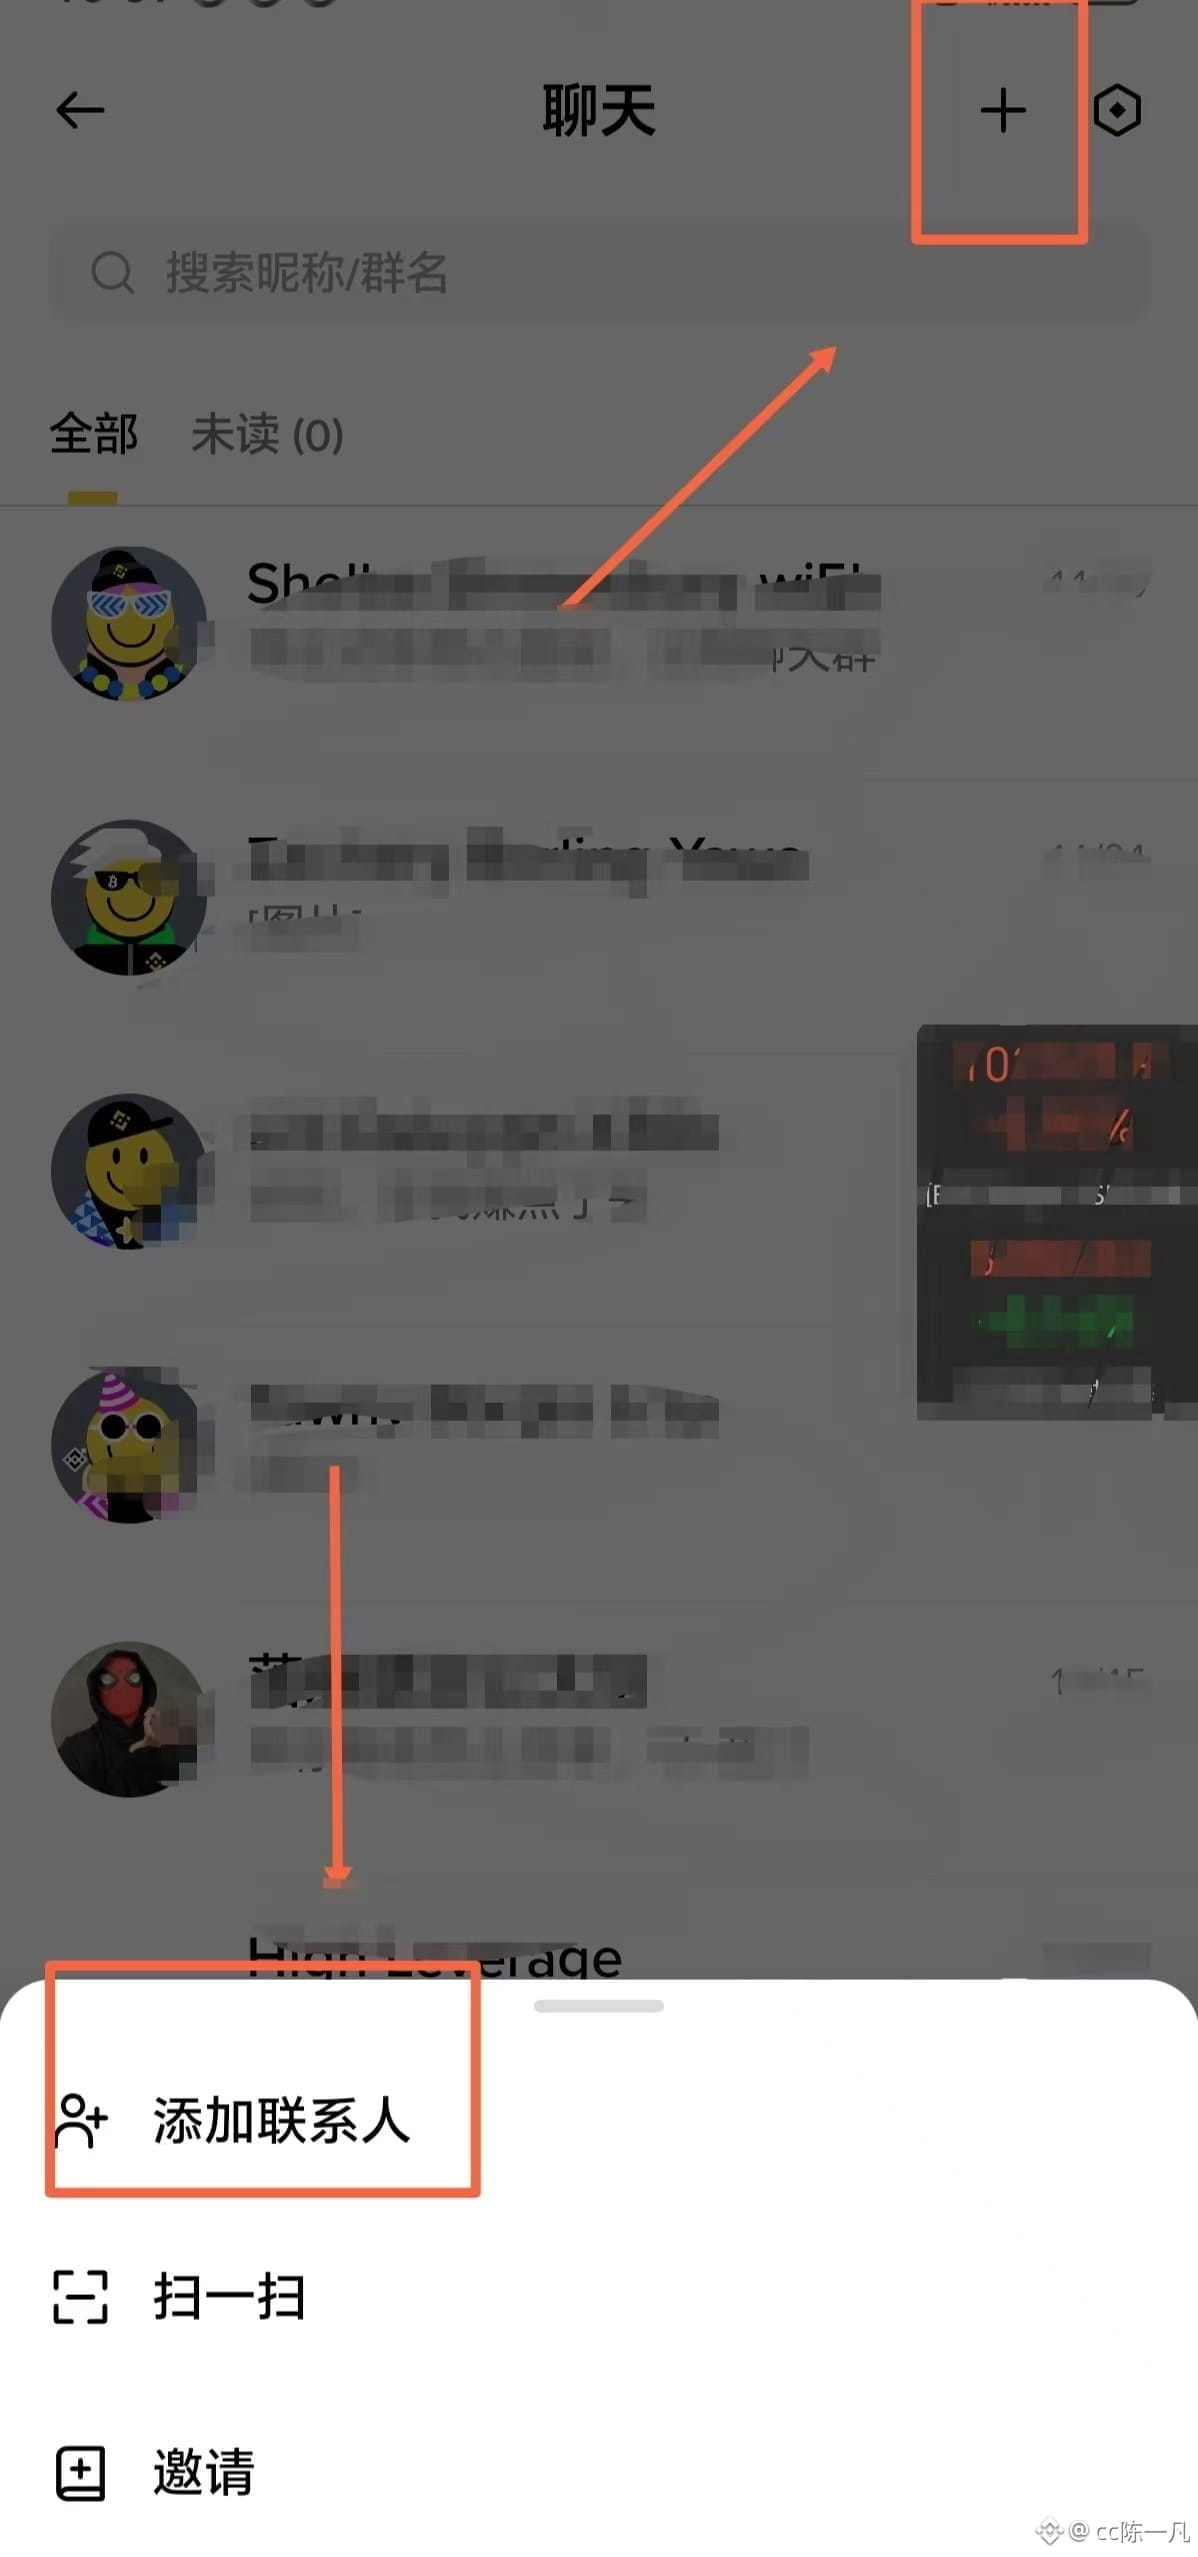
1. Open the Binance app. In the top search bar, type “Chat Room,” then click to enter the feature;
2. After entering the chat room, find the “+” button at the top-right corner and select “Add Friend”;
3. In the friend search box, enter my exclusive chat ID exactly: 1182544661. After clicking search, you’ll be able to find me. Send a friend request and you can start interacting right away!
If you’re anxious about being trapped, feel hopeless, or can’t make up your mind about how to read the market, you can all discuss it in Yifan’s chat room. Limited to three spots per day #BTC #ETH #BTC走势分析
Binance chat room: you can directly chat with Yifan!!!
1. Open the Binance app. In the top search bar, type “Chat Room,” then click to enter the feature;
2. After entering the chat room, find the “+” button at the top-right corner and select “Add Friend”;
3. In the friend search box, enter my exclusive chat ID exactly: 1182544661. After clicking search, you’ll be able to find me. Send a friend request and you can start interacting right away!
If you’re anxious about being trapped, feel hopeless, or can’t make up your mind about how to read the market, you can all discuss it in Yifan’s chat room. Limited to three spots per day #BTC #ETH #BTC走势分析
1. Open the Binance app. In the top search bar, type “Chat Room,” then click to enter the feature;
2. After entering the chat room, find the “+” button at the top-right corner and select “Add Friend”;
3. In the friend search box, enter my exclusive chat ID exactly: 1182544661. After clicking search, you’ll be able to find me. Send a friend request and you can start interacting right away!
If you’re anxious about being trapped, feel hopeless, or can’t make up your mind about how to read the market, you can all discuss it in Yifan’s chat room. Limited to three spots per day #BTC #ETH #BTC走势分析


10
113
PINNED
·
--
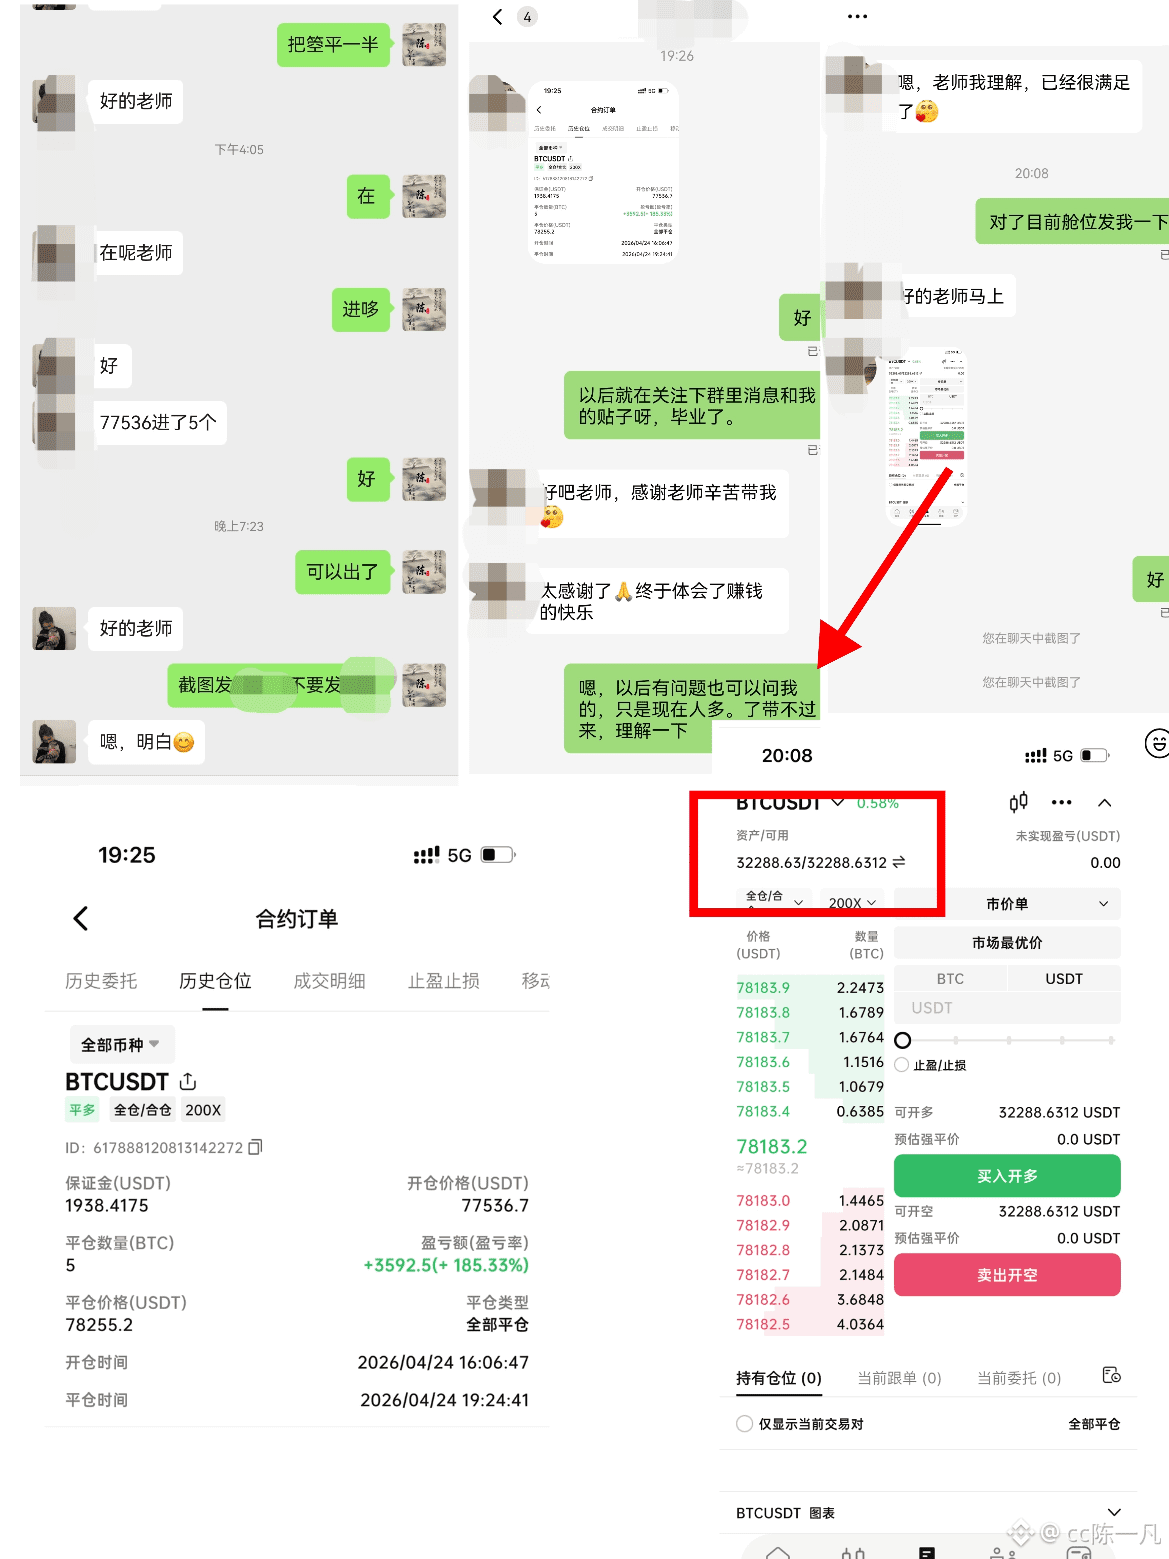
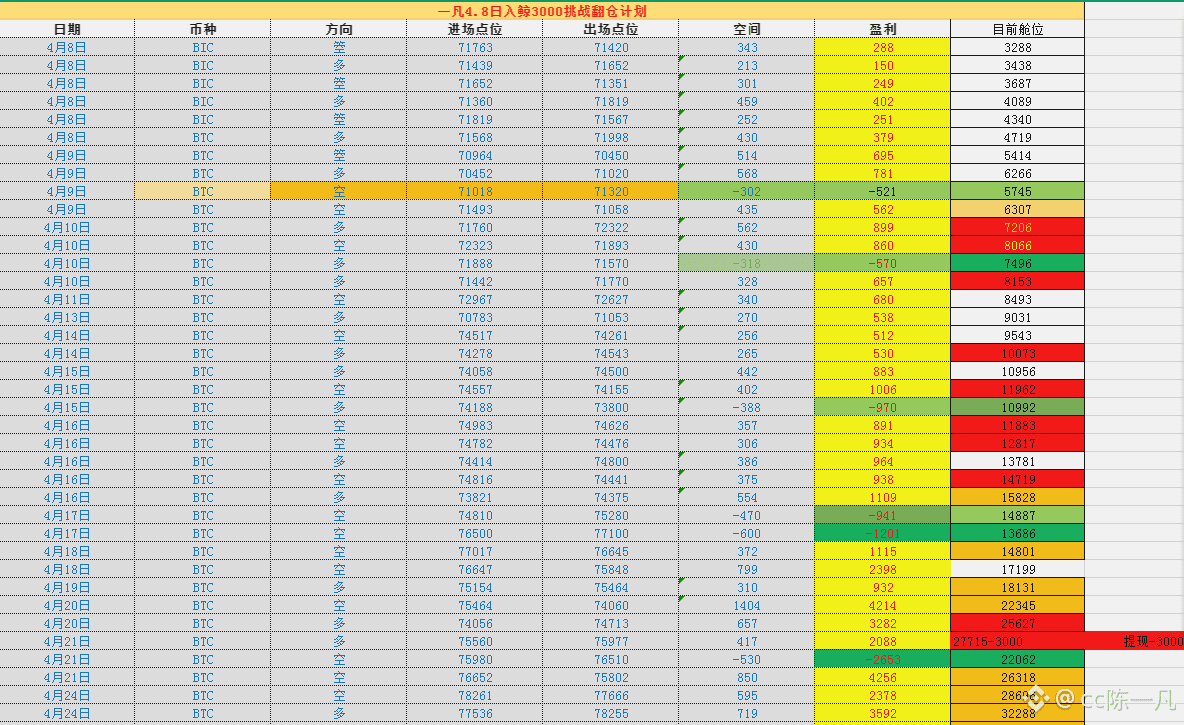
Congrats to the lady who loaded up 3000 on the 8th of this month, successfully completing the 10x moonshot plan from 3000 to 35288. Along the way, she pulled out 3000, and her current position is at 32288 with a total of 38 trades—32 wins and 6 losses. All records are available for review. Today she graduated smoothly, wishing her a bright future ahead. $BTC $RAVE $ETH
Congrats to the lady who loaded up 3000 on the 8th of this month, successfully completing the 10x moonshot plan from 3000 to 35288. Along the way, she pulled out 3000, and her current position is at 32288 with a total of 38 trades—32 wins and 6 losses. All records are available for review. Today she graduated smoothly, wishing her a bright future ahead. $BTC $RAVE $ETH
7
9
643
·
--
Bearish
It’s late and quiet again. Anyone else stuck holding bags?
The market will never go easy on you just because you’ve taken a heavy loss.
And time won’t become your friend just because you’re deeply underwater.
Many people think “getting unstuck” means—
getting back to their buy-in price, then walking away.
But truly getting unstuck has never been about breaking even; it’s about reclaiming control.
Think about it: how long has your money been tied up?
How many other opportunities have you missed?
Every day you open your account, that patch of red feels like a thorn in your heart.
Anxiety, regret, and indecision torment you again and again.
That’s what you’re really trapped by—
not the money, but your attention and emotions.
So, the plan to get unstuck this time with Bitcoin is simple: three steps.
Step one: accept the situation and stop dwelling on the past.
Stop thinking, “If only I had…”
The market doesn’t care about tears; it only cares about logic.
Where you are now is a new starting line.
Step two: make room and free up cash.
Getting unstuck doesn’t mean stubbornly holding on forever.
It means using swing trades, hedging, or adjusting your position
to turn dead weight into usable firepower.
Step three: use time to create room, but don’t become a prisoner of time.
Set your stop-loss and take-profit levels, and let your strategy do the work.
The day you get unstuck isn’t when the number on your account reaches zero,
but when you can finally close your charts calmly,
enjoy a proper meal, and get a good night’s sleep.
Don’t let one bad position trap your whole life.
Getting unstuck is really about freeing your mind. I’ll help you for free—come find me in the chatroom. $SNDK $BTC #$ETH
It’s late and quiet again. Anyone else stuck holding bags?
The market will never go easy on you just because you’ve taken a heavy loss.
And time won’t become your friend just because you’re deeply underwater.
Many people think “getting unstuck” means—
getting back to their buy-in price, then walking away.
But truly getting unstuck has never been about breaking even; it’s about reclaiming control.
Think about it: how long has your money been tied up?
How many other opportunities have you missed?
Every day you open your account, that patch of red feels like a thorn in your heart.
Anxiety, regret, and indecision torment you again and again.
That’s what you’re really trapped by—
not the money, but your attention and emotions.
So, the plan to get unstuck this time with Bitcoin is simple: three steps.
Step one: accept the situation and stop dwelling on the past.
Stop thinking, “If only I had…”
The market doesn’t care about tears; it only cares about logic.
Where you are now is a new starting line.
Step two: make room and free up cash.
Getting unstuck doesn’t mean stubbornly holding on forever.
It means using swing trades, hedging, or adjusting your position
to turn dead weight into usable firepower.
Step three: use time to create room, but don’t become a prisoner of time.
Set your stop-loss and take-profit levels, and let your strategy do the work.
The day you get unstuck isn’t when the number on your account reaches zero,
but when you can finally close your charts calmly,
enjoy a proper meal, and get a good night’s sleep.
Don’t let one bad position trap your whole life.
Getting unstuck is really about freeing your mind. I’ll help you for free—come find me in the chatroom. $SNDK $BTC #$ETH
The market will never go easy on you just because you’ve taken a heavy loss.
And time won’t become your friend just because you’re deeply underwater.
Many people think “getting unstuck” means—
getting back to their buy-in price, then walking away.
But truly getting unstuck has never been about breaking even; it’s about reclaiming control.
Think about it: how long has your money been tied up?
How many other opportunities have you missed?
Every day you open your account, that patch of red feels like a thorn in your heart.
Anxiety, regret, and indecision torment you again and again.
That’s what you’re really trapped by—
not the money, but your attention and emotions.
So, the plan to get unstuck this time with Bitcoin is simple: three steps.
Step one: accept the situation and stop dwelling on the past.
Stop thinking, “If only I had…”
The market doesn’t care about tears; it only cares about logic.
Where you are now is a new starting line.
Step two: make room and free up cash.
Getting unstuck doesn’t mean stubbornly holding on forever.
It means using swing trades, hedging, or adjusting your position
to turn dead weight into usable firepower.
Step three: use time to create room, but don’t become a prisoner of time.
Set your stop-loss and take-profit levels, and let your strategy do the work.
The day you get unstuck isn’t when the number on your account reaches zero,
but when you can finally close your charts calmly,
enjoy a proper meal, and get a good night’s sleep.
Don’t let one bad position trap your whole life.
Getting unstuck is really about freeing your mind. I’ll help you for free—come find me in the chatroom. $SNDK $BTC #$ETH


2
1.7k
·
--
Bearish
So weak—will this move hit a new low? What do you think?
So weak—will this move hit a new low? What do you think?
1
493
·
--
Bearish
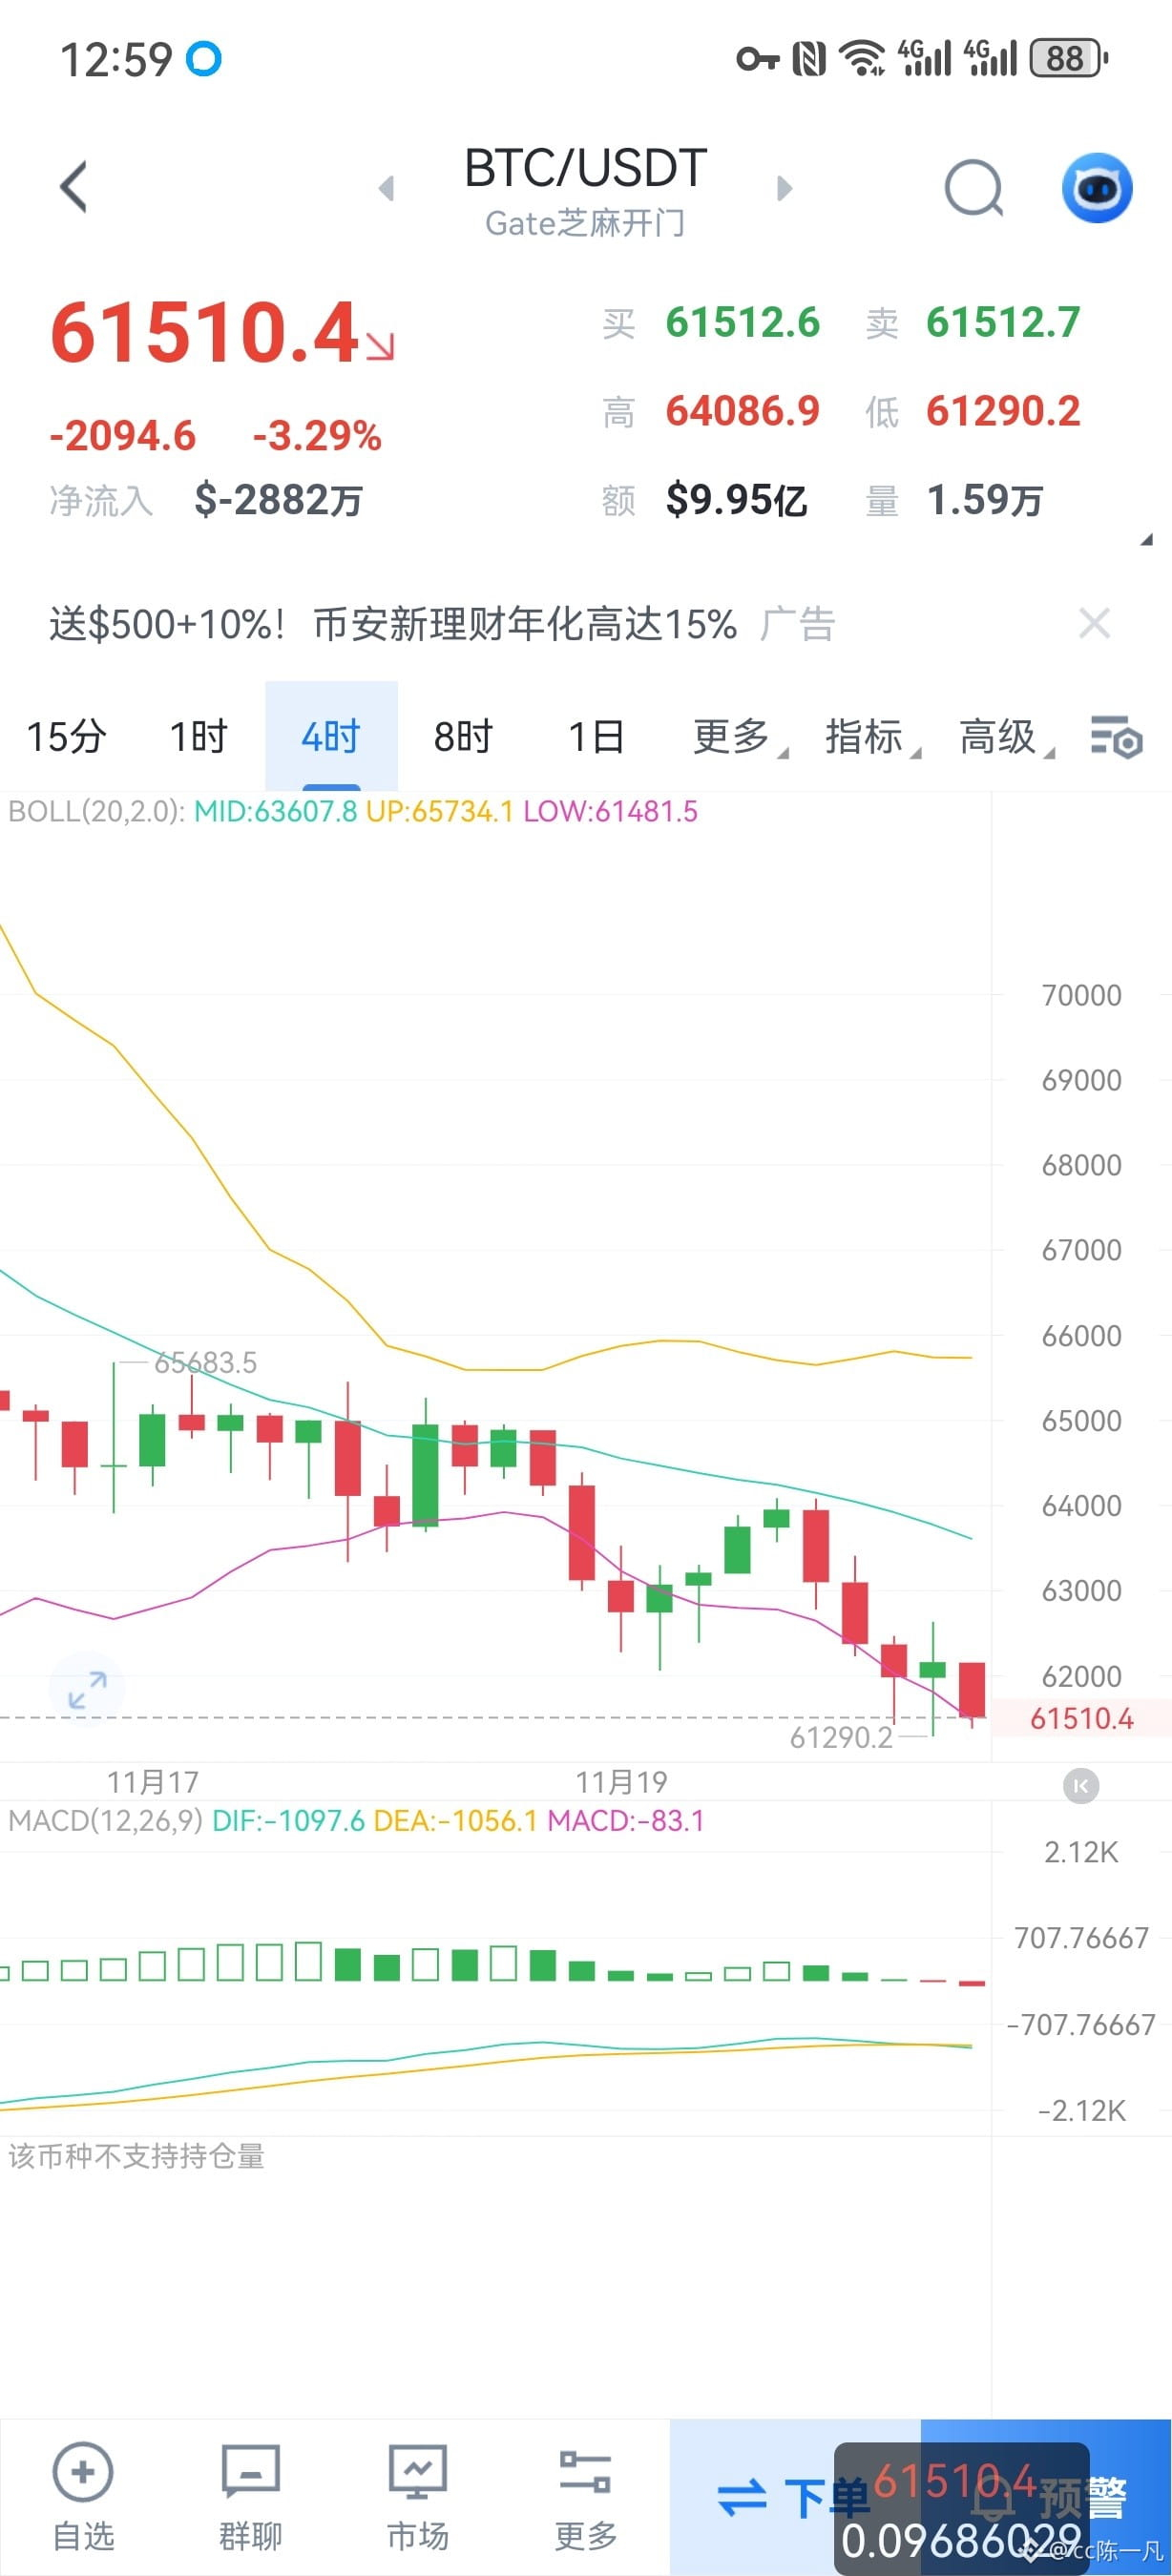
11.20$BTC Midday Analysis
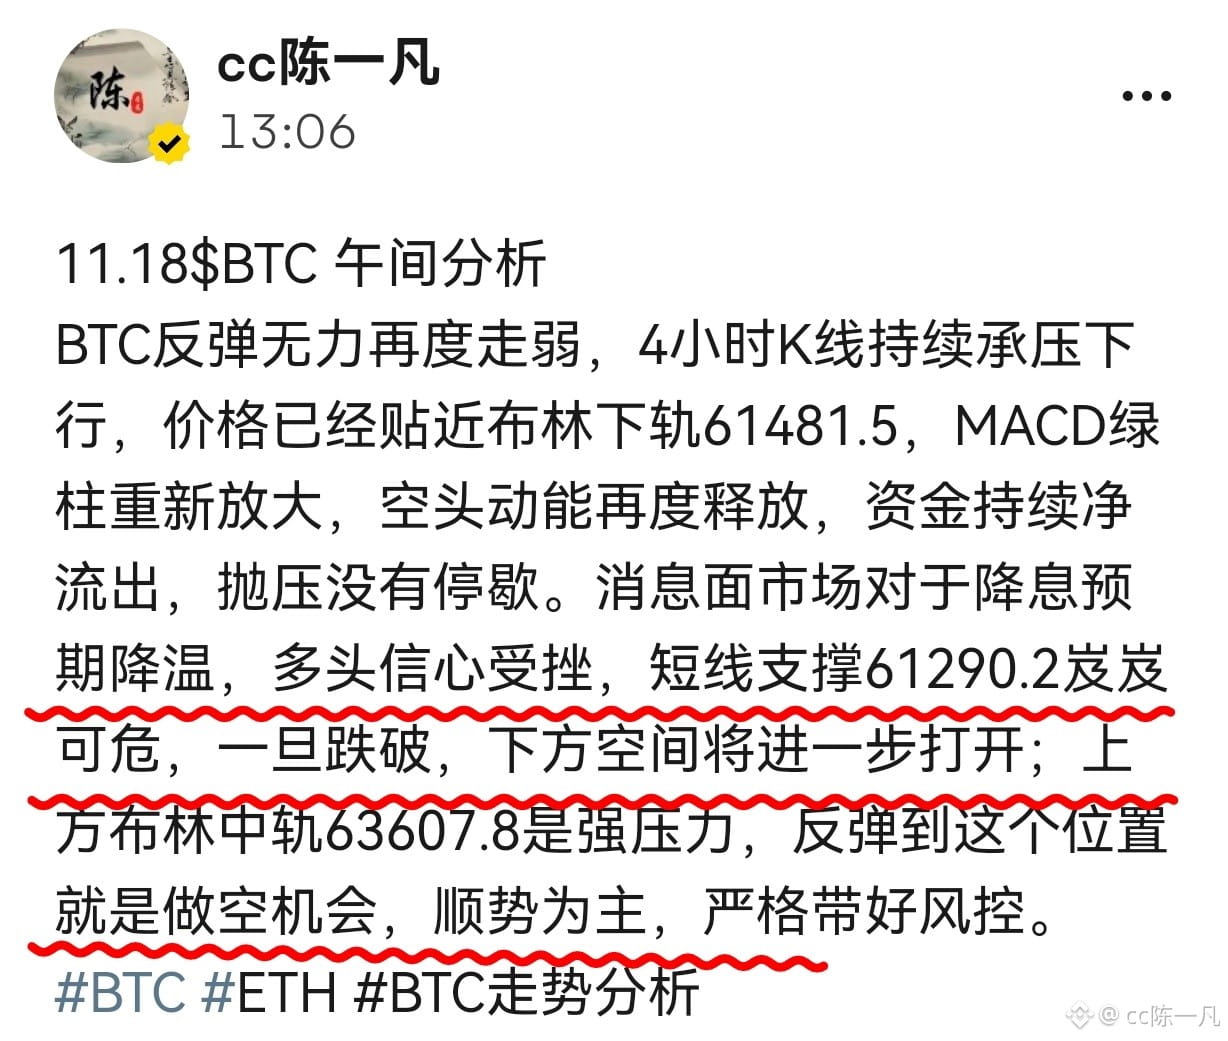
BTC's rebound has lost steam and weakened again. The 4-hour candlesticks remain under sustained downward pressure, and the price has approached the lower Bollinger Band at 61481.5. The MACD histogram's green bars have expanded again, bearish momentum is returning, and funds continue to flow out, with selling pressure showing no sign of abating. Market expectations for interest rate cuts have cooled, undermining bullish confidence. The short-term support at 61290.2 is precarious; if it breaks, further downside will open up. The middle Bollinger Band at 63607.8 is strong resistance above; a rebound to this level would be an opportunity to sell short. Favor trading with the trend and maintain strict risk controls. #BTC #ETH #BTC走势分析
11.20$BTC Midday Analysis
BTC's rebound has lost steam and weakened again. The 4-hour candlesticks remain under sustained downward pressure, and the price has approached the lower Bollinger Band at 61481.5. The MACD histogram's green bars have expanded again, bearish momentum is returning, and funds continue to flow out, with selling pressure showing no sign of abating. Market expectations for interest rate cuts have cooled, undermining bullish confidence. The short-term support at 61290.2 is precarious; if it breaks, further downside will open up. The middle Bollinger Band at 63607.8 is strong resistance above; a rebound to this level would be an opportunity to sell short. Favor trading with the trend and maintain strict risk controls. #BTC #ETH #BTC走势分析
BTC's rebound has lost steam and weakened again. The 4-hour candlesticks remain under sustained downward pressure, and the price has approached the lower Bollinger Band at 61481.5. The MACD histogram's green bars have expanded again, bearish momentum is returning, and funds continue to flow out, with selling pressure showing no sign of abating. Market expectations for interest rate cuts have cooled, undermining bullish confidence. The short-term support at 61290.2 is precarious; if it breaks, further downside will open up. The middle Bollinger Band at 63607.8 is strong resistance above; a rebound to this level would be an opportunity to sell short. Favor trading with the trend and maintain strict risk controls. #BTC #ETH #BTC走势分析
164
·
--
Bearish
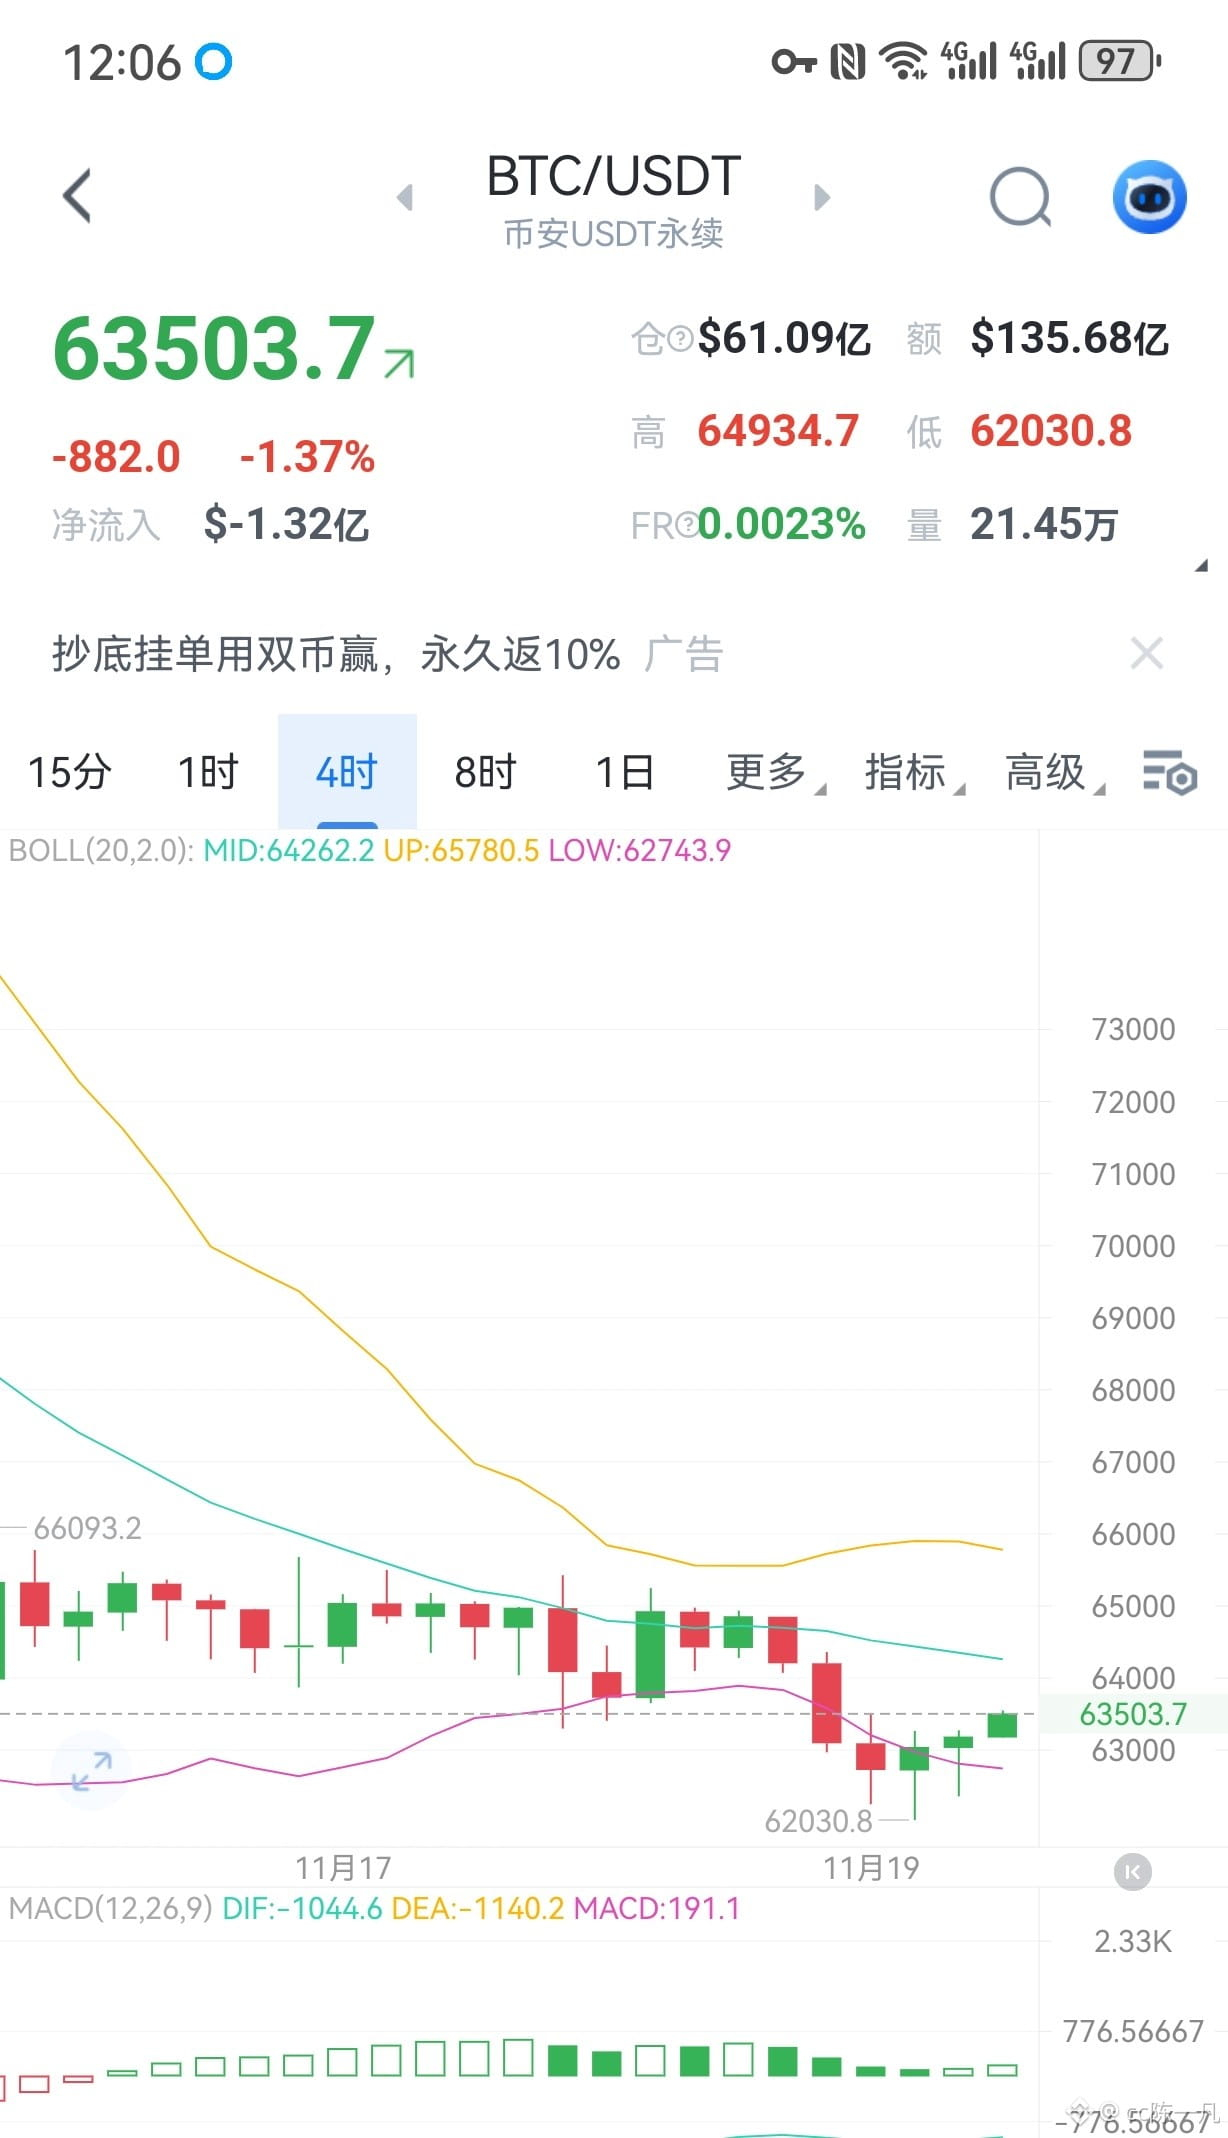
11.19$BTC Analysis
Market conditions seem to have returned to early June; rallies are opportunities to short.
On the 4-hour chart, Bitcoin began to stabilize and rebound slightly after dipping to a low of 62030.8. The current price is 63503.7, consolidating near the lower Bollinger Band.
The middle Bollinger Band at 64262.2 is the first short-term resistance, with strong resistance above at 65780.5. Support below is at 62743.9, while this period’s low of 62030.8 is a key level to defend.
The MACD is turning up from a low, and the green bars are shrinking, indicating that bearish momentum is fading somewhat. This is a weak recovery after being oversold; the overall trend remains choppy to downward. For now, the rebound is just a corrective recovery, with no signal of a strong reversal yet. Yifan’s personal suggestion: short around 64200–64800, targeting around 62800–62000; short Ethereum around 1850–1895, targeting around 1760–1715. #BTC #ETH #BTC走势分析
11.19$BTC Analysis
Market conditions seem to have returned to early June; rallies are opportunities to short.
On the 4-hour chart, Bitcoin began to stabilize and rebound slightly after dipping to a low of 62030.8. The current price is 63503.7, consolidating near the lower Bollinger Band.
The middle Bollinger Band at 64262.2 is the first short-term resistance, with strong resistance above at 65780.5. Support below is at 62743.9, while this period’s low of 62030.8 is a key level to defend.
The MACD is turning up from a low, and the green bars are shrinking, indicating that bearish momentum is fading somewhat. This is a weak recovery after being oversold; the overall trend remains choppy to downward. For now, the rebound is just a corrective recovery, with no signal of a strong reversal yet. Yifan’s personal suggestion: short around 64200–64800, targeting around 62800–62000; short Ethereum around 1850–1895, targeting around 1760–1715. #BTC #ETH #BTC走势分析
Market conditions seem to have returned to early June; rallies are opportunities to short.
On the 4-hour chart, Bitcoin began to stabilize and rebound slightly after dipping to a low of 62030.8. The current price is 63503.7, consolidating near the lower Bollinger Band.
The middle Bollinger Band at 64262.2 is the first short-term resistance, with strong resistance above at 65780.5. Support below is at 62743.9, while this period’s low of 62030.8 is a key level to defend.
The MACD is turning up from a low, and the green bars are shrinking, indicating that bearish momentum is fading somewhat. This is a weak recovery after being oversold; the overall trend remains choppy to downward. For now, the rebound is just a corrective recovery, with no signal of a strong reversal yet. Yifan’s personal suggestion: short around 64200–64800, targeting around 62800–62000; short Ethereum around 1850–1895, targeting around 1760–1715. #BTC #ETH #BTC走势分析

367
·
--
Bearish
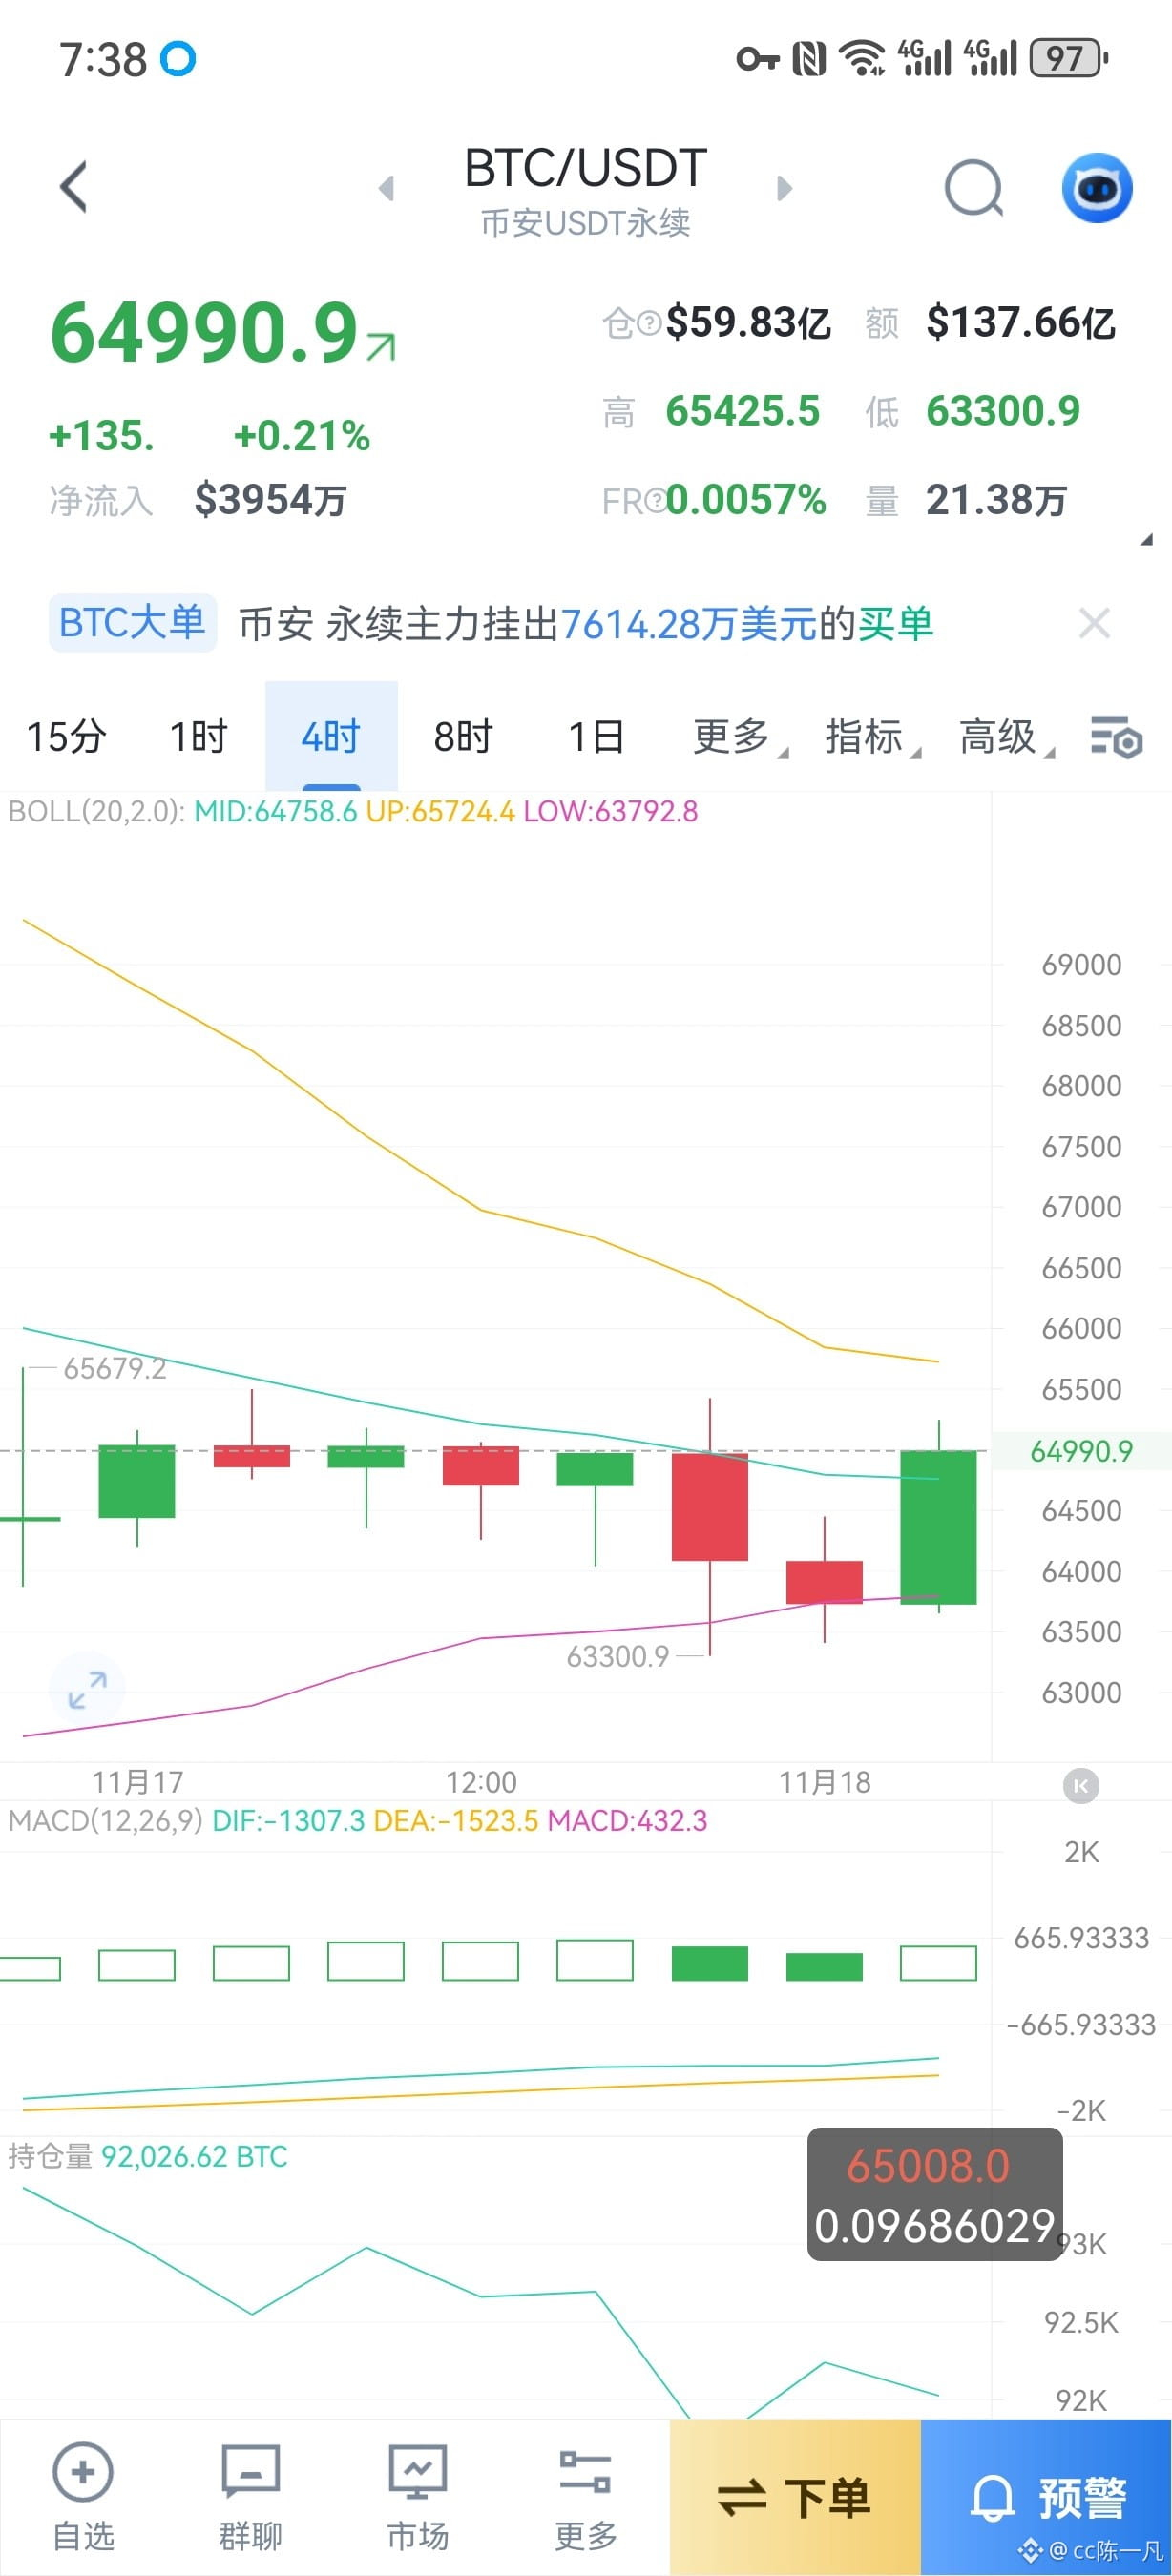
11.18$BTC $ETH Analysis
Macro pressure remains in place: The Federal Reserve will release its meeting minutes tonight, and expectations for a December rate hike remain high. Interest rates held in the restrictive range of 3.75%-4% continue to weigh on risk assets. The US October PPI rose to 6.5% year over year, and traders’ bets on a December rate hike have surged to 88%. Rising risk-free rates directly squeeze institutional arbitrage opportunities. The technical picture shows only a weak rebound: the MACD golden cross appeared below the zero line, indicating a technical recovery within a downtrend rather than a trend reversal. Prices remain capped by the upper Bollinger Band and the moving averages overhead, limiting the scope for a rebound.
Overall assessment: A single-day inflow into ETFs does not change the broader pattern of capital outflows. Expectations of continued monetary tightening remain a headwind, and with long positions crowded, the current rebound is more likely to be a bull trap. If the price is rejected near 65700 and turns lower, the bearish thesis will be confirmed. Yifan’s personal suggestion: short around 65500-66300, target 64000-63300; #ETH short around 1855-1910, target 1780-1725.#BTC #ETH #本周财报与宏观事件密集,市场再迎波动考验
11.18$BTC $ETH Analysis
Macro pressure remains in place: The Federal Reserve will release its meeting minutes tonight, and expectations for a December rate hike remain high. Interest rates held in the restrictive range of 3.75%-4% continue to weigh on risk assets. The US October PPI rose to 6.5% year over year, and traders’ bets on a December rate hike have surged to 88%. Rising risk-free rates directly squeeze institutional arbitrage opportunities. The technical picture shows only a weak rebound: the MACD golden cross appeared below the zero line, indicating a technical recovery within a downtrend rather than a trend reversal. Prices remain capped by the upper Bollinger Band and the moving averages overhead, limiting the scope for a rebound.
Overall assessment: A single-day inflow into ETFs does not change the broader pattern of capital outflows. Expectations of continued monetary tightening remain a headwind, and with long positions crowded, the current rebound is more likely to be a bull trap. If the price is rejected near 65700 and turns lower, the bearish thesis will be confirmed. Yifan’s personal suggestion: short around 65500-66300, target 64000-63300; #ETH short around 1855-1910, target 1780-1725.#BTC #ETH #本周财报与宏观事件密集,市场再迎波动考验
Macro pressure remains in place: The Federal Reserve will release its meeting minutes tonight, and expectations for a December rate hike remain high. Interest rates held in the restrictive range of 3.75%-4% continue to weigh on risk assets. The US October PPI rose to 6.5% year over year, and traders’ bets on a December rate hike have surged to 88%. Rising risk-free rates directly squeeze institutional arbitrage opportunities. The technical picture shows only a weak rebound: the MACD golden cross appeared below the zero line, indicating a technical recovery within a downtrend rather than a trend reversal. Prices remain capped by the upper Bollinger Band and the moving averages overhead, limiting the scope for a rebound.
Overall assessment: A single-day inflow into ETFs does not change the broader pattern of capital outflows. Expectations of continued monetary tightening remain a headwind, and with long positions crowded, the current rebound is more likely to be a bull trap. If the price is rejected near 65700 and turns lower, the bearish thesis will be confirmed. Yifan’s personal suggestion: short around 65500-66300, target 64000-63300; #ETH short around 1855-1910, target 1780-1725.#BTC #ETH #本周财报与宏观事件密集,市场再迎波动考验
529
·
--
Bearish
Verified
11.18$BTC Analysis
Yifan has had everyone enjoying shorting these past few days, right? The 65,000–65,800 range has been a great place to short every day.
At the macro level, rising rate-hike expectations are directly weighing on risk assets. U.S. October PPI rose 6.5% year over year, its highest level in nearly four years, while CPI also came in above expectations. Markets have nearly priced in a December Fed rate hike. Deutsche Bank even expects the Fed to raise rates at each of its next three meetings. The 10-year Treasury yield has climbed back above 5%, significantly increasing the opportunity cost of holding a zero-yield asset like Bitcoin.
On the fund-flow front, institutions are withdrawing systematically. U.S. spot Bitcoin ETFs have seen net outflows for several consecutive days, with cumulative outflows of about $2.1 billion in November, officially turning net inflows for the year negative. BlackRock’s IBIT, a bellwether product, accounted for about 85% of the entire market’s outflows in a single week, showing that even major institutional allocators are pulling back. On-chain data confirms the trend: whales are depositing about $55 million more worth of BTC into exchanges each day than they are withdrawing, and selling pressure from large holders continues to build.
The technical breakdown is confirmed. Bitcoin has fallen below the lower Bollinger Band and is trading beneath the 200-day moving average, turning the medium-term trend bearish. Although the MACD histogram is showing signs of shrinking green bars, this recovery below the zero line is more likely a temporary pause in bearish momentum than a trend reversal. $62,000 is a key near-term support level; if it fails, the psychological $60,000 level will be directly in sight. Until ETF outflows stabilize and whales switch to net withdrawals, a rebound is more likely to offer an opportunity to short at higher prices than to signal a bottom.#BTC #ETH #BTC走势分析
11.18$BTC Analysis
Yifan has had everyone enjoying shorting these past few days, right? The 65,000–65,800 range has been a great place to short every day.
At the macro level, rising rate-hike expectations are directly weighing on risk assets. U.S. October PPI rose 6.5% year over year, its highest level in nearly four years, while CPI also came in above expectations. Markets have nearly priced in a December Fed rate hike. Deutsche Bank even expects the Fed to raise rates at each of its next three meetings. The 10-year Treasury yield has climbed back above 5%, significantly increasing the opportunity cost of holding a zero-yield asset like Bitcoin.
On the fund-flow front, institutions are withdrawing systematically. U.S. spot Bitcoin ETFs have seen net outflows for several consecutive days, with cumulative outflows of about $2.1 billion in November, officially turning net inflows for the year negative. BlackRock’s IBIT, a bellwether product, accounted for about 85% of the entire market’s outflows in a single week, showing that even major institutional allocators are pulling back. On-chain data confirms the trend: whales are depositing about $55 million more worth of BTC into exchanges each day than they are withdrawing, and selling pressure from large holders continues to build.
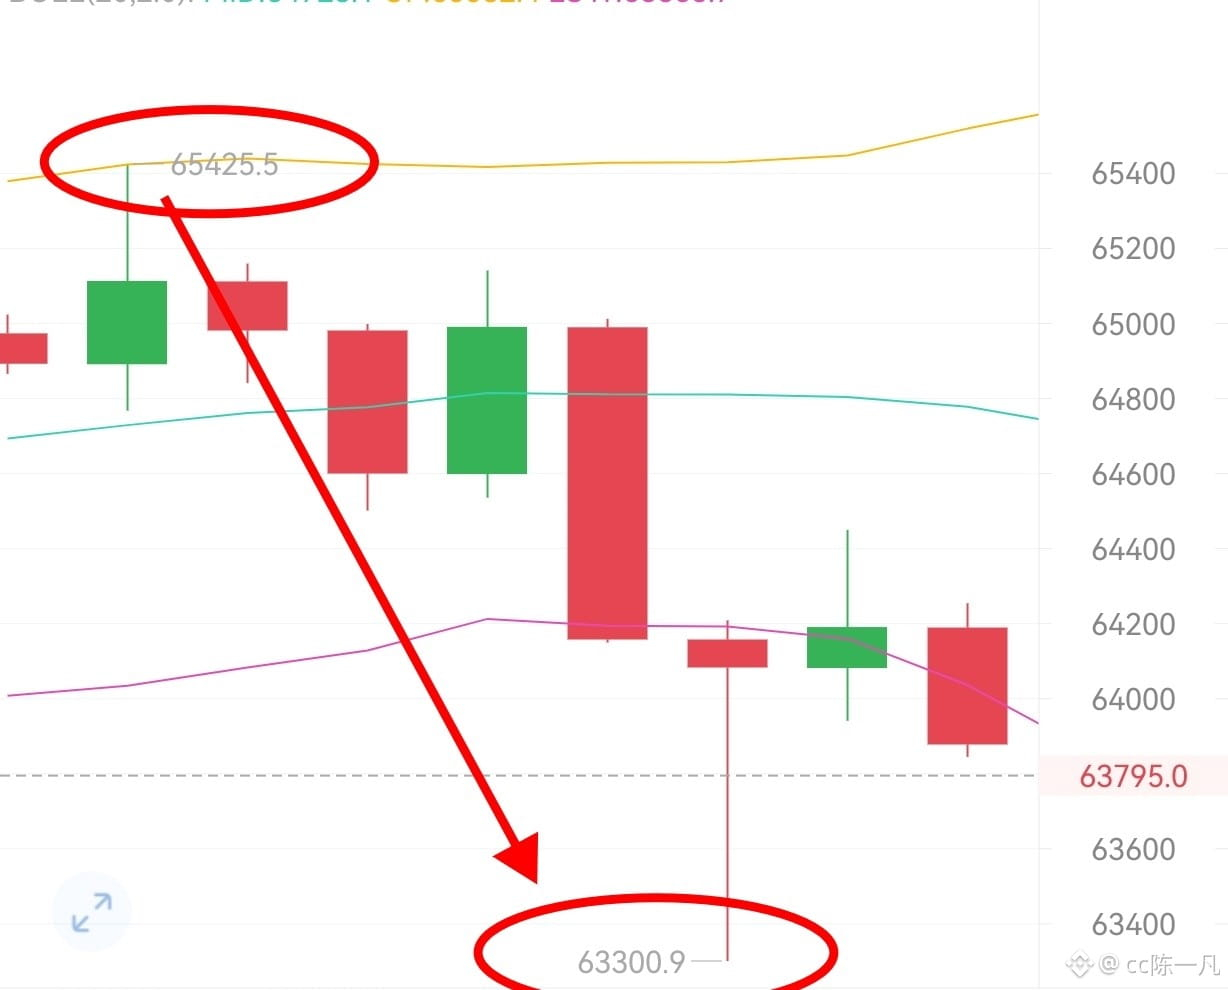
The technical breakdown is confirmed. Bitcoin has fallen below the lower Bollinger Band and is trading beneath the 200-day moving average, turning the medium-term trend bearish. Although the MACD histogram is showing signs of shrinking green bars, this recovery below the zero line is more likely a temporary pause in bearish momentum than a trend reversal. $62,000 is a key near-term support level; if it fails, the psychological $60,000 level will be directly in sight. Until ETF outflows stabilize and whales switch to net withdrawals, a rebound is more likely to offer an opportunity to short at higher prices than to signal a bottom.#BTC #ETH #BTC走势分析
Yifan has had everyone enjoying shorting these past few days, right? The 65,000–65,800 range has been a great place to short every day.
At the macro level, rising rate-hike expectations are directly weighing on risk assets. U.S. October PPI rose 6.5% year over year, its highest level in nearly four years, while CPI also came in above expectations. Markets have nearly priced in a December Fed rate hike. Deutsche Bank even expects the Fed to raise rates at each of its next three meetings. The 10-year Treasury yield has climbed back above 5%, significantly increasing the opportunity cost of holding a zero-yield asset like Bitcoin.
On the fund-flow front, institutions are withdrawing systematically. U.S. spot Bitcoin ETFs have seen net outflows for several consecutive days, with cumulative outflows of about $2.1 billion in November, officially turning net inflows for the year negative. BlackRock’s IBIT, a bellwether product, accounted for about 85% of the entire market’s outflows in a single week, showing that even major institutional allocators are pulling back. On-chain data confirms the trend: whales are depositing about $55 million more worth of BTC into exchanges each day than they are withdrawing, and selling pressure from large holders continues to build.
The technical breakdown is confirmed. Bitcoin has fallen below the lower Bollinger Band and is trading beneath the 200-day moving average, turning the medium-term trend bearish. Although the MACD histogram is showing signs of shrinking green bars, this recovery below the zero line is more likely a temporary pause in bearish momentum than a trend reversal. $62,000 is a key near-term support level; if it fails, the psychological $60,000 level will be directly in sight. Until ETF outflows stabilize and whales switch to net withdrawals, a rebound is more likely to offer an opportunity to short at higher prices than to signal a bottom.#BTC #ETH #BTC走势分析
723
·
--
Bearish
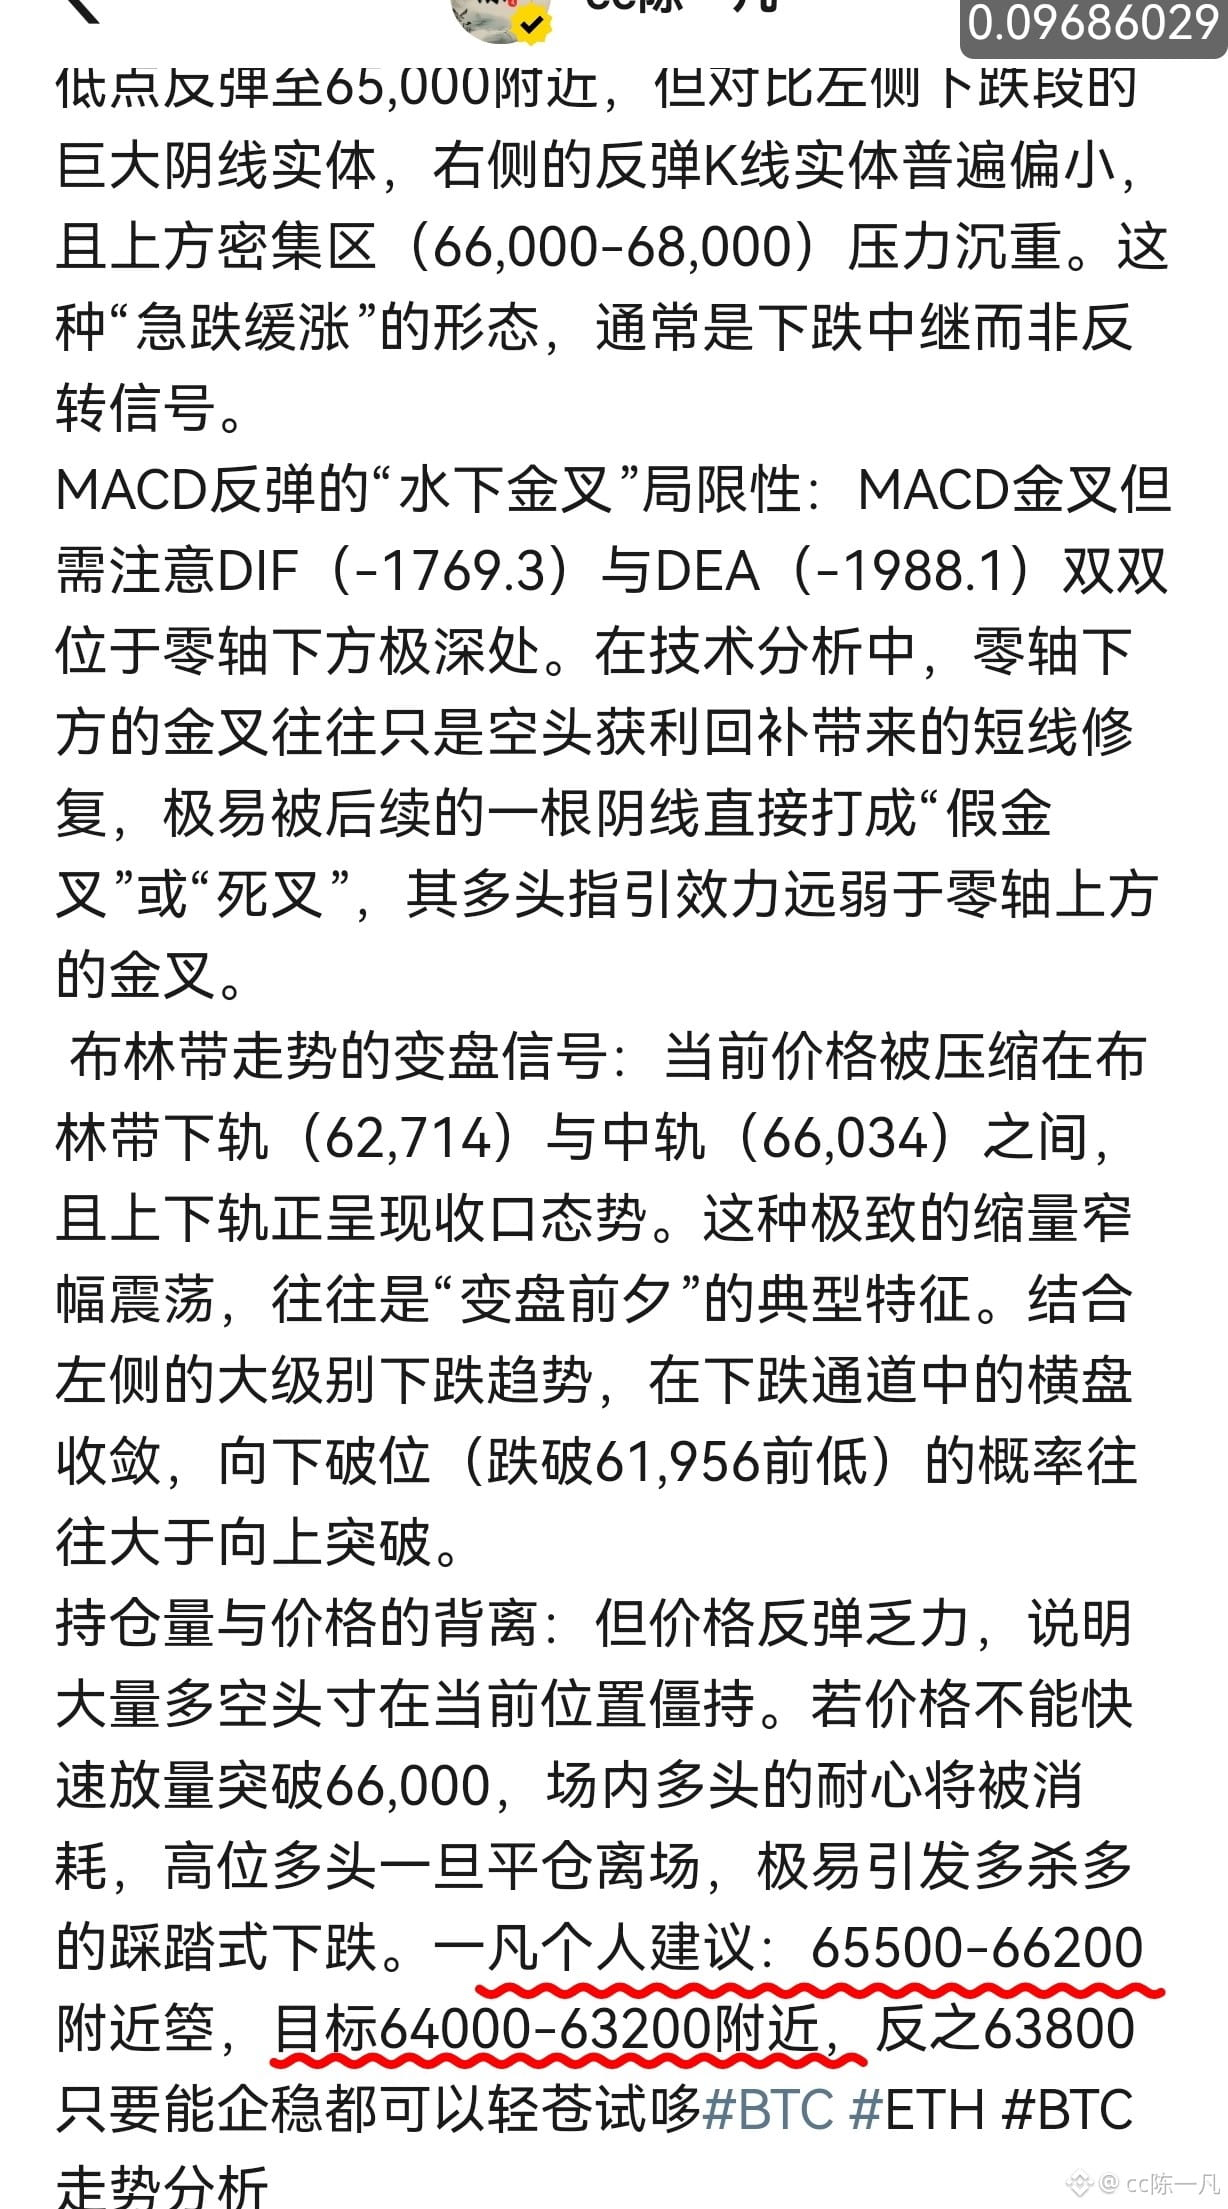
11.16 Evening Analysis $BTC
Following the strategy over the past few days, everyone has captured quite a bit of downside, right?
Weak-volume rebound casts doubt on bullish momentum: Although the price rebounded from a low of 61,956 to around 65,000, the rebound candlesticks on the right are generally much smaller than the large bearish candles in the preceding decline. There is also heavy resistance in the dense zone above (66,000–68,000). This pattern of “sharp drops and gradual rises” is usually a continuation of the downtrend rather than a reversal signal.
Limitations of the MACD rebound’s “bullish cross below the zero line”: Although the MACD has formed a bullish crossover, note that both DIF (-1769.3) and DEA (-1988.1) are far below the zero line. In technical analysis, a bullish crossover below zero is often just a short-term recovery driven by short sellers taking profits. It can easily be turned into a “false bullish cross” or a “bearish cross” by a subsequent bearish candle, so its bullish signal is much weaker than that of a crossover above zero.
Bollinger Bands signal a potential trend change: The current price is compressed between the lower Bollinger Band (62,714) and the middle band (66,034), while the upper and lower bands are narrowing. Such extremely low-volume, narrow-range consolidation is often a typical feature of an imminent trend change. Given the larger downtrend on the left, sideways convergence within a descending channel is more likely to break downward (below the previous low of 61,956) than upward.
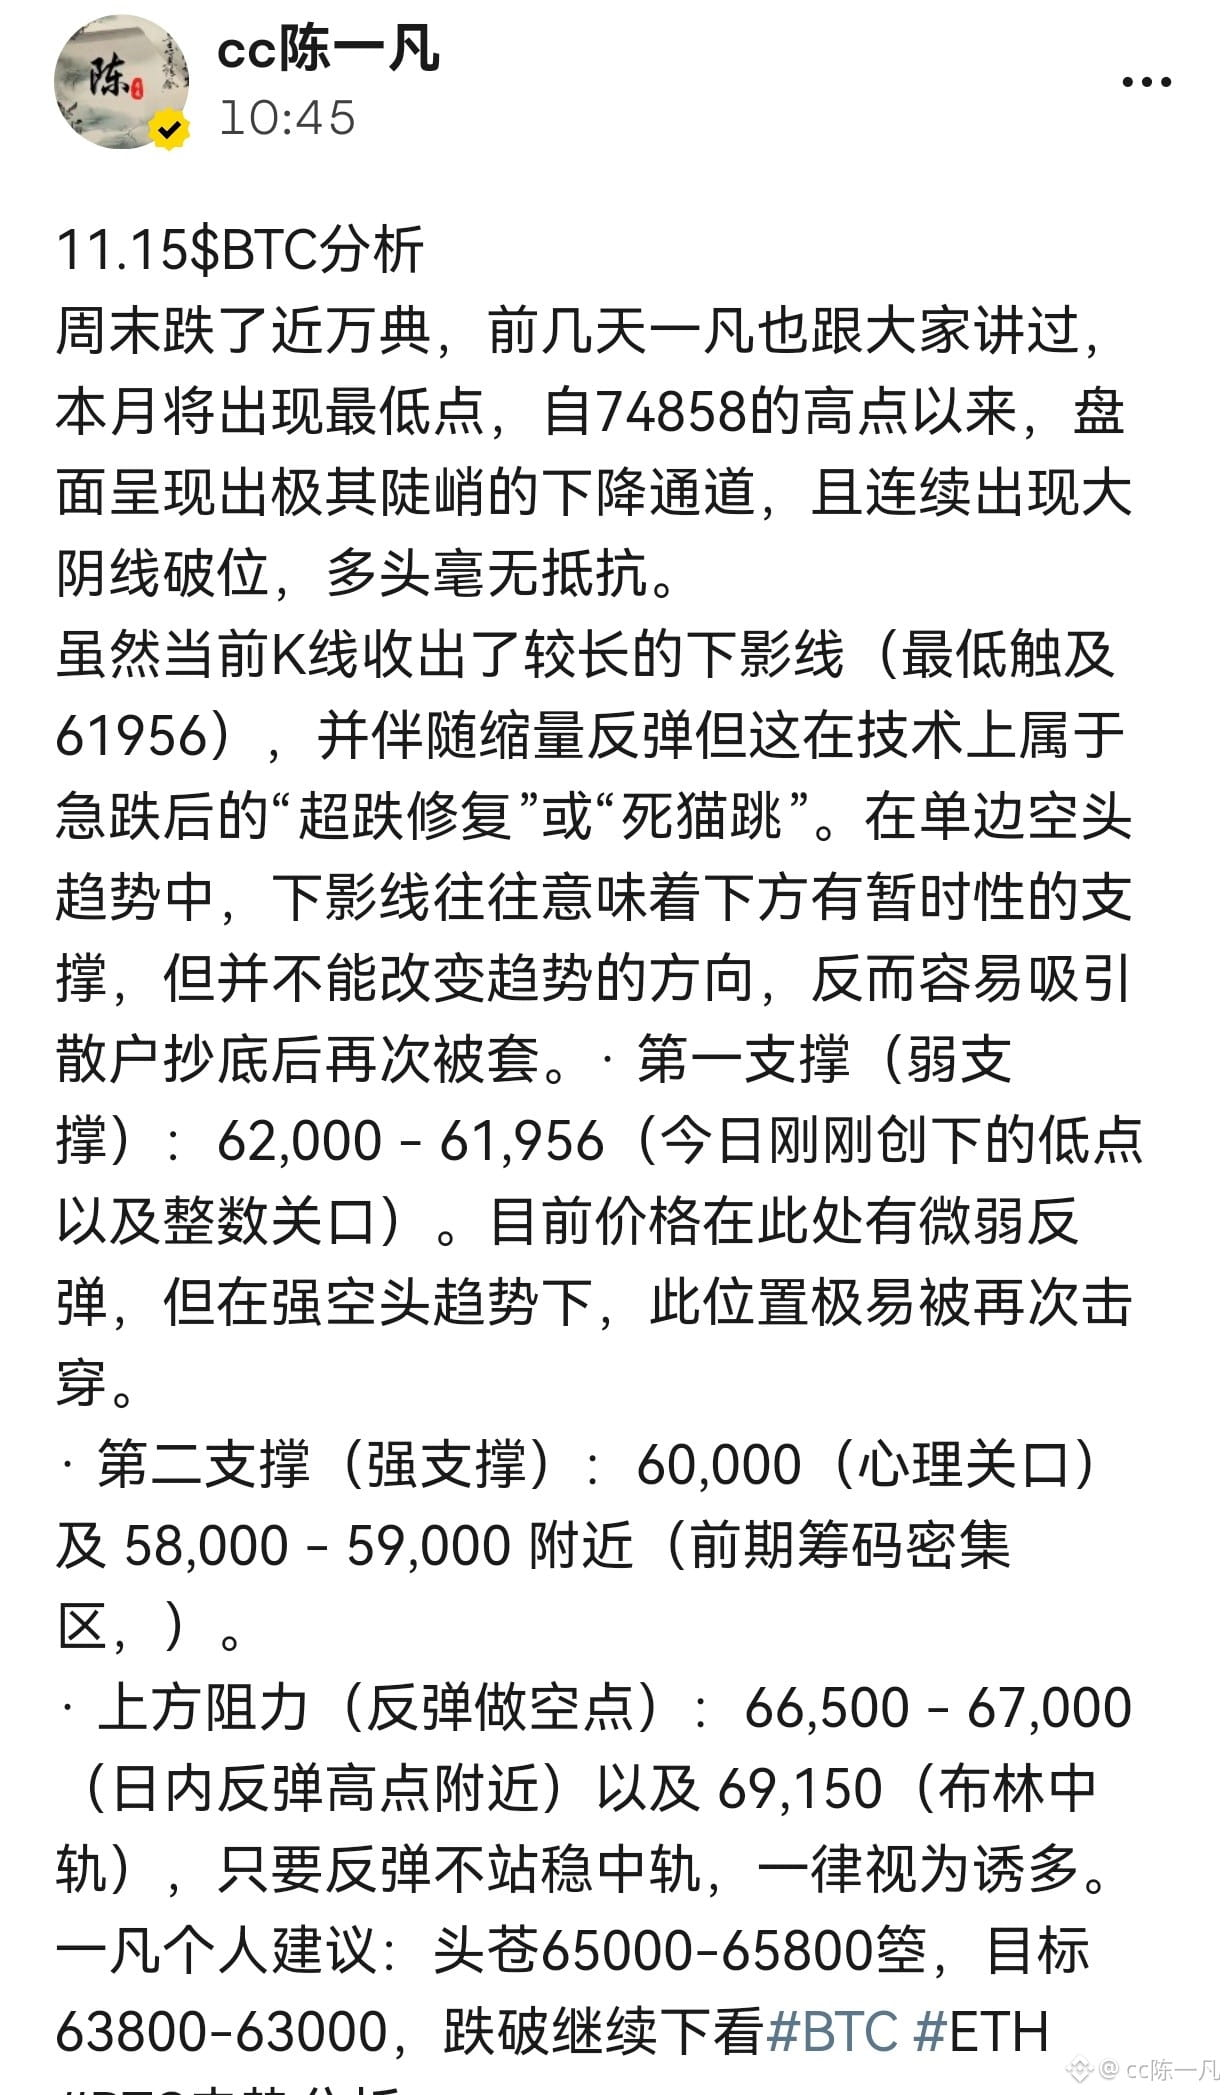
Divergence between open interest and price: The rebound is weak, indicating that a large number of long and short positions are locked in a stalemate at the current level. If the price cannot quickly break above 66,000 on rising volume, the longs in the market will lose patience. If longs who entered at higher levels close their positions, this could easily trigger a cascading sell-off as longs rush to exit. My personal suggestion: short around 65,500–66,200, targeting around 64,000–63,200. Conversely, as long as 63,800 holds, you can try a small long position. #BTC #ETH #BTC走势分析
11.16 Evening Analysis $BTC
Following the strategy over the past few days, everyone has captured quite a bit of downside, right?
Weak-volume rebound casts doubt on bullish momentum: Although the price rebounded from a low of 61,956 to around 65,000, the rebound candlesticks on the right are generally much smaller than the large bearish candles in the preceding decline. There is also heavy resistance in the dense zone above (66,000–68,000). This pattern of “sharp drops and gradual rises” is usually a continuation of the downtrend rather than a reversal signal.
Limitations of the MACD rebound’s “bullish cross below the zero line”: Although the MACD has formed a bullish crossover, note that both DIF (-1769.3) and DEA (-1988.1) are far below the zero line. In technical analysis, a bullish crossover below zero is often just a short-term recovery driven by short sellers taking profits. It can easily be turned into a “false bullish cross” or a “bearish cross” by a subsequent bearish candle, so its bullish signal is much weaker than that of a crossover above zero.
Bollinger Bands signal a potential trend change: The current price is compressed between the lower Bollinger Band (62,714) and the middle band (66,034), while the upper and lower bands are narrowing. Such extremely low-volume, narrow-range consolidation is often a typical feature of an imminent trend change. Given the larger downtrend on the left, sideways convergence within a descending channel is more likely to break downward (below the previous low of 61,956) than upward.
Divergence between open interest and price: The rebound is weak, indicating that a large number of long and short positions are locked in a stalemate at the current level. If the price cannot quickly break above 66,000 on rising volume, the longs in the market will lose patience. If longs who entered at higher levels close their positions, this could easily trigger a cascading sell-off as longs rush to exit. My personal suggestion: short around 65,500–66,200, targeting around 64,000–63,200. Conversely, as long as 63,800 holds, you can try a small long position. #BTC #ETH #BTC走势分析
Following the strategy over the past few days, everyone has captured quite a bit of downside, right?
Weak-volume rebound casts doubt on bullish momentum: Although the price rebounded from a low of 61,956 to around 65,000, the rebound candlesticks on the right are generally much smaller than the large bearish candles in the preceding decline. There is also heavy resistance in the dense zone above (66,000–68,000). This pattern of “sharp drops and gradual rises” is usually a continuation of the downtrend rather than a reversal signal.
Limitations of the MACD rebound’s “bullish cross below the zero line”: Although the MACD has formed a bullish crossover, note that both DIF (-1769.3) and DEA (-1988.1) are far below the zero line. In technical analysis, a bullish crossover below zero is often just a short-term recovery driven by short sellers taking profits. It can easily be turned into a “false bullish cross” or a “bearish cross” by a subsequent bearish candle, so its bullish signal is much weaker than that of a crossover above zero.
Bollinger Bands signal a potential trend change: The current price is compressed between the lower Bollinger Band (62,714) and the middle band (66,034), while the upper and lower bands are narrowing. Such extremely low-volume, narrow-range consolidation is often a typical feature of an imminent trend change. Given the larger downtrend on the left, sideways convergence within a descending channel is more likely to break downward (below the previous low of 61,956) than upward.
Divergence between open interest and price: The rebound is weak, indicating that a large number of long and short positions are locked in a stalemate at the current level. If the price cannot quickly break above 66,000 on rising volume, the longs in the market will lose patience. If longs who entered at higher levels close their positions, this could easily trigger a cascading sell-off as longs rush to exit. My personal suggestion: short around 65,500–66,200, targeting around 64,000–63,200. Conversely, as long as 63,800 holds, you can try a small long position. #BTC #ETH #BTC走势分析

573
·
--
Bearish
Verified
11.16$BTC Early Morning Analysis
Bitcoin is caught in a double bind of macroeconomic headwinds and persistent capital outflows. The rebound on the 4-hour timeframe lacks staying power, and the bearish trend is clear.
News: Macro and capital-flow pressures are reinforcing each other
Several Federal Reserve officials have recently stated clearly that inflation is still moving in the wrong direction, raising expectations of a December rate hike. The 10-year US Treasury yield has climbed above 5%, increasing the opportunity cost of holding non-yielding assets such as Bitcoin. Meanwhile, US spot Bitcoin ETFs have seen nearly $3 billion in net outflows since the end of October, with BlackRock's IBIT facing redemptions for multiple consecutive days. Institutional capital is turning from a source of inflows into a source of selling pressure. Within the industry, the aftershocks of the earlier $6.3 billion theft at Binance continue to erode confidence in the security of trading platforms, while Anthropic's upcoming IPO is also diverting speculative capital.
Technical analysis: Weak rebound, bearish structure unchanged
On the 4-hour chart, the price continues to trade below the Bollinger Bands' middle line (67,405), with the bands opening downward and the moving averages aligned bearishly. Although the MACD histogram bars are shortening below the zero line, both DIF and DEA remain deep in negative territory. This is a weak corrective bounce within a downtrend, not a trend-reversal signal. The 67,800–68,000 area (near the 200-week moving average) has turned from support into resistance, and recent rebounds have failed to reach it effectively. Open interest is also declining, indicating that bulls are exiting rather than building strength for an upward push.
Conclusion: Expectations of tighter macroeconomic policy and ETF outflows are creating sustained pressure. Technical rebound momentum is fading, and the bearish trend continues. Watch the previous low and support at 61,956; a break below it could open the way to further downside. #BTC #ETH #加密市场大幅回调,多名巨鲸遭遇清算
11.16$BTC Early Morning Analysis
Bitcoin is caught in a double bind of macroeconomic headwinds and persistent capital outflows. The rebound on the 4-hour timeframe lacks staying power, and the bearish trend is clear.
News: Macro and capital-flow pressures are reinforcing each other
Several Federal Reserve officials have recently stated clearly that inflation is still moving in the wrong direction, raising expectations of a December rate hike. The 10-year US Treasury yield has climbed above 5%, increasing the opportunity cost of holding non-yielding assets such as Bitcoin. Meanwhile, US spot Bitcoin ETFs have seen nearly $3 billion in net outflows since the end of October, with BlackRock's IBIT facing redemptions for multiple consecutive days. Institutional capital is turning from a source of inflows into a source of selling pressure. Within the industry, the aftershocks of the earlier $6.3 billion theft at Binance continue to erode confidence in the security of trading platforms, while Anthropic's upcoming IPO is also diverting speculative capital.
Technical analysis: Weak rebound, bearish structure unchanged
On the 4-hour chart, the price continues to trade below the Bollinger Bands' middle line (67,405), with the bands opening downward and the moving averages aligned bearishly. Although the MACD histogram bars are shortening below the zero line, both DIF and DEA remain deep in negative territory. This is a weak corrective bounce within a downtrend, not a trend-reversal signal. The 67,800–68,000 area (near the 200-week moving average) has turned from support into resistance, and recent rebounds have failed to reach it effectively. Open interest is also declining, indicating that bulls are exiting rather than building strength for an upward push.
Conclusion: Expectations of tighter macroeconomic policy and ETF outflows are creating sustained pressure. Technical rebound momentum is fading, and the bearish trend continues. Watch the previous low and support at 61,956; a break below it could open the way to further downside. #BTC #ETH #加密市场大幅回调,多名巨鲸遭遇清算
Bitcoin is caught in a double bind of macroeconomic headwinds and persistent capital outflows. The rebound on the 4-hour timeframe lacks staying power, and the bearish trend is clear.
News: Macro and capital-flow pressures are reinforcing each other
Several Federal Reserve officials have recently stated clearly that inflation is still moving in the wrong direction, raising expectations of a December rate hike. The 10-year US Treasury yield has climbed above 5%, increasing the opportunity cost of holding non-yielding assets such as Bitcoin. Meanwhile, US spot Bitcoin ETFs have seen nearly $3 billion in net outflows since the end of October, with BlackRock's IBIT facing redemptions for multiple consecutive days. Institutional capital is turning from a source of inflows into a source of selling pressure. Within the industry, the aftershocks of the earlier $6.3 billion theft at Binance continue to erode confidence in the security of trading platforms, while Anthropic's upcoming IPO is also diverting speculative capital.
Technical analysis: Weak rebound, bearish structure unchanged
On the 4-hour chart, the price continues to trade below the Bollinger Bands' middle line (67,405), with the bands opening downward and the moving averages aligned bearishly. Although the MACD histogram bars are shortening below the zero line, both DIF and DEA remain deep in negative territory. This is a weak corrective bounce within a downtrend, not a trend-reversal signal. The 67,800–68,000 area (near the 200-week moving average) has turned from support into resistance, and recent rebounds have failed to reach it effectively. Open interest is also declining, indicating that bulls are exiting rather than building strength for an upward push.
Conclusion: Expectations of tighter macroeconomic policy and ETF outflows are creating sustained pressure. Technical rebound momentum is fading, and the bearish trend continues. Watch the previous low and support at 61,956; a break below it could open the way to further downside. #BTC #ETH #加密市场大幅回调,多名巨鲸遭遇清算

612
·
--
Evening analysis for Nov 15 $BTC
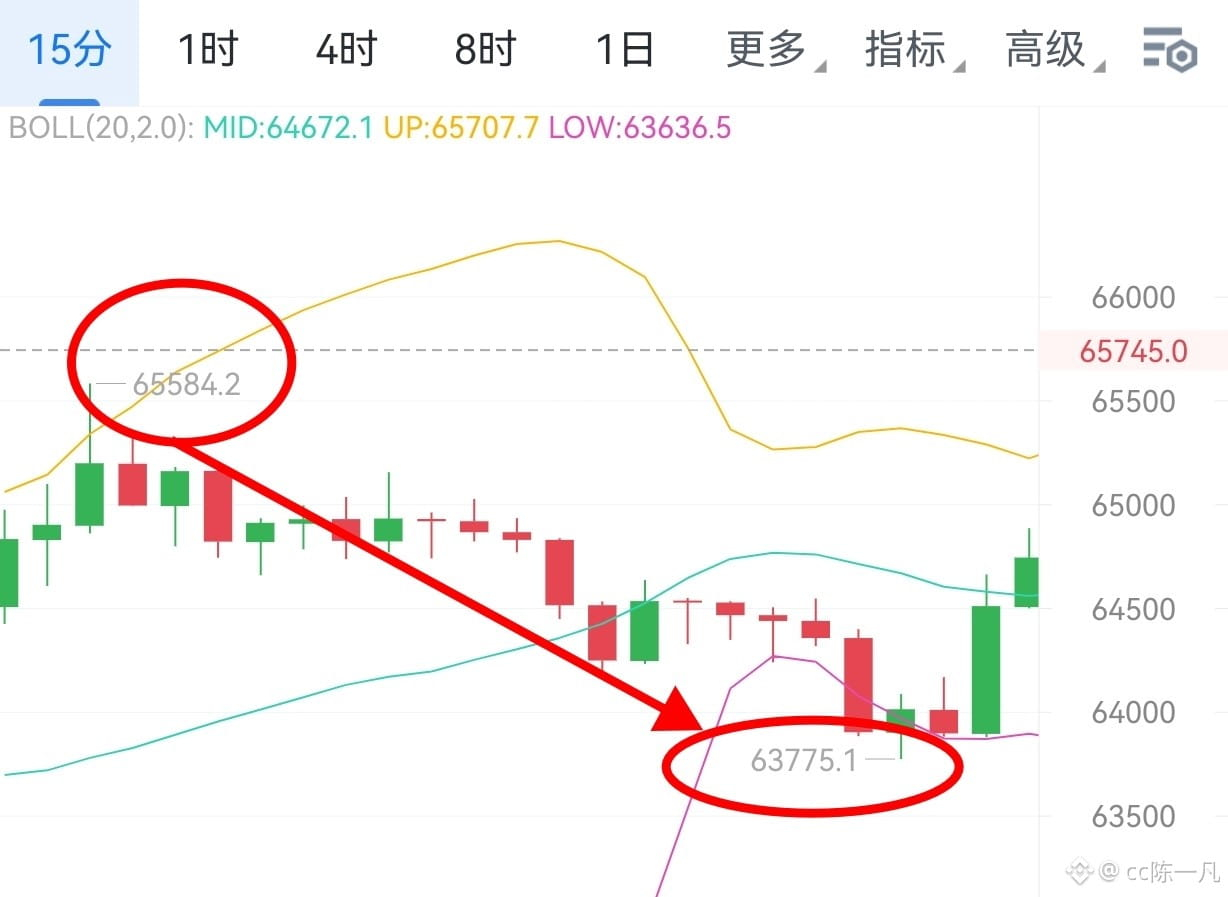
Hope everyone made a profit from the short trade at 65,000–65,500 that I recommended this morning. MACD is currently below the zero line, with both DIF (-2305.7) and DEA (-2108.7) in negative territory.
· Although both the fast and slow lines are generally trending downward, the MACD green bars (bearish momentum) are gradually shortening. This is usually seen as a sign that bearish momentum is weakening, with a potential need for stabilization or a rebound.
My personal recommendation:
In the short term, Bitcoin has staged a weak rebound after its rapid drop from 74,000 to 62,000, finding support at the bottom (62,000). However, as the broader trend remains downward and MACD is still below the zero line overall, this rebound should for now be viewed only as a technical recovery after being oversold.
· Resistance above: The Bollinger Band middle line (around 68,300) and the previous high-volume trading zone.
· Support below: Near the recent low of 62,000 #BTC #ETH #BTC走势分析
Evening analysis for Nov 15 $BTC
Hope everyone made a profit from the short trade at 65,000–65,500 that I recommended this morning. MACD is currently below the zero line, with both DIF (-2305.7) and DEA (-2108.7) in negative territory.
· Although both the fast and slow lines are generally trending downward, the MACD green bars (bearish momentum) are gradually shortening. This is usually seen as a sign that bearish momentum is weakening, with a potential need for stabilization or a rebound.
My personal recommendation:
In the short term, Bitcoin has staged a weak rebound after its rapid drop from 74,000 to 62,000, finding support at the bottom (62,000). However, as the broader trend remains downward and MACD is still below the zero line overall, this rebound should for now be viewed only as a technical recovery after being oversold.
· Resistance above: The Bollinger Band middle line (around 68,300) and the previous high-volume trading zone.
· Support below: Near the recent low of 62,000 #BTC #ETH #BTC走势分析
Hope everyone made a profit from the short trade at 65,000–65,500 that I recommended this morning. MACD is currently below the zero line, with both DIF (-2305.7) and DEA (-2108.7) in negative territory.
· Although both the fast and slow lines are generally trending downward, the MACD green bars (bearish momentum) are gradually shortening. This is usually seen as a sign that bearish momentum is weakening, with a potential need for stabilization or a rebound.
My personal recommendation:
In the short term, Bitcoin has staged a weak rebound after its rapid drop from 74,000 to 62,000, finding support at the bottom (62,000). However, as the broader trend remains downward and MACD is still below the zero line overall, this rebound should for now be viewed only as a technical recovery after being oversold.
· Resistance above: The Bollinger Band middle line (around 68,300) and the previous high-volume trading zone.
· Support below: Near the recent low of 62,000 #BTC #ETH #BTC走势分析
3
715
·
--
Bearish
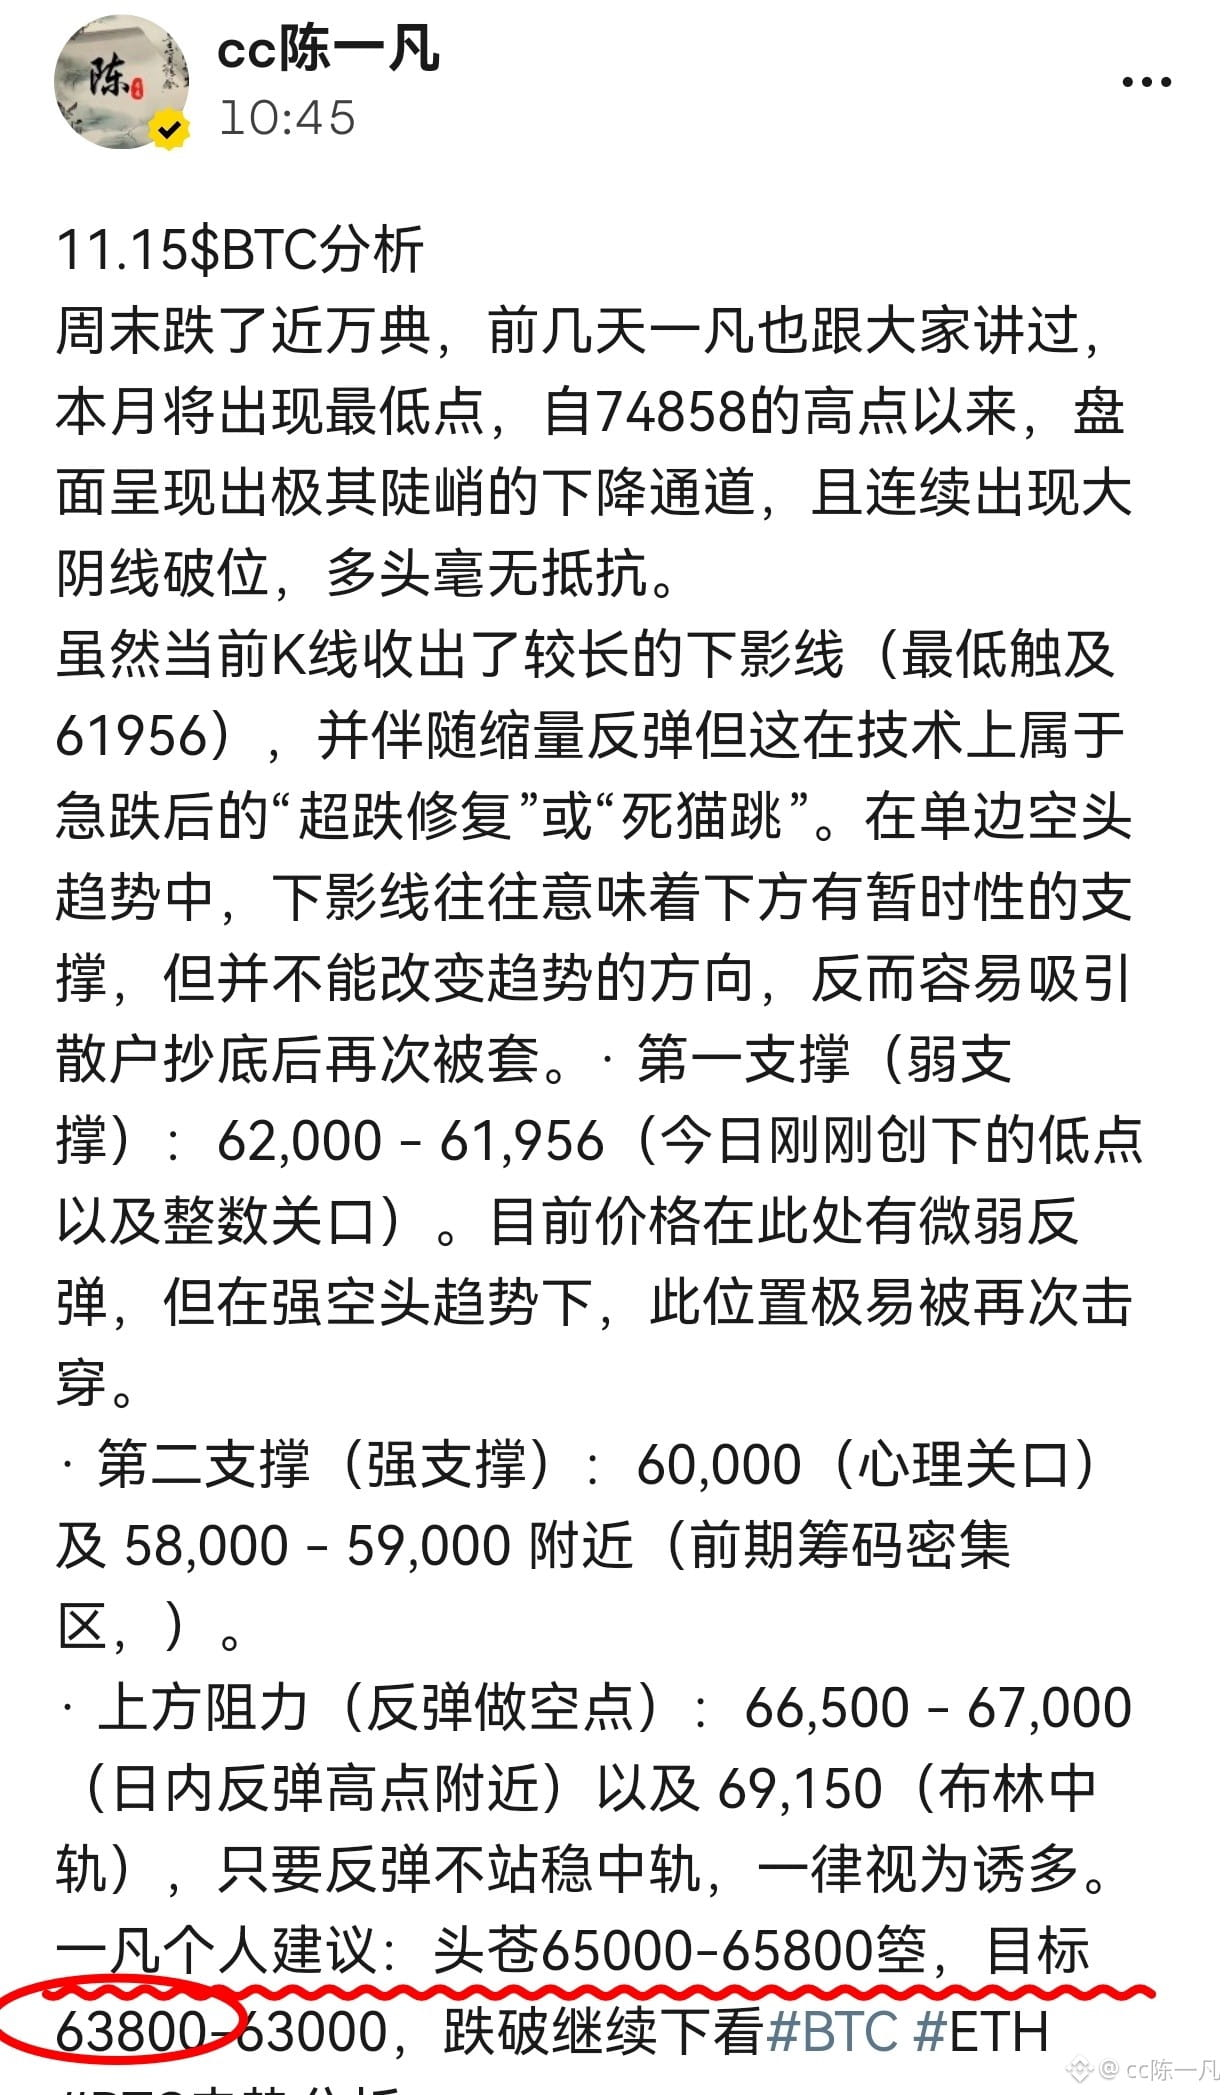
11.15 $BTC Analysis
It fell nearly 10,000 points over the weekend. Yifan also told everyone a few days ago that the monthly low would occur this month. Since the high of 74,858, the market has formed an extremely steep descending channel, with repeated large bearish candles breaking down. The bulls have put up no resistance.
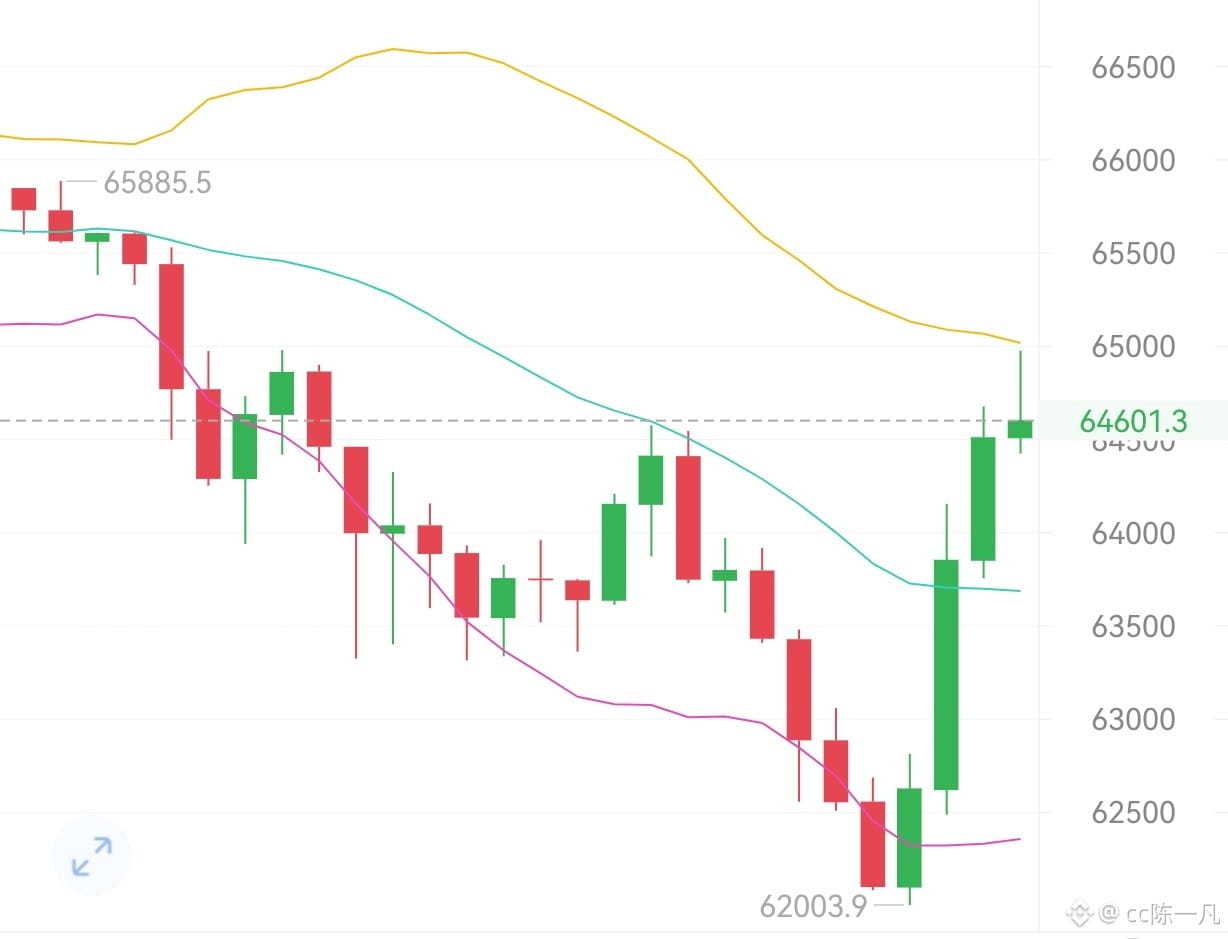
Although the current candlestick has a relatively long lower wick (with a low of 61,956) and has bounced on declining volume, technically this is an “oversold recovery” or a “dead-cat bounce” after a sharp drop. In a one-way bearish trend, a lower wick often means there is temporary support below, but it cannot change the trend’s direction. Instead, it can easily lure retail traders into buying the dip, only for them to get trapped again.
· First support (weak): 62,000–61,956 (today’s new low and the round-number level). The price is seeing a slight bounce here, but in a strong bearish trend, this level could easily be broken again.
· Second support (strong): 60,000 (a psychological level) and around 58,000–59,000 (a previous high-volume trading zone).
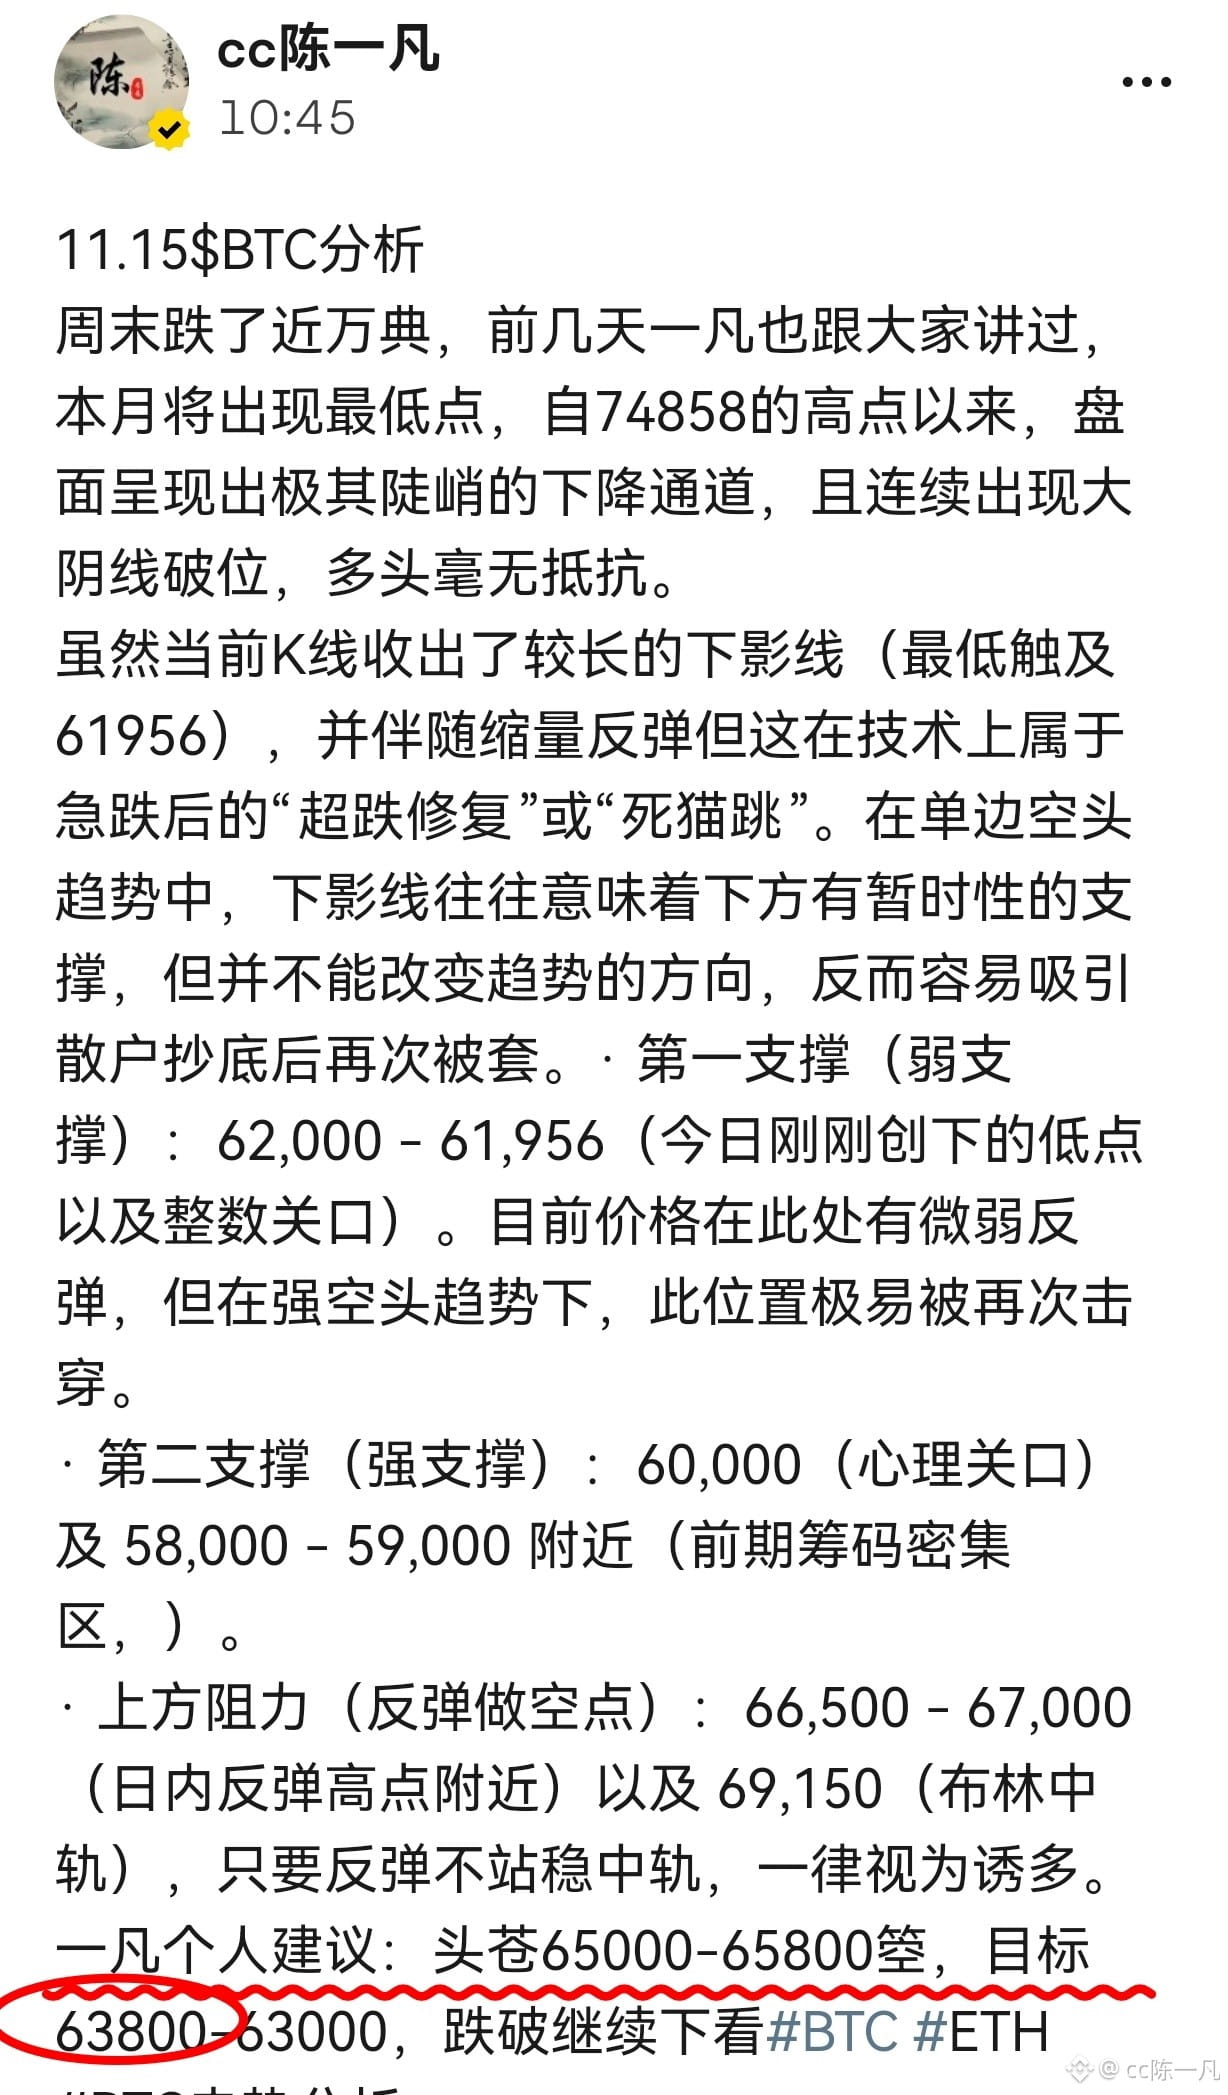
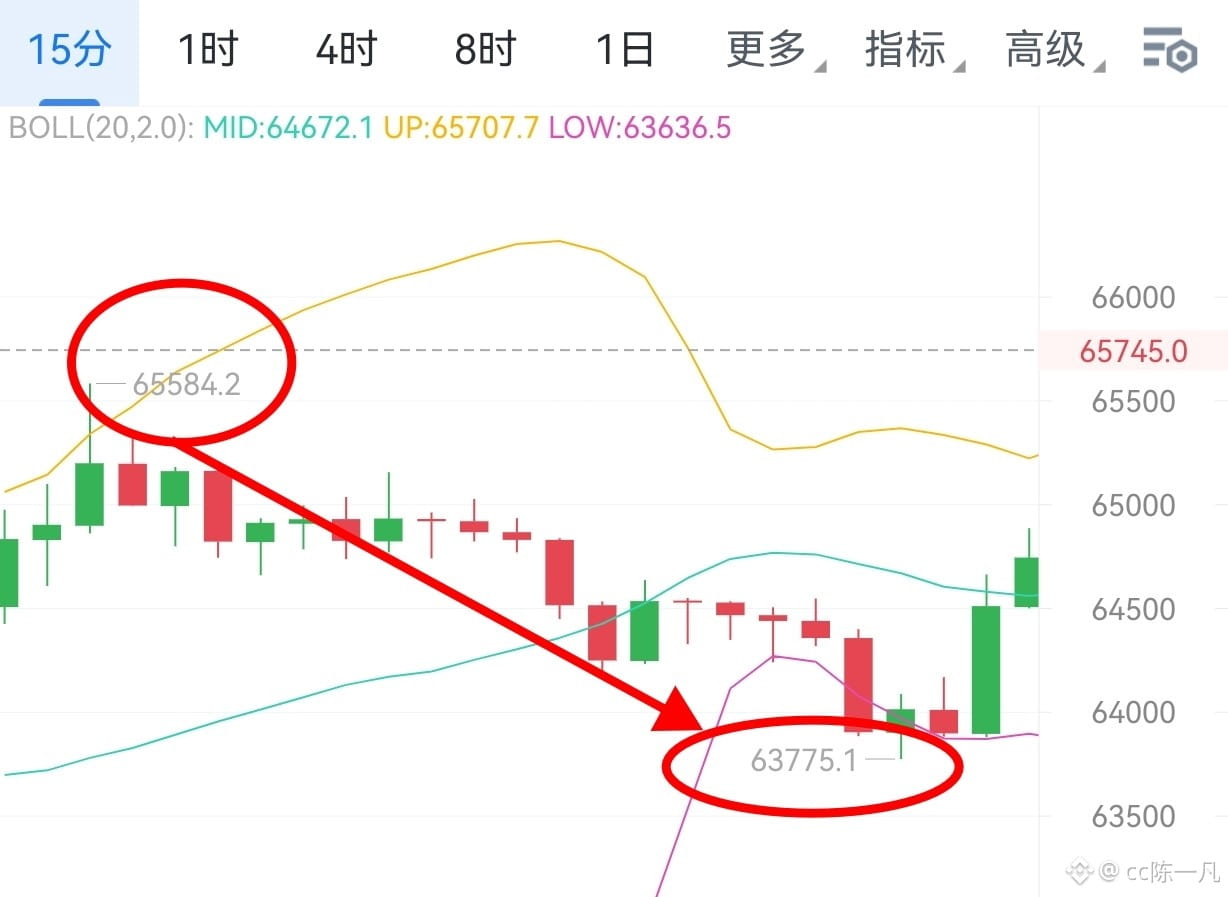
· Resistance above (potential shorting zone on a rebound): 66,500–67,000 (near the intraday rebound high) and 69,150 (the Bollinger middle band). As long as the rebound fails to hold above the middle band, treat it as a bull trap. Yifan’s personal suggestion: open a short at 65,000–65,800, with targets at 63,800–63,000; if it breaks below, look lower to #BTC #ETH #BTC走势分析
11.15 $BTC Analysis
It fell nearly 10,000 points over the weekend. Yifan also told everyone a few days ago that the monthly low would occur this month. Since the high of 74,858, the market has formed an extremely steep descending channel, with repeated large bearish candles breaking down. The bulls have put up no resistance.
Although the current candlestick has a relatively long lower wick (with a low of 61,956) and has bounced on declining volume, technically this is an “oversold recovery” or a “dead-cat bounce” after a sharp drop. In a one-way bearish trend, a lower wick often means there is temporary support below, but it cannot change the trend’s direction. Instead, it can easily lure retail traders into buying the dip, only for them to get trapped again.
· First support (weak): 62,000–61,956 (today’s new low and the round-number level). The price is seeing a slight bounce here, but in a strong bearish trend, this level could easily be broken again.
· Second support (strong): 60,000 (a psychological level) and around 58,000–59,000 (a previous high-volume trading zone).
· Resistance above (potential shorting zone on a rebound): 66,500–67,000 (near the intraday rebound high) and 69,150 (the Bollinger middle band). As long as the rebound fails to hold above the middle band, treat it as a bull trap. Yifan’s personal suggestion: open a short at 65,000–65,800, with targets at 63,800–63,000; if it breaks below, look lower to #BTC #ETH #BTC走势分析
It fell nearly 10,000 points over the weekend. Yifan also told everyone a few days ago that the monthly low would occur this month. Since the high of 74,858, the market has formed an extremely steep descending channel, with repeated large bearish candles breaking down. The bulls have put up no resistance.
Although the current candlestick has a relatively long lower wick (with a low of 61,956) and has bounced on declining volume, technically this is an “oversold recovery” or a “dead-cat bounce” after a sharp drop. In a one-way bearish trend, a lower wick often means there is temporary support below, but it cannot change the trend’s direction. Instead, it can easily lure retail traders into buying the dip, only for them to get trapped again.
· First support (weak): 62,000–61,956 (today’s new low and the round-number level). The price is seeing a slight bounce here, but in a strong bearish trend, this level could easily be broken again.
· Second support (strong): 60,000 (a psychological level) and around 58,000–59,000 (a previous high-volume trading zone).
· Resistance above (potential shorting zone on a rebound): 66,500–67,000 (near the intraday rebound high) and 69,150 (the Bollinger middle band). As long as the rebound fails to hold above the middle band, treat it as a bull trap. Yifan’s personal suggestion: open a short at 65,000–65,800, with targets at 63,800–63,000; if it breaks below, look lower to #BTC #ETH #BTC走势分析
2
715
·
--
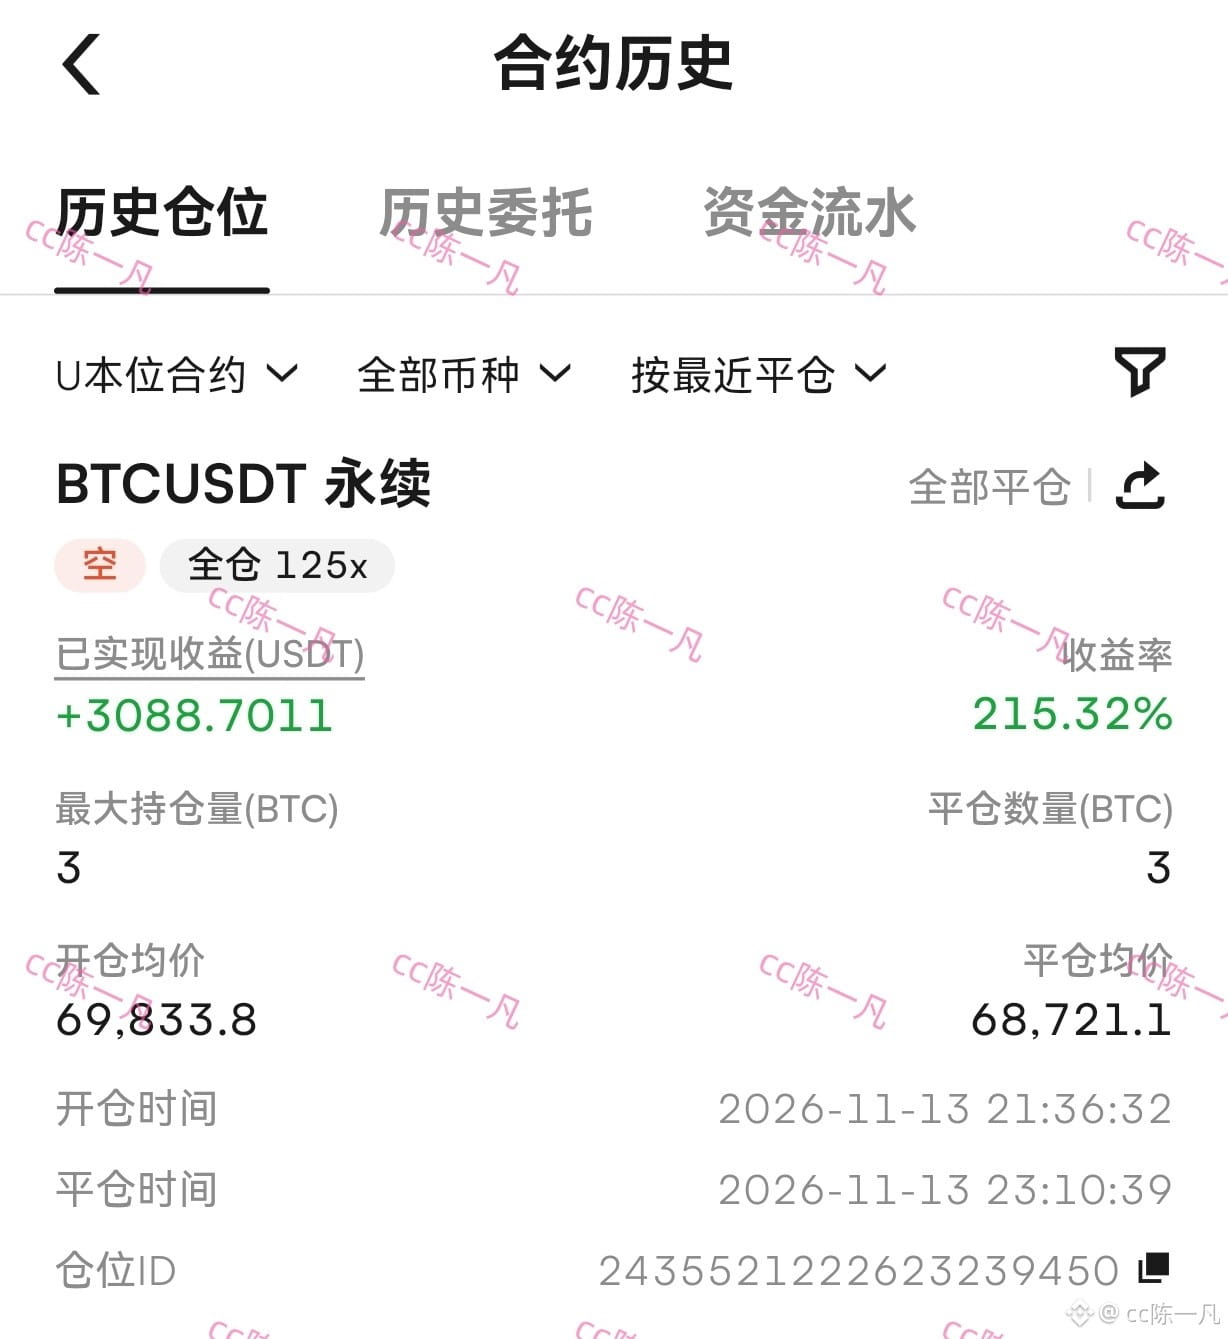
Take it easy, secure your profits, and capture 1,000 points with ease.
The hardest thing in trading isn’t catching every market move—it’s knowing when to stop. There will always be more opportunities, but only realized profits truly belong to you. Don’t let market swings affect your emotions, and don’t gamble on an uncertain final run out of greed. Stick to your rhythm and align your actions with your judgment.
Stay calm and follow your plan strictly. Every gain is the best reward for long-term discipline and patience.#BTC #ETH #BTC走势分析
Take it easy, secure your profits, and capture 1,000 points with ease.
The hardest thing in trading isn’t catching every market move—it’s knowing when to stop. There will always be more opportunities, but only realized profits truly belong to you. Don’t let market swings affect your emotions, and don’t gamble on an uncertain final run out of greed. Stick to your rhythm and align your actions with your judgment.
Stay calm and follow your plan strictly. Every gain is the best reward for long-term discipline and patience.#BTC #ETH #BTC走势分析
The hardest thing in trading isn’t catching every market move—it’s knowing when to stop. There will always be more opportunities, but only realized profits truly belong to you. Don’t let market swings affect your emotions, and don’t gamble on an uncertain final run out of greed. Stick to your rhythm and align your actions with your judgment.
Stay calm and follow your plan strictly. Every gain is the best reward for long-term discipline and patience.#BTC #ETH #BTC走势分析
127
·
--
11/13 $BTC evening analysis
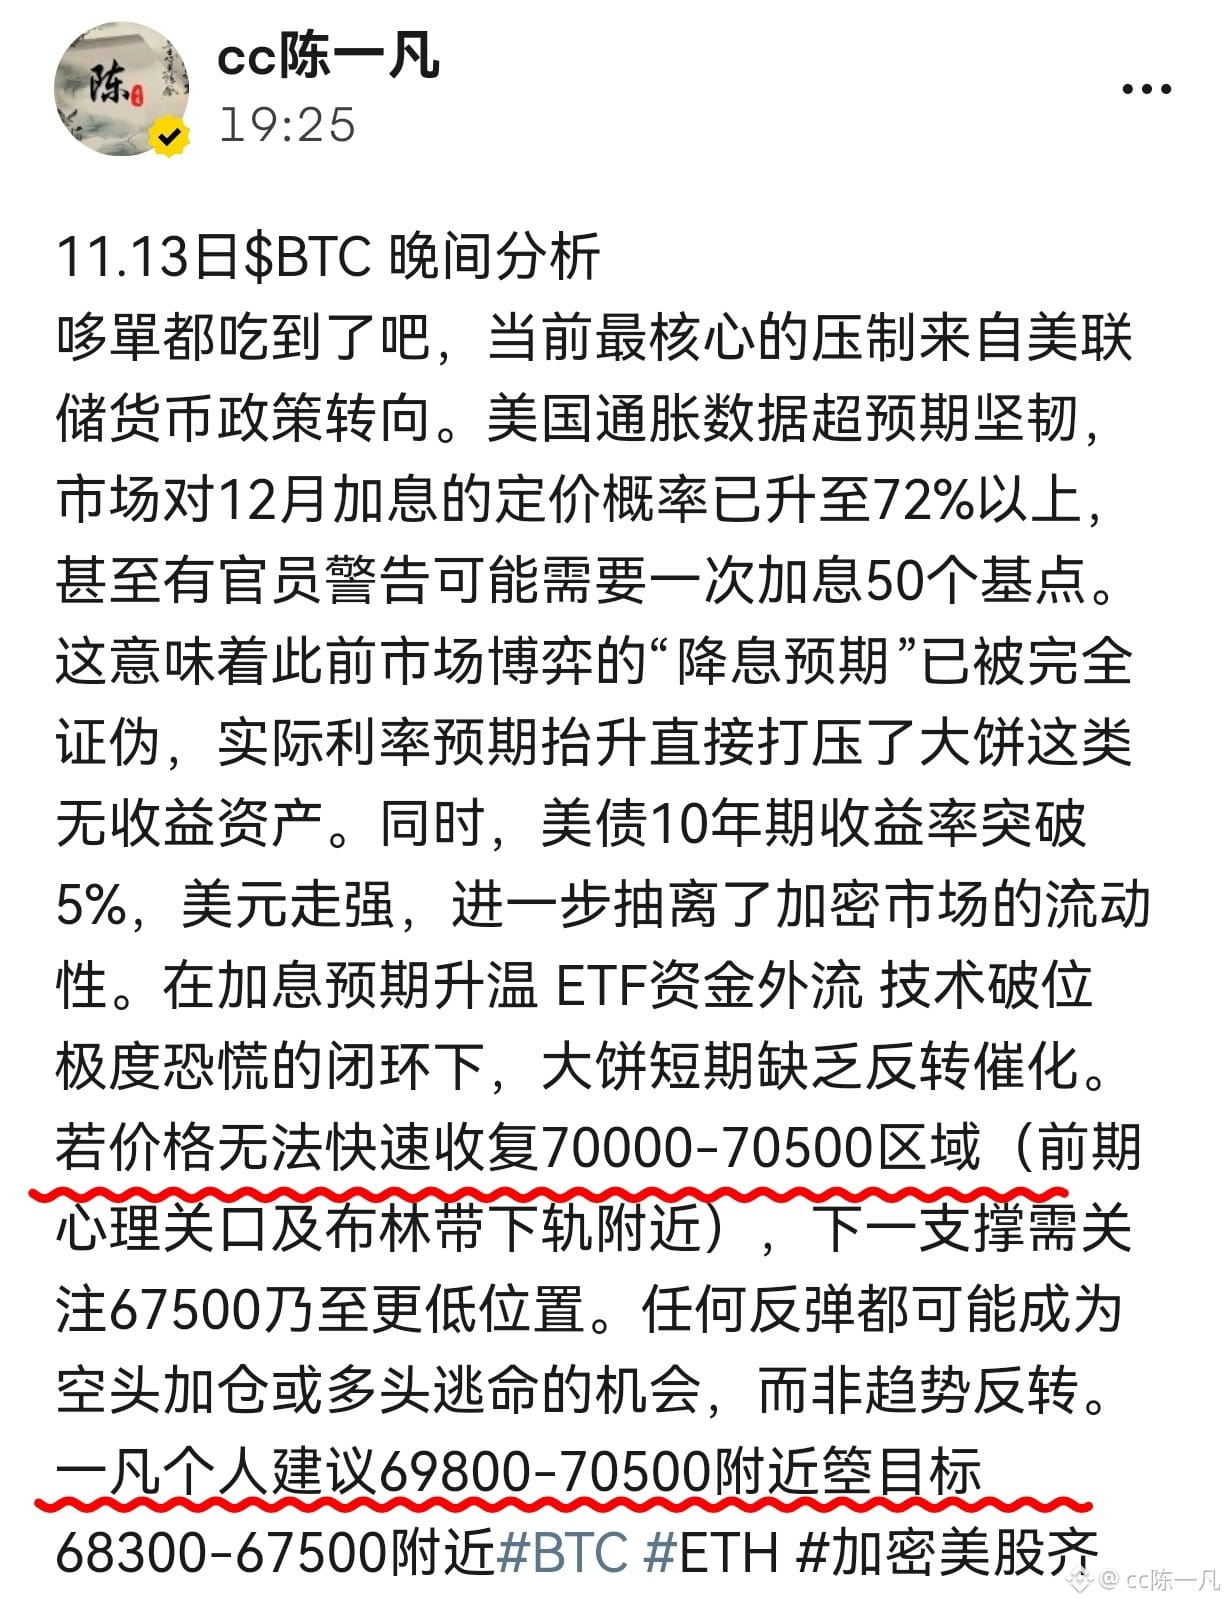
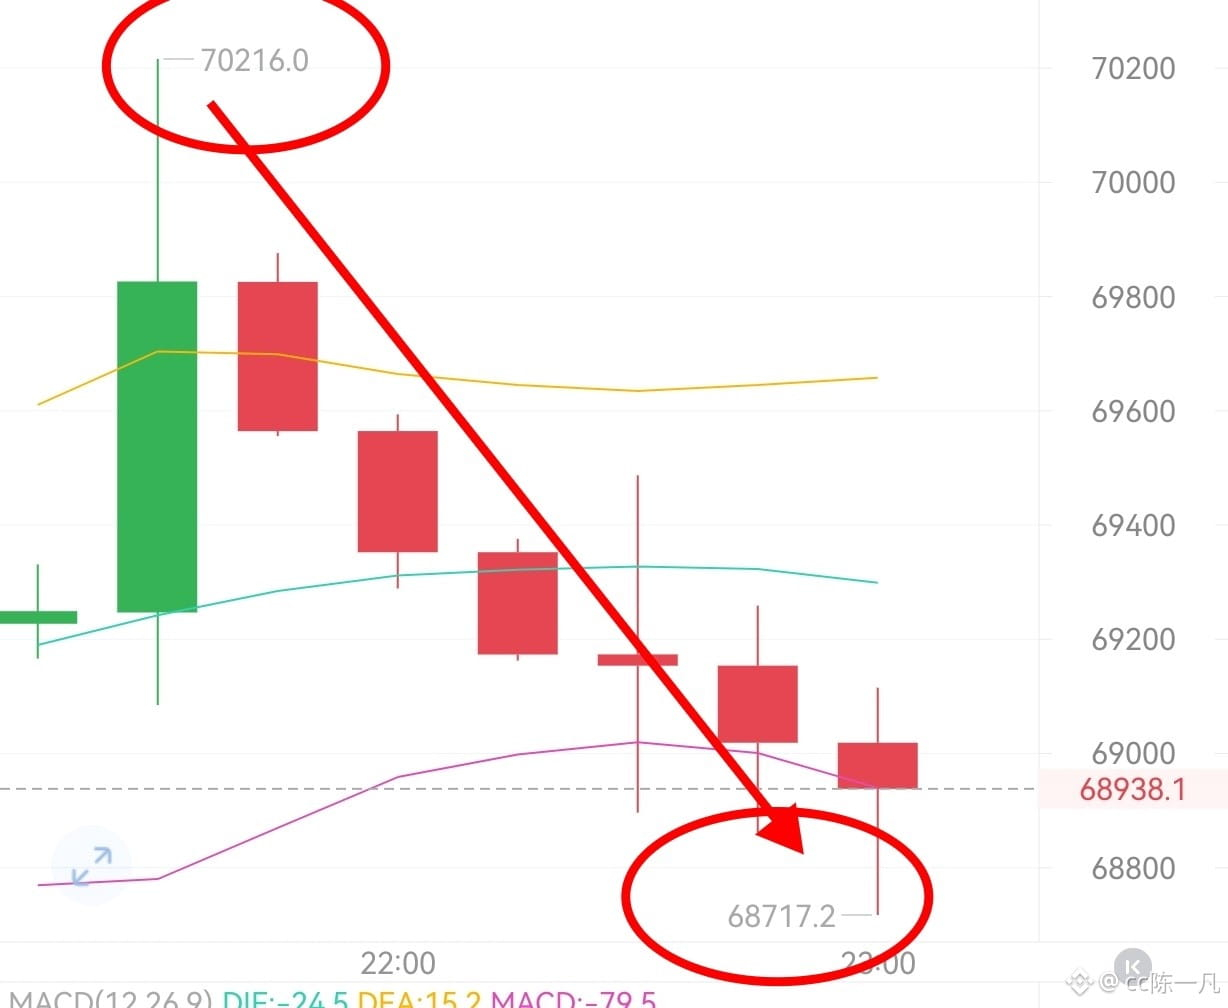
Longs have all been wiped out, right? The main source of pressure right now is the Fed’s shift in monetary policy. U.S. inflation data has proved more stubborn than expected, and the market-implied probability of a rate hike in December has climbed above 72%. Some officials have even warned that a 50-basis-point hike may be needed. This means the market’s earlier bet on rate cuts has been completely disproven. Rising real-rate expectations are directly weighing on non-yielding assets like Bitcoin. At the same time, the 10-year U.S. Treasury yield has broken above 5%, and a stronger dollar is further draining liquidity from the crypto market. With rising rate-hike expectations, ETF outflows, a technical breakdown, and extreme fear all reinforcing one another, Bitcoin lacks a near-term catalyst for a reversal. If the price cannot quickly reclaim the 70000–70500 area (a previous psychological threshold and near the lower Bollinger Band), the next support levels to watch are 67500 and potentially lower. Any bounce could present an opportunity for bears to add to short positions or for bulls to exit, rather than signal a trend reversal. Yifan’s personal recommendation: short around 69800–70500, targeting 68300–67500. #BTC #ETH #加密美股齐跌,下轮反弹的驱动力在哪?
11/13 $BTC evening analysis
Longs have all been wiped out, right? The main source of pressure right now is the Fed’s shift in monetary policy. U.S. inflation data has proved more stubborn than expected, and the market-implied probability of a rate hike in December has climbed above 72%. Some officials have even warned that a 50-basis-point hike may be needed. This means the market’s earlier bet on rate cuts has been completely disproven. Rising real-rate expectations are directly weighing on non-yielding assets like Bitcoin. At the same time, the 10-year U.S. Treasury yield has broken above 5%, and a stronger dollar is further draining liquidity from the crypto market. With rising rate-hike expectations, ETF outflows, a technical breakdown, and extreme fear all reinforcing one another, Bitcoin lacks a near-term catalyst for a reversal. If the price cannot quickly reclaim the 70000–70500 area (a previous psychological threshold and near the lower Bollinger Band), the next support levels to watch are 67500 and potentially lower. Any bounce could present an opportunity for bears to add to short positions or for bulls to exit, rather than signal a trend reversal. Yifan’s personal recommendation: short around 69800–70500, targeting 68300–67500. #BTC #ETH #加密美股齐跌,下轮反弹的驱动力在哪?
Longs have all been wiped out, right? The main source of pressure right now is the Fed’s shift in monetary policy. U.S. inflation data has proved more stubborn than expected, and the market-implied probability of a rate hike in December has climbed above 72%. Some officials have even warned that a 50-basis-point hike may be needed. This means the market’s earlier bet on rate cuts has been completely disproven. Rising real-rate expectations are directly weighing on non-yielding assets like Bitcoin. At the same time, the 10-year U.S. Treasury yield has broken above 5%, and a stronger dollar is further draining liquidity from the crypto market. With rising rate-hike expectations, ETF outflows, a technical breakdown, and extreme fear all reinforcing one another, Bitcoin lacks a near-term catalyst for a reversal. If the price cannot quickly reclaim the 70000–70500 area (a previous psychological threshold and near the lower Bollinger Band), the next support levels to watch are 67500 and potentially lower. Any bounce could present an opportunity for bears to add to short positions or for bulls to exit, rather than signal a trend reversal. Yifan’s personal recommendation: short around 69800–70500, targeting 68300–67500. #BTC #ETH #加密美股齐跌,下轮反弹的驱动力在哪?
130
·
--
Bearish
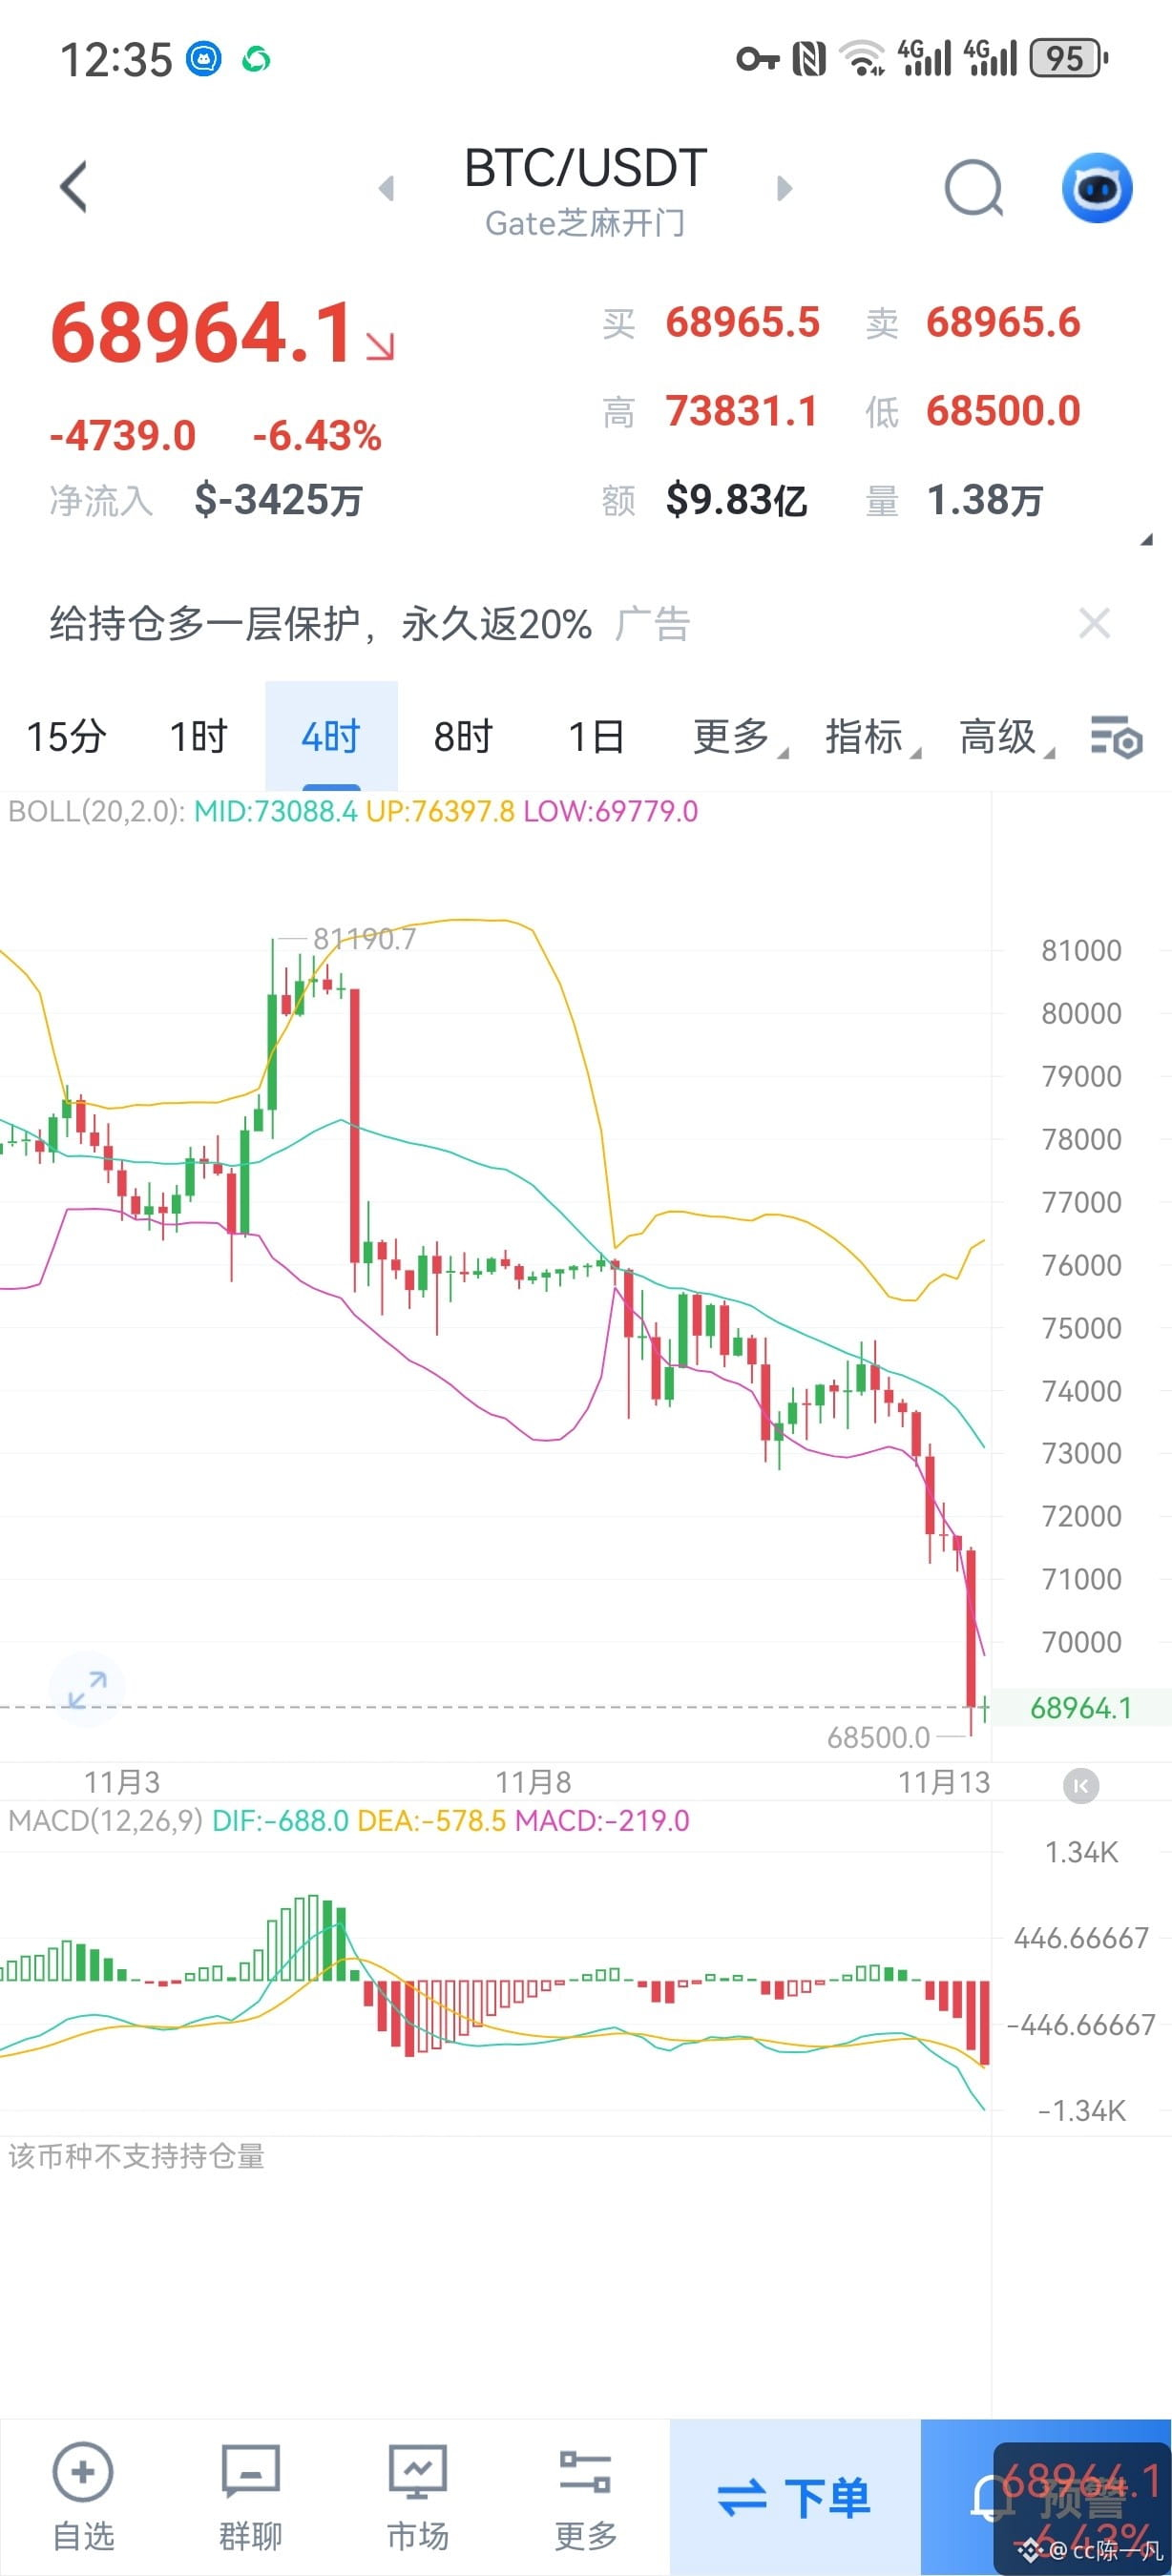
11.13$BTC Analysis
The market has failed to stabilize from yesterday through today, continuing to drift downward.
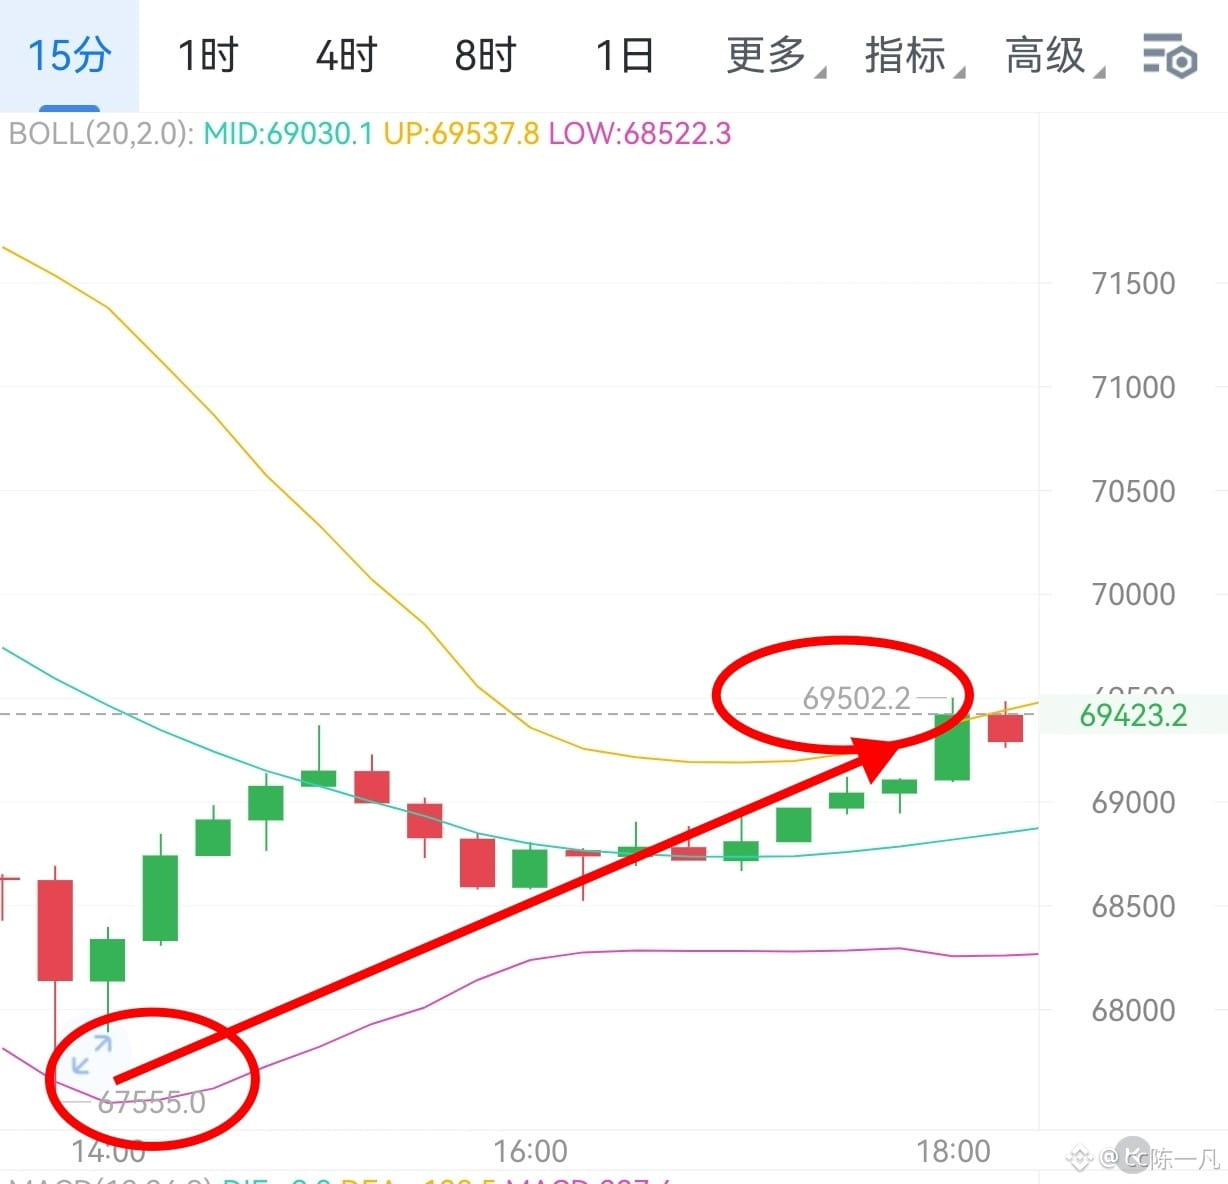
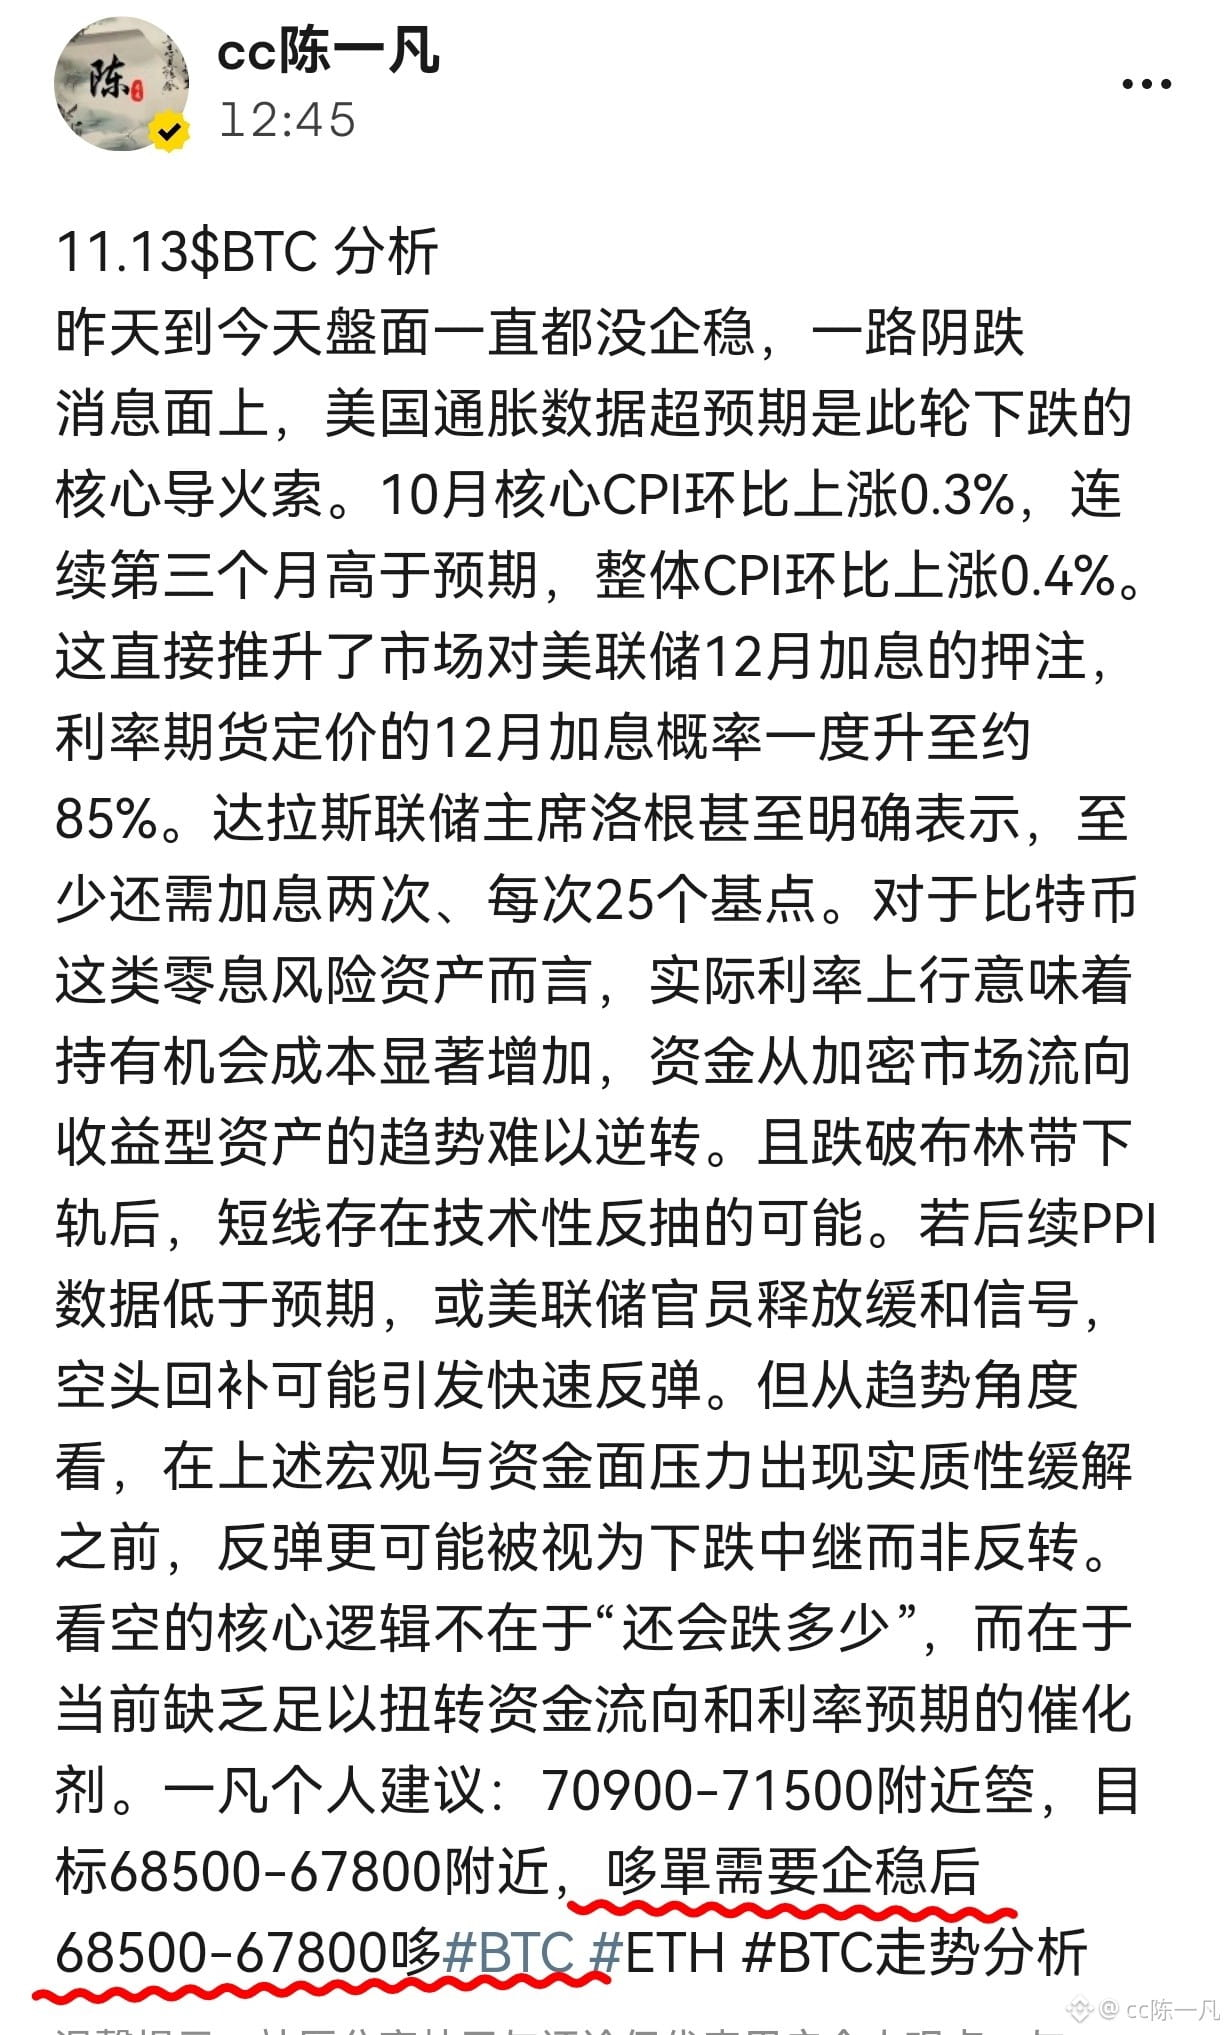
On the news front, U.S. inflation data coming in above expectations was the main catalyst for this downturn. Core CPI rose 0.3% month over month in October, above expectations for the third consecutive month, while headline CPI rose 0.4%. This directly increased market bets on a Fed rate hike in December, with the probability implied by interest-rate futures briefly climbing to around 85%. Dallas Fed President Logan even stated explicitly that at least two more rate hikes of 25 basis points each would be needed. For zero-yield risk assets such as Bitcoin, rising real interest rates mean a significant increase in the opportunity cost of holding them, making the flow of funds from crypto markets into yield-bearing assets difficult to reverse. Since the price has also fallen below the lower Bollinger Band, a short-term technical rebound is possible. If upcoming PPI data comes in below expectations, or Fed officials signal a more dovish stance, short covering could trigger a rapid rebound. From a trend perspective, however, until the macroeconomic and funding pressures described above ease materially, any rebound is more likely to be a continuation of the decline than a reversal. The core bearish argument is not about “how much further it will fall,” but that there is currently no catalyst strong enough to reverse fund flows and interest-rate expectations. Yifan’s personal recommendation: short around 70900–71500, with a target of around 68500–67800. Long positions should wait for the market to stabilize, then go long around 68500–67800. #BTC #ETH #BTC走势分析
11.13$BTC Analysis
The market has failed to stabilize from yesterday through today, continuing to drift downward.
On the news front, U.S. inflation data coming in above expectations was the main catalyst for this downturn. Core CPI rose 0.3% month over month in October, above expectations for the third consecutive month, while headline CPI rose 0.4%. This directly increased market bets on a Fed rate hike in December, with the probability implied by interest-rate futures briefly climbing to around 85%. Dallas Fed President Logan even stated explicitly that at least two more rate hikes of 25 basis points each would be needed. For zero-yield risk assets such as Bitcoin, rising real interest rates mean a significant increase in the opportunity cost of holding them, making the flow of funds from crypto markets into yield-bearing assets difficult to reverse. Since the price has also fallen below the lower Bollinger Band, a short-term technical rebound is possible. If upcoming PPI data comes in below expectations, or Fed officials signal a more dovish stance, short covering could trigger a rapid rebound. From a trend perspective, however, until the macroeconomic and funding pressures described above ease materially, any rebound is more likely to be a continuation of the decline than a reversal. The core bearish argument is not about “how much further it will fall,” but that there is currently no catalyst strong enough to reverse fund flows and interest-rate expectations. Yifan’s personal recommendation: short around 70900–71500, with a target of around 68500–67800. Long positions should wait for the market to stabilize, then go long around 68500–67800. #BTC #ETH #BTC走势分析
The market has failed to stabilize from yesterday through today, continuing to drift downward.
On the news front, U.S. inflation data coming in above expectations was the main catalyst for this downturn. Core CPI rose 0.3% month over month in October, above expectations for the third consecutive month, while headline CPI rose 0.4%. This directly increased market bets on a Fed rate hike in December, with the probability implied by interest-rate futures briefly climbing to around 85%. Dallas Fed President Logan even stated explicitly that at least two more rate hikes of 25 basis points each would be needed. For zero-yield risk assets such as Bitcoin, rising real interest rates mean a significant increase in the opportunity cost of holding them, making the flow of funds from crypto markets into yield-bearing assets difficult to reverse. Since the price has also fallen below the lower Bollinger Band, a short-term technical rebound is possible. If upcoming PPI data comes in below expectations, or Fed officials signal a more dovish stance, short covering could trigger a rapid rebound. From a trend perspective, however, until the macroeconomic and funding pressures described above ease materially, any rebound is more likely to be a continuation of the decline than a reversal. The core bearish argument is not about “how much further it will fall,” but that there is currently no catalyst strong enough to reverse fund flows and interest-rate expectations. Yifan’s personal recommendation: short around 70900–71500, with a target of around 68500–67800. Long positions should wait for the market to stabilize, then go long around 68500–67800. #BTC #ETH #BTC走势分析
188
·
--
Bullish
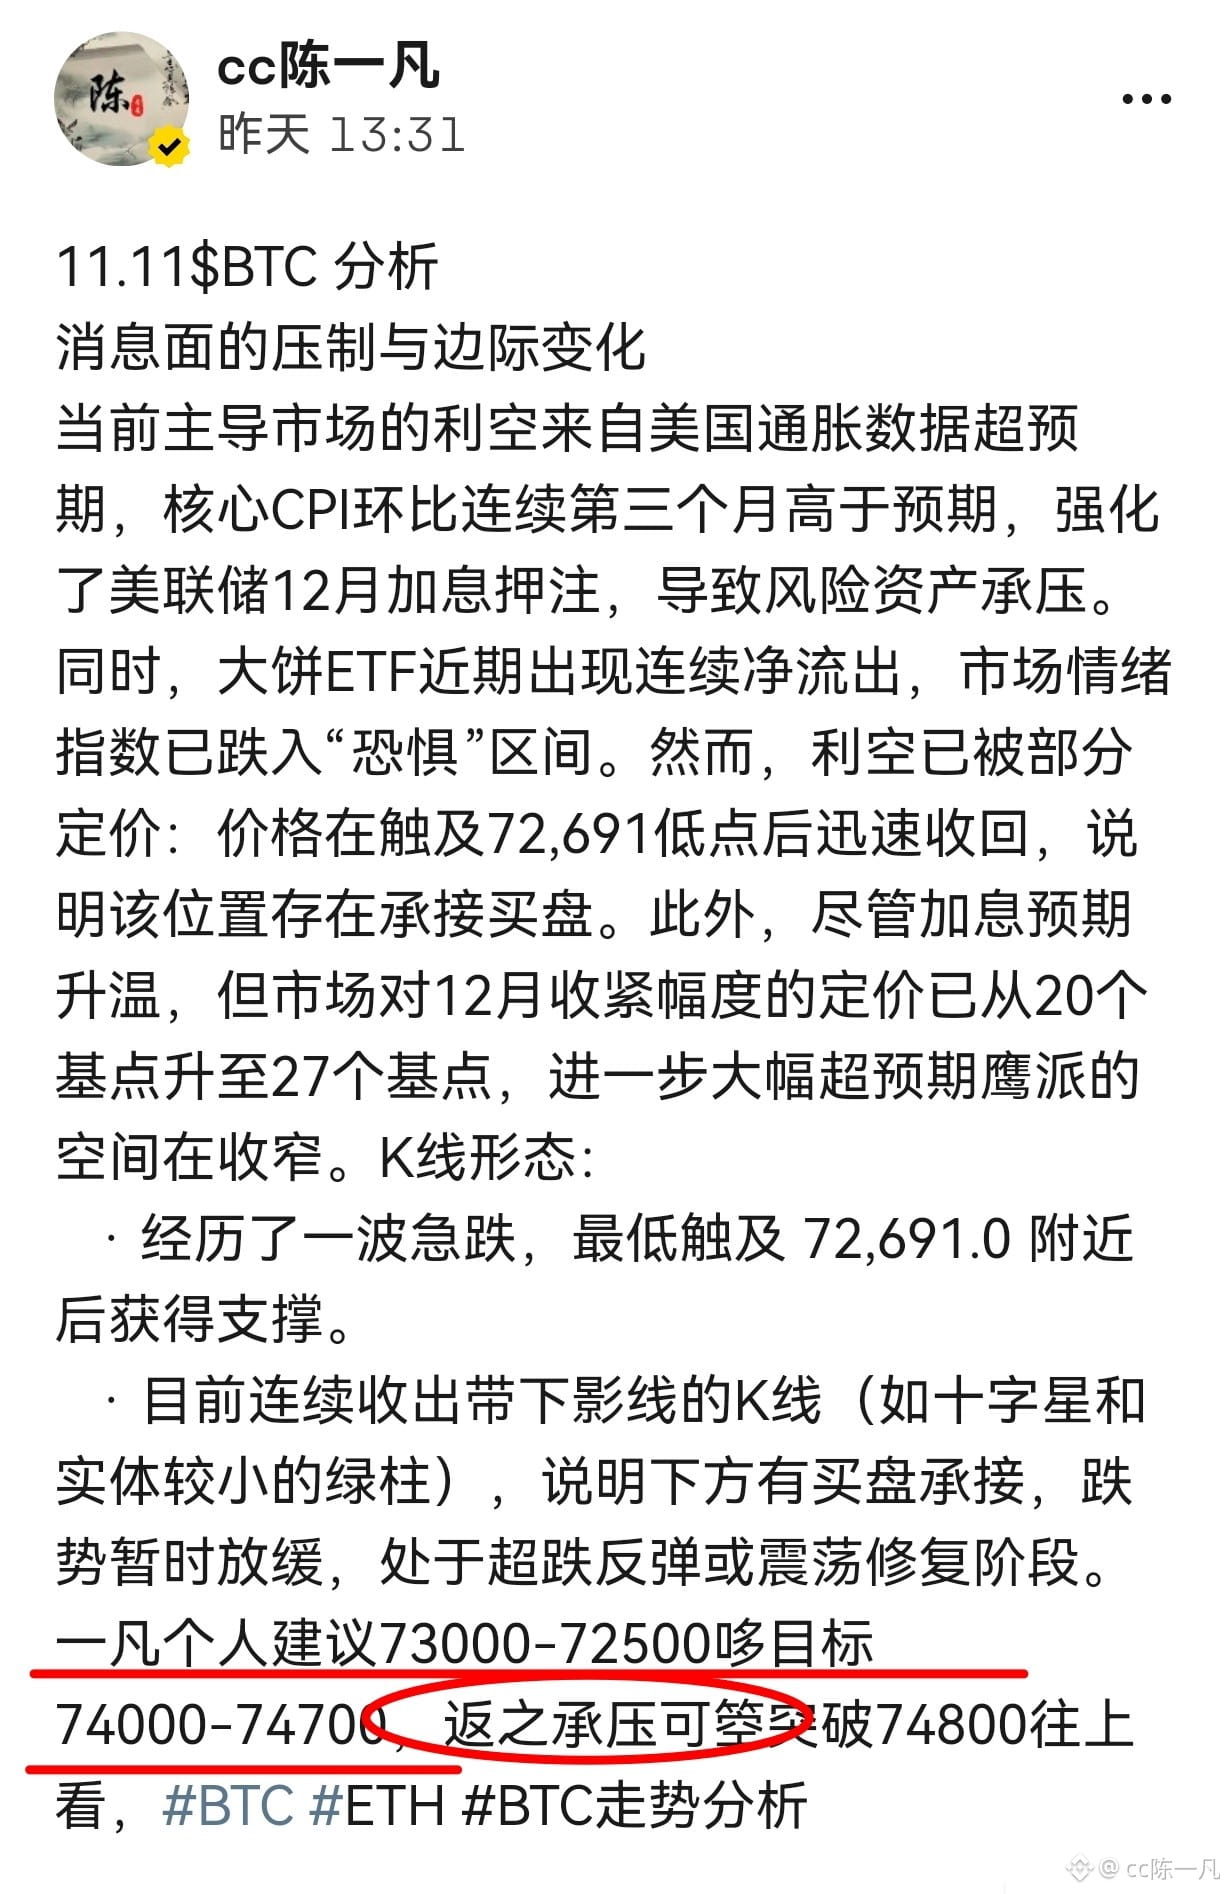
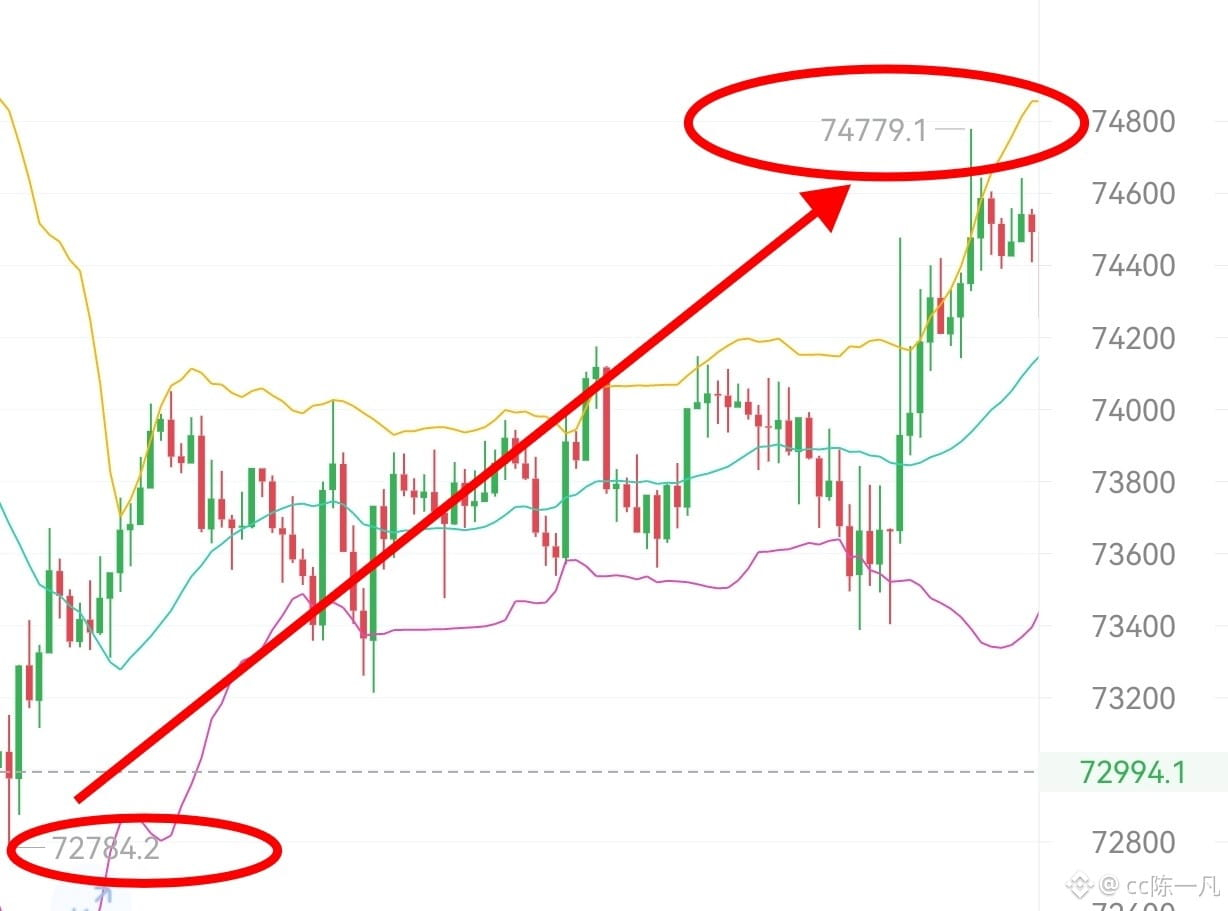
11.12$BTC Evening Outlook
Did you follow the strategy I shared yesterday? When the price reached the levels, did you go short or long? I usually sleep in the morning, so I share strategies with you in advance. Make good use of them when the price reaches the levels. Technically, Bitcoin has short-term oversold-rebound potential after a rapid 15-minute drop, with the price near 72,740. It is close to the lower Bollinger Band, bearish momentum has eased somewhat, and there is room for a corrective bounce. Although large limit orders have appeared, they are pre-positioned sell orders rather than an immediate dump. Some funds are buying the dip in batches after the sharp decline, and the split in market sentiment is fueling short-term bets on a rebound. Yifan’s personal suggestion: go long near 72,200–71,500 once the price stabilizes, targeting around 73,800–74,500. Conversely, if the price meets resistance, consider going short. #BTC #ETH #BTC走势分析
11.12$BTC Evening Outlook
Did you follow the strategy I shared yesterday? When the price reached the levels, did you go short or long? I usually sleep in the morning, so I share strategies with you in advance. Make good use of them when the price reaches the levels. Technically, Bitcoin has short-term oversold-rebound potential after a rapid 15-minute drop, with the price near 72,740. It is close to the lower Bollinger Band, bearish momentum has eased somewhat, and there is room for a corrective bounce. Although large limit orders have appeared, they are pre-positioned sell orders rather than an immediate dump. Some funds are buying the dip in batches after the sharp decline, and the split in market sentiment is fueling short-term bets on a rebound. Yifan’s personal suggestion: go long near 72,200–71,500 once the price stabilizes, targeting around 73,800–74,500. Conversely, if the price meets resistance, consider going short. #BTC #ETH #BTC走势分析
Did you follow the strategy I shared yesterday? When the price reached the levels, did you go short or long? I usually sleep in the morning, so I share strategies with you in advance. Make good use of them when the price reaches the levels. Technically, Bitcoin has short-term oversold-rebound potential after a rapid 15-minute drop, with the price near 72,740. It is close to the lower Bollinger Band, bearish momentum has eased somewhat, and there is room for a corrective bounce. Although large limit orders have appeared, they are pre-positioned sell orders rather than an immediate dump. Some funds are buying the dip in batches after the sharp decline, and the split in market sentiment is fueling short-term bets on a rebound. Yifan’s personal suggestion: go long near 72,200–71,500 once the price stabilizes, targeting around 73,800–74,500. Conversely, if the price meets resistance, consider going short. #BTC #ETH #BTC走势分析
349
·
--
Bullish
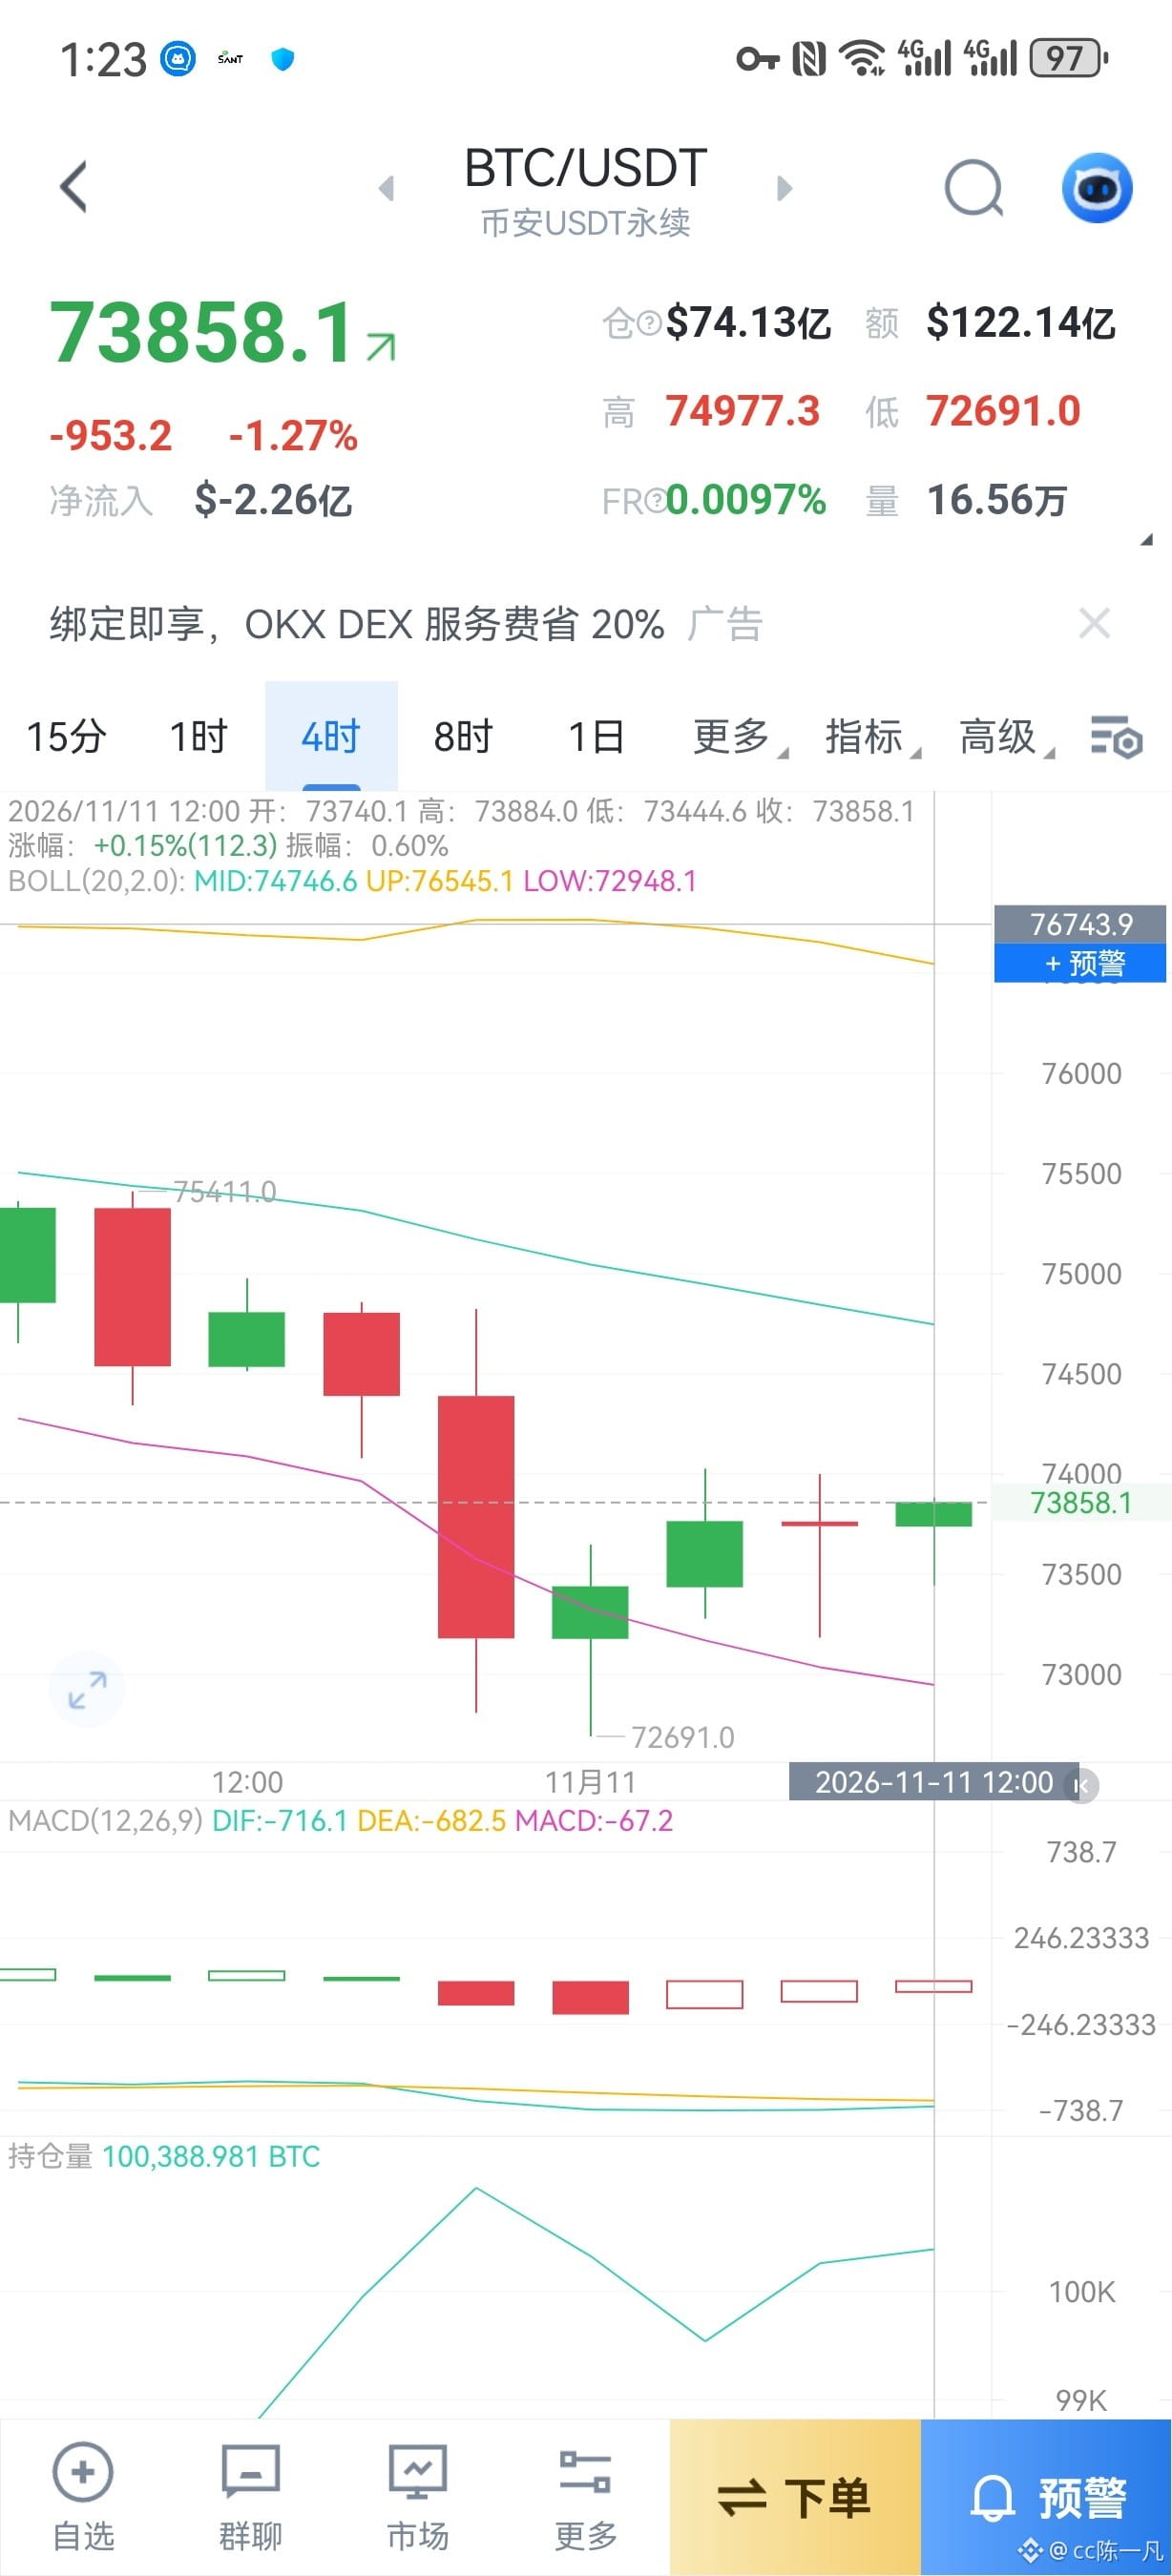
11.11$BTC Analysis
News-driven pressure and marginal changes
The main bearish factor currently driving the market is U.S. inflation data coming in above expectations. Core CPI rose month over month for the third consecutive month, exceeding expectations and strengthening bets on a Fed rate hike in December, putting risk assets under pressure. Meanwhile, Bitcoin ETFs have recently seen consecutive net outflows, and the market sentiment index has fallen into the “fear” zone. However, some of the bearish news has already been priced in: after touching a low of 72,691, the price quickly recovered, indicating buying support at that level. In addition, although expectations of a rate hike have risen, the market’s pricing for the size of December’s tightening has increased from 20 basis points to 27 basis points, leaving less room for a further, significantly more hawkish surprise.
Candlestick pattern:
· After a sharp decline, the price found support near a low of 72,691.0.
· Candlesticks with lower shadows have appeared for several consecutive sessions (such as doji candles and small-bodied green candles), indicating buying support below. The decline has temporarily slowed, and the market is in an oversold rebound or sideways consolidation phase. Yifan’s personal suggestion: 73000-72500; long targets 74000-74700. Conversely, if the price faces resistance, consider shorting; if it breaks above 74800, look higher. #BTC #ETH #BTC走势分析
11.11$BTC Analysis
News-driven pressure and marginal changes
The main bearish factor currently driving the market is U.S. inflation data coming in above expectations. Core CPI rose month over month for the third consecutive month, exceeding expectations and strengthening bets on a Fed rate hike in December, putting risk assets under pressure. Meanwhile, Bitcoin ETFs have recently seen consecutive net outflows, and the market sentiment index has fallen into the “fear” zone. However, some of the bearish news has already been priced in: after touching a low of 72,691, the price quickly recovered, indicating buying support at that level. In addition, although expectations of a rate hike have risen, the market’s pricing for the size of December’s tightening has increased from 20 basis points to 27 basis points, leaving less room for a further, significantly more hawkish surprise.
Candlestick pattern:
· After a sharp decline, the price found support near a low of 72,691.0.
· Candlesticks with lower shadows have appeared for several consecutive sessions (such as doji candles and small-bodied green candles), indicating buying support below. The decline has temporarily slowed, and the market is in an oversold rebound or sideways consolidation phase. Yifan’s personal suggestion: 73000-72500; long targets 74000-74700. Conversely, if the price faces resistance, consider shorting; if it breaks above 74800, look higher. #BTC #ETH #BTC走势分析
News-driven pressure and marginal changes
The main bearish factor currently driving the market is U.S. inflation data coming in above expectations. Core CPI rose month over month for the third consecutive month, exceeding expectations and strengthening bets on a Fed rate hike in December, putting risk assets under pressure. Meanwhile, Bitcoin ETFs have recently seen consecutive net outflows, and the market sentiment index has fallen into the “fear” zone. However, some of the bearish news has already been priced in: after touching a low of 72,691, the price quickly recovered, indicating buying support at that level. In addition, although expectations of a rate hike have risen, the market’s pricing for the size of December’s tightening has increased from 20 basis points to 27 basis points, leaving less room for a further, significantly more hawkish surprise.
Candlestick pattern:
· After a sharp decline, the price found support near a low of 72,691.0.
· Candlesticks with lower shadows have appeared for several consecutive sessions (such as doji candles and small-bodied green candles), indicating buying support below. The decline has temporarily slowed, and the market is in an oversold rebound or sideways consolidation phase. Yifan’s personal suggestion: 73000-72500; long targets 74000-74700. Conversely, if the price faces resistance, consider shorting; if it breaks above 74800, look higher. #BTC #ETH #BTC走势分析
305
·
--
Bullish
Nov 10 $BTC analysis
Although recent news has generally been bearish, the market’s reaction to negative news is changing, creating favorable conditions for a rebound:
· ETF outflow pressure has been partially absorbed: Although spot Bitcoin ETFs have recently recorded net outflows, the price has not collapsed and instead found support above 73,000. This usually suggests that selling pressure may have been absorbed by the market. If outflows slow or turn into inflows, the rebound could gain strength.
· Political uncertainty has been resolved: After the U.S. midterm election results became clear, concerns about tighter regulations initially triggered a decline. But as the results were absorbed, Bitcoin rebounded. With short-term policy headwinds out of the way, a window has opened for a technical rebound.
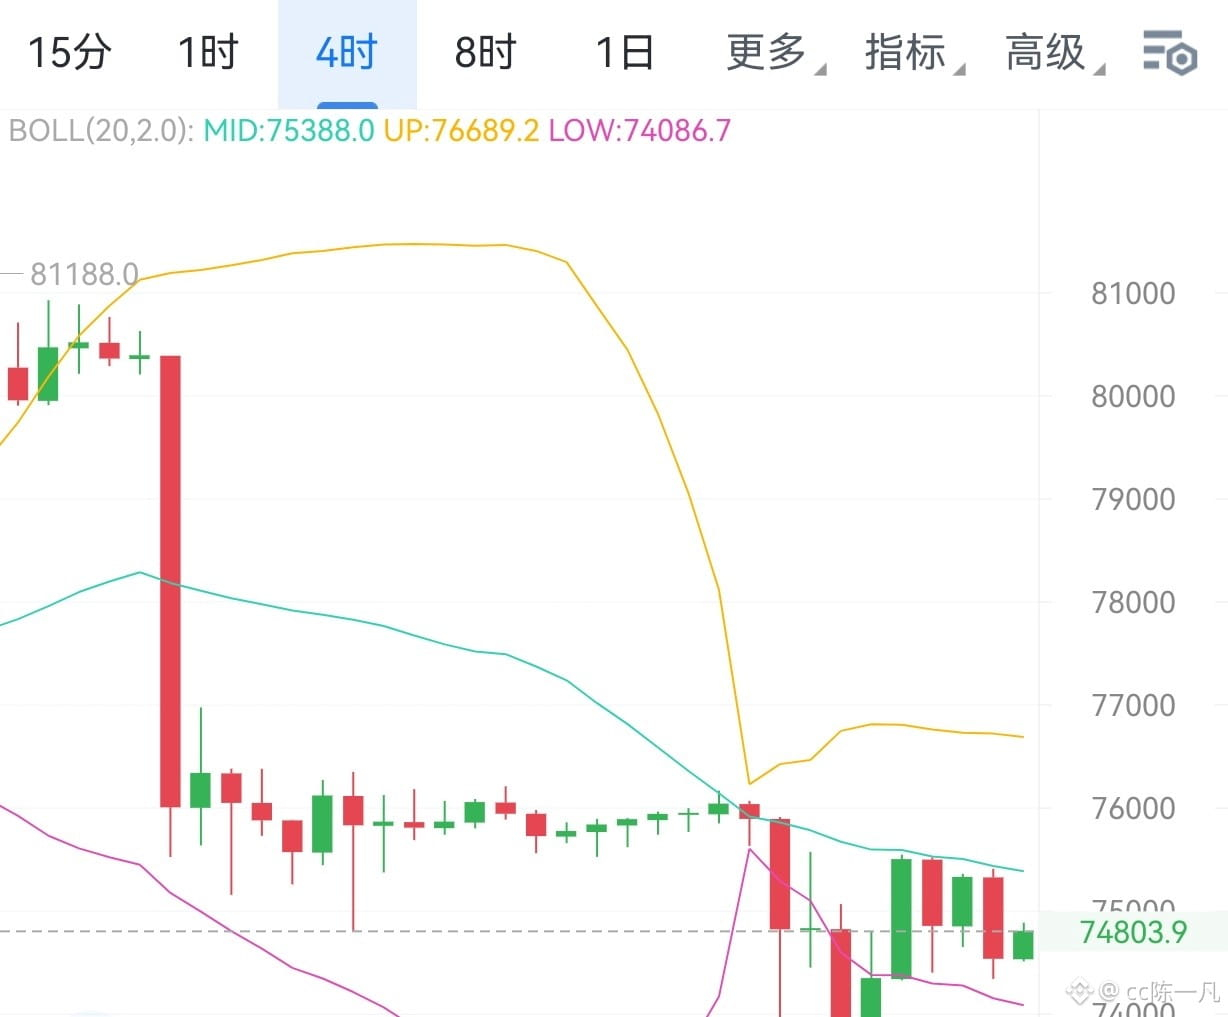
· Demand for short covering after oversold conditions: The price previously fell from 81,953 to 73,333, leaving many short positions in profit. Once the price stabilizes at key support levels (such as the 73,000–74,000 range), it could trigger short covering and drive a rapid rebound. Yifan's personal recommendation: go long at 74000–73400, with a target of 75800–76300 (only a breakout above this range would make 77500–78500 a possibility).
Likewise, if the price faces resistance, you can short #BTC #ETH #BTC走势分析
Nov 10 $BTC analysis
Although recent news has generally been bearish, the market’s reaction to negative news is changing, creating favorable conditions for a rebound:
· ETF outflow pressure has been partially absorbed: Although spot Bitcoin ETFs have recently recorded net outflows, the price has not collapsed and instead found support above 73,000. This usually suggests that selling pressure may have been absorbed by the market. If outflows slow or turn into inflows, the rebound could gain strength.
· Political uncertainty has been resolved: After the U.S. midterm election results became clear, concerns about tighter regulations initially triggered a decline. But as the results were absorbed, Bitcoin rebounded. With short-term policy headwinds out of the way, a window has opened for a technical rebound.
· Demand for short covering after oversold conditions: The price previously fell from 81,953 to 73,333, leaving many short positions in profit. Once the price stabilizes at key support levels (such as the 73,000–74,000 range), it could trigger short covering and drive a rapid rebound. Yifan's personal recommendation: go long at 74000–73400, with a target of 75800–76300 (only a breakout above this range would make 77500–78500 a possibility).
Likewise, if the price faces resistance, you can short #BTC #ETH #BTC走势分析
Although recent news has generally been bearish, the market’s reaction to negative news is changing, creating favorable conditions for a rebound:
· ETF outflow pressure has been partially absorbed: Although spot Bitcoin ETFs have recently recorded net outflows, the price has not collapsed and instead found support above 73,000. This usually suggests that selling pressure may have been absorbed by the market. If outflows slow or turn into inflows, the rebound could gain strength.
· Political uncertainty has been resolved: After the U.S. midterm election results became clear, concerns about tighter regulations initially triggered a decline. But as the results were absorbed, Bitcoin rebounded. With short-term policy headwinds out of the way, a window has opened for a technical rebound.
· Demand for short covering after oversold conditions: The price previously fell from 81,953 to 73,333, leaving many short positions in profit. Once the price stabilizes at key support levels (such as the 73,000–74,000 range), it could trigger short covering and drive a rapid rebound. Yifan's personal recommendation: go long at 74000–73400, with a target of 75800–76300 (only a breakout above this range would make 77500–78500 a possibility).
Likewise, if the price faces resistance, you can short #BTC #ETH #BTC走势分析
288
·
--
Bearish
11/9 $BTC Evening Outlook
Have you taken any short positions today? Regulatory expectations have taken a sharp turn for the worse (the impact of a “blue wave” in the midterm elections)
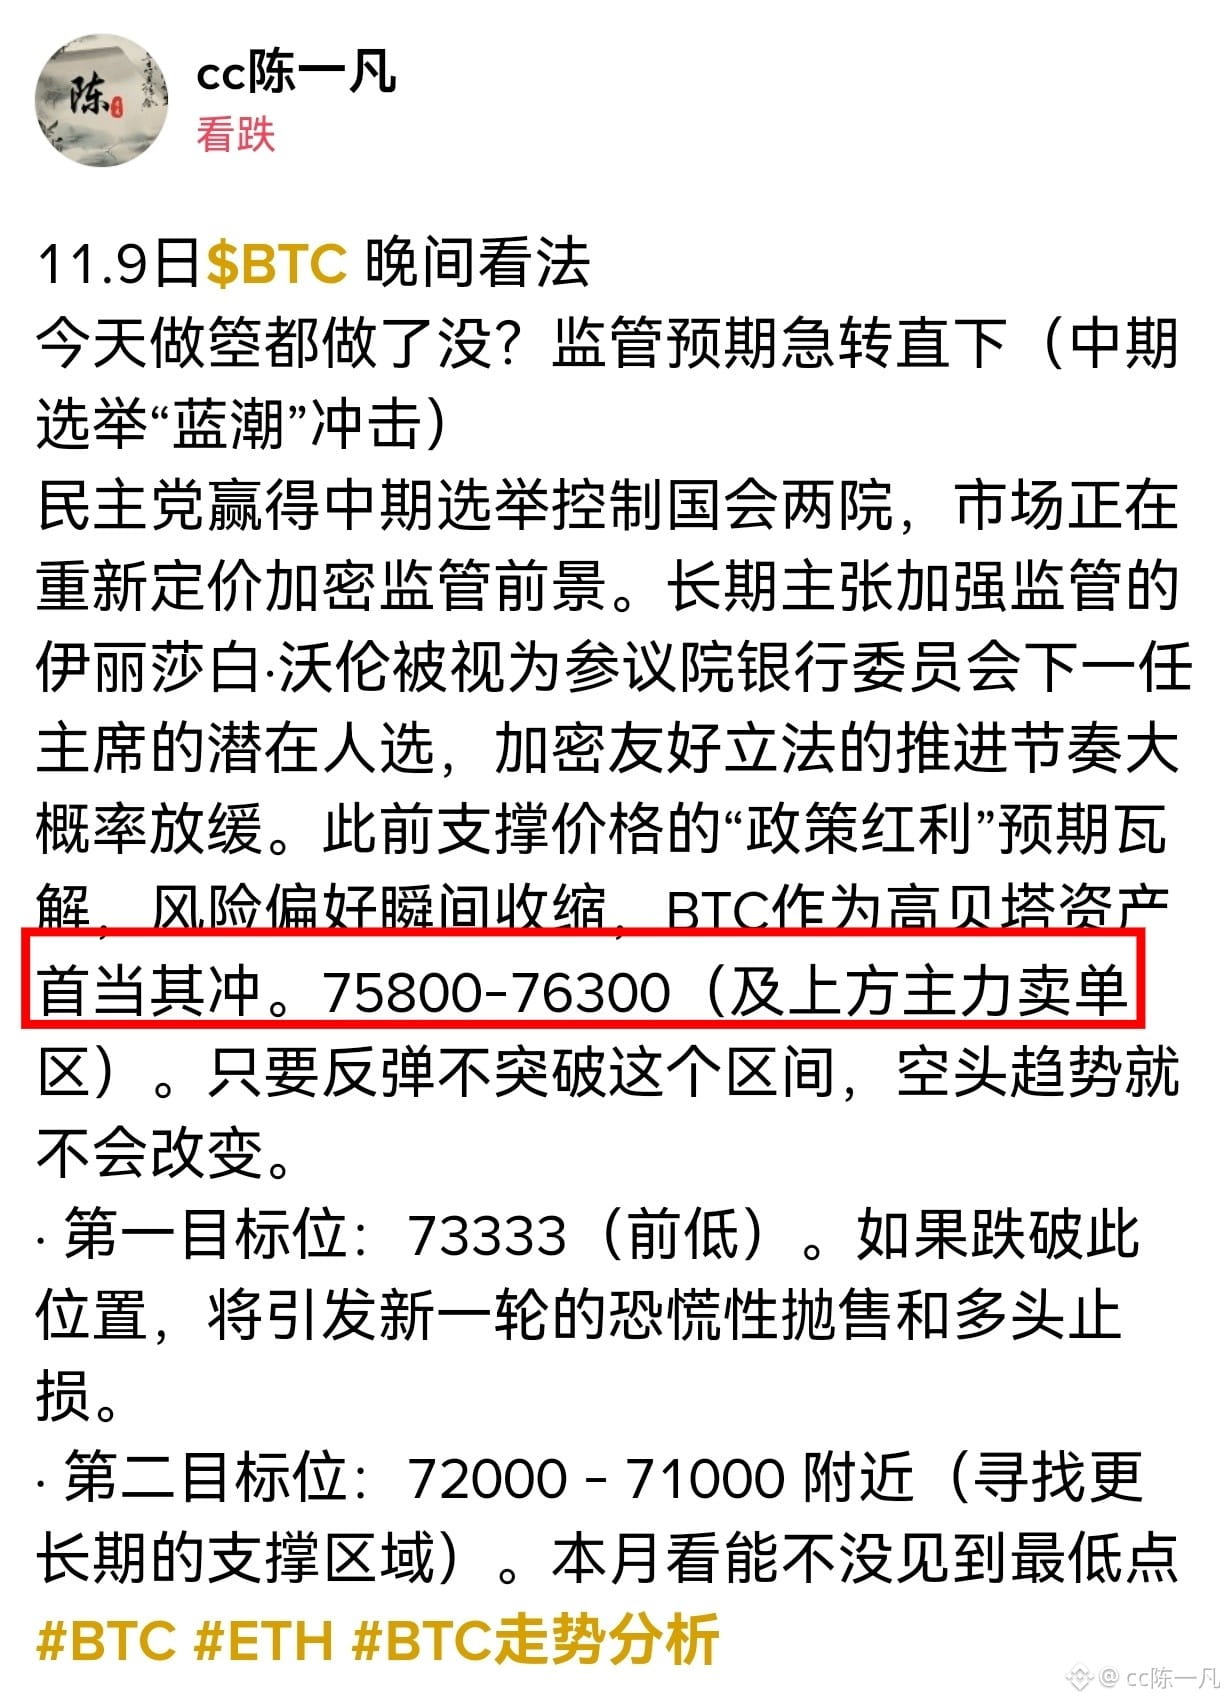
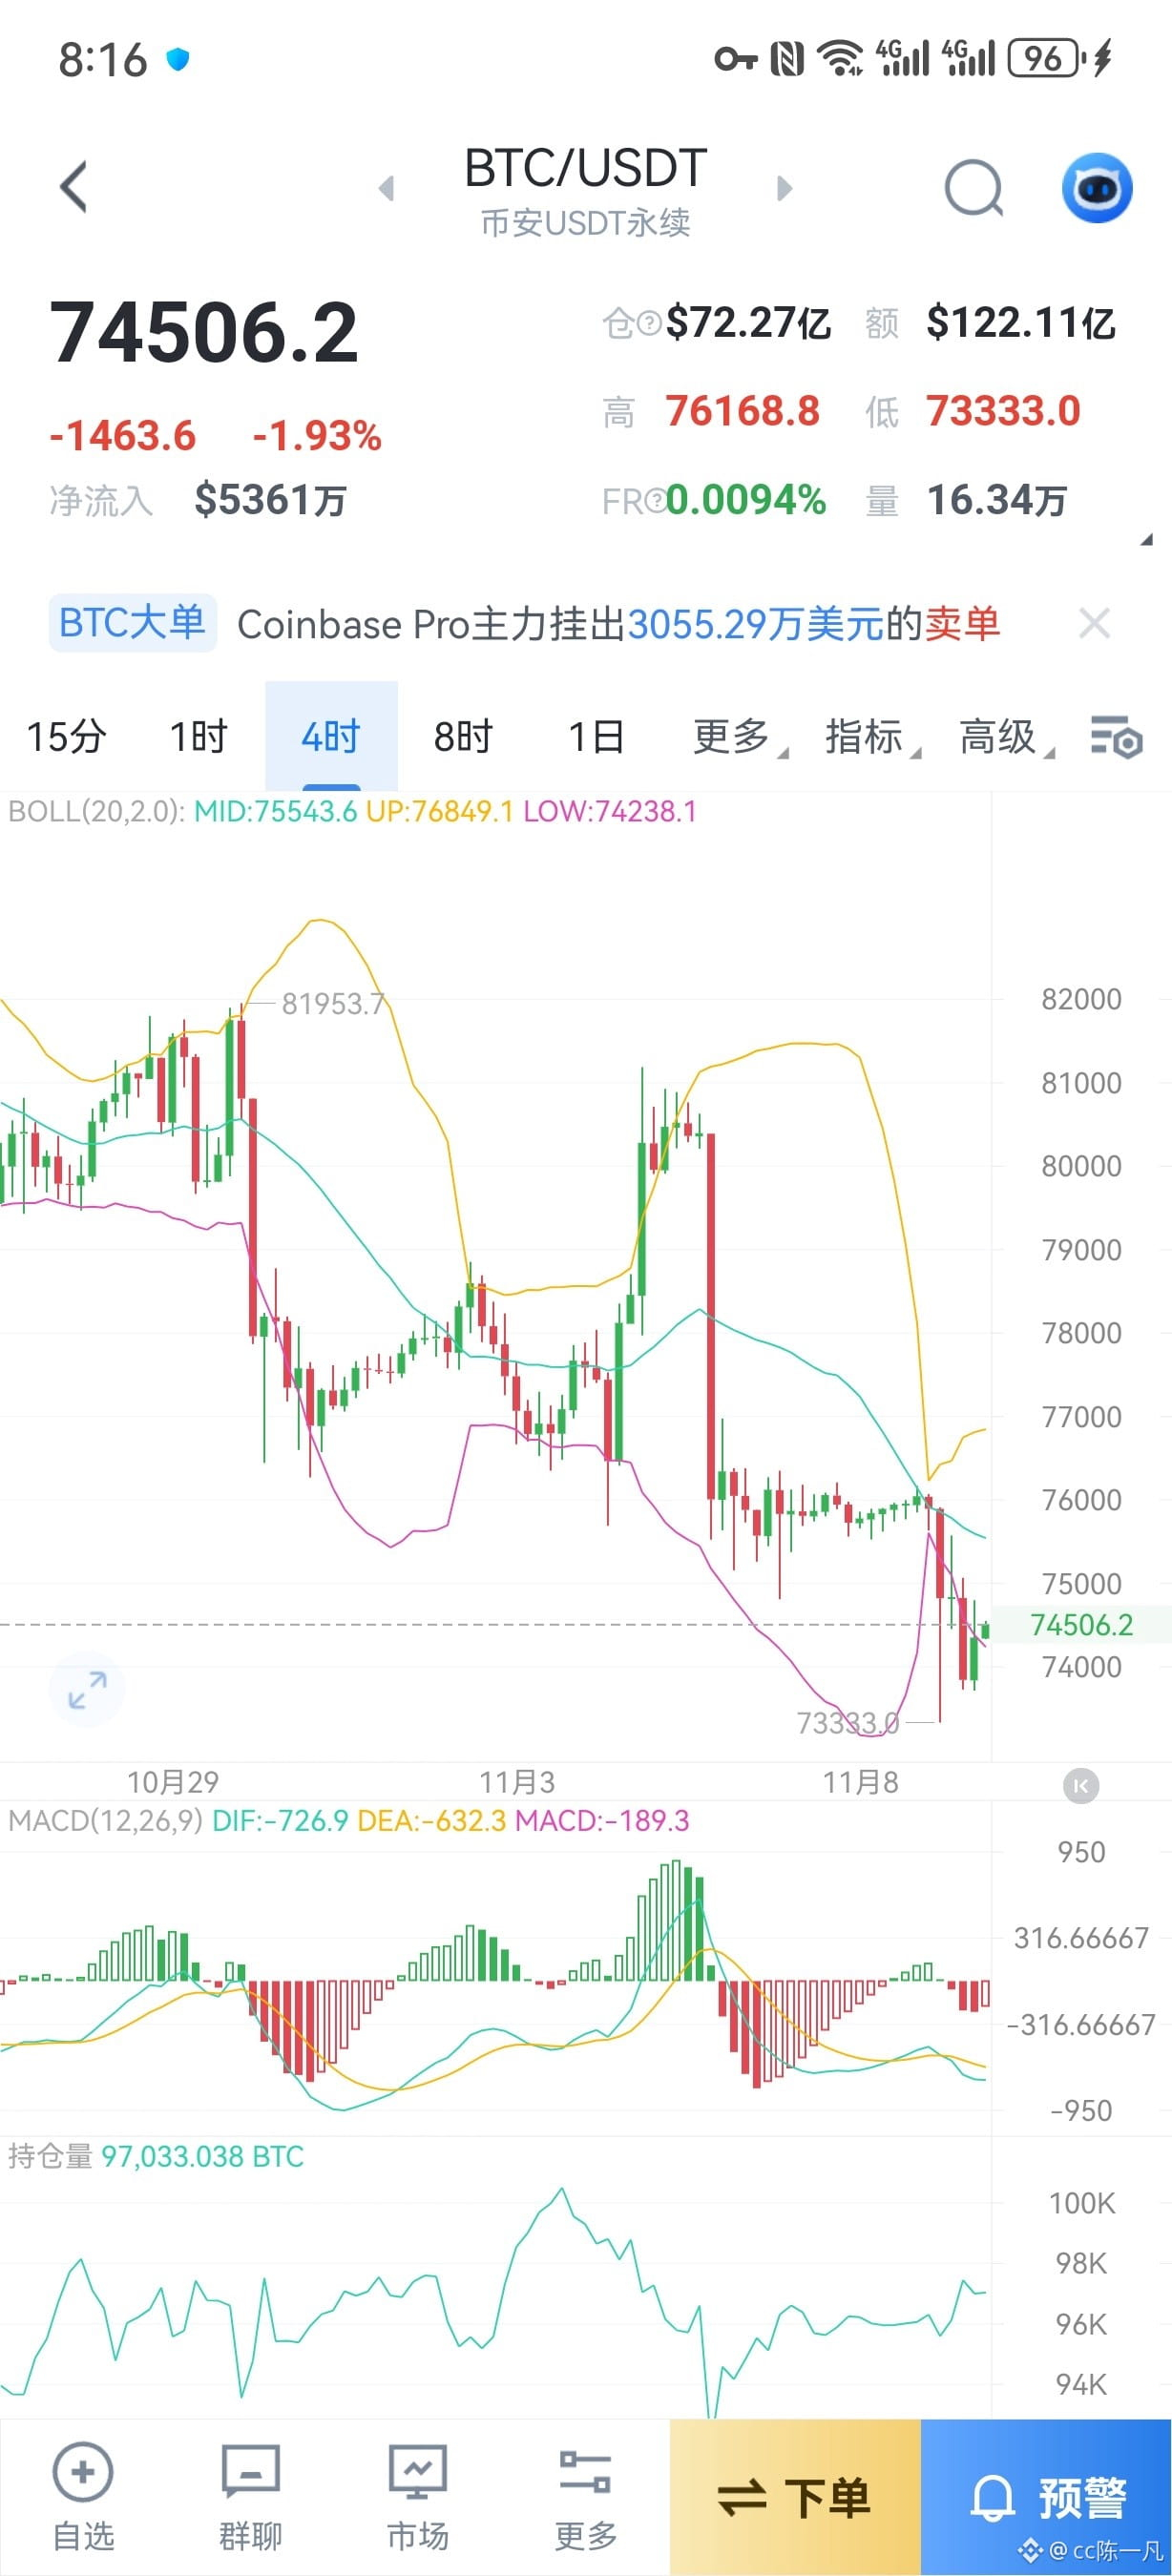
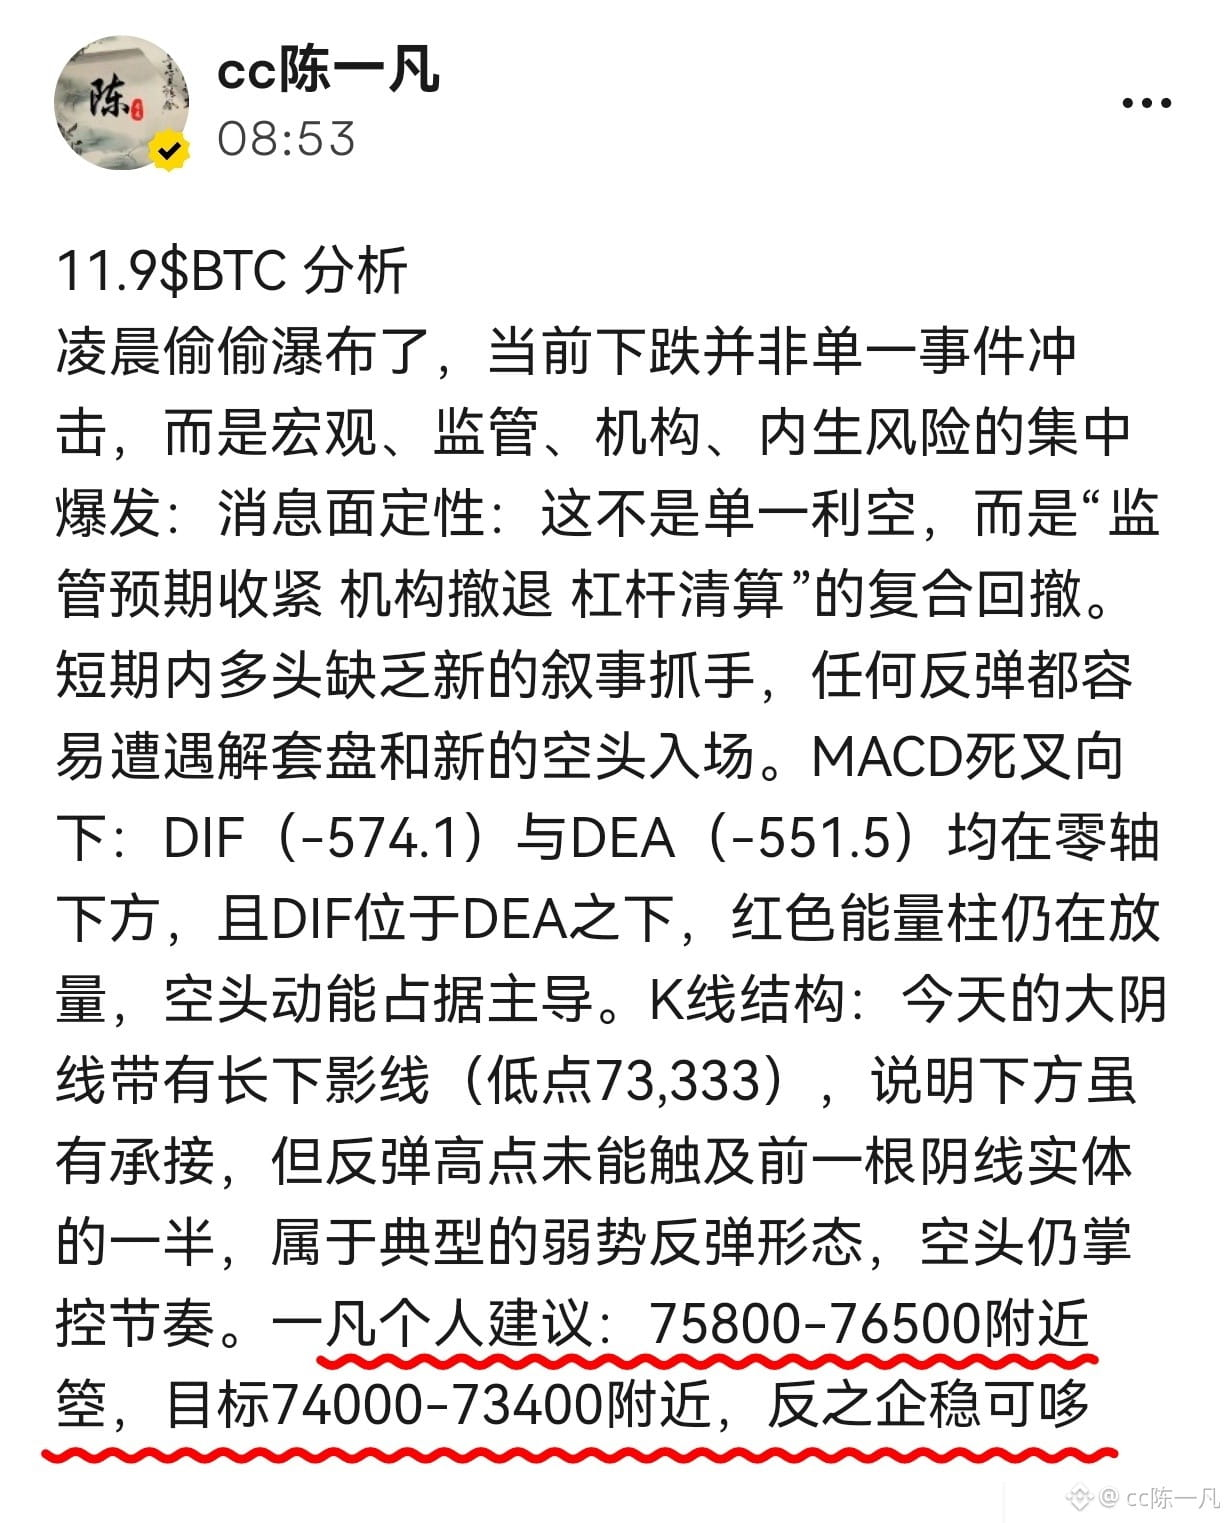
The Democrats won the midterm elections and took control of both chambers of Congress, prompting the market to reprice the outlook for crypto regulation. Elizabeth Warren, a longtime advocate of tighter regulation, is seen as a potential candidate for the next chair of the Senate Banking Committee, and progress on crypto-friendly legislation is likely to slow. Expectations of a “policy dividend” that had previously supported prices have evaporated, risk appetite has contracted abruptly, and BTC, as a high-beta asset, has borne the brunt. 75800–76300 (and the major sell order zone above). As long as a rebound does not break through this range, the bearish trend will remain unchanged.
· First target: 73333 (the previous low). A break below this level could trigger another wave of panic selling and stop-loss orders from long positions.
· Second target: around 72000–71000 (looking for a longer-term support zone). This month, let's see whether the market can reach a low of #BTC #ETH #BTC走势分析 .
11/9 $BTC Evening Outlook
Have you taken any short positions today? Regulatory expectations have taken a sharp turn for the worse (the impact of a “blue wave” in the midterm elections)
The Democrats won the midterm elections and took control of both chambers of Congress, prompting the market to reprice the outlook for crypto regulation. Elizabeth Warren, a longtime advocate of tighter regulation, is seen as a potential candidate for the next chair of the Senate Banking Committee, and progress on crypto-friendly legislation is likely to slow. Expectations of a “policy dividend” that had previously supported prices have evaporated, risk appetite has contracted abruptly, and BTC, as a high-beta asset, has borne the brunt. 75800–76300 (and the major sell order zone above). As long as a rebound does not break through this range, the bearish trend will remain unchanged.
· First target: 73333 (the previous low). A break below this level could trigger another wave of panic selling and stop-loss orders from long positions.
· Second target: around 72000–71000 (looking for a longer-term support zone). This month, let's see whether the market can reach a low of #BTC #ETH #BTC走势分析 .
Have you taken any short positions today? Regulatory expectations have taken a sharp turn for the worse (the impact of a “blue wave” in the midterm elections)
The Democrats won the midterm elections and took control of both chambers of Congress, prompting the market to reprice the outlook for crypto regulation. Elizabeth Warren, a longtime advocate of tighter regulation, is seen as a potential candidate for the next chair of the Senate Banking Committee, and progress on crypto-friendly legislation is likely to slow. Expectations of a “policy dividend” that had previously supported prices have evaporated, risk appetite has contracted abruptly, and BTC, as a high-beta asset, has borne the brunt. 75800–76300 (and the major sell order zone above). As long as a rebound does not break through this range, the bearish trend will remain unchanged.
· First target: 73333 (the previous low). A break below this level could trigger another wave of panic selling and stop-loss orders from long positions.
· Second target: around 72000–71000 (looking for a longer-term support zone). This month, let's see whether the market can reach a low of #BTC #ETH #BTC走势分析 .
279
Log in to explore more content
Join global crypto users on Binance Square
⚡️ Get latest and useful information about crypto.
💬 Trusted by the world’s largest crypto exchange.
👍 Discover real insights from verified creators.
Email / Phone number
Trending Topics
CanBTCReboundAfterFallingBelow60K?
88,137 views
488 Discussing
Bitcoin News | Bitcoin Falls Below $60,000 for the First Time Since July as IBIT Posts Record $541 Million Outflow
Binance News
·39 Likes
·68.5k views
GlobalStocksFaceLongestLosingStreakSince2023
43,509 views
490 Discussing
AnthropicPlungesTowardIPOPriceonDay2
12,329 views
192 Discussing