11.18$BTC Analysis
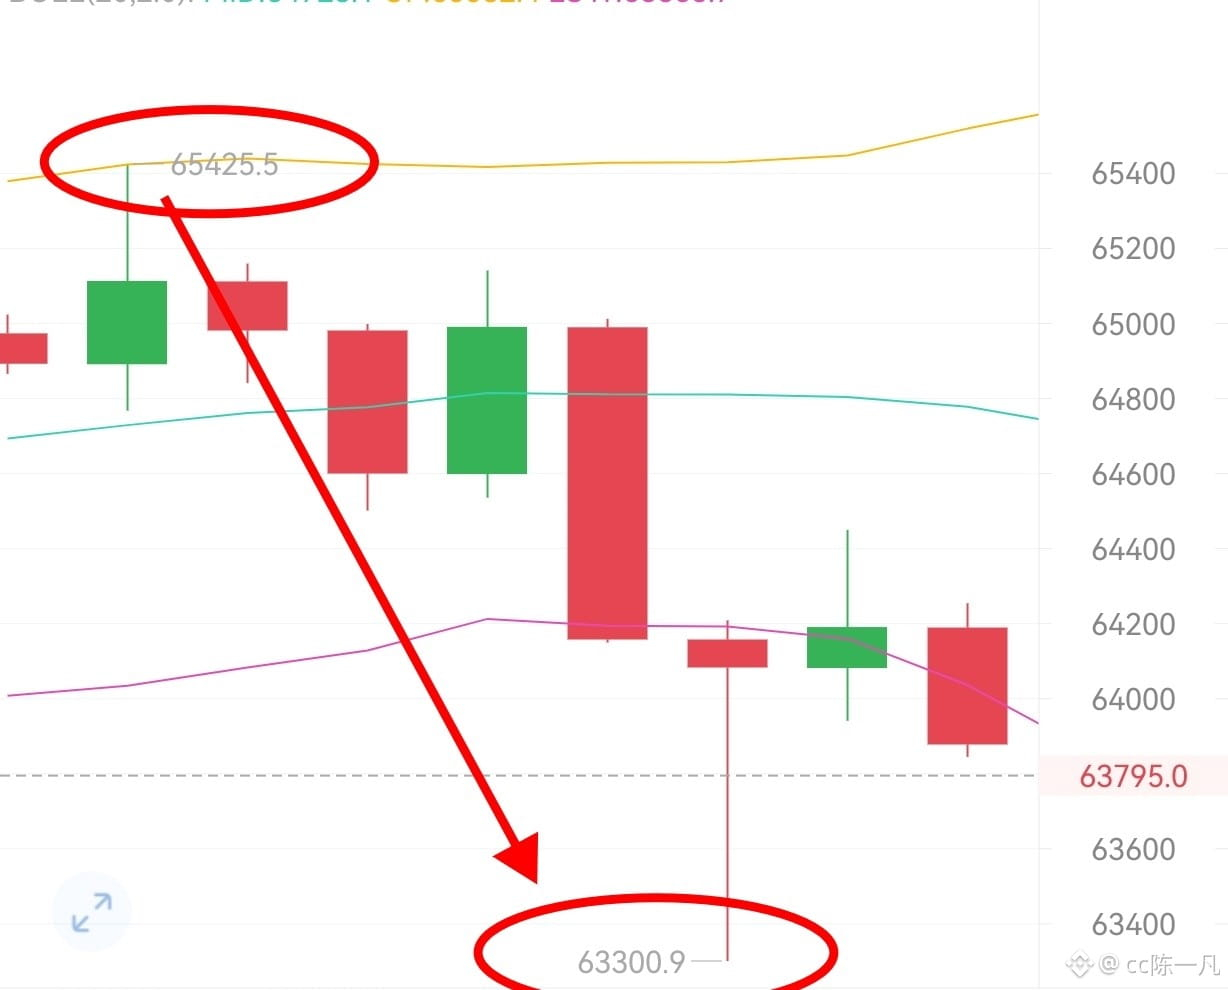
Yifan has had everyone enjoying shorting these past few days, right? The 65,000–65,800 range has been a great place to short every day.
At the macro level, rising rate-hike expectations are directly weighing on risk assets. U.S. October PPI rose 6.5% year over year, its highest level in nearly four years, while CPI also came in above expectations. Markets have nearly priced in a December Fed rate hike. Deutsche Bank even expects the Fed to raise rates at each of its next three meetings. The 10-year Treasury yield has climbed back above 5%, significantly increasing the opportunity cost of holding a zero-yield asset like Bitcoin.
On the fund-flow front, institutions are withdrawing systematically. U.S. spot Bitcoin ETFs have seen net outflows for several consecutive days, with cumulative outflows of about $2.1 billion in November, officially turning net inflows for the year negative. BlackRock’s IBIT, a bellwether product, accounted for about 85% of the entire market’s outflows in a single week, showing that even major institutional allocators are pulling back. On-chain data confirms the trend: whales are depositing about $55 million more worth of BTC into exchanges each day than they are withdrawing, and selling pressure from large holders continues to build.
The technical breakdown is confirmed. Bitcoin has fallen below the lower Bollinger Band and is trading beneath the 200-day moving average, turning the medium-term trend bearish. Although the MACD histogram is showing signs of shrinking green bars, this recovery below the zero line is more likely a temporary pause in bearish momentum than a trend reversal. $62,000 is a key near-term support level; if it fails, the psychological $60,000 level will be directly in sight. Until ETF outflows stabilize and whales switch to net withdrawals, a rebound is more likely to offer an opportunity to short at higher prices than to signal a bottom.#BTC #ETH #BTC走势分析
Yifan has had everyone enjoying shorting these past few days, right? The 65,000–65,800 range has been a great place to short every day.
At the macro level, rising rate-hike expectations are directly weighing on risk assets. U.S. October PPI rose 6.5% year over year, its highest level in nearly four years, while CPI also came in above expectations. Markets have nearly priced in a December Fed rate hike. Deutsche Bank even expects the Fed to raise rates at each of its next three meetings. The 10-year Treasury yield has climbed back above 5%, significantly increasing the opportunity cost of holding a zero-yield asset like Bitcoin.
On the fund-flow front, institutions are withdrawing systematically. U.S. spot Bitcoin ETFs have seen net outflows for several consecutive days, with cumulative outflows of about $2.1 billion in November, officially turning net inflows for the year negative. BlackRock’s IBIT, a bellwether product, accounted for about 85% of the entire market’s outflows in a single week, showing that even major institutional allocators are pulling back. On-chain data confirms the trend: whales are depositing about $55 million more worth of BTC into exchanges each day than they are withdrawing, and selling pressure from large holders continues to build.
The technical breakdown is confirmed. Bitcoin has fallen below the lower Bollinger Band and is trading beneath the 200-day moving average, turning the medium-term trend bearish. Although the MACD histogram is showing signs of shrinking green bars, this recovery below the zero line is more likely a temporary pause in bearish momentum than a trend reversal. $62,000 is a key near-term support level; if it fails, the psychological $60,000 level will be directly in sight. Until ETF outflows stabilize and whales switch to net withdrawals, a rebound is more likely to offer an opportunity to short at higher prices than to signal a bottom.#BTC #ETH #BTC走势分析