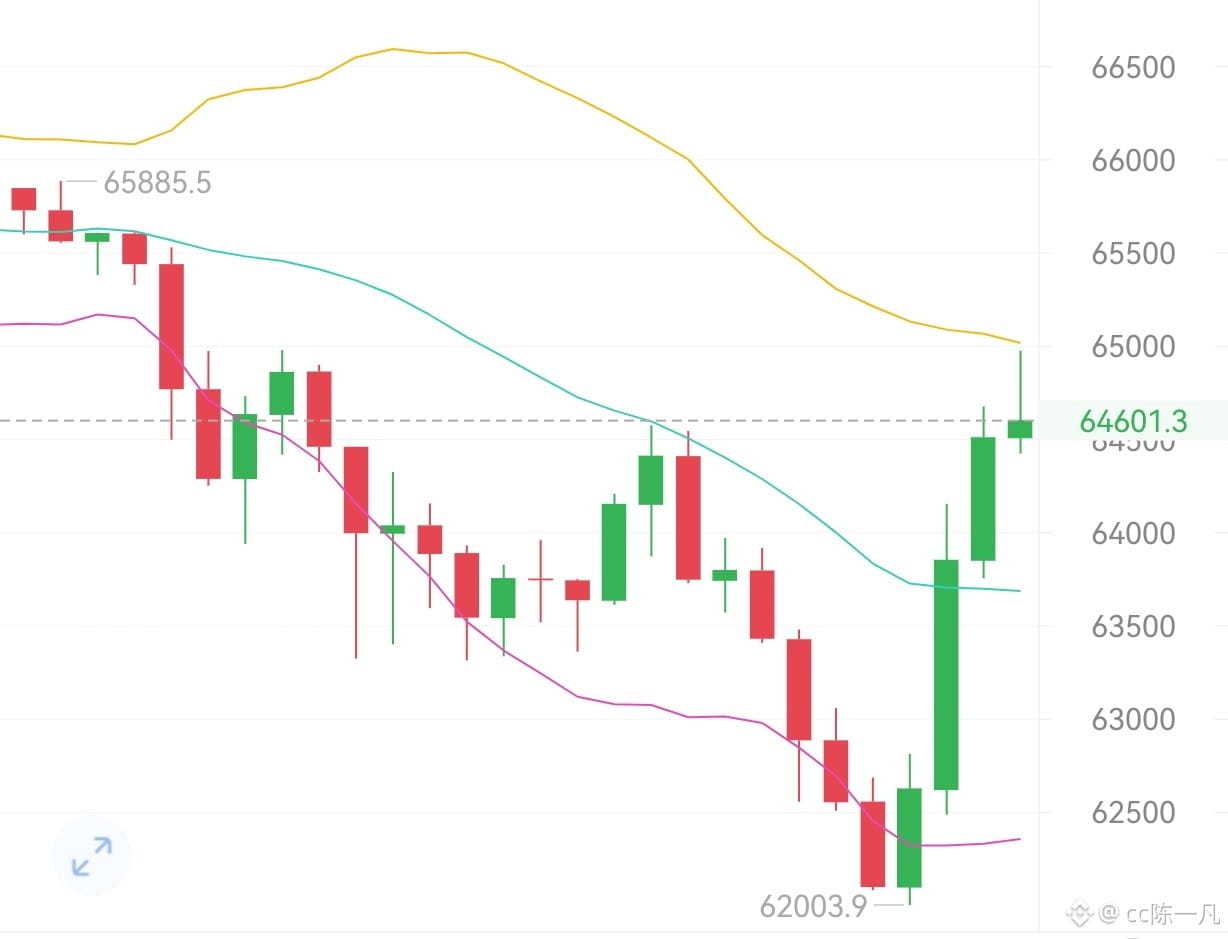
11.15 $BTC Analysis
It fell nearly 10,000 points over the weekend. Yifan also told everyone a few days ago that the monthly low would occur this month. Since the high of 74,858, the market has formed an extremely steep descending channel, with repeated large bearish candles breaking down. The bulls have put up no resistance.
Although the current candlestick has a relatively long lower wick (with a low of 61,956) and has bounced on declining volume, technically this is an “oversold recovery” or a “dead-cat bounce” after a sharp drop. In a one-way bearish trend, a lower wick often means there is temporary support below, but it cannot change the trend’s direction. Instead, it can easily lure retail traders into buying the dip, only for them to get trapped again.
· First support (weak): 62,000–61,956 (today’s new low and the round-number level). The price is seeing a slight bounce here, but in a strong bearish trend, this level could easily be broken again.
· Second support (strong): 60,000 (a psychological level) and around 58,000–59,000 (a previous high-volume trading zone).
· Resistance above (potential shorting zone on a rebound): 66,500–67,000 (near the intraday rebound high) and 69,150 (the Bollinger middle band). As long as the rebound fails to hold above the middle band, treat it as a bull trap. Yifan’s personal suggestion: open a short at 65,000–65,800, with targets at 63,800–63,000; if it breaks below, look lower to #BTC #ETH #BTC走势分析
It fell nearly 10,000 points over the weekend. Yifan also told everyone a few days ago that the monthly low would occur this month. Since the high of 74,858, the market has formed an extremely steep descending channel, with repeated large bearish candles breaking down. The bulls have put up no resistance.
Although the current candlestick has a relatively long lower wick (with a low of 61,956) and has bounced on declining volume, technically this is an “oversold recovery” or a “dead-cat bounce” after a sharp drop. In a one-way bearish trend, a lower wick often means there is temporary support below, but it cannot change the trend’s direction. Instead, it can easily lure retail traders into buying the dip, only for them to get trapped again.
· First support (weak): 62,000–61,956 (today’s new low and the round-number level). The price is seeing a slight bounce here, but in a strong bearish trend, this level could easily be broken again.
· Second support (strong): 60,000 (a psychological level) and around 58,000–59,000 (a previous high-volume trading zone).
· Resistance above (potential shorting zone on a rebound): 66,500–67,000 (near the intraday rebound high) and 69,150 (the Bollinger middle band). As long as the rebound fails to hold above the middle band, treat it as a bull trap. Yifan’s personal suggestion: open a short at 65,000–65,800, with targets at 63,800–63,000; if it breaks below, look lower to #BTC #ETH #BTC走势分析