
OGpi
971 Posts

OGpi
我来做交易是为了暴富的!不是来暴负的。
Frequent Trader
6.2 Years
16 Following
61 Followers
79 Liked
Posts
All
Quotes
$IOST $NEAR $ATOM
$IOST : IOST is currently focusing on a high-performance public chain, a payment chain, and the PayPIN line. The core goal is still to connect on-chain services, payment hardware, and cross-chain capital flows. The outlook depends on whether the 3.0 mainnet, PayFi scenarios, and real usage can keep up. This round on the board is very strong. The current price is about 0.0012718, up 41.88% in the past 24 hours, and up 16.64% over the last 6 hours. Trading volume is about 195 million USDT, and OI over the last 6 hours is up 20.84%. There is strength, but the level above 0.0013977 is already the intraday high. If you get a pullback, as long as it doesn’t lose 0.0010703, sentiment can continue to look bullish; if it drops back, don’t chase aggressively.
$NEAR : NEAR represents the public chain and chain abstraction narrative. For the past two years, it has been putting smart applications, cross-chain intents, and a smoother user experience front and center. To truly deliver, it depends on whether applications can make abstract accounts, cross-chain transactions, and the developer ecosystem generate retention. Current price is about 2.611, up 14.52% in the past 24 hours, and up 9.19% over the last 6 hours. Trading volume is about 370 million USDT, and OI over the last 6 hours is up 10.62%. Around 2.635 is already close to short-term resistance—only if it can stand above with increased volume can it be considered to stay strong. If it can’t hold 2.382, watch out for a wave of profit-taking.
$ATOM : ATOM is still Cosmos Hub’s native staking and governance asset. The underlying thesis is IBC, the interoperability ecosystem, and whether the Hub can keep capturing more cross-chain value. It’s not just about trading a single application; it’s about the activity level of the whole Interchain. Current price is about 1.94, up 11.11% in the past 24 hours, and up 4.98% over the last 6 hours. Trading volume is about 97.91 million USDT, and OI over the last 6 hours is up 4.49%. 2.034 is the immediate resistance. If it can hold steady above 1.845, it’s still relatively strong; if it breaks below that level, short-term chasing momentum will cool down.
#山寨异动 #合约观察 #Binance Square
$IOST : IOST is currently focusing on a high-performance public chain, a payment chain, and the PayPIN line. The core goal is still to connect on-chain services, payment hardware, and cross-chain capital flows. The outlook depends on whether the 3.0 mainnet, PayFi scenarios, and real usage can keep up. This round on the board is very strong. The current price is about 0.0012718, up 41.88% in the past 24 hours, and up 16.64% over the last 6 hours. Trading volume is about 195 million USDT, and OI over the last 6 hours is up 20.84%. There is strength, but the level above 0.0013977 is already the intraday high. If you get a pullback, as long as it doesn’t lose 0.0010703, sentiment can continue to look bullish; if it drops back, don’t chase aggressively.
$NEAR : NEAR represents the public chain and chain abstraction narrative. For the past two years, it has been putting smart applications, cross-chain intents, and a smoother user experience front and center. To truly deliver, it depends on whether applications can make abstract accounts, cross-chain transactions, and the developer ecosystem generate retention. Current price is about 2.611, up 14.52% in the past 24 hours, and up 9.19% over the last 6 hours. Trading volume is about 370 million USDT, and OI over the last 6 hours is up 10.62%. Around 2.635 is already close to short-term resistance—only if it can stand above with increased volume can it be considered to stay strong. If it can’t hold 2.382, watch out for a wave of profit-taking.
$ATOM : ATOM is still Cosmos Hub’s native staking and governance asset. The underlying thesis is IBC, the interoperability ecosystem, and whether the Hub can keep capturing more cross-chain value. It’s not just about trading a single application; it’s about the activity level of the whole Interchain. Current price is about 1.94, up 11.11% in the past 24 hours, and up 4.98% over the last 6 hours. Trading volume is about 97.91 million USDT, and OI over the last 6 hours is up 4.49%. 2.034 is the immediate resistance. If it can hold steady above 1.845, it’s still relatively strong; if it breaks below that level, short-term chasing momentum will cool down.
#山寨异动 #合约观察 #Binance Square
$SOPH $Hakimi
$SOPH : 0.012599—one sell-pressure wave in the 0.x band smashed the price down to 0.00563. The daily drawdown was 46.483%, and the low at 0.005115 is very close. Yet the trading volume rose to about 843 million USDT. This kind of volume–price combination looks more like concentrated liquidation, high-leverage clearing, and a short-term capital outflow wave layered together, rather than something you can force into a single news explanation. The project itself is a ZK Stack ecosystem network aimed at consumer-level applications. The goal is to integrate on-chain interactions into games, entertainment, and everyday digital experiences. SOPH is used for ecosystem incentives and network participation. At the moment, there is no clearly confirmable positive catalyst. Going forward, the key is whether new consumer-facing products, user growth, and decentralization progress can provide real data.⚠️
$Hakimi: Around 0.04719 it failed to hold, and the price fell back to 0.04277. Over the past 24 hours it is down 8.435%. The intraday low was 0.03866. Even after the rebound, the structure remains weak. Trading volume is about 22.24 million USDT. Its liquidity and depth are thinner than large-cap coins. After the launch of new futures contracts, sentiment shifts and profit-taking / position unwinds affect the price more directly. It is a Chinese-cat-meme coin on BNB Chain; its value support relies more on community-made content, music, and spread/virality rather than any technical infrastructure. The official also explicitly states there is no roadmap and no return expectations, so for now there is no clearly confirmable positive catalyst. The only option is to keep observing creator activity, community events, and the actual usage in the game lobby.
#合约跌幅榜 #Layer2 #Meme币 #市场分析 #risk management
$SOPH : 0.012599—one sell-pressure wave in the 0.x band smashed the price down to 0.00563. The daily drawdown was 46.483%, and the low at 0.005115 is very close. Yet the trading volume rose to about 843 million USDT. This kind of volume–price combination looks more like concentrated liquidation, high-leverage clearing, and a short-term capital outflow wave layered together, rather than something you can force into a single news explanation. The project itself is a ZK Stack ecosystem network aimed at consumer-level applications. The goal is to integrate on-chain interactions into games, entertainment, and everyday digital experiences. SOPH is used for ecosystem incentives and network participation. At the moment, there is no clearly confirmable positive catalyst. Going forward, the key is whether new consumer-facing products, user growth, and decentralization progress can provide real data.⚠️
$Hakimi: Around 0.04719 it failed to hold, and the price fell back to 0.04277. Over the past 24 hours it is down 8.435%. The intraday low was 0.03866. Even after the rebound, the structure remains weak. Trading volume is about 22.24 million USDT. Its liquidity and depth are thinner than large-cap coins. After the launch of new futures contracts, sentiment shifts and profit-taking / position unwinds affect the price more directly. It is a Chinese-cat-meme coin on BNB Chain; its value support relies more on community-made content, music, and spread/virality rather than any technical infrastructure. The official also explicitly states there is no roadmap and no return expectations, so for now there is no clearly confirmable positive catalyst. The only option is to keep observing creator activity, community events, and the actual usage in the game lobby.
#合约跌幅榜 #Layer2 #Meme币 #市场分析 #risk management
$BTC $ETH $KAT
The market isn’t rushing in one direction like a one-way surge; it feels more like money is waiting for CPI and the Fed before testing the waters. Since BTC hasn’t been knocked down by macro pressure, and ETH is also repairing alongside it, it suggests risk appetite is still intact—but the momentum-chasing sentiment hasn’t reached the mindless, all-in stage.
I focus on two things: whether BTC can keep holding steady in the high zone, and whether ETH can extend the rebound into a high-volume push higher. As long as these two main themes don’t break down, short-term funds will keep hunting for upside elasticity on the gainers board.
Today KAT surged into the front ranks of Binance spot USDT gainers, and the heat is definitely there. But these kinds of plays are most afraid of being pumped and then immediately drying up in volume. Only if it can hold sideways and then add volume does it count as having follow-through. If it spikes and then falls back too quickly, don’t treat the move as a trend.
#加密市场 #CPI #美联储 #Altcoin rotation
The market isn’t rushing in one direction like a one-way surge; it feels more like money is waiting for CPI and the Fed before testing the waters. Since BTC hasn’t been knocked down by macro pressure, and ETH is also repairing alongside it, it suggests risk appetite is still intact—but the momentum-chasing sentiment hasn’t reached the mindless, all-in stage.
I focus on two things: whether BTC can keep holding steady in the high zone, and whether ETH can extend the rebound into a high-volume push higher. As long as these two main themes don’t break down, short-term funds will keep hunting for upside elasticity on the gainers board.
Today KAT surged into the front ranks of Binance spot USDT gainers, and the heat is definitely there. But these kinds of plays are most afraid of being pumped and then immediately drying up in volume. Only if it can hold sideways and then add volume does it count as having follow-through. If it spikes and then falls back too quickly, don’t treat the move as a trend.
#加密市场 #CPI #美联储 #Altcoin rotation
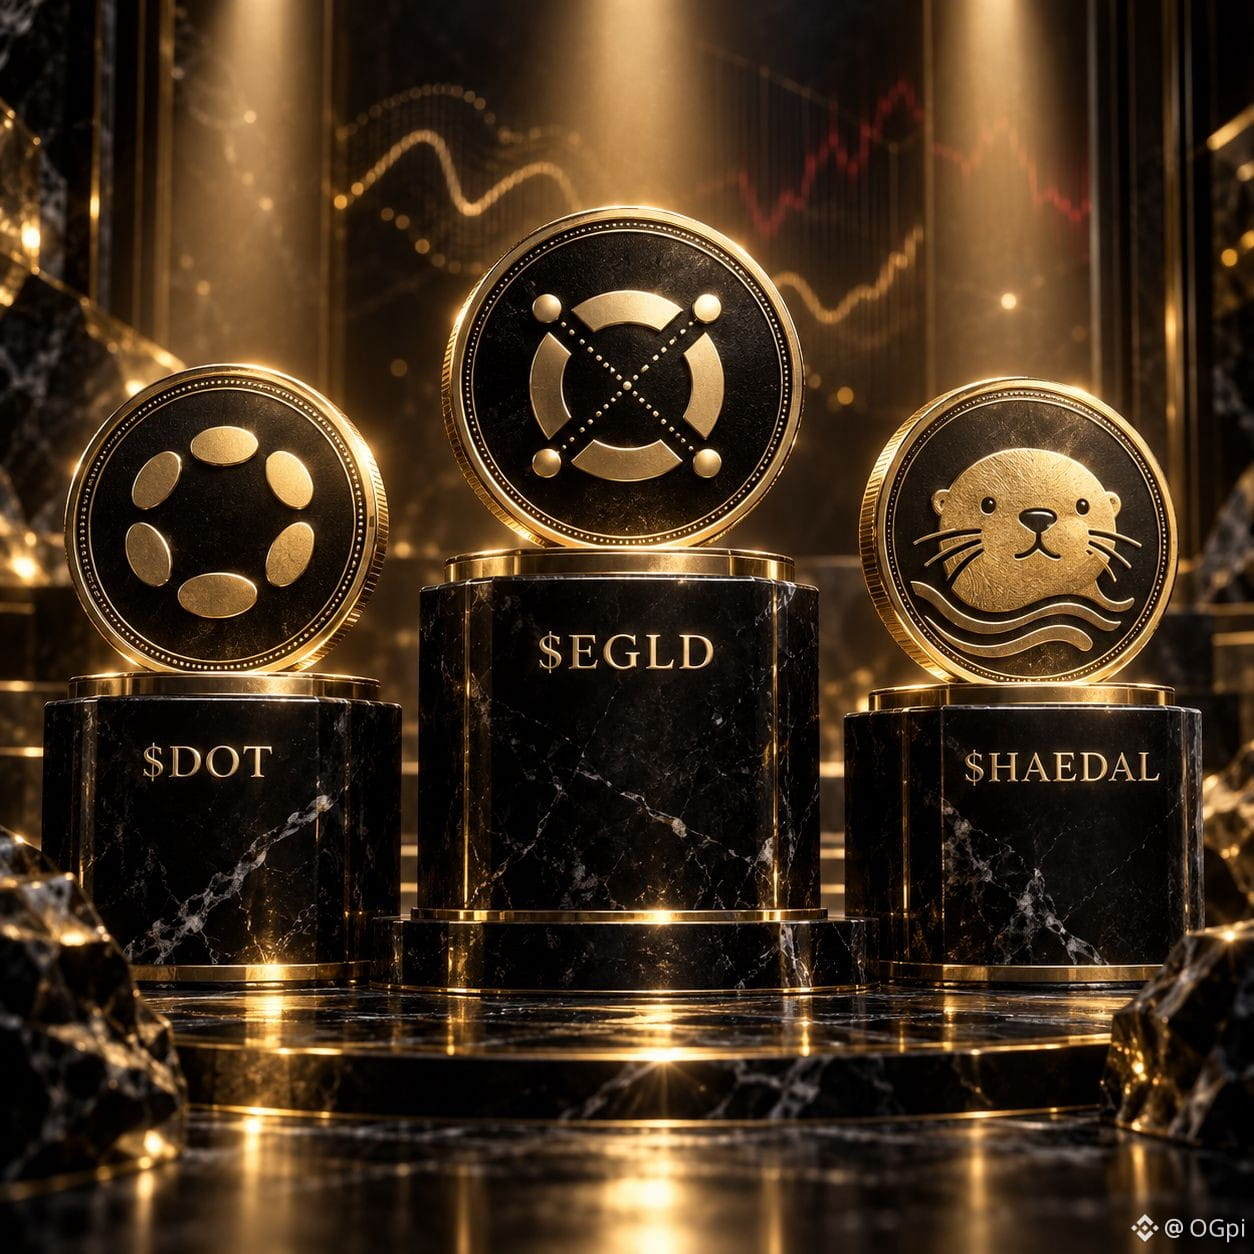
$DOT $EGLD $HAEDAL
$DOT : Polkadot focuses on cross-chain interoperability and shared security. DOT mainly revolves around network security, governance, and the flow of ecosystem resources. As for what comes next, it still depends on whether cross-chain applications, governance efficiency, and real developer activity can keep up. On the chart, DOT is trading at 1.1968, up 12.76% over the past 24 hours, with turnover of about 245 million USDT. The momentum is decent. However, it has pulled back 3.91% over the last 6 hours, suggesting that after rallying to 1.2833, some funds cashed out. For the short term, watch whether 1.1906 can hold. Only if it reclaims levels above 1.2634 can we say control has been regained.
$EGLD : MultiversX targets a high-throughput blockchain. The core is its sharded architecture, low-cost transactions, and an application ecosystem. EGLD is used for payments, staking, and maintaining network security. The outlook for this coin doesn’t rely on a single narrative—what matters is whether there is ongoing trading and application demand within its ecosystem. Currently, EGLD is at 5.062, up 7.11% in the past 24 hours. It has also advanced 4.47% over the last 6 hours, with volume around 11.97 million USDT. It’s not astonishing, but it’s enough to look at. 4.848 is the support zone for this round of consolidation, and around 5.204 is the overhead resistance. If volume can’t keep up, don’t assume the rebound will go too far.
$HAEDAL : Haedal is a liquid staking protocol on Sui. Users stake SUI and receive haSUI to participate in DeFi. The idea is to avoid the trade-off between staking rewards and liquidity—so you don’t have to choose one over the other. Whether HAEDAL can go far depends on the activity level of the Sui ecosystem, the use cases for haSUI, and the protocol’s security. The current price of HAEDAL is 0.01975, up 6.76% over the past 24 hours and up 3.57% over the last 6 hours. Turnover is about 17.59 million USDT. It’s close to the 0.01989 resistance level; 0.01897 is the short-term defense line. Only if it can build volume and stand above resistance is there a stronger reason to keep looking ahead.
#DOT #EGLD #HAEDAL #币安广场
$DOT : Polkadot focuses on cross-chain interoperability and shared security. DOT mainly revolves around network security, governance, and the flow of ecosystem resources. As for what comes next, it still depends on whether cross-chain applications, governance efficiency, and real developer activity can keep up. On the chart, DOT is trading at 1.1968, up 12.76% over the past 24 hours, with turnover of about 245 million USDT. The momentum is decent. However, it has pulled back 3.91% over the last 6 hours, suggesting that after rallying to 1.2833, some funds cashed out. For the short term, watch whether 1.1906 can hold. Only if it reclaims levels above 1.2634 can we say control has been regained.
$EGLD : MultiversX targets a high-throughput blockchain. The core is its sharded architecture, low-cost transactions, and an application ecosystem. EGLD is used for payments, staking, and maintaining network security. The outlook for this coin doesn’t rely on a single narrative—what matters is whether there is ongoing trading and application demand within its ecosystem. Currently, EGLD is at 5.062, up 7.11% in the past 24 hours. It has also advanced 4.47% over the last 6 hours, with volume around 11.97 million USDT. It’s not astonishing, but it’s enough to look at. 4.848 is the support zone for this round of consolidation, and around 5.204 is the overhead resistance. If volume can’t keep up, don’t assume the rebound will go too far.
$HAEDAL : Haedal is a liquid staking protocol on Sui. Users stake SUI and receive haSUI to participate in DeFi. The idea is to avoid the trade-off between staking rewards and liquidity—so you don’t have to choose one over the other. Whether HAEDAL can go far depends on the activity level of the Sui ecosystem, the use cases for haSUI, and the protocol’s security. The current price of HAEDAL is 0.01975, up 6.76% over the past 24 hours and up 3.57% over the last 6 hours. Turnover is about 17.59 million USDT. It’s close to the 0.01989 resistance level; 0.01897 is the short-term defense line. Only if it can build volume and stand above resistance is there a stronger reason to keep looking ahead.
#DOT #EGLD #HAEDAL #币安广场
$ZEC
$ZEC Over the past two days, it really made its presence felt. In the fixed pool, its amount and momentum are still hard to ignore.
Lately, people have been digging into the privacy-coin track. ZEC isn’t just a single line you pull and then it’s done—capital is also using “scarce narrative” to make its case. That’s the problem: when it heats up, it gets really hot; when it’s washing out, it won’t be gentle.
I’ll first see whether it can keep defending that strong trading range. As long as the volume is still there, the topic hasn’t really faded; if it pushes higher but nobody steps in to take over, then don’t treat every lift as a brand-new launch.
#ZEC #隐私币 #Crypto market
$ZEC Over the past two days, it really made its presence felt. In the fixed pool, its amount and momentum are still hard to ignore.
Lately, people have been digging into the privacy-coin track. ZEC isn’t just a single line you pull and then it’s done—capital is also using “scarce narrative” to make its case. That’s the problem: when it heats up, it gets really hot; when it’s washing out, it won’t be gentle.
I’ll first see whether it can keep defending that strong trading range. As long as the volume is still there, the topic hasn’t really faded; if it pushes higher but nobody steps in to take over, then don’t treat every lift as a brand-new launch.
#ZEC #隐私币 #Crypto market
$BTC
BTC now to watch most isn’t whether it can still push another leg higher, but whether spot capital has continued to take the baton.
Binance’s September research mentioned that during the August rally, spot activity moved faster than perpetuals; however, open interest measured in BTC actually declined. This kind of market is healthier than one driven purely by leverage pushing higher—but being “healthy” doesn’t mean it won’t pull back. Today, Binance spot BTC is around 78,575 USDT, down 0.78% in 24 hours. ETH is down 0.19%, SOL is basically sideways, which suggests the broader market is digesting the prior upswing and the expansion hasn’t fully opened yet.
I’ll first see whether the intraday low around 77.6k can hold. Then after BTC reclaims 79.5k, I’ll check whether ETH and SOL follow with synchronized volume expansion. Only when major coins move together does it look like a trend continuation; if BTC bounces but alts and trading volume don’t keep up, it’s more like rotation and switching hands at higher levels. Don’t interpret “spot-led” as “won’t drop.” If there’s a pullback with support, reassess in batches—chasing the first impulse isn’t worth it. Which do you care more about: whether ETFs keep seeing net inflows, or whether breadth across the market continues to expand?
#BTC #ETH #SOL #BinanceResearch
BTC now to watch most isn’t whether it can still push another leg higher, but whether spot capital has continued to take the baton.
Binance’s September research mentioned that during the August rally, spot activity moved faster than perpetuals; however, open interest measured in BTC actually declined. This kind of market is healthier than one driven purely by leverage pushing higher—but being “healthy” doesn’t mean it won’t pull back. Today, Binance spot BTC is around 78,575 USDT, down 0.78% in 24 hours. ETH is down 0.19%, SOL is basically sideways, which suggests the broader market is digesting the prior upswing and the expansion hasn’t fully opened yet.
I’ll first see whether the intraday low around 77.6k can hold. Then after BTC reclaims 79.5k, I’ll check whether ETH and SOL follow with synchronized volume expansion. Only when major coins move together does it look like a trend continuation; if BTC bounces but alts and trading volume don’t keep up, it’s more like rotation and switching hands at higher levels. Don’t interpret “spot-led” as “won’t drop.” If there’s a pullback with support, reassess in batches—chasing the first impulse isn’t worth it. Which do you care more about: whether ETFs keep seeing net inflows, or whether breadth across the market continues to expand?
#BTC #ETH #SOL #BinanceResearch

$FF $PROM $VET
$FF : Falcon Finance follows a DeFi-collateralized approach and an on-chain stablecoin route. The core idea is to use more liquid assets to mint USDf, and then have FF take on governance, incentives, and ecosystem rights. The outlook mainly depends on the USDf size, the stability of its revenue sources, and whether the risk parameters can withstand volatility. On the chart, FF has already refreshed to 0.1396, up 17.24% in 24 hours. In the last 6 hours, it’s also up 17.18%, with trading volume of about 33.31 million USDT. 0.14109 is the near-term resistance—don’t chase hard when it’s pressed against the highs. If it falls back below 0.11882, this short-term momentum will need to be discounted first.
$PROM : Prom is more aligned with the modular zkEVM Layer 2 narrative. The focus is to connect EVM and non-EVM ecosystems so they can interoperate. Next, we’ll need to see whether developers, games, and applications are truly willing to plug in. PROM is currently 6.075, up 7.62% in 24 hours and up 9.51% in the last 6 hours, with volume of about 27.29 million USDT. The coin’s strength today is solid, but resistance near 6.241 is the short-term high—don’t get too carried away when chasing. If 5.529 can’t hold, the earlier surge could easily turn into a giveback.
$VET : VeChain is building an enterprise-grade blockchain with real business use cases. Common directions include supply chain, product traceability, and sustainable data scenarios. VET handles value capture and ecosystem participation, while VTHO is used for on-chain transaction fees. The future upside isn’t just about the concept—it’s also about whether enterprise applications can keep being implemented in practice. VET is currently 0.007853, up 10.61% in 24 hours and up 6.97% in the last 6 hours. Contract volume is about 15.8 million USDT, and OI increased by 8.71% over the last 6 hours. 0.008041 is the upper edge—if it can’t break through, it may keep churning. 0.007338 is the support level I’m watching for acceptance.
#FalconFinance #Prom #VeChain #Altcoin
$FF : Falcon Finance follows a DeFi-collateralized approach and an on-chain stablecoin route. The core idea is to use more liquid assets to mint USDf, and then have FF take on governance, incentives, and ecosystem rights. The outlook mainly depends on the USDf size, the stability of its revenue sources, and whether the risk parameters can withstand volatility. On the chart, FF has already refreshed to 0.1396, up 17.24% in 24 hours. In the last 6 hours, it’s also up 17.18%, with trading volume of about 33.31 million USDT. 0.14109 is the near-term resistance—don’t chase hard when it’s pressed against the highs. If it falls back below 0.11882, this short-term momentum will need to be discounted first.
$PROM : Prom is more aligned with the modular zkEVM Layer 2 narrative. The focus is to connect EVM and non-EVM ecosystems so they can interoperate. Next, we’ll need to see whether developers, games, and applications are truly willing to plug in. PROM is currently 6.075, up 7.62% in 24 hours and up 9.51% in the last 6 hours, with volume of about 27.29 million USDT. The coin’s strength today is solid, but resistance near 6.241 is the short-term high—don’t get too carried away when chasing. If 5.529 can’t hold, the earlier surge could easily turn into a giveback.
$VET : VeChain is building an enterprise-grade blockchain with real business use cases. Common directions include supply chain, product traceability, and sustainable data scenarios. VET handles value capture and ecosystem participation, while VTHO is used for on-chain transaction fees. The future upside isn’t just about the concept—it’s also about whether enterprise applications can keep being implemented in practice. VET is currently 0.007853, up 10.61% in 24 hours and up 6.97% in the last 6 hours. Contract volume is about 15.8 million USDT, and OI increased by 8.71% over the last 6 hours. 0.008041 is the upper edge—if it can’t break through, it may keep churning. 0.007338 is the support level I’m watching for acceptance.
#FalconFinance #Prom #VeChain #Altcoin
$DOOD $BLUAI
$DOOD : 0.002379 — failed to hold. The price has returned to 0.001774; in one day it fell 19.69%. The low of 0.001664 is already not far off. Trading volume over the past 24 hours is about 106 million USDT. Even with increased volume pressing down, there hasn’t been a convincing rebound, suggesting short-term holders are loosening and contract capital is actively reducing risk. At this stage, there isn’t enough evidence to attribute this move to a single news item. DOOD is the ecosystem token of the Doodles brand, built around digital collectibles, content, IP, and community participation. The project story isn’t empty, but there is currently no clearly confirmable positive catalyst for the future. Going forward, watch whether the official team provides a clear timetable for new products, IP monetization, or token utility. The price first needs to reclaim and hold above 0.0020 before you can consider it shows some sincere intent to stop the decline. ⚠️
$BLUAI : It dropped from 0.012321 to 0.011028, down 10.43% in 24 hours. During the day it even traded as low as 0.009003, showing that when liquidity isn’t thick, price swings up and down can be very harsh. The approximately 20.39 million USDT trading volume isn’t deep. After the bounce, it still hasn’t reclaimed the intraday high, which looks more like capital leaving after a hot trend cools down and technical pressure building up—so it’s not advisable to force a news-based explanation. BLUAI corresponds to Bluwhale’s AI data and intelligent agent network; the token is used for ecosystem incentives and service coordination. Official materials can confirm the project direction, but there’s currently no clearly confirmable future positive catalyst. Next, track whether product usage, node participation, and actual token consumption are growing in sync; if token activity is mainly just contract volatility, the risk will remain very high. 🚨
#合约跌幅榜 #市场分析 #AI赛道 #risk management
$DOOD : 0.002379 — failed to hold. The price has returned to 0.001774; in one day it fell 19.69%. The low of 0.001664 is already not far off. Trading volume over the past 24 hours is about 106 million USDT. Even with increased volume pressing down, there hasn’t been a convincing rebound, suggesting short-term holders are loosening and contract capital is actively reducing risk. At this stage, there isn’t enough evidence to attribute this move to a single news item. DOOD is the ecosystem token of the Doodles brand, built around digital collectibles, content, IP, and community participation. The project story isn’t empty, but there is currently no clearly confirmable positive catalyst for the future. Going forward, watch whether the official team provides a clear timetable for new products, IP monetization, or token utility. The price first needs to reclaim and hold above 0.0020 before you can consider it shows some sincere intent to stop the decline. ⚠️
$BLUAI : It dropped from 0.012321 to 0.011028, down 10.43% in 24 hours. During the day it even traded as low as 0.009003, showing that when liquidity isn’t thick, price swings up and down can be very harsh. The approximately 20.39 million USDT trading volume isn’t deep. After the bounce, it still hasn’t reclaimed the intraday high, which looks more like capital leaving after a hot trend cools down and technical pressure building up—so it’s not advisable to force a news-based explanation. BLUAI corresponds to Bluwhale’s AI data and intelligent agent network; the token is used for ecosystem incentives and service coordination. Official materials can confirm the project direction, but there’s currently no clearly confirmable future positive catalyst. Next, track whether product usage, node participation, and actual token consumption are growing in sync; if token activity is mainly just contract volatility, the risk will remain very high. 🚨
#合约跌幅榜 #市场分析 #AI赛道 #risk management
$AKE $VELODROME
$AKE :This one really woke up the order book. It pulled from 24H to 29.07%, with trading volume of about 205 million USDT. The high touched 0.0200, which shows it’s not just some niche low-volume self-amusement—short-term capital is already抢速度 (racing for momentum). The most critical thing now is whether it can defend the 0.018 area after a high-volume push. If it can hold, the hype will keep building; if it surges and then falls back too quickly, don’t treat the impulse as a trend.
$VELODROME :Here, the涨幅 (increase) is 12.22%. The pace isn’t as explosive, but it was pushed from the 0.02441 low all the way to 0.02878. The high-low range is fairly wide, suggesting that funds are filling in the market’s expectations for its upside volatility. The question is also straightforward: the trading volume is about 4.51 million USDT, and liquidity depth isn’t as thick as in the leading positions. The order book can be swayed by one or two waves of orders—when chasing, look for pullback and support (承接), and don’t just get excited staring at green candles.
#Binance #合约交易 #涨幅观察 #Trading Plan
$AKE :This one really woke up the order book. It pulled from 24H to 29.07%, with trading volume of about 205 million USDT. The high touched 0.0200, which shows it’s not just some niche low-volume self-amusement—short-term capital is already抢速度 (racing for momentum). The most critical thing now is whether it can defend the 0.018 area after a high-volume push. If it can hold, the hype will keep building; if it surges and then falls back too quickly, don’t treat the impulse as a trend.
$VELODROME :Here, the涨幅 (increase) is 12.22%. The pace isn’t as explosive, but it was pushed from the 0.02441 low all the way to 0.02878. The high-low range is fairly wide, suggesting that funds are filling in the market’s expectations for its upside volatility. The question is also straightforward: the trading volume is about 4.51 million USDT, and liquidity depth isn’t as thick as in the leading positions. The order book can be swayed by one or two waves of orders—when chasing, look for pullback and support (承接), and don’t just get excited staring at green candles.
#Binance #合约交易 #涨幅观察 #Trading Plan
$BTC $ETH $QKC
The overall market is a bit awkward today. BTC has been pressured down from around 80,000, and ETH hasn’t pushed hard to break through either—this suggests that before the CPI and next week’s FOMC, funds still want to reduce leverage first and don’t want to pick sides early.
But the board isn’t entirely cold. Coins like QKC, which are at the front of the spot gainers leaderboard, are still moving—this indicates that short-term money hasn’t completely left; it’s just becoming more selective. If the large-cap coins can hold the lows of this pullback, altcoins can still bounce and play out repeatedly. If they can’t, don’t treat localized strength as a full-market trend.
At this point, I’d rather see support/continuation than chase too much. Before the news window, you need to watch carefully for coins that can show real volume—rallies without volume can easily turn into a quick spike followed by take-profit.
#BTC #ETH #山寨币 #CPI #Short-term trading
The overall market is a bit awkward today. BTC has been pressured down from around 80,000, and ETH hasn’t pushed hard to break through either—this suggests that before the CPI and next week’s FOMC, funds still want to reduce leverage first and don’t want to pick sides early.
But the board isn’t entirely cold. Coins like QKC, which are at the front of the spot gainers leaderboard, are still moving—this indicates that short-term money hasn’t completely left; it’s just becoming more selective. If the large-cap coins can hold the lows of this pullback, altcoins can still bounce and play out repeatedly. If they can’t, don’t treat localized strength as a full-market trend.
At this point, I’d rather see support/continuation than chase too much. Before the news window, you need to watch carefully for coins that can show real volume—rallies without volume can easily turn into a quick spike followed by take-profit.
#BTC #ETH #山寨币 #CPI #Short-term trading
$DASH $CHILLGUY
$DASH : 62.78—failed to hold; in the past 24 hours it fell 10.57%, slipping from 71.37 down to around 61.99. About 160 million USDT in trading volume expanded during the sell-off, increasing turnover in the downward move. There is no reliable evidence to pin this pullback on a single piece of news; it looks more like technical profit-taking after risk appetite contracted, with funds rotating out of highly volatile older coins. Dash is a PoW payment network characterized by masternodes, instant confirmations, and on-chain governance. The official roadmap lists Dash Platform v4.2 items such as account key transfers, compound indexing, and document ownership validation—targeting the third quarter of 2026. If executed as planned, it should improve the developer experience, but it does not equate to any price guarantee.💡
$CHILLGUY : 0.013712—down 11.61% in one day, sliding from 0.016440 to around 0.013066. Even with roughly 7.76 million USDT in trading volume, there hasn’t been clear evidence of meaningful support. Meme tokens like this often see their valuations compressed first when sentiment weakens; for now, it’s more like liquidity and short-term capital are ebbing rather than something that should be forcibly attributed. CHILLGUY is built around community propagation around the “Chill Guy” network image; the token is not a functional credential for a complex protocol. Public project materials mention integrating small-token interactions into an app focused on mindfulness themes and expanding community activities, but they don’t provide a near-term timeline. Whether it can be implemented and whether community hype sustains will be the key variables going forward.⚠️
#合约跌幅榜 #支付网络 #Meme风险 #Market analysis
$DASH : 62.78—failed to hold; in the past 24 hours it fell 10.57%, slipping from 71.37 down to around 61.99. About 160 million USDT in trading volume expanded during the sell-off, increasing turnover in the downward move. There is no reliable evidence to pin this pullback on a single piece of news; it looks more like technical profit-taking after risk appetite contracted, with funds rotating out of highly volatile older coins. Dash is a PoW payment network characterized by masternodes, instant confirmations, and on-chain governance. The official roadmap lists Dash Platform v4.2 items such as account key transfers, compound indexing, and document ownership validation—targeting the third quarter of 2026. If executed as planned, it should improve the developer experience, but it does not equate to any price guarantee.💡
$CHILLGUY : 0.013712—down 11.61% in one day, sliding from 0.016440 to around 0.013066. Even with roughly 7.76 million USDT in trading volume, there hasn’t been clear evidence of meaningful support. Meme tokens like this often see their valuations compressed first when sentiment weakens; for now, it’s more like liquidity and short-term capital are ebbing rather than something that should be forcibly attributed. CHILLGUY is built around community propagation around the “Chill Guy” network image; the token is not a functional credential for a complex protocol. Public project materials mention integrating small-token interactions into an app focused on mindfulness themes and expanding community activities, but they don’t provide a near-term timeline. Whether it can be implemented and whether community hype sustains will be the key variables going forward.⚠️
#合约跌幅榜 #支付网络 #Meme风险 #Market analysis
$SOPH $INJ $WLD
$SOPH : Sophon’s focus is the consumption chain for entertainment, gaming, and social applications. It puts low cost and high throughput first using the ZK Stack and the Validium architecture. Whether it can “break out” later still depends on real-world applications and user retention. The current price is 0.007045; over the past 24h it’s surged 69.19%, and over the last 6h it’s up 25.00%. Contract trading volume is 182 million USDT. The OI (open interest) over the last 6h increased by 44.01%—that’s capital chasing and hitting. Resistance above at 0.007177 is already very close; if it can’t break through, it’s easier to get shaken out first. Don’t lose 0.005415.
$INJ : Injective is an L1 geared toward financial applications. Its core is to provide underlying modules for derivatives, spot trading, RWA, and on-chain finance applications. The outlook mainly depends on whether ecosystem trading volume can keep building and whether real applications can continue to scale. Current price is 6.66; +21.29% over 24h, +2.01% over 1h, and +9.23% over 6h. Trading volume is 167 million USDT. Price is pressing near 6.696, which is running into strong overhead pressure—strong is indeed strong. But if 6.023 gets broken down, short-term sentiment will drop by a notch.
$WLD : World follows the identity network route via World ID and World App. It uses “proof of personhood” to solve online identity and bot problems. What comes next depends on regulatory compliance, privacy controversy, and how quickly applications get integrated. Current price is 0.4859; +17.97% over 24h. However, it fell 1.00% over 1h, and is still up only 5.22% over 6h. Trading volume is 568 million USDT. 0.5056 is the top resistance in this move, and 0.4614 is the short-term support/holding line with heavy volume. Don’t only look at the percentage gains—also watch the pullbacks.
#币安广场 #SOPH #INJ #WLD
$SOPH : Sophon’s focus is the consumption chain for entertainment, gaming, and social applications. It puts low cost and high throughput first using the ZK Stack and the Validium architecture. Whether it can “break out” later still depends on real-world applications and user retention. The current price is 0.007045; over the past 24h it’s surged 69.19%, and over the last 6h it’s up 25.00%. Contract trading volume is 182 million USDT. The OI (open interest) over the last 6h increased by 44.01%—that’s capital chasing and hitting. Resistance above at 0.007177 is already very close; if it can’t break through, it’s easier to get shaken out first. Don’t lose 0.005415.
$INJ : Injective is an L1 geared toward financial applications. Its core is to provide underlying modules for derivatives, spot trading, RWA, and on-chain finance applications. The outlook mainly depends on whether ecosystem trading volume can keep building and whether real applications can continue to scale. Current price is 6.66; +21.29% over 24h, +2.01% over 1h, and +9.23% over 6h. Trading volume is 167 million USDT. Price is pressing near 6.696, which is running into strong overhead pressure—strong is indeed strong. But if 6.023 gets broken down, short-term sentiment will drop by a notch.
$WLD : World follows the identity network route via World ID and World App. It uses “proof of personhood” to solve online identity and bot problems. What comes next depends on regulatory compliance, privacy controversy, and how quickly applications get integrated. Current price is 0.4859; +17.97% over 24h. However, it fell 1.00% over 1h, and is still up only 5.22% over 6h. Trading volume is 568 million USDT. 0.5056 is the top resistance in this move, and 0.4614 is the short-term support/holding line with heavy volume. Don’t only look at the percentage gains—also watch the pullbacks.
#币安广场 #SOPH #INJ #WLD
$XLM
$XLM Today this one is pretty noticeable; in the fixed pool it’s one of the few still pushing upward.
The market’s most afraid of this kind of setup is getting chased and then getting washed out. But this time XLM isn’t just riding the hype—people are starting to talk about payments, cross-border settlement, and asset on-chain again, and capital is willing to give it a bit of premium.
I’ll first see whether the strength can continue. If volume is still there, there’s still something to talk about. Once it spikes higher but the follow-through doesn’t keep up, don’t treat short-term momentum as a trend.
#XLM #Stellar #crypto market
$XLM Today this one is pretty noticeable; in the fixed pool it’s one of the few still pushing upward.
The market’s most afraid of this kind of setup is getting chased and then getting washed out. But this time XLM isn’t just riding the hype—people are starting to talk about payments, cross-border settlement, and asset on-chain again, and capital is willing to give it a bit of premium.
I’ll first see whether the strength can continue. If volume is still there, there’s still something to talk about. Once it spikes higher but the follow-through doesn’t keep up, don’t treat short-term momentum as a trend.
#XLM #Stellar #crypto market

$BTC $ETH $DOT
For Kazakhstan, the focus of this message isn’t “issuing stablecoins right away”; it’s that digital assets are starting to move into payment and investment infrastructure.
On September 4, Binance disclosed that it has signed three memorandums of understanding with Kazakhstan’s Ministry of Digital Development, the National Bank, and the Astana International Financial Centre. The areas include digital assets, payment infrastructure, and investment, and it also mentions exploring local stablecoins. Note: this is exploration and a cooperation framework, not a product that has already been launched.
The impact path for the crypto market is quite clear: regulators first draw the boundaries, then payment scenarios bring stablecoins and on-chain assets into real capital flows, and only afterward do trading volume, liquidity, and project valuations get to be validated. Right now in Binance spot markets, BTC is around $79,200, down 0.755% over the past 24 hours. ETH is around $2,495 and is basically moving sideways. The order book has not yet provided confirmation of a “full risk-on preference returning.”
Over the next 15 days, I’ll watch two things: whether there will be further regulatory details or implemented cooperation, and whether funds spread from BTC into payment and on-chain application-related assets. The news is big, but before products go live, don’t treat expectations as cash flow. For high-volatility, strong coins like $DOT , first see if the volume-and-price can keep going; if it pulls back, don’t chase it.
#BTC #ETH #数字资产 #stablecoin
For Kazakhstan, the focus of this message isn’t “issuing stablecoins right away”; it’s that digital assets are starting to move into payment and investment infrastructure.
On September 4, Binance disclosed that it has signed three memorandums of understanding with Kazakhstan’s Ministry of Digital Development, the National Bank, and the Astana International Financial Centre. The areas include digital assets, payment infrastructure, and investment, and it also mentions exploring local stablecoins. Note: this is exploration and a cooperation framework, not a product that has already been launched.
The impact path for the crypto market is quite clear: regulators first draw the boundaries, then payment scenarios bring stablecoins and on-chain assets into real capital flows, and only afterward do trading volume, liquidity, and project valuations get to be validated. Right now in Binance spot markets, BTC is around $79,200, down 0.755% over the past 24 hours. ETH is around $2,495 and is basically moving sideways. The order book has not yet provided confirmation of a “full risk-on preference returning.”
Over the next 15 days, I’ll watch two things: whether there will be further regulatory details or implemented cooperation, and whether funds spread from BTC into payment and on-chain application-related assets. The news is big, but before products go live, don’t treat expectations as cash flow. For high-volatility, strong coins like $DOT , first see if the volume-and-price can keep going; if it pulls back, don’t chase it.
#BTC #ETH #数字资产 #stablecoin

$PUMP $KAS $CAKE
$PUMP : Pump.fun is a token-issuing and trading platform on Solana. $PUMP is its official native token. Its value is more about whether the platform’s token-minting activity, trading volume, and ecosystem incentives can retain users. Right now it’s at 0.004535, up +12.67% over the past 24 hours, and still up +11.75% in the last 6 hours. Trading volume is about 307.6M USDT—momentum is solid. First watch 0.004647 to see if it can break higher with volume; don’t let it slip to 0.003992 on a pullback, otherwise this wave of sentiment will cool down.
$KAS : Kaspa follows a fair-launch PoW blockDAG route, focusing on faster block production and real-time confirmations. Next, we need to see whether miner safety, development tools, and real payments/on-chain usage can connect to sustained demand. Now at 0.03585, up +17.81% over 24 hours, and +5.35% in the last 6 hours, with trading volume around 16.9M USDT. Price is already close to the 0.03631 resistance zone. Strong is strong—but if it can’t push through and falls back to 0.03348, the second half can easily turn into profit-taking leading the move out.
$CAKE : PancakeSwap is a multi-chain DEX. $CAKE mainly revolves around trading, liquidity incentives, and governance. Long-term, we should watch whether platform trading activity, fee returns, and the token economics can continue improving. Currently 2.3425, up +5.48% in the past 24 hours, and +6.75% in the last 6 hours, with trading volume about 22.4M USDT. For the short term, look at 2.3552 as the resistance layer—only by holding above it can you say the momentum is sustained. If it can’t hold 2.1655, then the prior rally will need to reduce expectations by one tier.
#市场异动 #链上生态 #altcoins
$PUMP : Pump.fun is a token-issuing and trading platform on Solana. $PUMP is its official native token. Its value is more about whether the platform’s token-minting activity, trading volume, and ecosystem incentives can retain users. Right now it’s at 0.004535, up +12.67% over the past 24 hours, and still up +11.75% in the last 6 hours. Trading volume is about 307.6M USDT—momentum is solid. First watch 0.004647 to see if it can break higher with volume; don’t let it slip to 0.003992 on a pullback, otherwise this wave of sentiment will cool down.
$KAS : Kaspa follows a fair-launch PoW blockDAG route, focusing on faster block production and real-time confirmations. Next, we need to see whether miner safety, development tools, and real payments/on-chain usage can connect to sustained demand. Now at 0.03585, up +17.81% over 24 hours, and +5.35% in the last 6 hours, with trading volume around 16.9M USDT. Price is already close to the 0.03631 resistance zone. Strong is strong—but if it can’t push through and falls back to 0.03348, the second half can easily turn into profit-taking leading the move out.
$CAKE : PancakeSwap is a multi-chain DEX. $CAKE mainly revolves around trading, liquidity incentives, and governance. Long-term, we should watch whether platform trading activity, fee returns, and the token economics can continue improving. Currently 2.3425, up +5.48% in the past 24 hours, and +6.75% in the last 6 hours, with trading volume about 22.4M USDT. For the short term, look at 2.3552 as the resistance layer—only by holding above it can you say the momentum is sustained. If it can’t hold 2.1655, then the prior rally will need to reduce expectations by one tier.
#市场异动 #链上生态 #altcoins

$DOOD $ORCA
$DOOD : Today’s move really lit up the board. The 24H gain reached 50.20%, trading volume surged to about 116 million USDT, and it even hit a high of 0.00235 before still hovering near the upper range. The strength is real, but this kind of 59% intraday swing also shows very heavy turnover. In the short term, don’t just focus on the gains; whether it can keep holding around 0.0022 is the key.
$ORCA : This one isn’t as exaggerated, but the 18.32% rise plus about 69.83 million USDT in trading volume shows the money isn’t just dabbling. Intraday, it ran from 1.31 to 1.704, and the volatility range has already opened up. If it can still hold the 1.55 area on any pullback later, then the momentum is more likely to continue; otherwise, it could easily turn into a quick spike-and-dump.
#Binance #合约交易 #涨幅观察 #Risk control
$DOOD : Today’s move really lit up the board. The 24H gain reached 50.20%, trading volume surged to about 116 million USDT, and it even hit a high of 0.00235 before still hovering near the upper range. The strength is real, but this kind of 59% intraday swing also shows very heavy turnover. In the short term, don’t just focus on the gains; whether it can keep holding around 0.0022 is the key.
$ORCA : This one isn’t as exaggerated, but the 18.32% rise plus about 69.83 million USDT in trading volume shows the money isn’t just dabbling. Intraday, it ran from 1.31 to 1.704, and the volatility range has already opened up. If it can still hold the 1.55 area on any pullback later, then the momentum is more likely to continue; otherwise, it could easily turn into a quick spike-and-dump.
#Binance #合约交易 #涨幅观察 #Risk control
$BTC $ETH $TIA
The most critical point in the market over the past two days is not whether there is any positive news, but that funds around the 80,000 level have started to become more cautious. U.S. August nonfarm payrolls were stronger than expected, and CPI is still later this week, so in the short term there’s naturally less willingness to charge in recklessly.
BTC now looks more like it is waiting for the data to come out. Only if it can hold above 80,000 does it have a reason to keep lifting risk appetite; ETH has not broken down yet, but if the broader market keeps grinding sideways, any catch-up rally could turn into repeated shakeouts.
TIA making it into Binance spot’s top ten gainers today shows that altcoin sentiment is still finding localized outlets. The problem is that this kind of rotation comes quickly and leaves quickly too, so before chasing it, first see whether pullbacks have support.
#BTC #ETH #TIA #宏观 #Market Analysis
The most critical point in the market over the past two days is not whether there is any positive news, but that funds around the 80,000 level have started to become more cautious. U.S. August nonfarm payrolls were stronger than expected, and CPI is still later this week, so in the short term there’s naturally less willingness to charge in recklessly.
BTC now looks more like it is waiting for the data to come out. Only if it can hold above 80,000 does it have a reason to keep lifting risk appetite; ETH has not broken down yet, but if the broader market keeps grinding sideways, any catch-up rally could turn into repeated shakeouts.
TIA making it into Binance spot’s top ten gainers today shows that altcoin sentiment is still finding localized outlets. The problem is that this kind of rotation comes quickly and leaves quickly too, so before chasing it, first see whether pullbacks have support.
#BTC #ETH #TIA #宏观 #Market Analysis

$TAO $INJ $CFG
$TAO : Bittensor is building an open intelligence network. Different subnets provide digital services such as compute, inference, storage, and prediction. TAO is used to distribute incentives to contributors, and it is also used in staking and subnet weighting. Its outlook mainly depends on whether there is real demand for the subnets, whether staking capital is willing to stay, and whether the intelligent computing narrative can continue to gain market approval. On the market side, TAO is currently at 272.01, up 14.82% over the past 24 hours, with another 1.78% gain over 6 hours and a 3.87% rise in the last hour. Trading volume has reached 274 million USDT. It is now pressing against resistance around 272.37. 260.01 is the short-term support level I would watch. If it holds, it can keep fluctuating; if it falls back below, don’t treat this move as a one-way trend.
$INJ : Injective is an application-specific chain focused on on-chain finance. INJ mainly revolves around staking, governance, network security, and trading scenarios within the ecosystem. When the market prices it, it usually looks at DeFi activity, derivatives ecosystem, fees, and burn expectations. The latest price is 5.528, up 8.10% over 24 hours and 7.09% over 6 hours, with 65.11 million USDT in trading volume and a 6.64% increase in OI over 6 hours. This shows it is not just price moving; positions are also flowing in. The upper level at 5.53 is already very close, and 5.12 is the dividing line between strength and weakness for this move. If it cannot hold above, it may turn into a breakout followed by distribution.
$CFG : Centrifuge’s main theme is RWA, turning off-chain assets such as private credit and bonds into on-chain pools. CFG is more about governance and ecosystem fees, and the next thing to watch is whether asset supply, compliance channels, and multi-chain pools can continue to expand. CFG is currently at 0.1173, up 13.88% over 24 hours and 10.09% over 6 hours, with 5.66 million USDT in trading volume. It is not a large-cap name, but the move is very clear. 0.1179 is the immediate resistance, and 0.1056 is the short-term support. Only if volume expands does it look like follow-through; if it breaks upward on shrinking volume, I would not get too excited.
#山寨币 #币安合约 #RWA #On-chain Finance
$TAO : Bittensor is building an open intelligence network. Different subnets provide digital services such as compute, inference, storage, and prediction. TAO is used to distribute incentives to contributors, and it is also used in staking and subnet weighting. Its outlook mainly depends on whether there is real demand for the subnets, whether staking capital is willing to stay, and whether the intelligent computing narrative can continue to gain market approval. On the market side, TAO is currently at 272.01, up 14.82% over the past 24 hours, with another 1.78% gain over 6 hours and a 3.87% rise in the last hour. Trading volume has reached 274 million USDT. It is now pressing against resistance around 272.37. 260.01 is the short-term support level I would watch. If it holds, it can keep fluctuating; if it falls back below, don’t treat this move as a one-way trend.
$INJ : Injective is an application-specific chain focused on on-chain finance. INJ mainly revolves around staking, governance, network security, and trading scenarios within the ecosystem. When the market prices it, it usually looks at DeFi activity, derivatives ecosystem, fees, and burn expectations. The latest price is 5.528, up 8.10% over 24 hours and 7.09% over 6 hours, with 65.11 million USDT in trading volume and a 6.64% increase in OI over 6 hours. This shows it is not just price moving; positions are also flowing in. The upper level at 5.53 is already very close, and 5.12 is the dividing line between strength and weakness for this move. If it cannot hold above, it may turn into a breakout followed by distribution.
$CFG : Centrifuge’s main theme is RWA, turning off-chain assets such as private credit and bonds into on-chain pools. CFG is more about governance and ecosystem fees, and the next thing to watch is whether asset supply, compliance channels, and multi-chain pools can continue to expand. CFG is currently at 0.1173, up 13.88% over 24 hours and 10.09% over 6 hours, with 5.66 million USDT in trading volume. It is not a large-cap name, but the move is very clear. 0.1179 is the immediate resistance, and 0.1056 is the short-term support. Only if volume expands does it look like follow-through; if it breaks upward on shrinking volume, I would not get too excited.
#山寨币 #币安合约 #RWA #On-chain Finance

$ZEC
$ZEC this one is very eye-catching today, with trading volume and gains ranking near the top in the fixed pool. Once the market heats up, the old privacy-coin narrative easily gets brought out again to be pumped.
But for a move like this, don’t just look at the green candles; the key is whether there are buyers on the pullback. If it can hold sideways at high levels, that really means it’s not just a one-wave sentiment firework.
I’ll be watching volume and support on retracements. If it’s truly strong, then it’s strong—but whether to chase is another matter. #ZEC
$ZEC this one is very eye-catching today, with trading volume and gains ranking near the top in the fixed pool. Once the market heats up, the old privacy-coin narrative easily gets brought out again to be pumped.
But for a move like this, don’t just look at the green candles; the key is whether there are buyers on the pullback. If it can hold sideways at high levels, that really means it’s not just a one-wave sentiment firework.
I’ll be watching volume and support on retracements. If it’s truly strong, then it’s strong—but whether to chase is another matter. #ZEC
PPI, CPI, and FOMC are all coming one after another, and mid-September is not about guessing up or down; it is about seeing how the market reprices interest rates.
First, PPI on September 10, then CPI on September 11, and FOMC on September 15–16. Right now on the Binance market, BTC is at $79,776, down slightly 0.335% over 24 hours; ETH is at $2,493.22, up slightly 0.504%; SOL is at $106.31, rising even more, up 2.113%. This shows that funds are not leaving all at once; rotation is still happening, but BTC does not have a strong sense of direction.
I will be watching two things: after softer data, can BTC reclaim its pre-event high; and can SOL’s strength spread to ETH, rather than being the only line holding up the market. If CPI/PPI come in hot and BTC falls back below the intraday low, risk appetite may contract first; if the data is mild and the FOMC tone does not turn noticeably hawkish, then a pullback finding support will be more interesting.
This window is not suitable for making a hard directional bet based on a single data point. First wait for volatility to play out, then look for confirmation in price and volume. Which are you more focused on, CPI or FOMC?
$BTC $ETH $SOL #宏观 #CryptoMarket
First, PPI on September 10, then CPI on September 11, and FOMC on September 15–16. Right now on the Binance market, BTC is at $79,776, down slightly 0.335% over 24 hours; ETH is at $2,493.22, up slightly 0.504%; SOL is at $106.31, rising even more, up 2.113%. This shows that funds are not leaving all at once; rotation is still happening, but BTC does not have a strong sense of direction.
I will be watching two things: after softer data, can BTC reclaim its pre-event high; and can SOL’s strength spread to ETH, rather than being the only line holding up the market. If CPI/PPI come in hot and BTC falls back below the intraday low, risk appetite may contract first; if the data is mild and the FOMC tone does not turn noticeably hawkish, then a pullback finding support will be more interesting.
This window is not suitable for making a hard directional bet based on a single data point. First wait for volatility to play out, then look for confirmation in price and volume. Which are you more focused on, CPI or FOMC?
$BTC $ETH $SOL #宏观 #CryptoMarket

Log in to explore more content