
币圈牛牛说
2.2k Posts

币圈牛牛说
Report
Block User
每一个交易者都是一个传奇
7 Following
91 Followers
113 Liked
Posts
All
Quotes
Videos
·
--
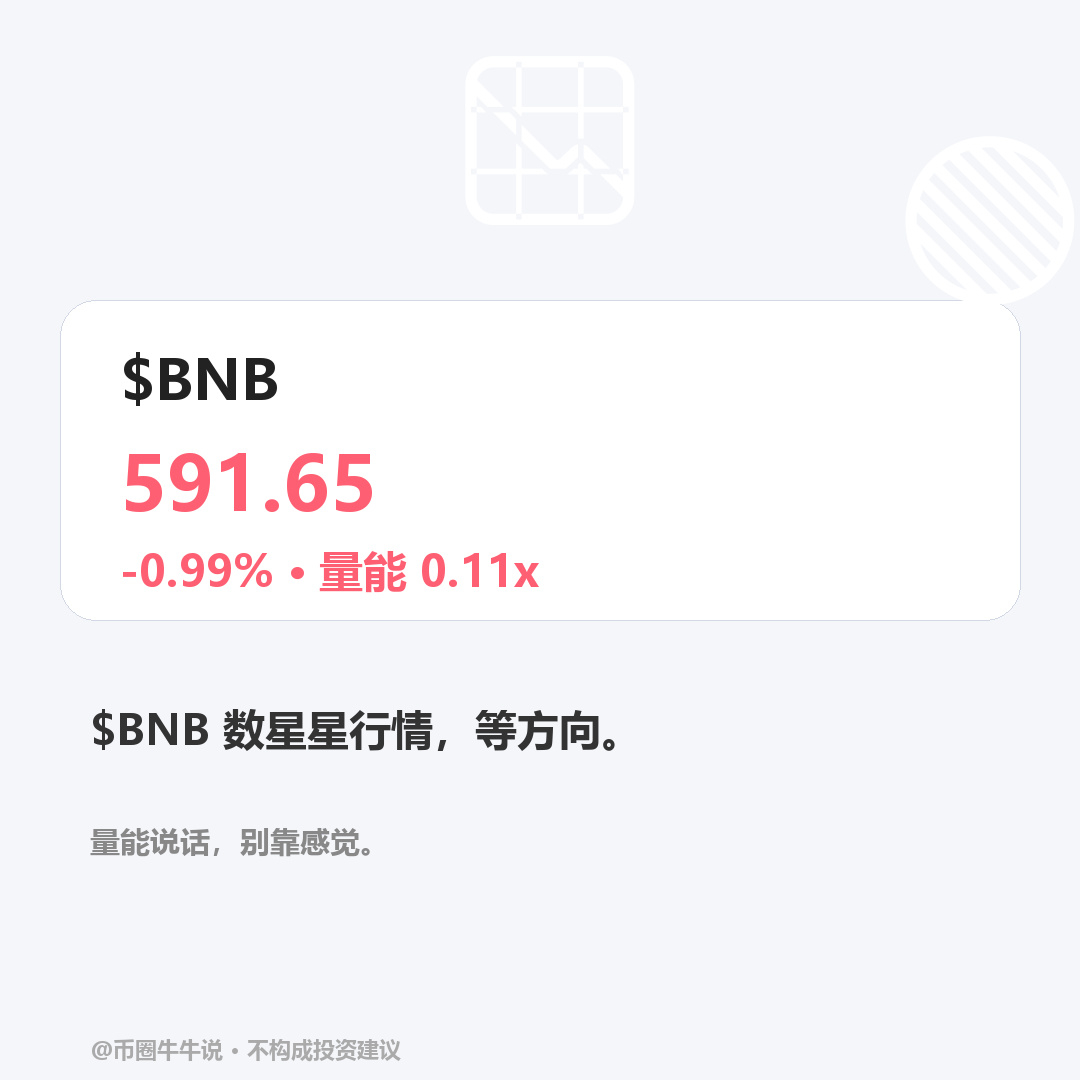
Short $BNB. The one-hour and four-hour timeframes are both showing weakness, and the rebound isn't strong enough to reverse the structure. When price fails to get past the previous high in a position like this, the direction is still down. Don't mistake a recovery for a reversal; until the timeframes align, the short-side trade isn't over.
Current price: 591.65. First target: 586. Invalidation level: 598.7. If the price moves above 598.7, this trade is invalidated; only when it drops to 586 is this call considered complete. A rebound along the way doesn't count as a confirmed move—it just gives the bears room. Clearly defining where to admit you're wrong helps prevent repeatedly changing your stance in choppy conditions.
The 24-hour change is -0.99%. The direction is indeed down, but trading volume has clearly failed to keep up, with participation too low for this to look like a valid breakout. Price moved, but volume didn't. The continuation of this kind of move should be viewed with caution: weakness on declining volume is more likely to turn into back-and-forth chop than a decisive leg down.
A weak structure on declining volume can't support a substantial rebound; any bounce is just followed by more grinding lower. This is not investment advice.
Related asset: $BNB
#BNB #币安币
Short $BNB. The one-hour and four-hour timeframes are both showing weakness, and the rebound isn't strong enough to reverse the structure. When price fails to get past the previous high in a position like this, the direction is still down. Don't mistake a recovery for a reversal; until the timeframes align, the short-side trade isn't over.
Current price: 591.65. First target: 586. Invalidation level: 598.7. If the price moves above 598.7, this trade is invalidated; only when it drops to 586 is this call considered complete. A rebound along the way doesn't count as a confirmed move—it just gives the bears room. Clearly defining where to admit you're wrong helps prevent repeatedly changing your stance in choppy conditions.
The 24-hour change is -0.99%. The direction is indeed down, but trading volume has clearly failed to keep up, with participation too low for this to look like a valid breakout. Price moved, but volume didn't. The continuation of this kind of move should be viewed with caution: weakness on declining volume is more likely to turn into back-and-forth chop than a decisive leg down.
A weak structure on declining volume can't support a substantial rebound; any bounce is just followed by more grinding lower. This is not investment advice.
Related asset: $BNB
#BNB #币安币
Current price: 591.65. First target: 586. Invalidation level: 598.7. If the price moves above 598.7, this trade is invalidated; only when it drops to 586 is this call considered complete. A rebound along the way doesn't count as a confirmed move—it just gives the bears room. Clearly defining where to admit you're wrong helps prevent repeatedly changing your stance in choppy conditions.
The 24-hour change is -0.99%. The direction is indeed down, but trading volume has clearly failed to keep up, with participation too low for this to look like a valid breakout. Price moved, but volume didn't. The continuation of this kind of move should be viewed with caution: weakness on declining volume is more likely to turn into back-and-forth chop than a decisive leg down.
A weak structure on declining volume can't support a substantial rebound; any bounce is just followed by more grinding lower. This is not investment advice.
Related asset: $BNB
#BNB #币安币
58
·
--
Article
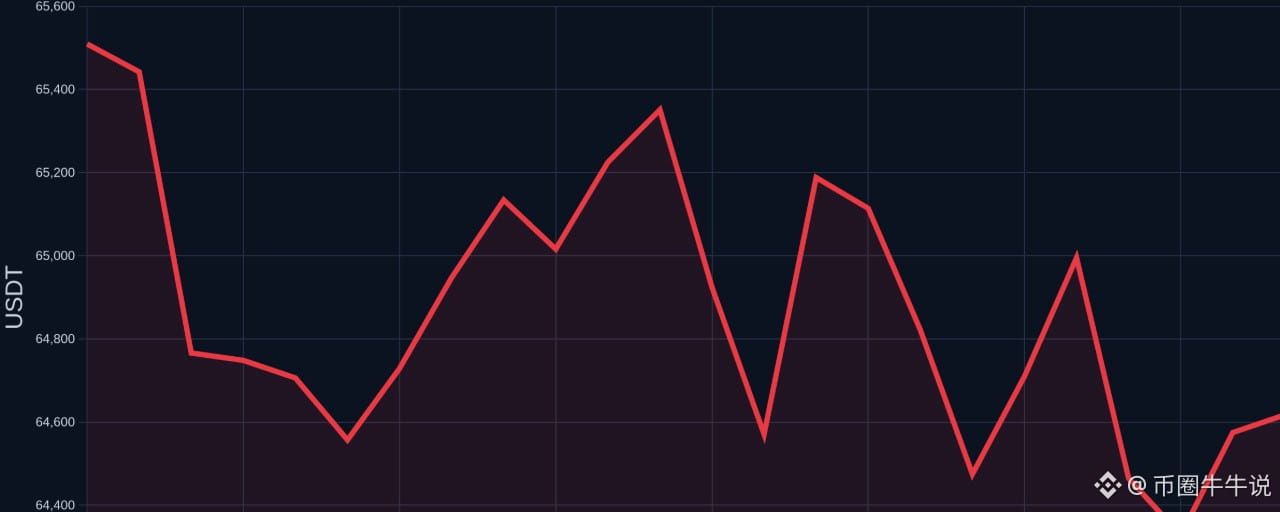
$BTC trend is weak, but trading volume is shrinking—this move is losing credibility$BTC is now at 64,570.96 USDT, down 1.45% over the past 24 hours, with an intraday low of 64,128 and high of 65,800.75. The 1-hour trend is weak, and the 4-hour trend is weak. Trading participation is only 0.24x. The price has moved, but trading volume has failed to keep up. This divergence reduces the credibility of the current trend.
Price-volume alignment is one of the most fundamental aspects of technical analysis. Price indicates direction, while trading volume reflects participation. When the price has made a significant move but trading volume is well below average, the continuation of either a breakout or a decline should be viewed with caution. Low participation means only some market participants are driving the price, without broad market consensus. In such cases, looking only at the color of candlesticks can easily lead you to overestimate the trend's staying power and mistake a test move for a genuine breakout.
$BTC trend is weak, but trading volume is shrinking—this move is losing credibility
$BTC is now at 64,570.96 USDT, down 1.45% over the past 24 hours, with an intraday low of 64,128 and high of 65,800.75. The 1-hour trend is weak, and the 4-hour trend is weak. Trading participation is only 0.24x. The price has moved, but trading volume has failed to keep up. This divergence reduces the credibility of the current trend.
Price-volume alignment is one of the most fundamental aspects of technical analysis. Price indicates direction, while trading volume reflects participation. When the price has made a significant move but trading volume is well below average, the continuation of either a breakout or a decline should be viewed with caution. Low participation means only some market participants are driving the price, without broad market consensus. In such cases, looking only at the color of candlesticks can easily lead you to overestimate the trend's staying power and mistake a test move for a genuine breakout.
Price-volume alignment is one of the most fundamental aspects of technical analysis. Price indicates direction, while trading volume reflects participation. When the price has made a significant move but trading volume is well below average, the continuation of either a breakout or a decline should be viewed with caution. Low participation means only some market participants are driving the price, without broad market consensus. In such cases, looking only at the color of candlesticks can easily lead you to overestimate the trend's staying power and mistake a test move for a genuine breakout.
21
·
--
Short $DOGE. Two timeframes are aligned to the downside; the setup is confirmed if the rebound fails. Both the 1-hour and 4-hour charts show bearish signals. Price is holding at 0.05829, but the 1-hour RSI is only 43 and the 4-hour RSI is 34. Oversold only records that the price has fallen; it doesn’t mean the decline is over. Current price: 0.05829. Target: 0.0581 (first target); a break below 0.06012 invalidates the setup. The price is down -0.60% over 24 hours, while the volume ratio is just 0.0766%. In this kind of situation, focusing only on candle colors can easily lead you to overestimate the continuation. The price has already moved, but trading volume hasn’t followed. In this kind of situation, focusing only on candle colors can easily lead you to overestimate the continuation. The price has already moved, but trading volume hasn’t followed. In this kind of situation, focusing only on candle colors can easily lead you to overestimate the continuation. This is not investment advice.
Related coin: $DOGE
#DOGE #Dogecoin
Short $DOGE. Two timeframes are aligned to the downside; the setup is confirmed if the rebound fails. Both the 1-hour and 4-hour charts show bearish signals. Price is holding at 0.05829, but the 1-hour RSI is only 43 and the 4-hour RSI is 34. Oversold only records that the price has fallen; it doesn’t mean the decline is over. Current price: 0.05829. Target: 0.0581 (first target); a break below 0.06012 invalidates the setup. The price is down -0.60% over 24 hours, while the volume ratio is just 0.0766%. In this kind of situation, focusing only on candle colors can easily lead you to overestimate the continuation. The price has already moved, but trading volume hasn’t followed. In this kind of situation, focusing only on candle colors can easily lead you to overestimate the continuation. The price has already moved, but trading volume hasn’t followed. In this kind of situation, focusing only on candle colors can easily lead you to overestimate the continuation. This is not investment advice.
Related coin: $DOGE
#DOGE #Dogecoin
Related coin: $DOGE
#DOGE #Dogecoin

111
·
--
Article
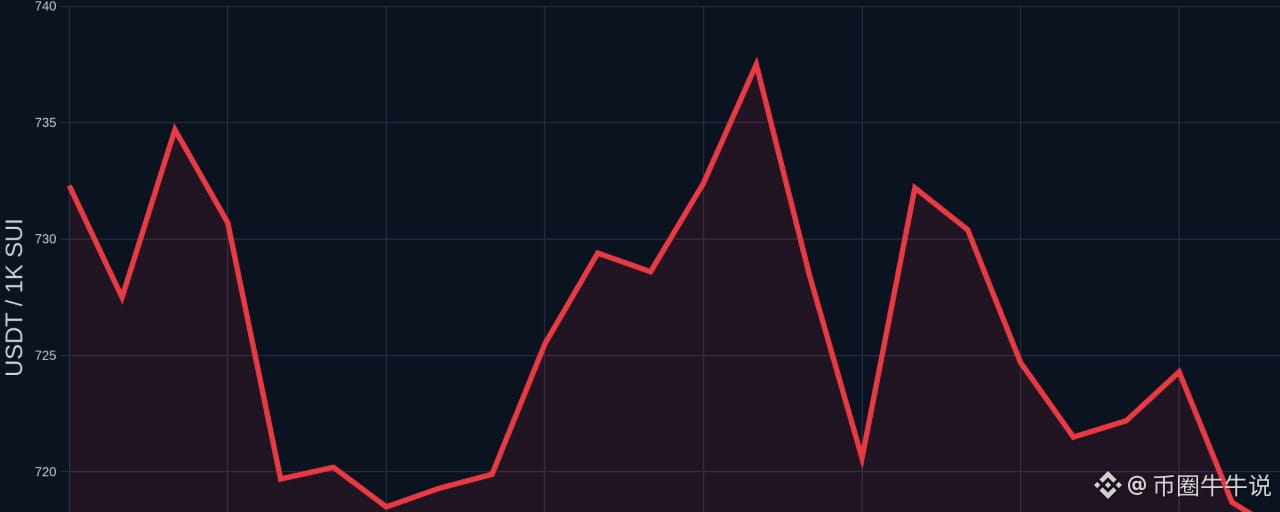
$SUI Price-Volume Divergence: Weakness Amid Low Participation$SUI is now at 0.7162 USDT, down 2.10% over 24 hours, with an intraday high and low of 0.7401 and 0.7141. The 1-hour direction is weak, the 4-hour direction is weak, and trading participation is 0.40x. The price has moved, but volume has not kept up. This divergence reduces confidence in the current direction.
My view: the direction is still there for now, but low participation reduces confidence in this move.
The basic logic of price-volume confirmation is that price shows the direction, while volume shows participation. If the price has already moved but volume is significantly below average, the continuation of either a decline or a breakout should be viewed with caution. The easiest trap to fall into is looking only at the color of the candlesticks without considering participation, and mistaking a probe for a genuine start. Price movements without volume confirmation look more like an emotional tail end than the beginning of a trend.
$SUI Price-Volume Divergence: Weakness Amid Low Participation
$SUI is now at 0.7162 USDT, down 2.10% over 24 hours, with an intraday high and low of 0.7401 and 0.7141. The 1-hour direction is weak, the 4-hour direction is weak, and trading participation is 0.40x. The price has moved, but volume has not kept up. This divergence reduces confidence in the current direction.
My view: the direction is still there for now, but low participation reduces confidence in this move.
The basic logic of price-volume confirmation is that price shows the direction, while volume shows participation. If the price has already moved but volume is significantly below average, the continuation of either a decline or a breakout should be viewed with caution. The easiest trap to fall into is looking only at the color of the candlesticks without considering participation, and mistaking a probe for a genuine start. Price movements without volume confirmation look more like an emotional tail end than the beginning of a trend.
My view: the direction is still there for now, but low participation reduces confidence in this move.
The basic logic of price-volume confirmation is that price shows the direction, while volume shows participation. If the price has already moved but volume is significantly below average, the continuation of either a decline or a breakout should be viewed with caution. The easiest trap to fall into is looking only at the color of the candlesticks without considering participation, and mistaking a probe for a genuine start. Price movements without volume confirmation look more like an emotional tail end than the beginning of a trend.
231
·
--
Short $BTC.
Two timeframes are aligned to the downside; the setup holds if the rebound fails. Both the 1-hour and 4-hour charts are signaling weakness. The price has held at 64,722.34, but the 1-hour RSI is only 49.91 and the 4-hour RSI is 37.73. Low participation casts doubt on the reliability of this move.
Current price: 64,722.34. Target: 64,257.65 (first target); a break above 66,132.01 invalidates the setup. If the price rebounds but fails to get past 64,257.65, the bears will regain control. If it reaches 66,132.01, this bearish move is completely invalidated.
The price is up +1.03% over 24 hours, but both the 1-hour and 4-hour timeframes are weak. The direction looks clear, yet volume has not confirmed it. The price has already moved—why hasn’t trading volume followed?
When the price moves but volume doesn’t follow, focusing only on candlestick colors can easily lead you to overestimate the move’s staying power. This is not investment advice.
Related asset: $BTC
#BTC #Bitcoin
Short $BTC.
Two timeframes are aligned to the downside; the setup holds if the rebound fails. Both the 1-hour and 4-hour charts are signaling weakness. The price has held at 64,722.34, but the 1-hour RSI is only 49.91 and the 4-hour RSI is 37.73. Low participation casts doubt on the reliability of this move.
Current price: 64,722.34. Target: 64,257.65 (first target); a break above 66,132.01 invalidates the setup. If the price rebounds but fails to get past 64,257.65, the bears will regain control. If it reaches 66,132.01, this bearish move is completely invalidated.
The price is up +1.03% over 24 hours, but both the 1-hour and 4-hour timeframes are weak. The direction looks clear, yet volume has not confirmed it. The price has already moved—why hasn’t trading volume followed?
When the price moves but volume doesn’t follow, focusing only on candlestick colors can easily lead you to overestimate the move’s staying power. This is not investment advice.
Related asset: $BTC
#BTC #Bitcoin
Two timeframes are aligned to the downside; the setup holds if the rebound fails. Both the 1-hour and 4-hour charts are signaling weakness. The price has held at 64,722.34, but the 1-hour RSI is only 49.91 and the 4-hour RSI is 37.73. Low participation casts doubt on the reliability of this move.
Current price: 64,722.34. Target: 64,257.65 (first target); a break above 66,132.01 invalidates the setup. If the price rebounds but fails to get past 64,257.65, the bears will regain control. If it reaches 66,132.01, this bearish move is completely invalidated.
The price is up +1.03% over 24 hours, but both the 1-hour and 4-hour timeframes are weak. The direction looks clear, yet volume has not confirmed it. The price has already moved—why hasn’t trading volume followed?
When the price moves but volume doesn’t follow, focusing only on candlestick colors can easily lead you to overestimate the move’s staying power. This is not investment advice.
Related asset: $BTC
#BTC #Bitcoin

22
·
--
Stay short on $ETH.
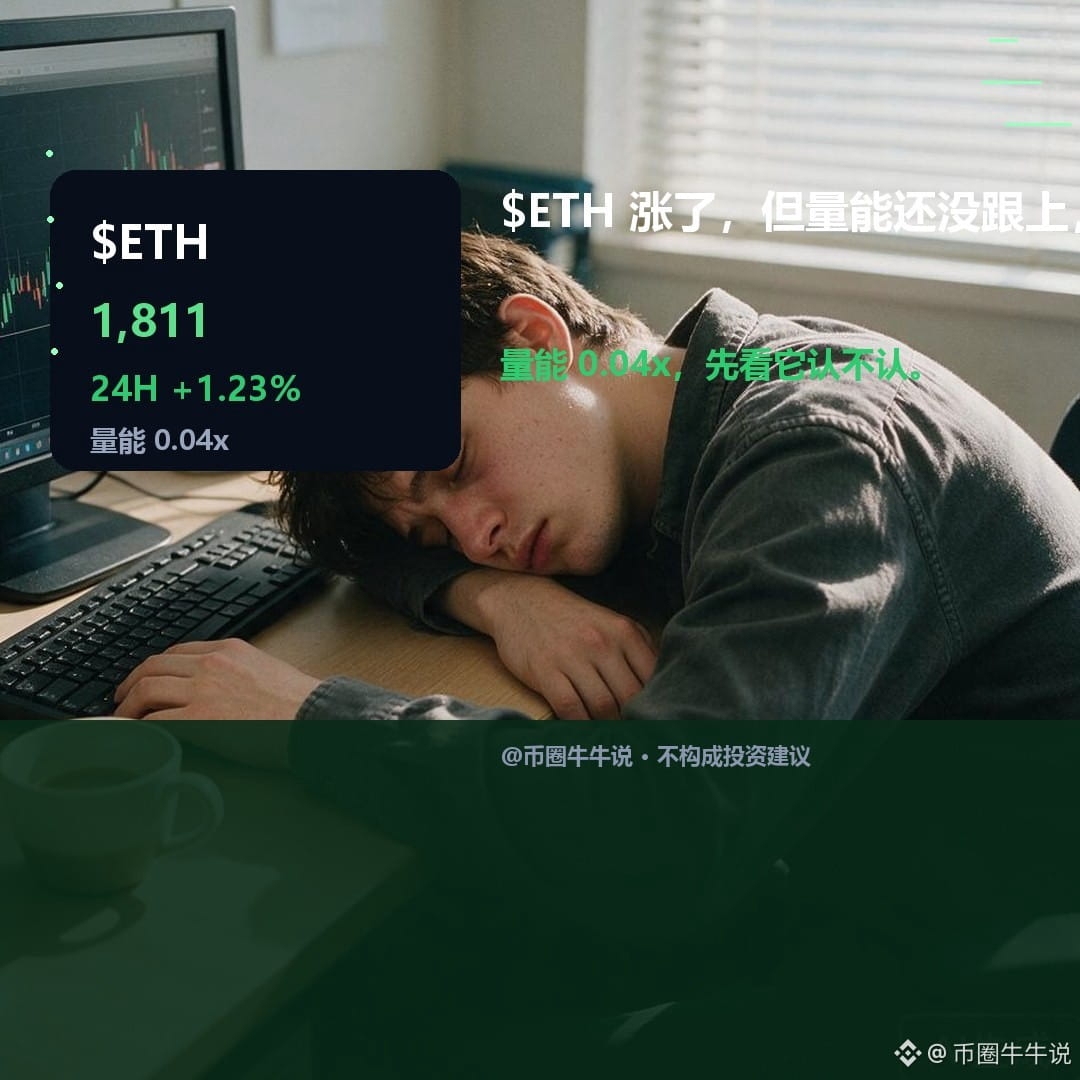
Both timeframes are pointing in the same weak direction; the bearish setup holds if the rebound fails to break through. The 1-hour and 4-hour charts both show weakness. Price is holding at 1,811.32, but the 1-hour RSI is only 48.24 and the 4-hour RSI is 35.23, still in oversold territory.
Current price: 1,811.32. Target: 1,773.13 (first target); the setup is invalidated if price breaks above 1,845.18. If the rebound fails to reclaim 1,845.18, bears can keep holding their positions, with 1,773.13 as the key level this move is targeting.
ETH is up +1.23% over 24 hours, but the 1-hour volume ratio is only 4.47%, showing a divergence between price and volume. Price has moved, but volume hasn’t followed. In this kind of situation, watching candle colors can make the move look more likely to continue than it really is.
ETH’s rebound has lost volume support, and bears are targeting 1,773.13. Markets are volatile; the above is for market observation only and does not constitute investment advice.
Related asset: $ETH
#ETH #Ethereum
Stay short on $ETH.
Both timeframes are pointing in the same weak direction; the bearish setup holds if the rebound fails to break through. The 1-hour and 4-hour charts both show weakness. Price is holding at 1,811.32, but the 1-hour RSI is only 48.24 and the 4-hour RSI is 35.23, still in oversold territory.
Current price: 1,811.32. Target: 1,773.13 (first target); the setup is invalidated if price breaks above 1,845.18. If the rebound fails to reclaim 1,845.18, bears can keep holding their positions, with 1,773.13 as the key level this move is targeting.
ETH is up +1.23% over 24 hours, but the 1-hour volume ratio is only 4.47%, showing a divergence between price and volume. Price has moved, but volume hasn’t followed. In this kind of situation, watching candle colors can make the move look more likely to continue than it really is.
ETH’s rebound has lost volume support, and bears are targeting 1,773.13. Markets are volatile; the above is for market observation only and does not constitute investment advice.
Related asset: $ETH
#ETH #Ethereum
Both timeframes are pointing in the same weak direction; the bearish setup holds if the rebound fails to break through. The 1-hour and 4-hour charts both show weakness. Price is holding at 1,811.32, but the 1-hour RSI is only 48.24 and the 4-hour RSI is 35.23, still in oversold territory.
Current price: 1,811.32. Target: 1,773.13 (first target); the setup is invalidated if price breaks above 1,845.18. If the rebound fails to reclaim 1,845.18, bears can keep holding their positions, with 1,773.13 as the key level this move is targeting.
ETH is up +1.23% over 24 hours, but the 1-hour volume ratio is only 4.47%, showing a divergence between price and volume. Price has moved, but volume hasn’t followed. In this kind of situation, watching candle colors can make the move look more likely to continue than it really is.
ETH’s rebound has lost volume support, and bears are targeting 1,773.13. Markets are volatile; the above is for market observation only and does not constitute investment advice.
Related asset: $ETH
#ETH #Ethereum
23
·
--
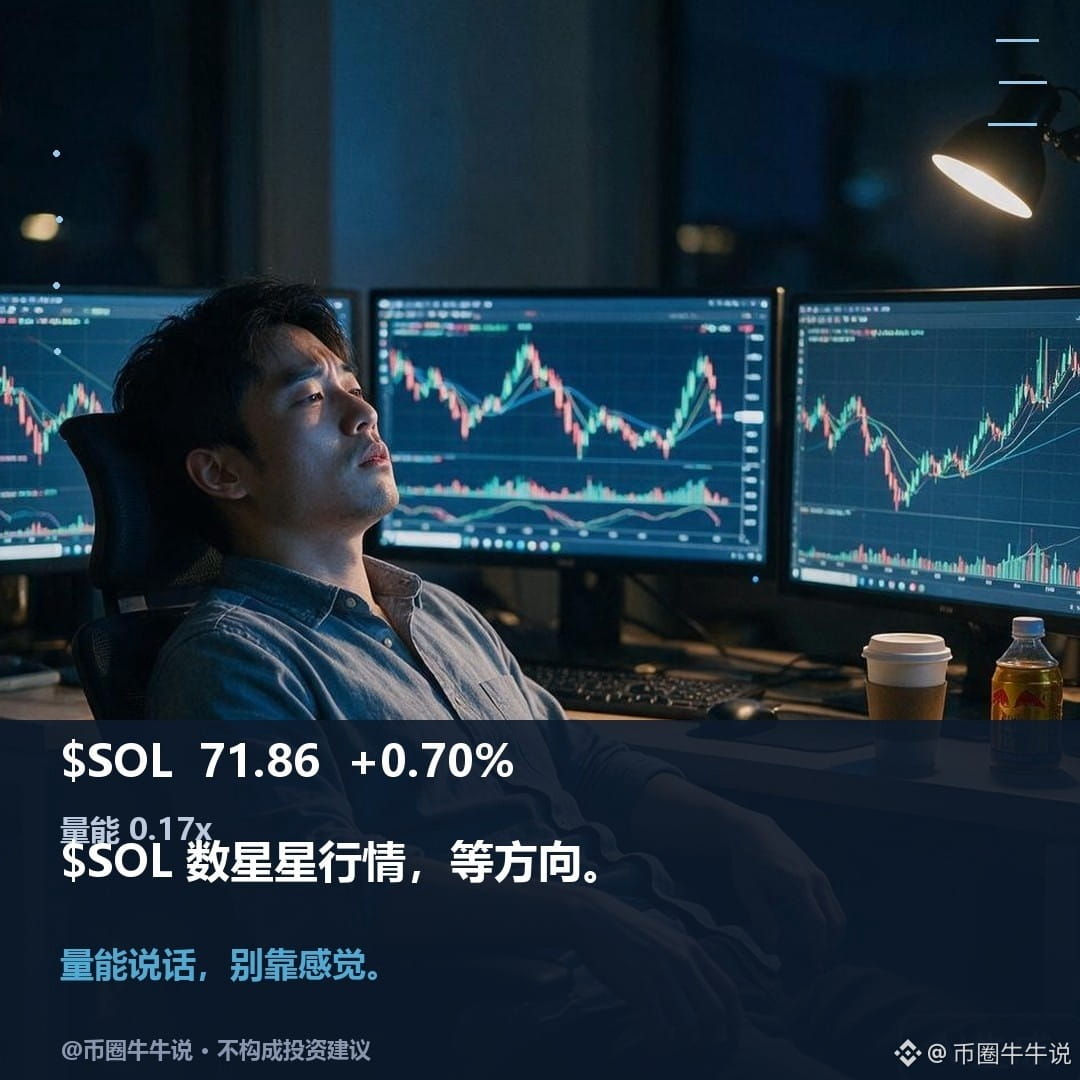
Short $SOL.
Current price: 71.86, target: 69.5 (first target), invalidation level: below 73.28.
It’s up +0.70% over 24 hours, but both the 1-hour and 4-hour timeframes are weak. The setup holds if the rebound fails to break through overhead resistance.
The price has already moved, but trading volume hasn’t followed. In situations like this, focusing only on candlestick colors can easily lead you to overestimate the move’s staying power.
The price has already moved, but trading volume hasn’t followed. In situations like this, focusing only on candlestick colors can easily lead you to overestimate the move’s staying power.
The price has already moved, but trading volume hasn’t followed. In situations like this, focusing only on candlestick colors can easily lead you to overestimate the move’s staying power.
The price has already moved, but trading volume hasn’t followed. In situations like this, focusing only on candlestick colors can easily lead you to overestimate the move’s staying power.
The price has already moved, but trading volume hasn’t followed. In situations like this, focusing only on candlestick colors can easily lead you to overestimate the move’s staying power.
The price has already moved, but trading volume hasn’t followed. In situations like this, focusing only on candlestick colors can easily lead you to overestimate the move’s staying power.
Markets are volatile. The above is for market observation only and does not constitute investment advice.
Related asset: $SOL
#SOL #Solana
Short $SOL.
Current price: 71.86, target: 69.5 (first target), invalidation level: below 73.28.
It’s up +0.70% over 24 hours, but both the 1-hour and 4-hour timeframes are weak. The setup holds if the rebound fails to break through overhead resistance.
The price has already moved, but trading volume hasn’t followed. In situations like this, focusing only on candlestick colors can easily lead you to overestimate the move’s staying power.
The price has already moved, but trading volume hasn’t followed. In situations like this, focusing only on candlestick colors can easily lead you to overestimate the move’s staying power.
The price has already moved, but trading volume hasn’t followed. In situations like this, focusing only on candlestick colors can easily lead you to overestimate the move’s staying power.
The price has already moved, but trading volume hasn’t followed. In situations like this, focusing only on candlestick colors can easily lead you to overestimate the move’s staying power.
The price has already moved, but trading volume hasn’t followed. In situations like this, focusing only on candlestick colors can easily lead you to overestimate the move’s staying power.
The price has already moved, but trading volume hasn’t followed. In situations like this, focusing only on candlestick colors can easily lead you to overestimate the move’s staying power.
Markets are volatile. The above is for market observation only and does not constitute investment advice.
Related asset: $SOL
#SOL #Solana
Current price: 71.86, target: 69.5 (first target), invalidation level: below 73.28.
It’s up +0.70% over 24 hours, but both the 1-hour and 4-hour timeframes are weak. The setup holds if the rebound fails to break through overhead resistance.
The price has already moved, but trading volume hasn’t followed. In situations like this, focusing only on candlestick colors can easily lead you to overestimate the move’s staying power.
The price has already moved, but trading volume hasn’t followed. In situations like this, focusing only on candlestick colors can easily lead you to overestimate the move’s staying power.
The price has already moved, but trading volume hasn’t followed. In situations like this, focusing only on candlestick colors can easily lead you to overestimate the move’s staying power.
The price has already moved, but trading volume hasn’t followed. In situations like this, focusing only on candlestick colors can easily lead you to overestimate the move’s staying power.
The price has already moved, but trading volume hasn’t followed. In situations like this, focusing only on candlestick colors can easily lead you to overestimate the move’s staying power.
The price has already moved, but trading volume hasn’t followed. In situations like this, focusing only on candlestick colors can easily lead you to overestimate the move’s staying power.
Markets are volatile. The above is for market observation only and does not constitute investment advice.
Related asset: $SOL
#SOL #Solana
107
·
--
Article
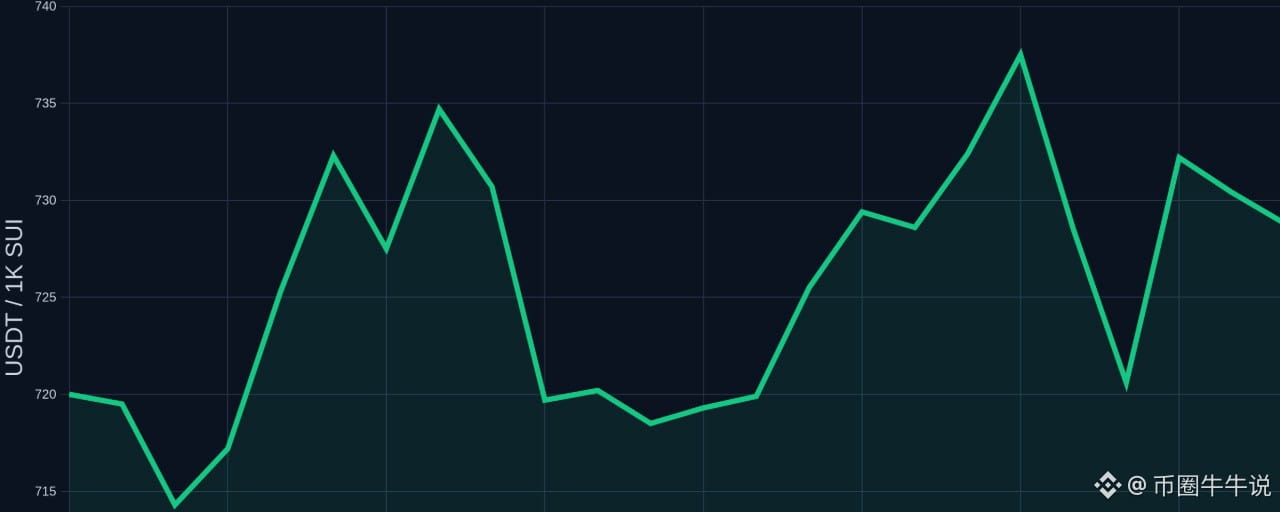
$SUI: 1-hour trend leaning bullish, 4-hour leaning bearish; 0.00x trading participation points to an uncertain direction$SUI is now at 0.7307 USDT, up 1.16% over 24 hours, and fluctuated between 0.7078 and 0.7401 over the past day. The 1-hour trend is leaning bullish, while the 4-hour trend is leaning bearish, with trading participation at just 0.00x. The price has moved, but volume hasn’t followed—this divergence alone makes the direction less reliable. More concerning, the two timeframes are giving opposite signals, with the short-term and broader trends still at odds. Would you trust the 1-hour reversal first, or wait for the 4-hour chart to confirm before changing your view?
Let’s break down the timeframes first. The 1-hour chart reflects the flow of short-term funds, while the 4-hour chart reflects the structure over a broader timeframe. When they point in opposite directions, the market is likely choosing a direction, but that absolutely does not mean the trend has already reversed. The easiest trap is to focus on whichever timeframe looks more convincing: if you look only at the 1-hour chart, you might mistake a rebound for a reversal; if you look only at the 4-hour chart, you might mistake a normal pullback for the end of the trend. So indicators and key levels can help us set conditions, but they can’t declare the market’s next move in advance.
$SUI: 1-hour trend leaning bullish, 4-hour leaning bearish; 0.00x trading participation points to an uncertain direction
$SUI is now at 0.7307 USDT, up 1.16% over 24 hours, and fluctuated between 0.7078 and 0.7401 over the past day. The 1-hour trend is leaning bullish, while the 4-hour trend is leaning bearish, with trading participation at just 0.00x. The price has moved, but volume hasn’t followed—this divergence alone makes the direction less reliable. More concerning, the two timeframes are giving opposite signals, with the short-term and broader trends still at odds. Would you trust the 1-hour reversal first, or wait for the 4-hour chart to confirm before changing your view?
Let’s break down the timeframes first. The 1-hour chart reflects the flow of short-term funds, while the 4-hour chart reflects the structure over a broader timeframe. When they point in opposite directions, the market is likely choosing a direction, but that absolutely does not mean the trend has already reversed. The easiest trap is to focus on whichever timeframe looks more convincing: if you look only at the 1-hour chart, you might mistake a rebound for a reversal; if you look only at the 4-hour chart, you might mistake a normal pullback for the end of the trend. So indicators and key levels can help us set conditions, but they can’t declare the market’s next move in advance.
Let’s break down the timeframes first. The 1-hour chart reflects the flow of short-term funds, while the 4-hour chart reflects the structure over a broader timeframe. When they point in opposite directions, the market is likely choosing a direction, but that absolutely does not mean the trend has already reversed. The easiest trap is to focus on whichever timeframe looks more convincing: if you look only at the 1-hour chart, you might mistake a rebound for a reversal; if you look only at the 4-hour chart, you might mistake a normal pullback for the end of the trend. So indicators and key levels can help us set conditions, but they can’t declare the market’s next move in advance.
1
291
·
--
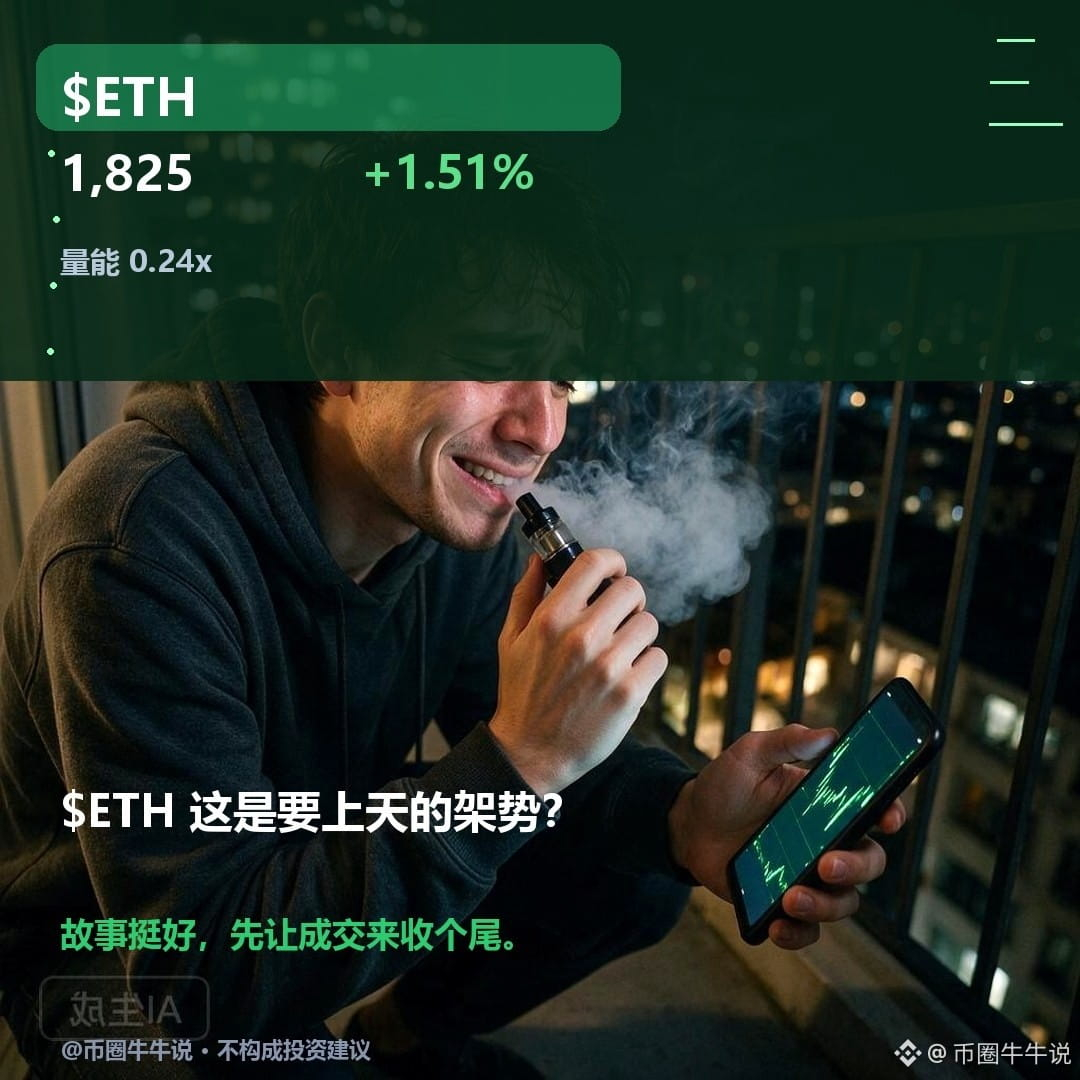
Waiting for confirmation on $ETH.
The 1-hour trend is relatively strong, while the 4-hour trend is relatively weak. The two timeframes have yet to align, so rushing to draw a conclusion now would be speaking for the market.
Current price: 1,825.17; target: 1,845.18 (upside breakout level); downside breakout level: 1,773.13.
A break above the upside level would mean the 1-hour uptrend is continuing, while a break below the downside level would confirm that the 4-hour trend is driving the decline.
The 24-hour gain of +1.51% has landed right between 1-hour support and 4-hour resistance. It proves neither that the bulls are strong nor that the bears' defenses have been breached.
The shortest timeframe determines ETH's breakout direction, but the two timeframes have yet to align.
Market volatility is high. The above is for market observation only and does not constitute investment advice.
Related asset: $ETH
#ETH #Ethereum
Waiting for confirmation on $ETH.
The 1-hour trend is relatively strong, while the 4-hour trend is relatively weak. The two timeframes have yet to align, so rushing to draw a conclusion now would be speaking for the market.
Current price: 1,825.17; target: 1,845.18 (upside breakout level); downside breakout level: 1,773.13.
A break above the upside level would mean the 1-hour uptrend is continuing, while a break below the downside level would confirm that the 4-hour trend is driving the decline.
The 24-hour gain of +1.51% has landed right between 1-hour support and 4-hour resistance. It proves neither that the bulls are strong nor that the bears' defenses have been breached.
The shortest timeframe determines ETH's breakout direction, but the two timeframes have yet to align.
Market volatility is high. The above is for market observation only and does not constitute investment advice.
Related asset: $ETH
#ETH #Ethereum
The 1-hour trend is relatively strong, while the 4-hour trend is relatively weak. The two timeframes have yet to align, so rushing to draw a conclusion now would be speaking for the market.
Current price: 1,825.17; target: 1,845.18 (upside breakout level); downside breakout level: 1,773.13.
A break above the upside level would mean the 1-hour uptrend is continuing, while a break below the downside level would confirm that the 4-hour trend is driving the decline.
The 24-hour gain of +1.51% has landed right between 1-hour support and 4-hour resistance. It proves neither that the bulls are strong nor that the bears' defenses have been breached.
The shortest timeframe determines ETH's breakout direction, but the two timeframes have yet to align.
Market volatility is high. The above is for market observation only and does not constitute investment advice.
Related asset: $ETH
#ETH #Ethereum
57
·
--
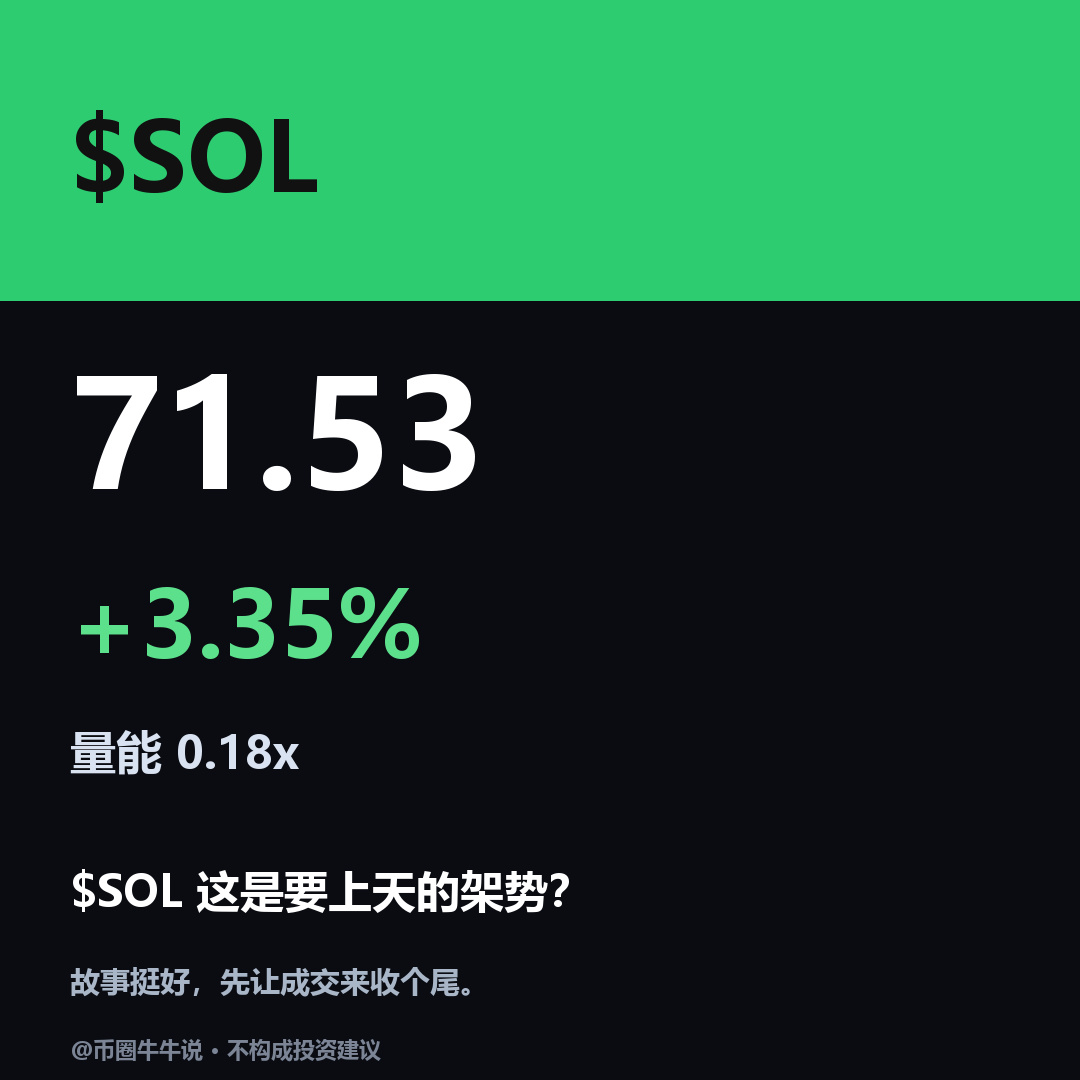
Short $SOL. Both the 1-hour and 4-hour timeframes are showing weakness. Oversold conditions only tell us that a decline has occurred; they don’t mean it’s over. A rebound is due, but until the structure stops weakening, I won’t treat oversold conditions as a bottom. A steep drop only shows that selling pressure has occurred; it doesn’t automatically mean the price is cheap.
Current price: 71.53. Target: 67.54 (first target). A move above 73.28 (invalidation level) voids the setup. As long as the price fails to reclaim the resistance above, bears are still in control, and that lower level is where this move is headed. The setup is confirmed if the target is reached; if price moves above the invalidation level, the trade thesis is wrong.
The 24-hour gain of +3.35% may look like a rebound, but the volume ratio is only 0.18, showing that the rise lacks volume support and is merely a normal bounce after oversold conditions. The structure remains weak. A rebound is not a reversal signal, and a rise without volume support is unlikely to last.
If the rebound fails to break through the resistance above, bears are still in control. This is not investment advice.
Related coin: $SOL
#SOL #Solana
Short $SOL. Both the 1-hour and 4-hour timeframes are showing weakness. Oversold conditions only tell us that a decline has occurred; they don’t mean it’s over. A rebound is due, but until the structure stops weakening, I won’t treat oversold conditions as a bottom. A steep drop only shows that selling pressure has occurred; it doesn’t automatically mean the price is cheap.
Current price: 71.53. Target: 67.54 (first target). A move above 73.28 (invalidation level) voids the setup. As long as the price fails to reclaim the resistance above, bears are still in control, and that lower level is where this move is headed. The setup is confirmed if the target is reached; if price moves above the invalidation level, the trade thesis is wrong.
The 24-hour gain of +3.35% may look like a rebound, but the volume ratio is only 0.18, showing that the rise lacks volume support and is merely a normal bounce after oversold conditions. The structure remains weak. A rebound is not a reversal signal, and a rise without volume support is unlikely to last.
If the rebound fails to break through the resistance above, bears are still in control. This is not investment advice.
Related coin: $SOL
#SOL #Solana
Current price: 71.53. Target: 67.54 (first target). A move above 73.28 (invalidation level) voids the setup. As long as the price fails to reclaim the resistance above, bears are still in control, and that lower level is where this move is headed. The setup is confirmed if the target is reached; if price moves above the invalidation level, the trade thesis is wrong.
The 24-hour gain of +3.35% may look like a rebound, but the volume ratio is only 0.18, showing that the rise lacks volume support and is merely a normal bounce after oversold conditions. The structure remains weak. A rebound is not a reversal signal, and a rise without volume support is unlikely to last.
If the rebound fails to break through the resistance above, bears are still in control. This is not investment advice.
Related coin: $SOL
#SOL #Solana
399
·
--
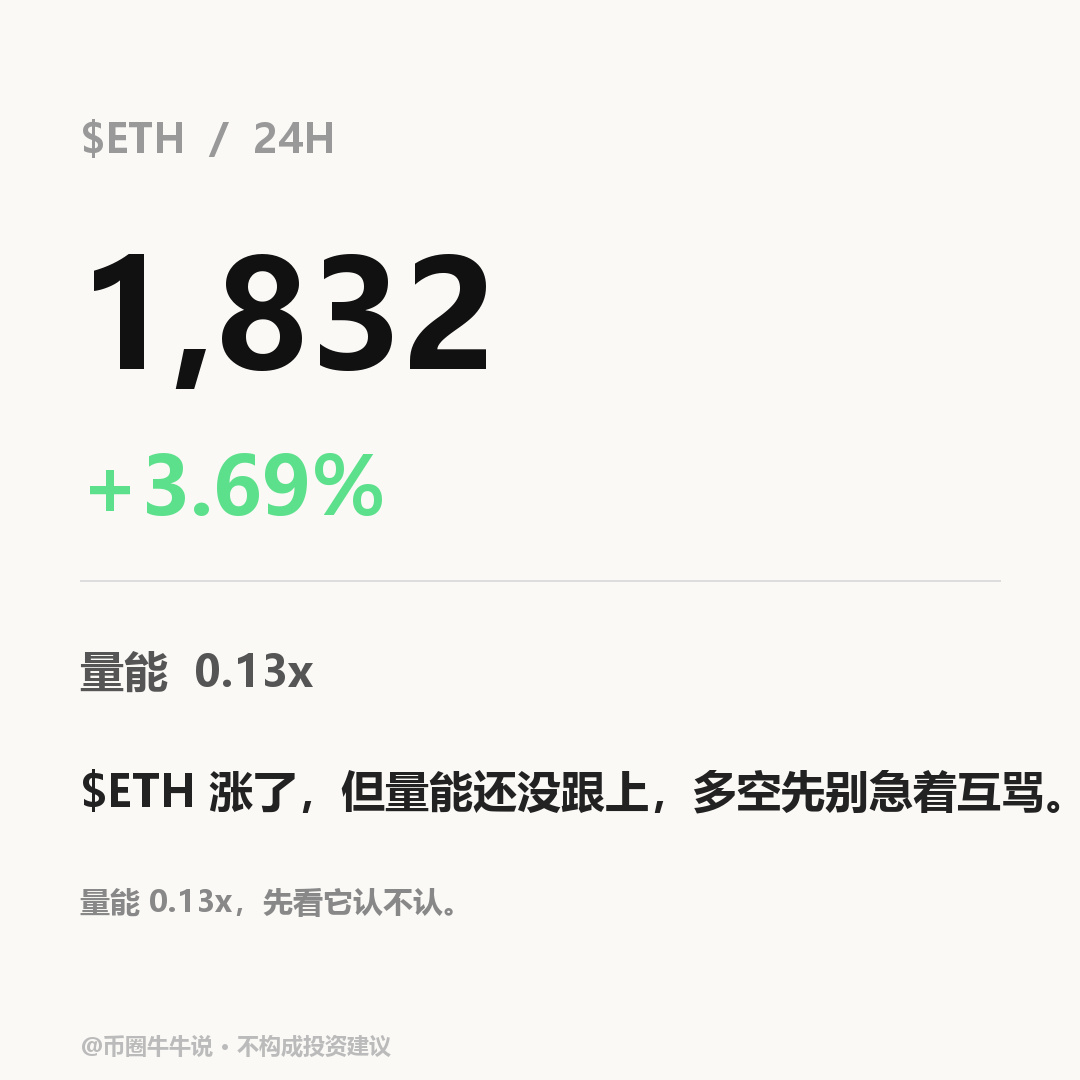
Wait for confirmation on $ETH.
The 1-hour timeframe is leaning bullish, while the 4-hour timeframe is leaning bearish. The two directions haven’t aligned yet, so rushing to make a call now would be trying to dictate the market.
Current price: 1,832.27; target: 1,845.18 (upside breakout level); breakdown level: 1,711.08.
Go long if the price moves above 1,845.18, and short if it falls below 1,711.08. No bets in between.
The 24-hour gain of 3.69% has exceeded expectations for a short-term rebound, but the volume ratio of 0.13 shows insufficient market participation; the overbought move hasn’t been accompanied by higher volume.
Go long if the price moves above 1,845.18, and short if it falls below 1,711.08. No bets in between.
Market volatility is high. The above is for market observation only and does not constitute investment advice.
Related asset: $ETH
#ETH #Ethereum
Wait for confirmation on $ETH.
The 1-hour timeframe is leaning bullish, while the 4-hour timeframe is leaning bearish. The two directions haven’t aligned yet, so rushing to make a call now would be trying to dictate the market.
Current price: 1,832.27; target: 1,845.18 (upside breakout level); breakdown level: 1,711.08.
Go long if the price moves above 1,845.18, and short if it falls below 1,711.08. No bets in between.
The 24-hour gain of 3.69% has exceeded expectations for a short-term rebound, but the volume ratio of 0.13 shows insufficient market participation; the overbought move hasn’t been accompanied by higher volume.
Go long if the price moves above 1,845.18, and short if it falls below 1,711.08. No bets in between.
Market volatility is high. The above is for market observation only and does not constitute investment advice.
Related asset: $ETH
#ETH #Ethereum
The 1-hour timeframe is leaning bullish, while the 4-hour timeframe is leaning bearish. The two directions haven’t aligned yet, so rushing to make a call now would be trying to dictate the market.
Current price: 1,832.27; target: 1,845.18 (upside breakout level); breakdown level: 1,711.08.
Go long if the price moves above 1,845.18, and short if it falls below 1,711.08. No bets in between.
The 24-hour gain of 3.69% has exceeded expectations for a short-term rebound, but the volume ratio of 0.13 shows insufficient market participation; the overbought move hasn’t been accompanied by higher volume.
Go long if the price moves above 1,845.18, and short if it falls below 1,711.08. No bets in between.
Market volatility is high. The above is for market observation only and does not constitute investment advice.
Related asset: $ETH
#ETH #Ethereum
434
·
--
Article
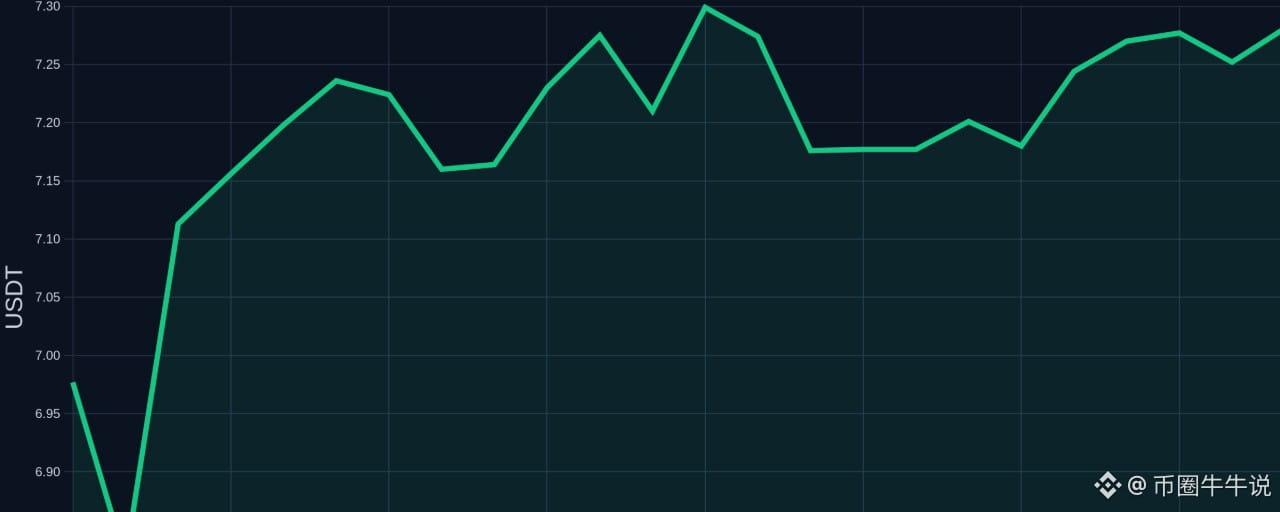
The two timeframes for $AVAX still don’t agree—what’s easiest to misread right now$AVAX is now at 7.303 USDT, up 4.25% over 24 hours, having fluctuated between 6.743 and 7.342 over the past day. The 1-hour trend is leaning bullish, while the 4-hour trend is leaning bearish. Trading activity is only 0.12x. The price has moved, but volume hasn’t followed—this divergence alone makes the direction less reliable. More concerning, the two timeframes are giving opposite signals, with the short-term and broader trends still at odds.
My view is that it’s better to see this as a direction that hasn’t been confirmed yet, rather than rush to label it a rebound or a pullback.
This raises an unavoidable question: would you trust the 1-hour trend reversal first, or wait for confirmation on the 4-hour chart before changing your view? When the timeframes don’t agree, focusing only on the one that supports your view can easily lead you to mistake a short-term move for a trend reversal.
The two timeframes for $AVAX still don’t agree—what’s easiest to misread right now
$AVAX is now at 7.303 USDT, up 4.25% over 24 hours, having fluctuated between 6.743 and 7.342 over the past day. The 1-hour trend is leaning bullish, while the 4-hour trend is leaning bearish. Trading activity is only 0.12x. The price has moved, but volume hasn’t followed—this divergence alone makes the direction less reliable. More concerning, the two timeframes are giving opposite signals, with the short-term and broader trends still at odds.
My view is that it’s better to see this as a direction that hasn’t been confirmed yet, rather than rush to label it a rebound or a pullback.
This raises an unavoidable question: would you trust the 1-hour trend reversal first, or wait for confirmation on the 4-hour chart before changing your view? When the timeframes don’t agree, focusing only on the one that supports your view can easily lead you to mistake a short-term move for a trend reversal.
My view is that it’s better to see this as a direction that hasn’t been confirmed yet, rather than rush to label it a rebound or a pullback.
This raises an unavoidable question: would you trust the 1-hour trend reversal first, or wait for confirmation on the 4-hour chart before changing your view? When the timeframes don’t agree, focusing only on the one that supports your view can easily lead you to mistake a short-term move for a trend reversal.
246
·
--
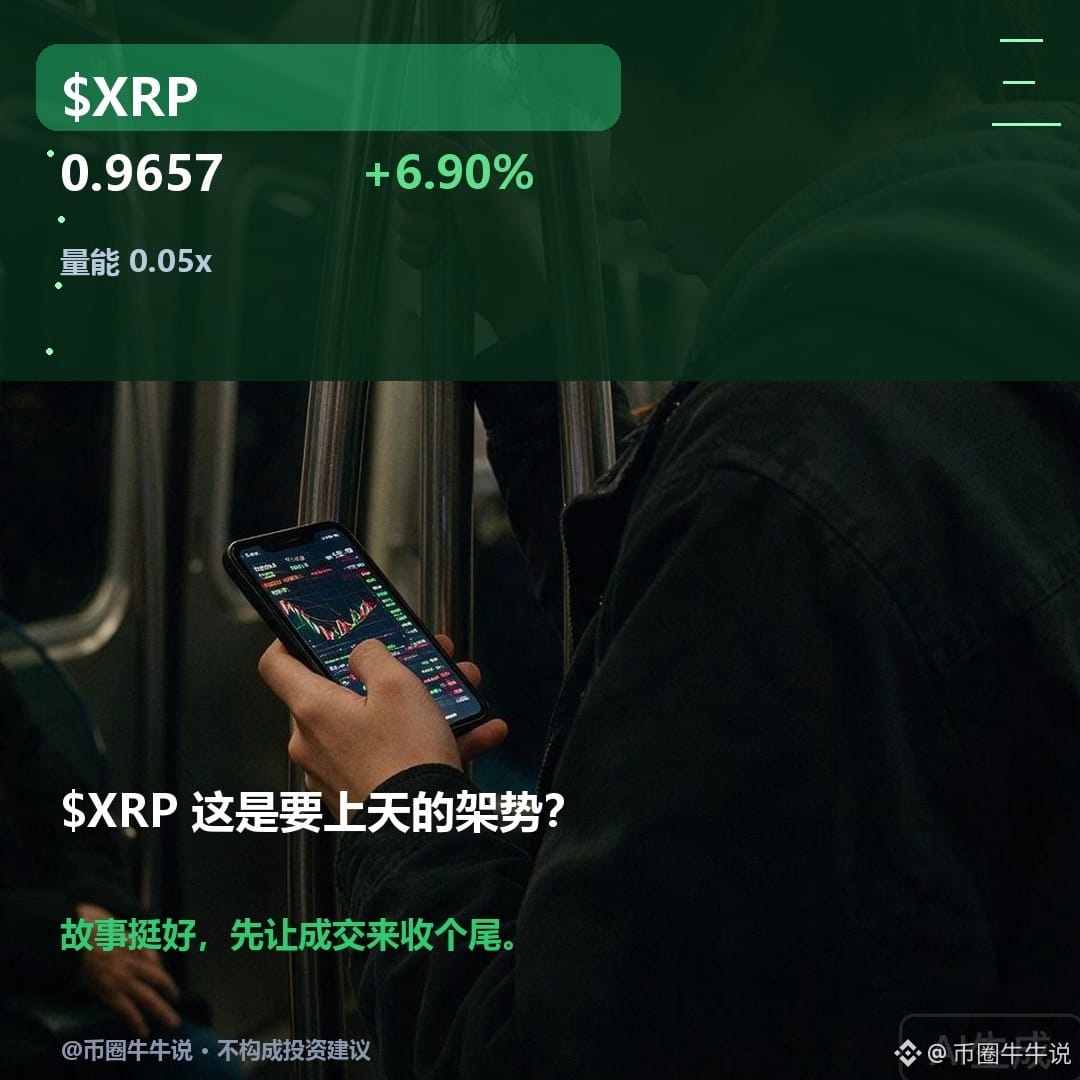
Wait for confirmation on $XRP. The one-hour chart is showing a relatively strong signal, while the four-hour chart remains relatively weak. With the two timeframes pointing in opposite directions, rushing to call the trend now would be getting ahead of the market.
The current price is 0.9657. The upside level to watch is a breakout above 0.9794, and the invalidation level is a breakdown below 0.893. A decisive move above 0.9794 would confirm the direction; a drop below 0.893 would invalidate it outright. Choppy trading in between does not change the wait-and-see stance.
The 24-hour gain of +6.90% has added short-term momentum, but the volume ratio is just 0.05. This low-volume rebound lacks staying power, and the broader bearish trend has not been reversed by this rally. For now, it is better to observe than to place a bet.
Whichever timeframe changes first will determine the direction of the next move. Until then, chasing gains or selling into weakness is just a bet on the direction. This is not investment advice.
Related asset: $XRP
#XRP #Ripple
Wait for confirmation on $XRP. The one-hour chart is showing a relatively strong signal, while the four-hour chart remains relatively weak. With the two timeframes pointing in opposite directions, rushing to call the trend now would be getting ahead of the market.
The current price is 0.9657. The upside level to watch is a breakout above 0.9794, and the invalidation level is a breakdown below 0.893. A decisive move above 0.9794 would confirm the direction; a drop below 0.893 would invalidate it outright. Choppy trading in between does not change the wait-and-see stance.
The 24-hour gain of +6.90% has added short-term momentum, but the volume ratio is just 0.05. This low-volume rebound lacks staying power, and the broader bearish trend has not been reversed by this rally. For now, it is better to observe than to place a bet.
Whichever timeframe changes first will determine the direction of the next move. Until then, chasing gains or selling into weakness is just a bet on the direction. This is not investment advice.
Related asset: $XRP
#XRP #Ripple
The current price is 0.9657. The upside level to watch is a breakout above 0.9794, and the invalidation level is a breakdown below 0.893. A decisive move above 0.9794 would confirm the direction; a drop below 0.893 would invalidate it outright. Choppy trading in between does not change the wait-and-see stance.
The 24-hour gain of +6.90% has added short-term momentum, but the volume ratio is just 0.05. This low-volume rebound lacks staying power, and the broader bearish trend has not been reversed by this rally. For now, it is better to observe than to place a bet.
Whichever timeframe changes first will determine the direction of the next move. Until then, chasing gains or selling into weakness is just a bet on the direction. This is not investment advice.
Related asset: $XRP
#XRP #Ripple
79
·
--
Article
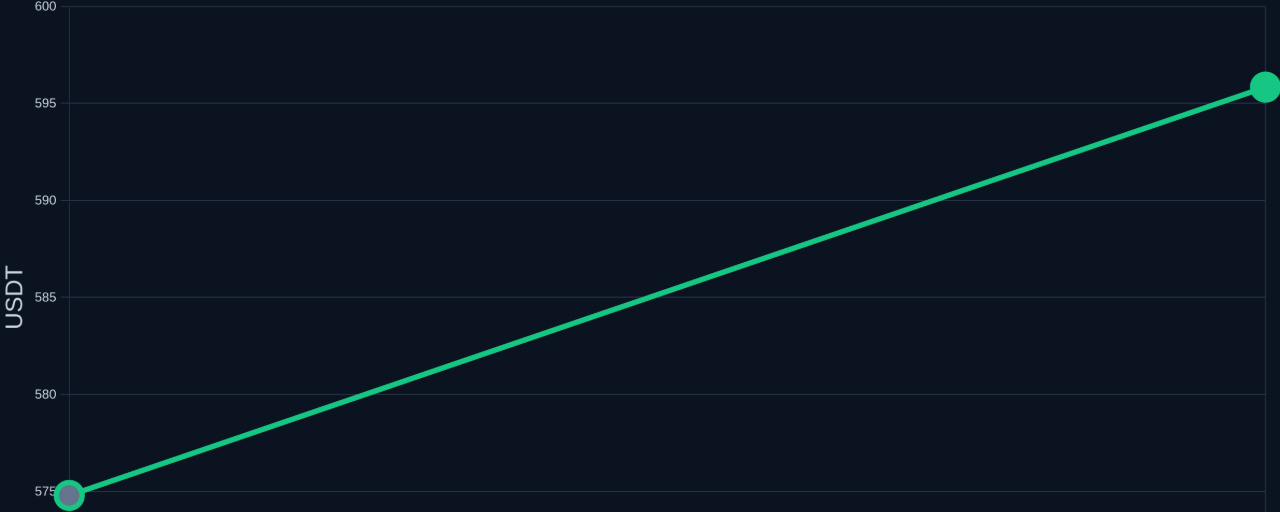
$BNB leans bullish on the 1-hour chart, bearish on the 4-hour; 0.12x trading participation points to an undecided direction$BNB is now at 595.42 USDT, up 2.09% over 24 hours, and has fluctuated between 566 and 599.72 today. The 1-hour trend is leaning bullish, while the 4-hour trend is leaning bearish. Trading participation is only 0.12x. The price has moved, but volume hasn’t followed—this divergence makes the current direction less convincing.
At times like this, looking only at the timeframe that suits your view can easily lead you to misread a short-term move as a trend reversal. I’d rather see the direction as unconfirmed than rush to label it a bounce or a pullback. Would you trust the 1-hour turnaround first, or wait for the 4-hour chart to confirm before changing your view?
$BNB leans bullish on the 1-hour chart, bearish on the 4-hour; 0.12x trading participation points to an undecided direction
$BNB is now at 595.42 USDT, up 2.09% over 24 hours, and has fluctuated between 566 and 599.72 today. The 1-hour trend is leaning bullish, while the 4-hour trend is leaning bearish. Trading participation is only 0.12x. The price has moved, but volume hasn’t followed—this divergence makes the current direction less convincing.
At times like this, looking only at the timeframe that suits your view can easily lead you to misread a short-term move as a trend reversal. I’d rather see the direction as unconfirmed than rush to label it a bounce or a pullback. Would you trust the 1-hour turnaround first, or wait for the 4-hour chart to confirm before changing your view?
At times like this, looking only at the timeframe that suits your view can easily lead you to misread a short-term move as a trend reversal. I’d rather see the direction as unconfirmed than rush to label it a bounce or a pullback. Would you trust the 1-hour turnaround first, or wait for the 4-hour chart to confirm before changing your view?
31
·
--
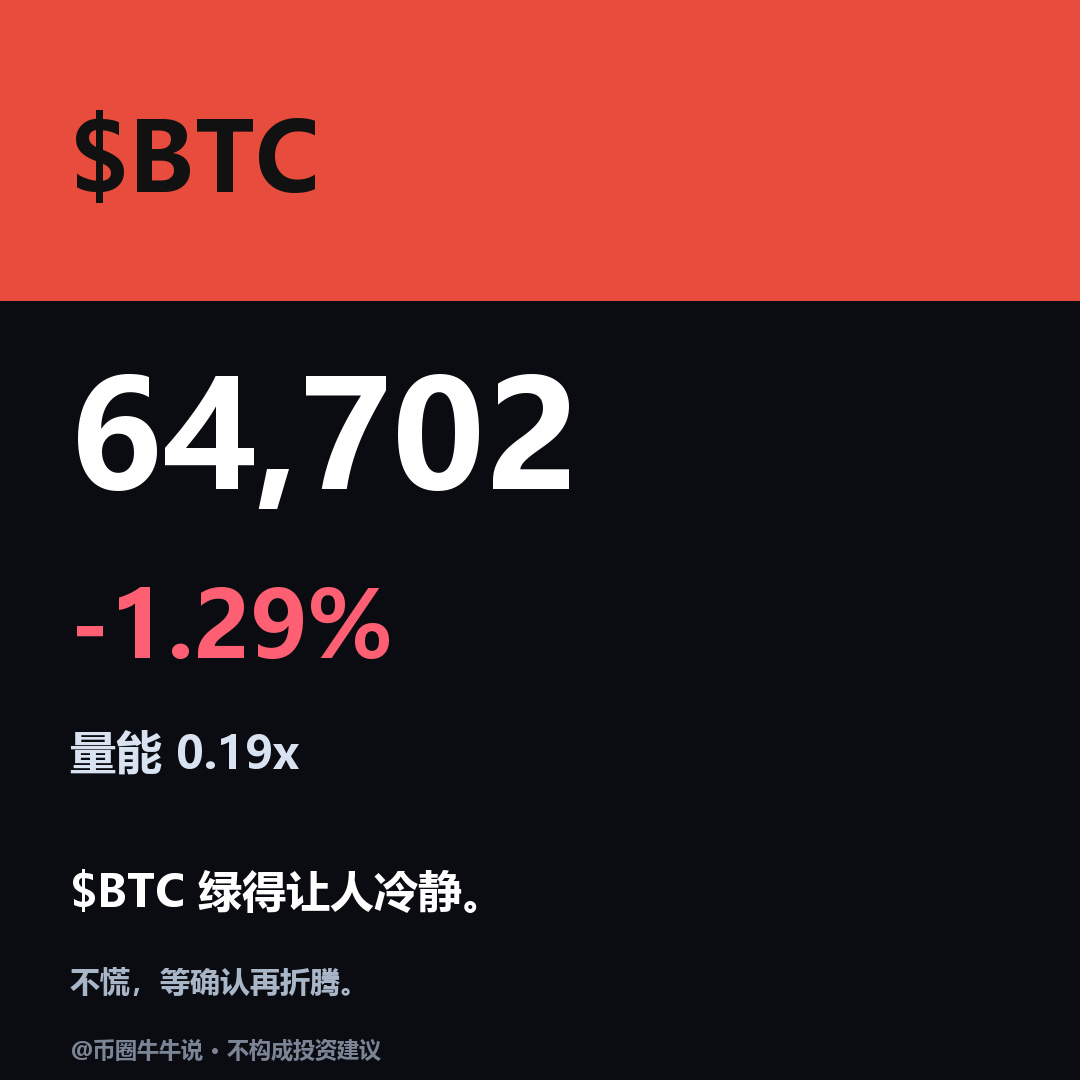
Short $BTC. The one-hour and four-hour timeframes are both leaning bearish, and the four-hour chart has entered oversold territory. But the shorter timeframe hasn't shown any signs of a bottom yet. Oversold only tells you the price has fallen; it doesn't mean the drop is over. If the rebound can't break through the resistance above, the bears are still in control.
Current price: 64,702.01. First target: 62,006. Invalidation level: 66,132.01. As long as the price stays below the invalidation level, the trade thesis holds. If it moves above it, the thesis is invalidated—that's where to admit the loss, no ambiguity.
24-hour change: -1.29%. This isn't a steep drop, suggesting the price has been grinding lower rather than falling all at once. The move may not be fully played out, and the center of gravity is still shifting down. A gradual decline is harder to deal with than a sharp sell-off; rebounds often don't get far before being pushed back down.
Oversold is a condition; a bottom is an outcome. There's still a genuine sign of the decline stopping between the two, and so far only the first condition has been met. This is not investment advice.
Related asset: $BTC
#BTC #Bitcoin
Short $BTC. The one-hour and four-hour timeframes are both leaning bearish, and the four-hour chart has entered oversold territory. But the shorter timeframe hasn't shown any signs of a bottom yet. Oversold only tells you the price has fallen; it doesn't mean the drop is over. If the rebound can't break through the resistance above, the bears are still in control.
Current price: 64,702.01. First target: 62,006. Invalidation level: 66,132.01. As long as the price stays below the invalidation level, the trade thesis holds. If it moves above it, the thesis is invalidated—that's where to admit the loss, no ambiguity.
24-hour change: -1.29%. This isn't a steep drop, suggesting the price has been grinding lower rather than falling all at once. The move may not be fully played out, and the center of gravity is still shifting down. A gradual decline is harder to deal with than a sharp sell-off; rebounds often don't get far before being pushed back down.
Oversold is a condition; a bottom is an outcome. There's still a genuine sign of the decline stopping between the two, and so far only the first condition has been met. This is not investment advice.
Related asset: $BTC
#BTC #Bitcoin
Current price: 64,702.01. First target: 62,006. Invalidation level: 66,132.01. As long as the price stays below the invalidation level, the trade thesis holds. If it moves above it, the thesis is invalidated—that's where to admit the loss, no ambiguity.
24-hour change: -1.29%. This isn't a steep drop, suggesting the price has been grinding lower rather than falling all at once. The move may not be fully played out, and the center of gravity is still shifting down. A gradual decline is harder to deal with than a sharp sell-off; rebounds often don't get far before being pushed back down.
Oversold is a condition; a bottom is an outcome. There's still a genuine sign of the decline stopping between the two, and so far only the first condition has been met. This is not investment advice.
Related asset: $BTC
#BTC #Bitcoin
13
·
--
Article
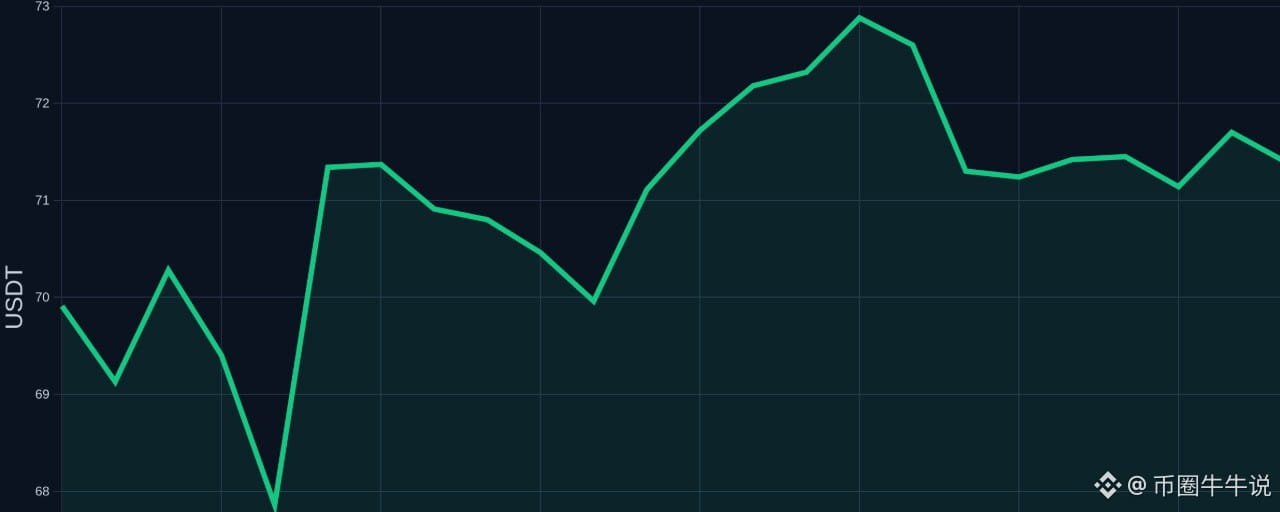
$SOL Rebound Demand Emerges, but One More Condition Must Be Met Before a Bottom Is in$SOL is now at 71.5 USDT, down 0.89% over 24 hours, and has fluctuated between 67.41 and 73.28 intraday. The 1-hour and 4-hour trends are both weak, while trading participation is only 0.07x. The price has already pulled back considerably from its high, but there has never been a simple line separating oversold conditions from a bottom.
My view is that rebound demand has emerged, but until the structure stops weakening, I won’t equate oversold conditions with a bottom.
Rebound demand has indeed emerged, but until the structure stops weakening, I won’t equate oversold conditions with a bottom. A sharp decline only shows that selling pressure has occurred; it doesn’t automatically mean the price is cheap, much less prove that anyone is truly defending support. When an indicator reaches a low level—for example, when the RSI enters oversold territory—it only shows that selling pressure has been released in a concentrated burst. It doesn’t mean buyers have organized. To confirm that the decline has stalled, the price needs to stop making new lows and reclaim key levels; one bullish candle isn’t enough to declare a reversal. Many people treat oversold conditions as a rebound signal, but oversold only means that selling pressure has been released. It doesn’t mean that selling pressure is exhausted, much less that buyers are willing to step in at this level.
$SOL Rebound Demand Emerges, but One More Condition Must Be Met Before a Bottom Is in
$SOL is now at 71.5 USDT, down 0.89% over 24 hours, and has fluctuated between 67.41 and 73.28 intraday. The 1-hour and 4-hour trends are both weak, while trading participation is only 0.07x. The price has already pulled back considerably from its high, but there has never been a simple line separating oversold conditions from a bottom.
My view is that rebound demand has emerged, but until the structure stops weakening, I won’t equate oversold conditions with a bottom.
Rebound demand has indeed emerged, but until the structure stops weakening, I won’t equate oversold conditions with a bottom. A sharp decline only shows that selling pressure has occurred; it doesn’t automatically mean the price is cheap, much less prove that anyone is truly defending support. When an indicator reaches a low level—for example, when the RSI enters oversold territory—it only shows that selling pressure has been released in a concentrated burst. It doesn’t mean buyers have organized. To confirm that the decline has stalled, the price needs to stop making new lows and reclaim key levels; one bullish candle isn’t enough to declare a reversal. Many people treat oversold conditions as a rebound signal, but oversold only means that selling pressure has been released. It doesn’t mean that selling pressure is exhausted, much less that buyers are willing to step in at this level.
My view is that rebound demand has emerged, but until the structure stops weakening, I won’t equate oversold conditions with a bottom.
Rebound demand has indeed emerged, but until the structure stops weakening, I won’t equate oversold conditions with a bottom. A sharp decline only shows that selling pressure has occurred; it doesn’t automatically mean the price is cheap, much less prove that anyone is truly defending support. When an indicator reaches a low level—for example, when the RSI enters oversold territory—it only shows that selling pressure has been released in a concentrated burst. It doesn’t mean buyers have organized. To confirm that the decline has stalled, the price needs to stop making new lows and reclaim key levels; one bullish candle isn’t enough to declare a reversal. Many people treat oversold conditions as a rebound signal, but oversold only means that selling pressure has been released. It doesn’t mean that selling pressure is exhausted, much less that buyers are willing to step in at this level.
1
1
930
·
--
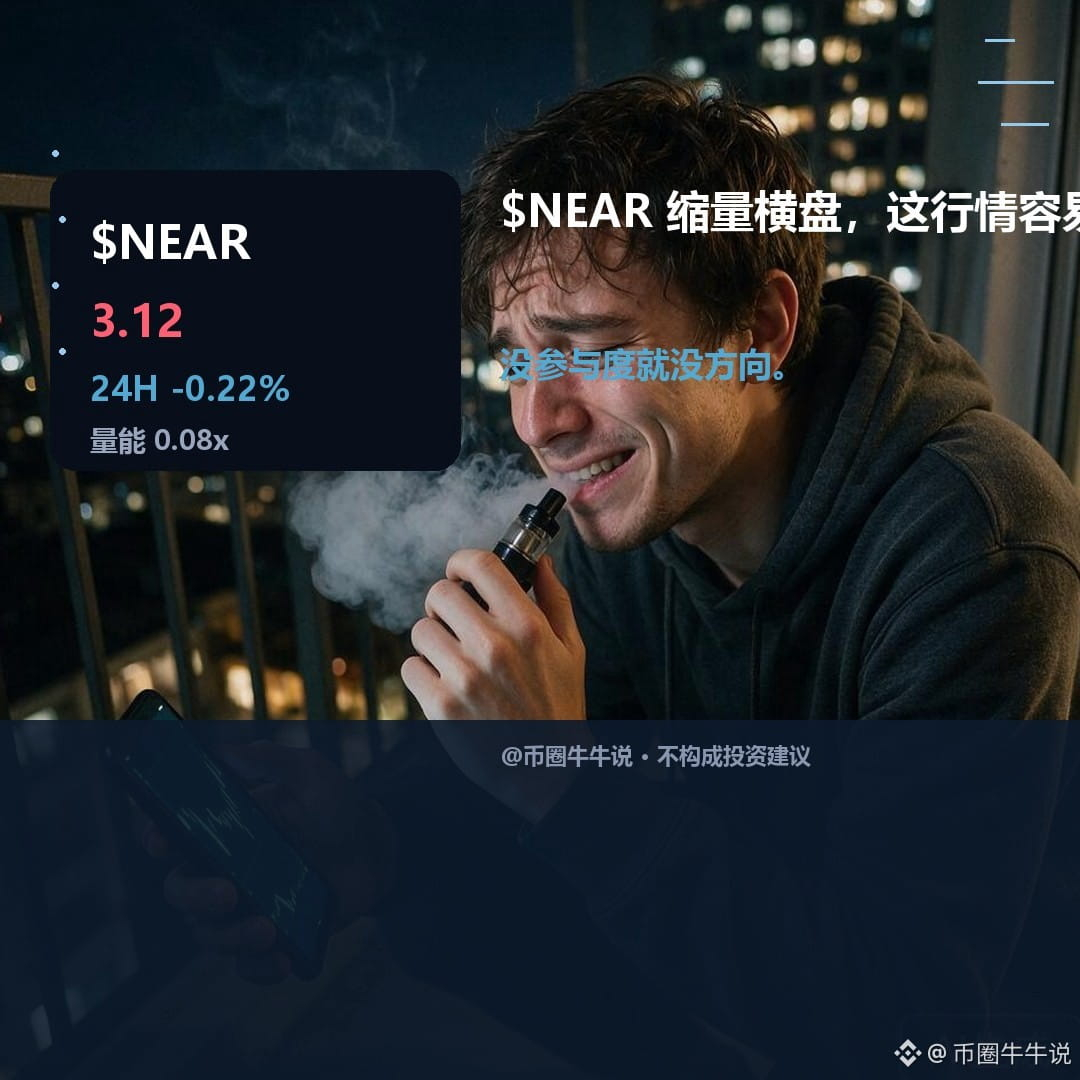
Don’t chase shorts on $NEAR.
Both the 1-hour and 4-hour timeframes are weak, but the 1-hour RSI has entered oversold territory, while the 4-hour RSI has fallen below the critical level of 24. The two timeframes are not oversold at the same time.
Current price: 3.122; target: 3.213; breakdown level: 2.87.
The rebound target is the resistance level on the 1-hour timeframe, while the 4-hour support and resistance levels are 2.87 and 3.738, respectively. The current price is above 4-hour support, indicating that the structure has not yet bottomed.
The 24-hour decline of -0.22% suggests selling pressure has eased, but demand for a rebound is increasing. A steep drop only shows that selling pressure occurred; it does not automatically prove that buyers are truly defending support.
A rebound to 3.213 would not necessarily signal a reversal; a break below 2.87 would indicate that the structure is weakening. Markets are volatile. The above is for market observation only and does not constitute investment advice.
Related asset: $NEAR
#NEAR
Don’t chase shorts on $NEAR.
Both the 1-hour and 4-hour timeframes are weak, but the 1-hour RSI has entered oversold territory, while the 4-hour RSI has fallen below the critical level of 24. The two timeframes are not oversold at the same time.
Current price: 3.122; target: 3.213; breakdown level: 2.87.
The rebound target is the resistance level on the 1-hour timeframe, while the 4-hour support and resistance levels are 2.87 and 3.738, respectively. The current price is above 4-hour support, indicating that the structure has not yet bottomed.
The 24-hour decline of -0.22% suggests selling pressure has eased, but demand for a rebound is increasing. A steep drop only shows that selling pressure occurred; it does not automatically prove that buyers are truly defending support.
A rebound to 3.213 would not necessarily signal a reversal; a break below 2.87 would indicate that the structure is weakening. Markets are volatile. The above is for market observation only and does not constitute investment advice.
Related asset: $NEAR
#NEAR
Both the 1-hour and 4-hour timeframes are weak, but the 1-hour RSI has entered oversold territory, while the 4-hour RSI has fallen below the critical level of 24. The two timeframes are not oversold at the same time.
Current price: 3.122; target: 3.213; breakdown level: 2.87.
The rebound target is the resistance level on the 1-hour timeframe, while the 4-hour support and resistance levels are 2.87 and 3.738, respectively. The current price is above 4-hour support, indicating that the structure has not yet bottomed.
The 24-hour decline of -0.22% suggests selling pressure has eased, but demand for a rebound is increasing. A steep drop only shows that selling pressure occurred; it does not automatically prove that buyers are truly defending support.
A rebound to 3.213 would not necessarily signal a reversal; a break below 2.87 would indicate that the structure is weakening. Markets are volatile. The above is for market observation only and does not constitute investment advice.
Related asset: $NEAR
#NEAR
237
·
--
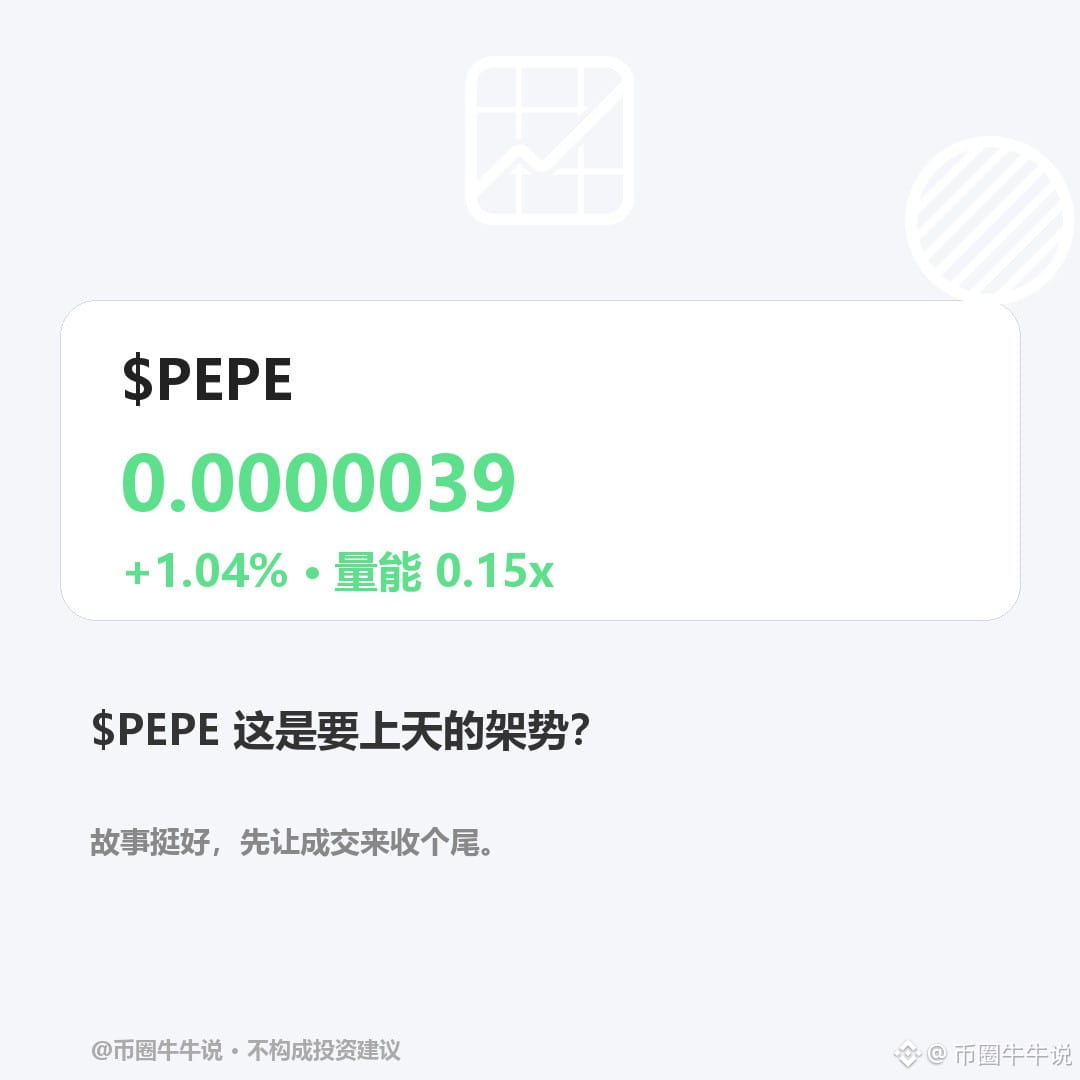
Don't short $PEPE.
The 1-hour and 4-hour trends are both weak, but the 4-hour chart has entered oversold territory, while the shorter time frame has yet to show a clear reversal signal.
Current price: 0.0000039; target: 0.00000408. The setup is invalidated if the price falls below 0.00000369.
A rebound to 0.00000408 doesn't necessarily signal a reversal; only a break below 0.00000369 would indicate that support has failed.
The 24-hour gain of +1.04% suggests that demand for a rebound is increasing, but until the price structure stops falling, oversold does not mean bottomed out.
A rebound to 0.00000408 doesn't necessarily signal a reversal; only a break below 0.00000369 would indicate that support has failed.
Markets are volatile. The above is for market observation only and does not constitute investment advice.
Related token: $PEPE
#PEPE
Don't short $PEPE.
The 1-hour and 4-hour trends are both weak, but the 4-hour chart has entered oversold territory, while the shorter time frame has yet to show a clear reversal signal.
Current price: 0.0000039; target: 0.00000408. The setup is invalidated if the price falls below 0.00000369.
A rebound to 0.00000408 doesn't necessarily signal a reversal; only a break below 0.00000369 would indicate that support has failed.
The 24-hour gain of +1.04% suggests that demand for a rebound is increasing, but until the price structure stops falling, oversold does not mean bottomed out.
A rebound to 0.00000408 doesn't necessarily signal a reversal; only a break below 0.00000369 would indicate that support has failed.
Markets are volatile. The above is for market observation only and does not constitute investment advice.
Related token: $PEPE
#PEPE
The 1-hour and 4-hour trends are both weak, but the 4-hour chart has entered oversold territory, while the shorter time frame has yet to show a clear reversal signal.
Current price: 0.0000039; target: 0.00000408. The setup is invalidated if the price falls below 0.00000369.
A rebound to 0.00000408 doesn't necessarily signal a reversal; only a break below 0.00000369 would indicate that support has failed.
The 24-hour gain of +1.04% suggests that demand for a rebound is increasing, but until the price structure stops falling, oversold does not mean bottomed out.
A rebound to 0.00000408 doesn't necessarily signal a reversal; only a break below 0.00000369 would indicate that support has failed.
Markets are volatile. The above is for market observation only and does not constitute investment advice.
Related token: $PEPE
#PEPE
1
1
869
·
--
Article
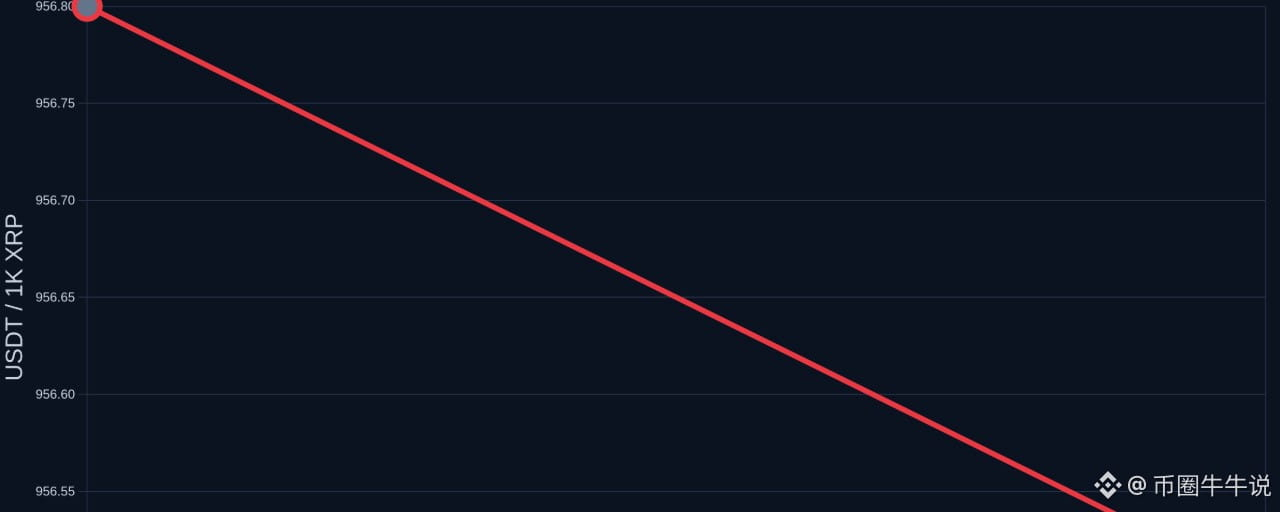
$XRP has come this far on falling volume—how long can this move last?$XRP is now at 0.9559 USDT, down 2.63% over 24 hours, and has fluctuated between 0.893 and 0.9857 intraday. The 1-hour and 4-hour trends are both leaning weak, with trading participation at just 0.09x. The price has moved, but volume hasn’t followed. This divergence lowers the credibility of the current direction.
My view: the direction is still there for now, but low participation has made this move less convincing.
The logic behind price and volume working together is simple: price shows direction, while volume shows participation. If the price has already moved but volume is clearly below average, the follow-through on either a breakout or a decline should be viewed with caution. The easiest trap is to focus only on the candlestick color and ignore participation, mistaking a probe for a genuine move. Indicators and key levels can help set conditions, but they can’t announce the market’s answer in advance.
$XRP has come this far on falling volume—how long can this move last?
$XRP is now at 0.9559 USDT, down 2.63% over 24 hours, and has fluctuated between 0.893 and 0.9857 intraday. The 1-hour and 4-hour trends are both leaning weak, with trading participation at just 0.09x. The price has moved, but volume hasn’t followed. This divergence lowers the credibility of the current direction.
My view: the direction is still there for now, but low participation has made this move less convincing.
The logic behind price and volume working together is simple: price shows direction, while volume shows participation. If the price has already moved but volume is clearly below average, the follow-through on either a breakout or a decline should be viewed with caution. The easiest trap is to focus only on the candlestick color and ignore participation, mistaking a probe for a genuine move. Indicators and key levels can help set conditions, but they can’t announce the market’s answer in advance.
My view: the direction is still there for now, but low participation has made this move less convincing.
The logic behind price and volume working together is simple: price shows direction, while volume shows participation. If the price has already moved but volume is clearly below average, the follow-through on either a breakout or a decline should be viewed with caution. The easiest trap is to focus only on the candlestick color and ignore participation, mistaking a probe for a genuine move. Indicators and key levels can help set conditions, but they can’t announce the market’s answer in advance.
217
·
--
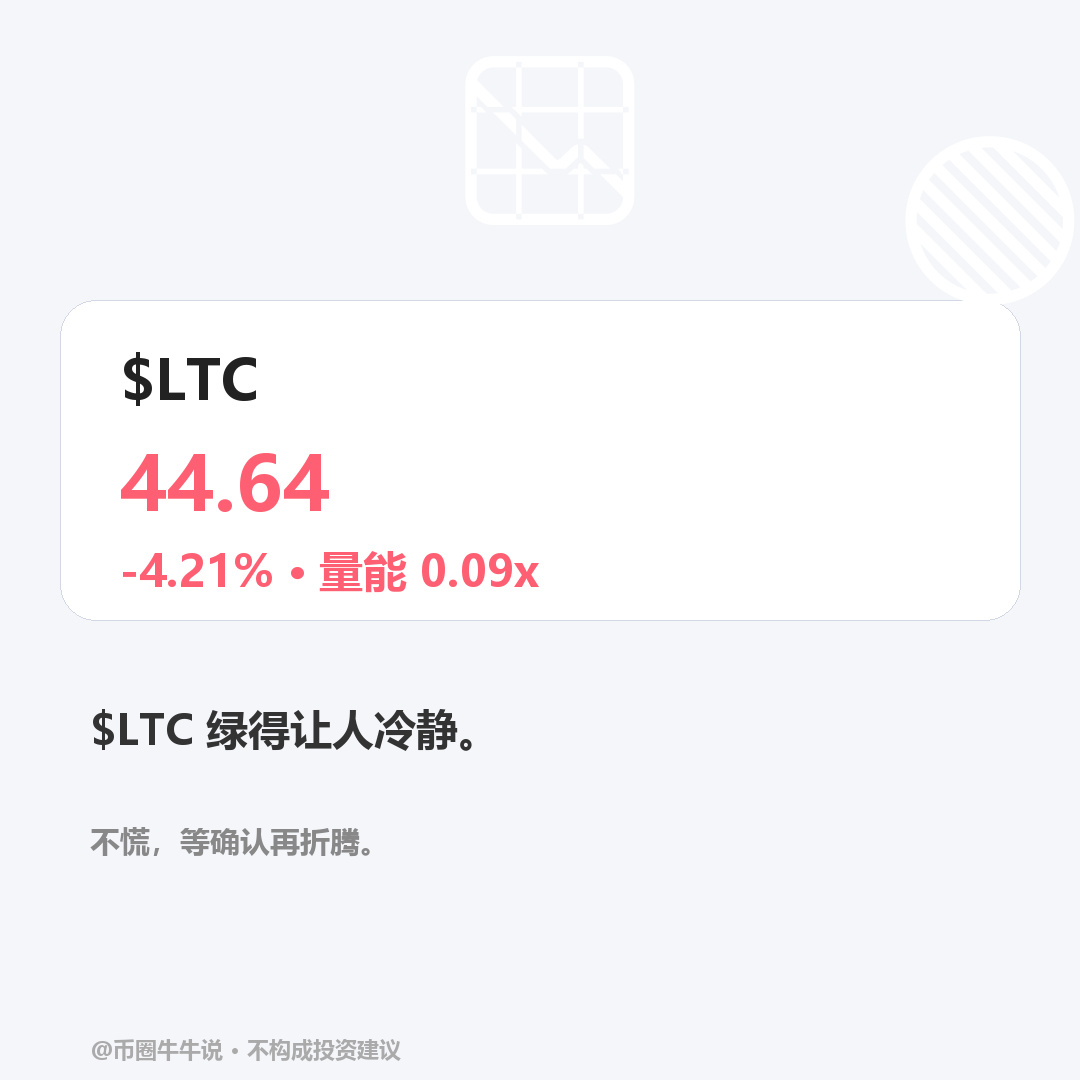
Don’t chase shorts on $LTC. The four-hour timeframe has already entered oversold territory, while the one-hour timeframe is only showing weakness. Oversold conditions haven’t been confirmed on both timeframes at the same time. Pressing prices lower now doesn’t offer a favorable risk/reward.
The current price is 44.64, with a rebound target of 46.27 and a reversal level of 42.67. A move up to 46.27 would confirm this rebound; a drop below 42.67 would invalidate it, showing that no rebound materialized and that weakness can continue even after oversold conditions set in.
The 24-hour change is -4.21%. A sufficiently large drop only proves that selling pressure has been real—it doesn’t mean the price is cheap, let alone that buyers will definitely defend support. The volume ratio is just 0.09, indicating that this decline hasn’t been accompanied by higher volume. It looks more like a slow, low-volume drift downward than a clean selling flush.
Oversold conditions mean demand for a rebound is increasing; a bottom means the structure has stopped weakening. There’s still a piece of evidence missing between the two: proof that the decline has stalled. Until we see that, calling oversold conditions a bottom is jumping the gun. This is not investment advice.
Related coin: $LTC
#LTC
Don’t chase shorts on $LTC. The four-hour timeframe has already entered oversold territory, while the one-hour timeframe is only showing weakness. Oversold conditions haven’t been confirmed on both timeframes at the same time. Pressing prices lower now doesn’t offer a favorable risk/reward.
The current price is 44.64, with a rebound target of 46.27 and a reversal level of 42.67. A move up to 46.27 would confirm this rebound; a drop below 42.67 would invalidate it, showing that no rebound materialized and that weakness can continue even after oversold conditions set in.
The 24-hour change is -4.21%. A sufficiently large drop only proves that selling pressure has been real—it doesn’t mean the price is cheap, let alone that buyers will definitely defend support. The volume ratio is just 0.09, indicating that this decline hasn’t been accompanied by higher volume. It looks more like a slow, low-volume drift downward than a clean selling flush.
Oversold conditions mean demand for a rebound is increasing; a bottom means the structure has stopped weakening. There’s still a piece of evidence missing between the two: proof that the decline has stalled. Until we see that, calling oversold conditions a bottom is jumping the gun. This is not investment advice.
Related coin: $LTC
#LTC
The current price is 44.64, with a rebound target of 46.27 and a reversal level of 42.67. A move up to 46.27 would confirm this rebound; a drop below 42.67 would invalidate it, showing that no rebound materialized and that weakness can continue even after oversold conditions set in.
The 24-hour change is -4.21%. A sufficiently large drop only proves that selling pressure has been real—it doesn’t mean the price is cheap, let alone that buyers will definitely defend support. The volume ratio is just 0.09, indicating that this decline hasn’t been accompanied by higher volume. It looks more like a slow, low-volume drift downward than a clean selling flush.
Oversold conditions mean demand for a rebound is increasing; a bottom means the structure has stopped weakening. There’s still a piece of evidence missing between the two: proof that the decline has stalled. Until we see that, calling oversold conditions a bottom is jumping the gun. This is not investment advice.
Related coin: $LTC
#LTC
528
Log in to explore more content
Join global crypto users on Binance Square
⚡️ Get latest and useful information about crypto.
💬 Trusted by the world’s largest crypto exchange.
👍 Discover real insights from verified creators.
Email / Phone number
Trending Topics
A Packed Week of Earnings and Data Tests Markets
31,642 views
229 Discussing
🚨🇺🇸 BIG WEEK AHEAD FOR THE MARKETS!
Markets are pricing in a Fed rate hike in December and $BTC could see some big moves next week.
Here's what's coming:
• Monday: Fed Chair Warsh speaks
• Tuesday: US Retail Sales + $NVDA earnings
• Wednesday: FOMC Minutes
• Thursday: Jobless Claims + Philly Fed Index
• Friday: Consumer Sentiment + Fed speeches
All eyes on $BTC as another important week begins.
#bitcoin
Mookie
·8 Likes
·4.9k views
AnthropicIPOTestsInvestorAppetiteForAI
35,026 views
635 Discussing
BitcoinExtendsLosingStreakToSixWeeks
941 views
44 Discussing