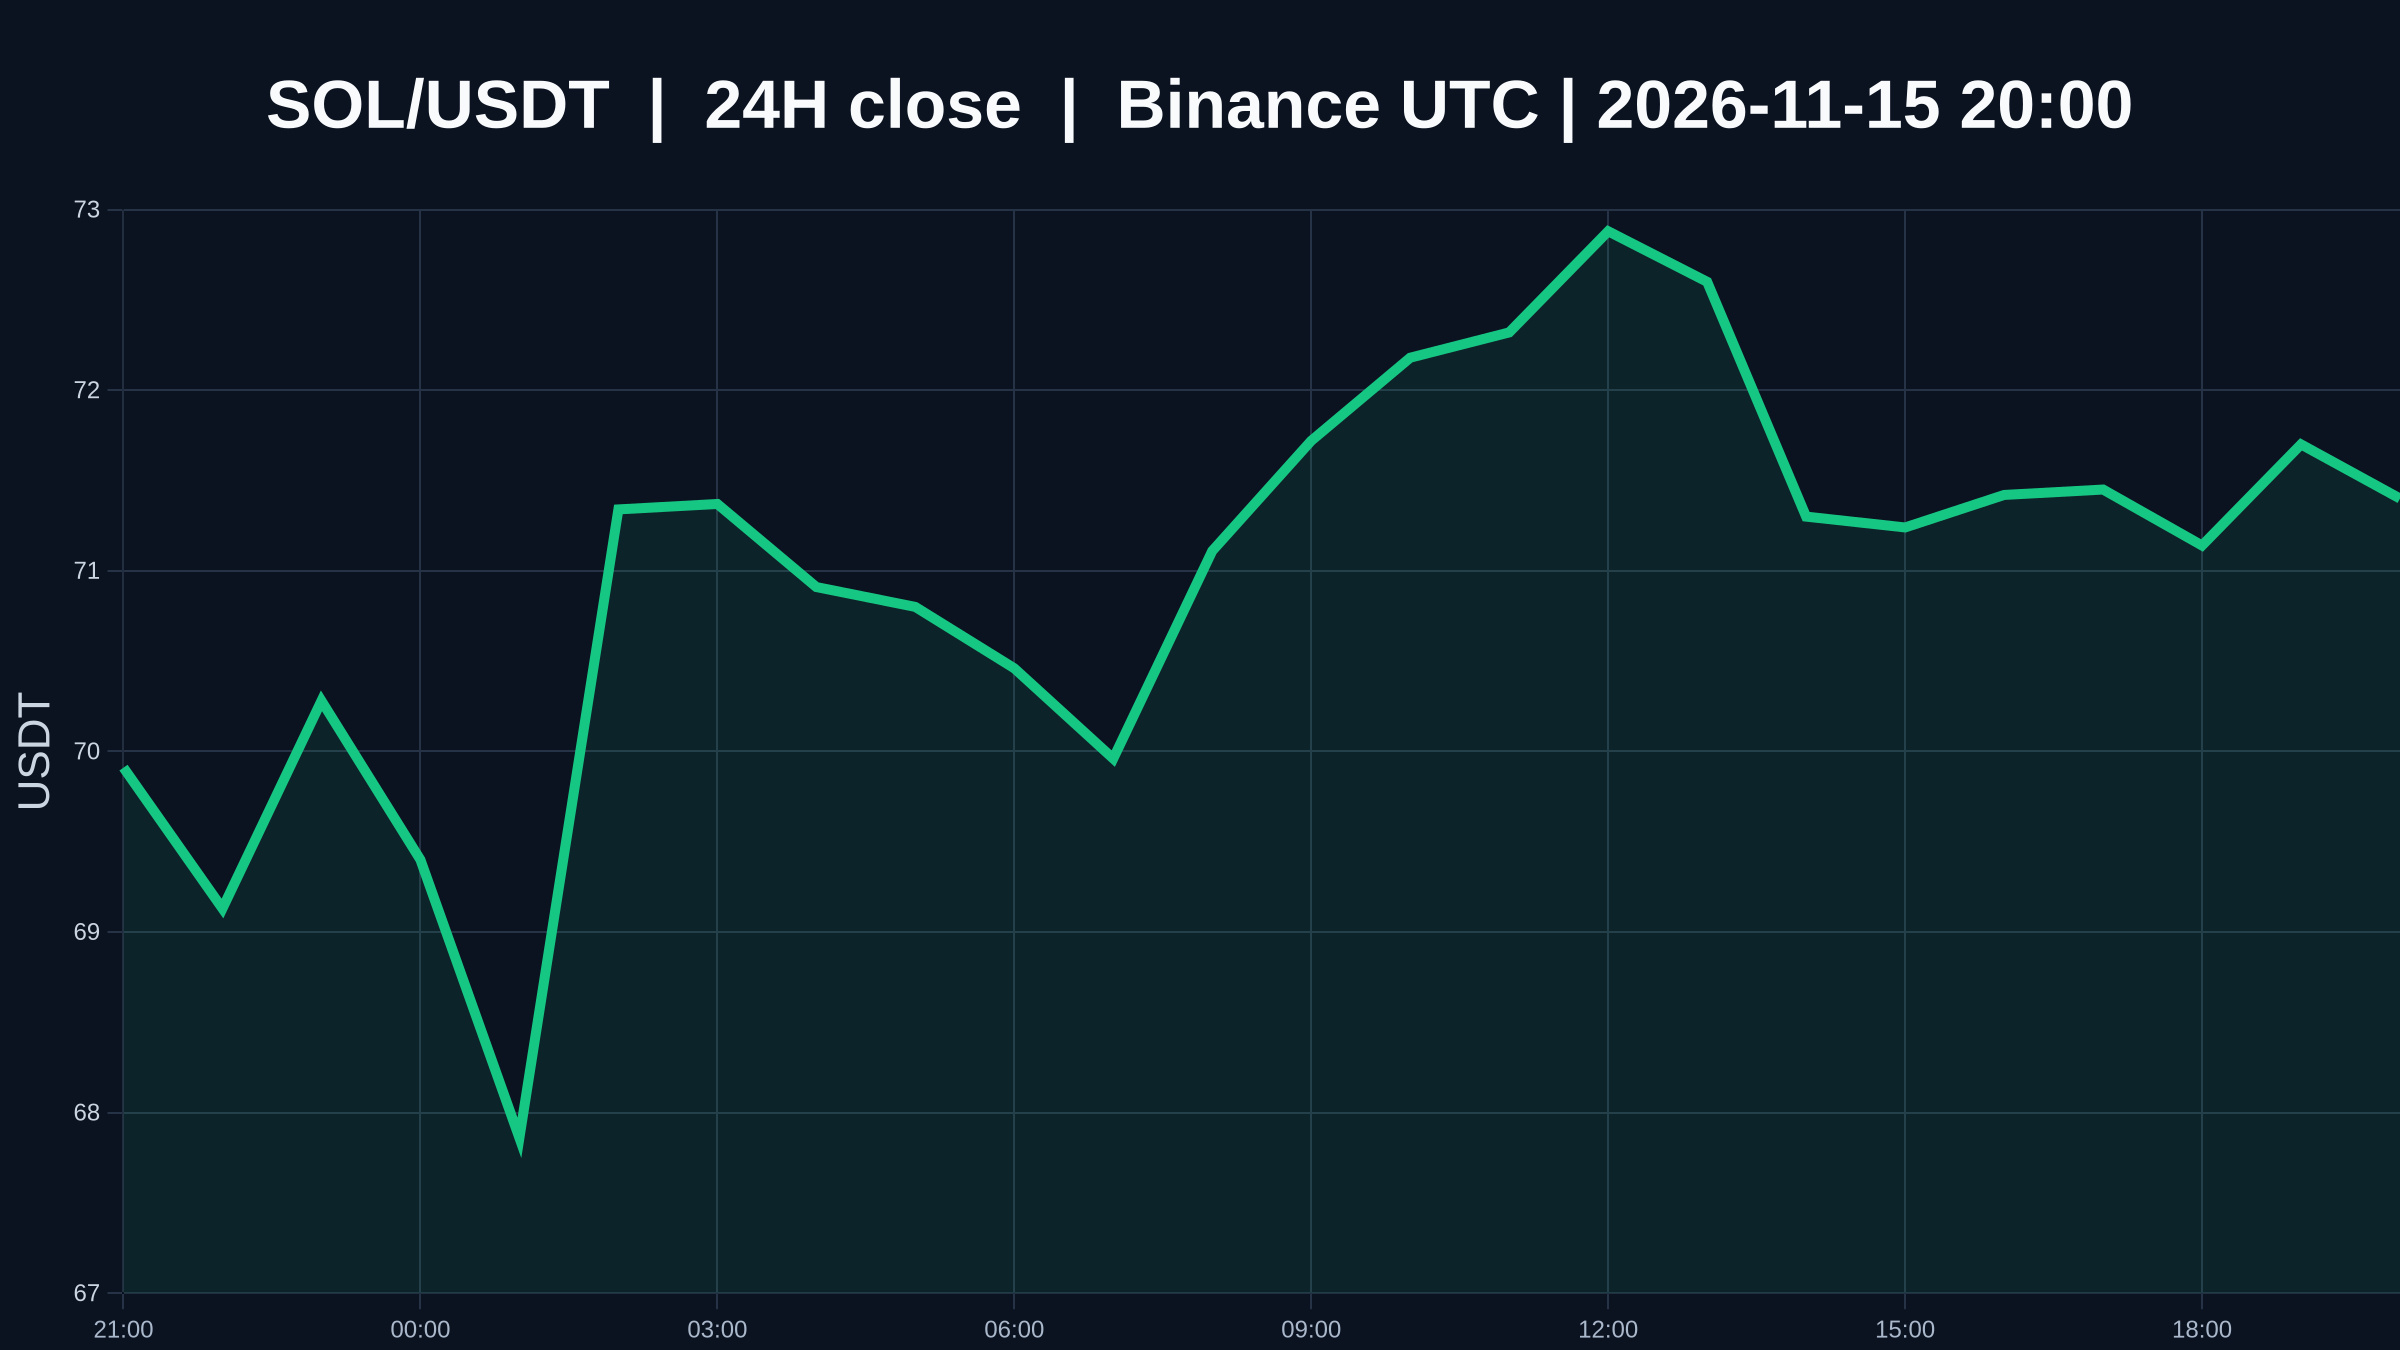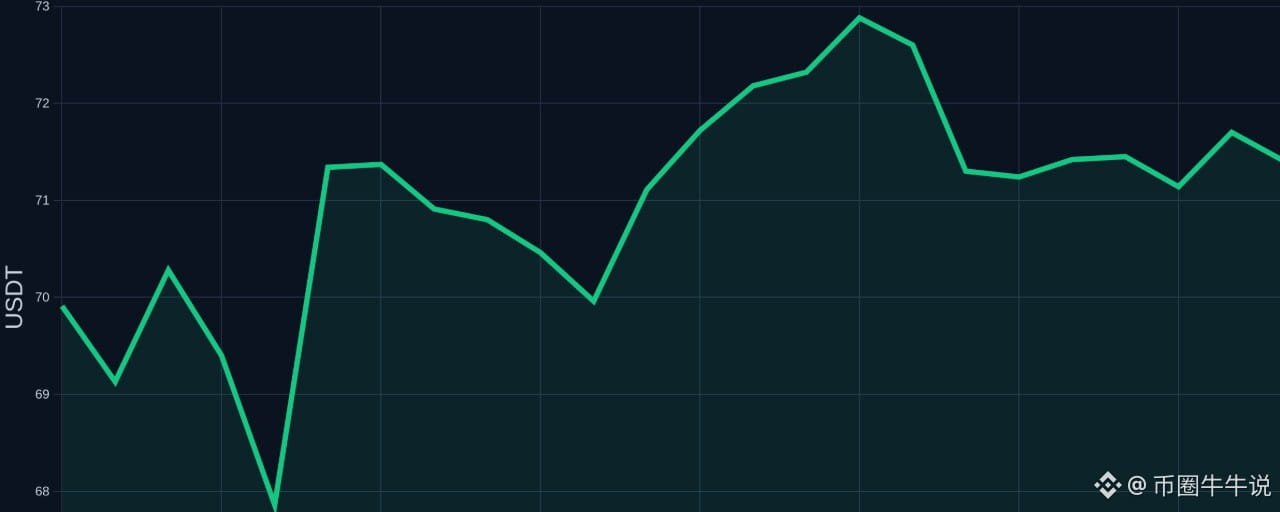

$SOL is now at 71.5 USDT, down 0.89% over 24 hours, and has fluctuated between 67.41 and 73.28 intraday. The 1-hour and 4-hour trends are both weak, while trading participation is only 0.07x. The price has already pulled back considerably from its high, but there has never been a simple line separating oversold conditions from a bottom.
My view is that rebound demand has emerged, but until the structure stops weakening, I won’t equate oversold conditions with a bottom.
Rebound demand has indeed emerged, but until the structure stops weakening, I won’t equate oversold conditions with a bottom. A sharp decline only shows that selling pressure has occurred; it doesn’t automatically mean the price is cheap, much less prove that anyone is truly defending support. When an indicator reaches a low level—for example, when the RSI enters oversold territory—it only shows that selling pressure has been released in a concentrated burst. It doesn’t mean buyers have organized. To confirm that the decline has stalled, the price needs to stop making new lows and reclaim key levels; one bullish candle isn’t enough to declare a reversal. Many people treat oversold conditions as a rebound signal, but oversold only means that selling pressure has been released. It doesn’t mean that selling pressure is exhausted, much less that buyers are willing to step in at this level.
From a price-level perspective, the distance to the 1-hour support at 67.41 is about 5.72%, while the distance to resistance at 73.28 is about 2.49%. There isn't much room in either direction, but the weak structure means any rebound could be pushed back down. The 1-hour outlook is weak, which usually indicates that short-term capital is stepping aside when prices rise rather than watching for buyers to step in on a pullback. The 4-hour outlook is also weak, indicating that the broader trend remains unfavorable to bulls. Price has fluctuated repeatedly within the range, with no clear breakout signal.
Another sign of a weak structure is that volume often fails to pick up during rebounds, while it tends to expand during declines. This volume-price asymmetry is a typical feature of a continuing trend. Bullish confidence is low, and bears remain in control. Unless sustained buying comes in, each rebound may be seen as an opportunity to reduce positions rather than the start of a trend reversal.
Trading participation at 0.07x indicates very low market interest at present. This means current trading volume is only 7% of the average volume over the past 20 candlesticks. In these low-volume conditions, price swings can be amplified, but the market's choice of direction can often come more suddenly. If a rebound isn't accompanied by higher volume, it can easily prove short-lived. Without an expansion in volume, a single fast-moving candlestick isn't enough to change the weak structure. When participation is low, the market becomes less sensitive to news; volatility may contract or expand, but trends often tend to persist.
Looking for signs of a bottom in a weak structure carries the risk that what you think is a bottom may just be a pause in the decline. If 67.41 fails, there is no clear support below, and the price may continue searching for a bottom. At that point, oversold indicators may remain oversold; persistent oversold readings at low levels often indicate a strong trend rather than a bottoming signal. This is not uncommon in crypto markets. So until support is confirmed, any attempt to spot a bottom is just a gamble, not a conditions-based trade.
The rebound thesis only has a chance of holding if price breaks above the 1-hour resistance at 73.28 on increased volume and then successfully retests it. From there, the 4-hour resistance can be monitored. That's the condition for a breakout opportunity. Another possibility is a support-bounce opportunity: after price approaches 67.41, it quickly recovers, and volume does not continue to contract. Only then would it indicate buyers are stepping in near support. Both opportunities require volume confirmation; otherwise, only half the conditions have been met. Until the conditions are fulfilled, an opportunity is only a possibility, not a certainty.
The invalidation conditions are also clear: if price breaks below 67.41 and fails to recover, the support-bounce thesis is invalidated; if it only briefly pierces 73.28 before falling back below, the breakout thesis is invalidated. Opportunities come from conditions being met, not from simply calling for a rally. Until the conditions are satisfied, any bullish statement is just a hypothesis, and hypotheses need to be tested.
The next time I open the chart, I'll check whether buyers are consistently stepping in around 73.28, and whether price can recover after touching 67.41. If volume at 0.07x keeps failing to expand, I won't rush to chase any sharp rebound. Do you treat oversold conditions as a rebound signal, or wait for price to stop making new lows first? Markets are volatile. The above is for market observation only and does not constitute investment advice.
Related token: $SOL
#SOL #Solana