
合约涨跌AI预判-VIP-0824版
9.2k Posts

合约涨跌AI预判-VIP-0824版
 Square Verified+
以咨询级视角拆解 AI 趋势、智能工具与商业应用,过滤信息噪音,提炼真正有价值的前沿洞察 | 任何帖子非财务投资建议 | Opinions are my own & Not Financial Advice

Creator Awards 2024

原创之星

Level 1 Creator
Open Trade
Occasional Trader
5.6 Years
0 Following
72.6K+ Followers
691.0K+ Liked
4 Badges
Posts
Portfolio
All
Quotes
Videos
Live
Contract 24H Gainers Ranking · Deep Dive into the Top 3
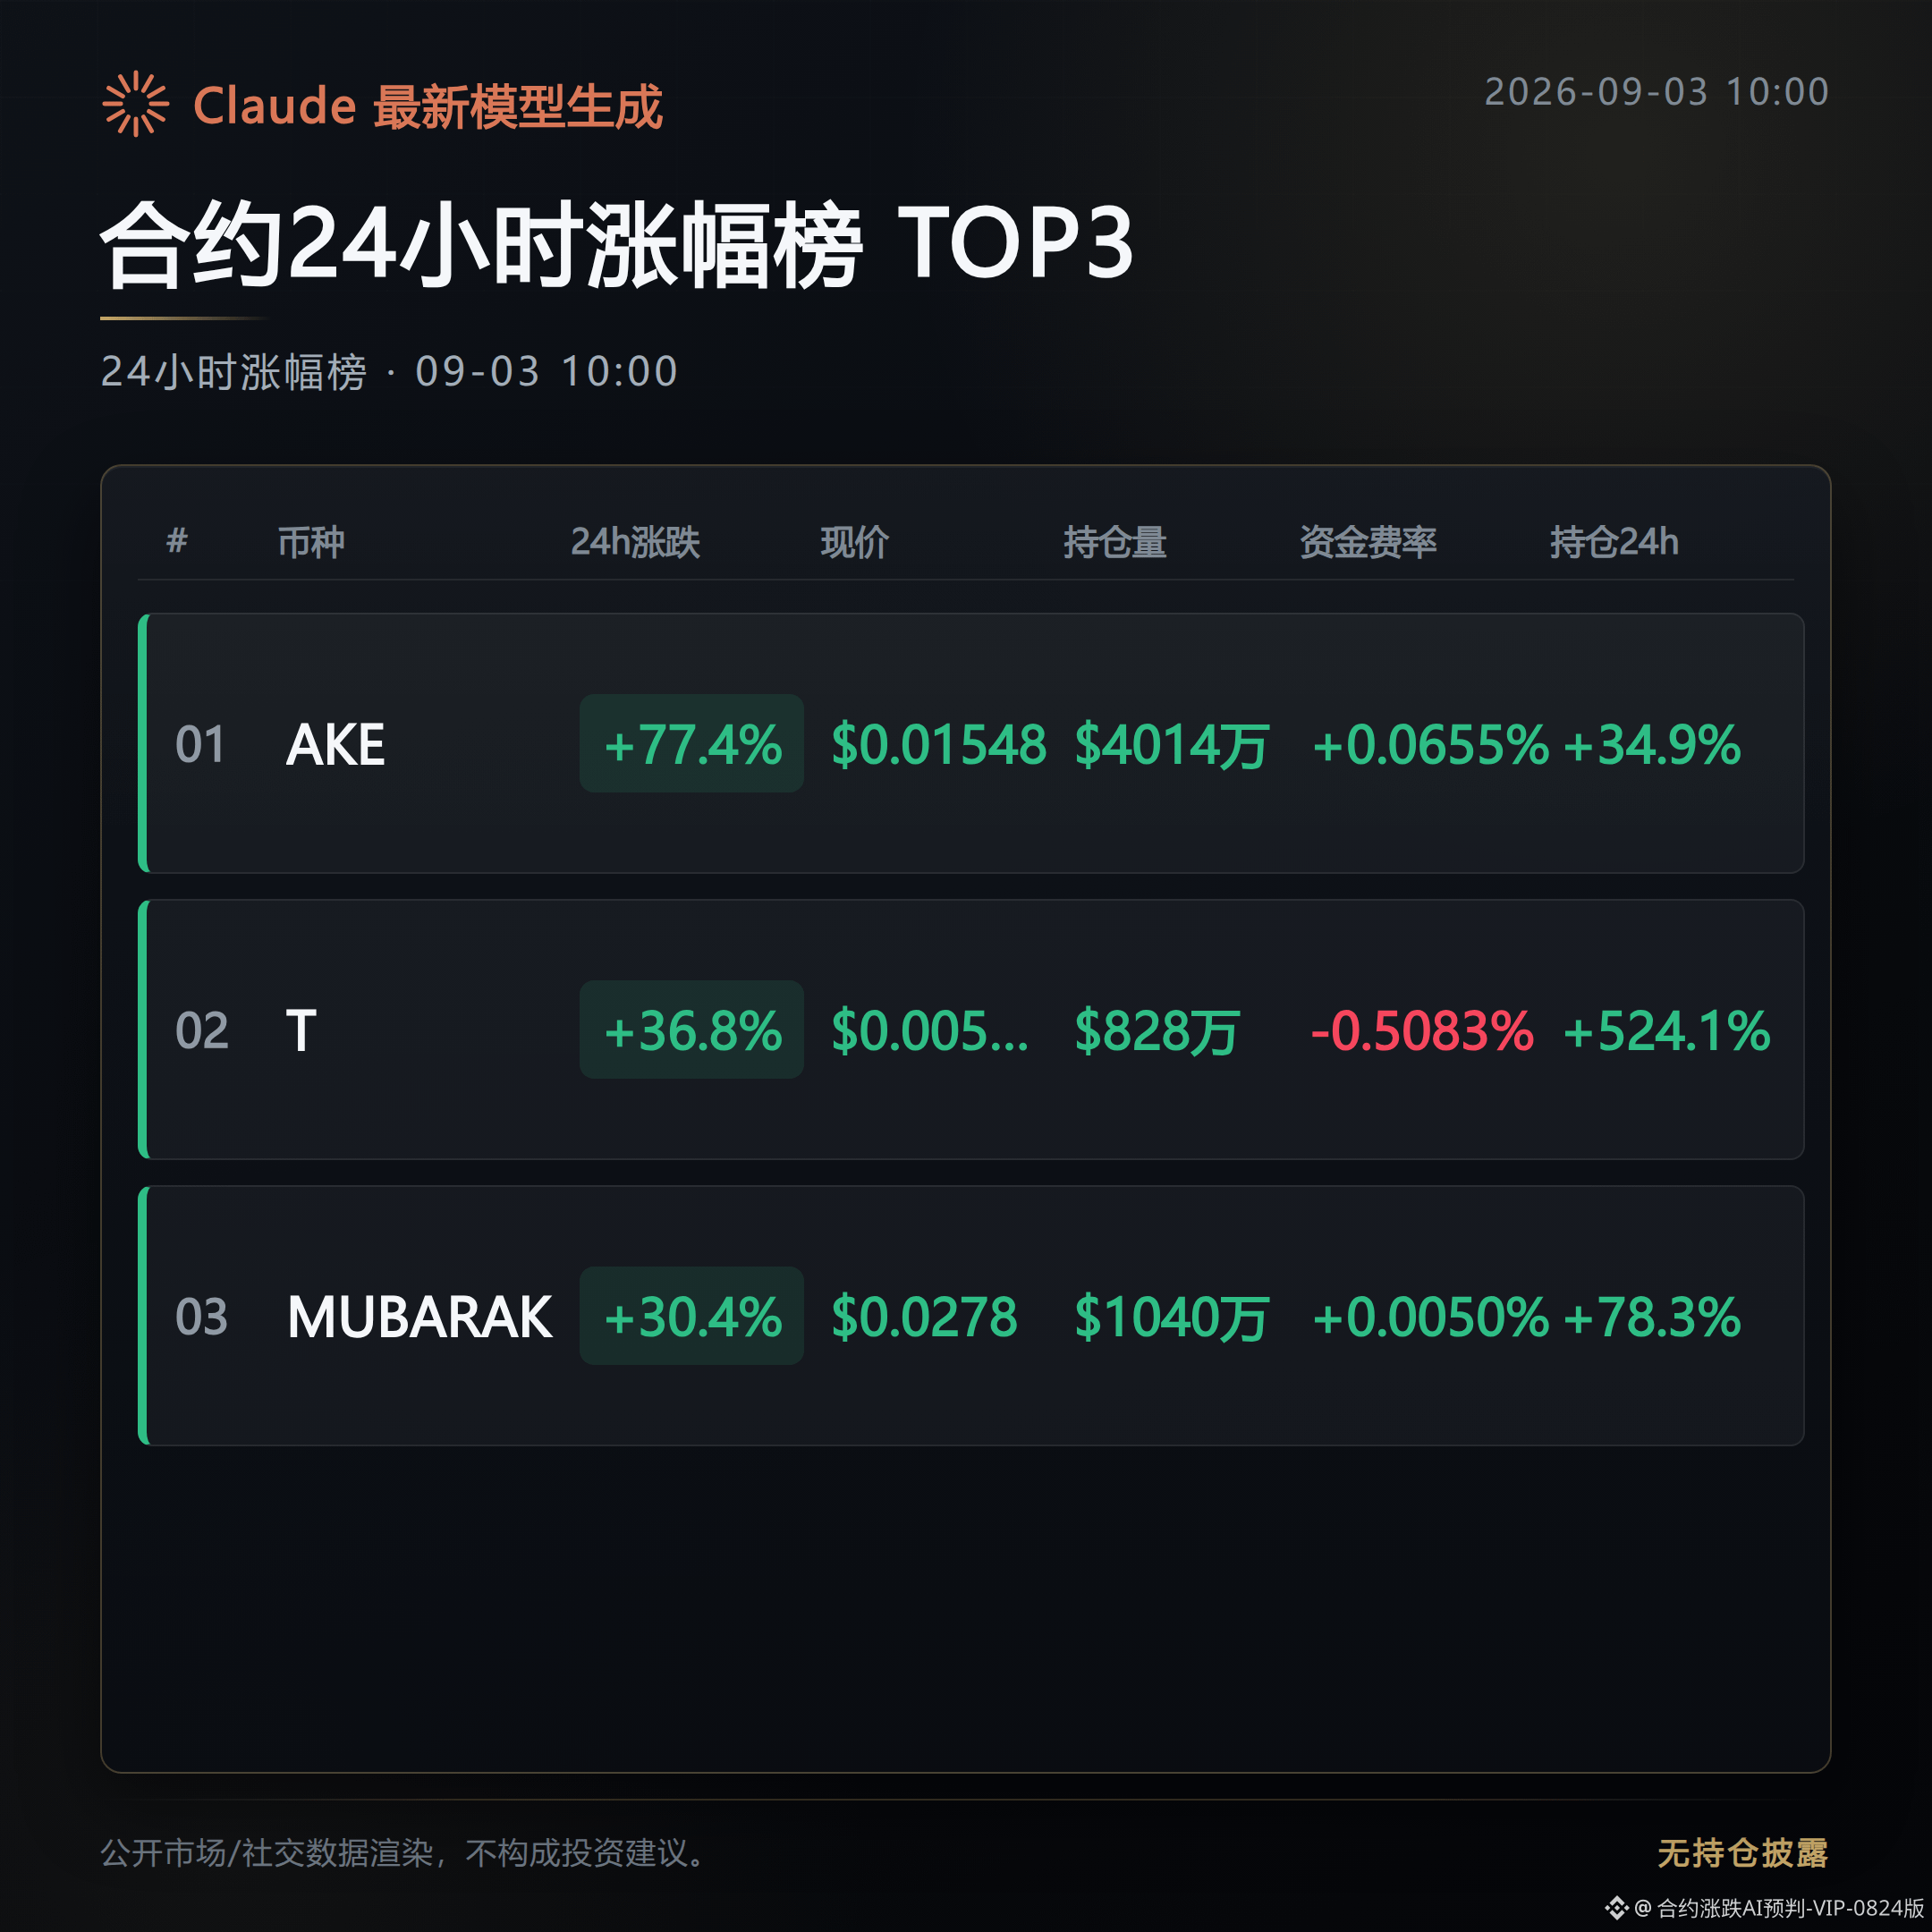
At 10:00 in the morning, go through the top three on Binance’s 24-hour contract gainers list.
This time, from a retrospective audit perspective: take the position signals each coin has accumulated over the past 24 hours, then check them again within the most recent 1 hour to see whether they’re continuing or have already weakened.
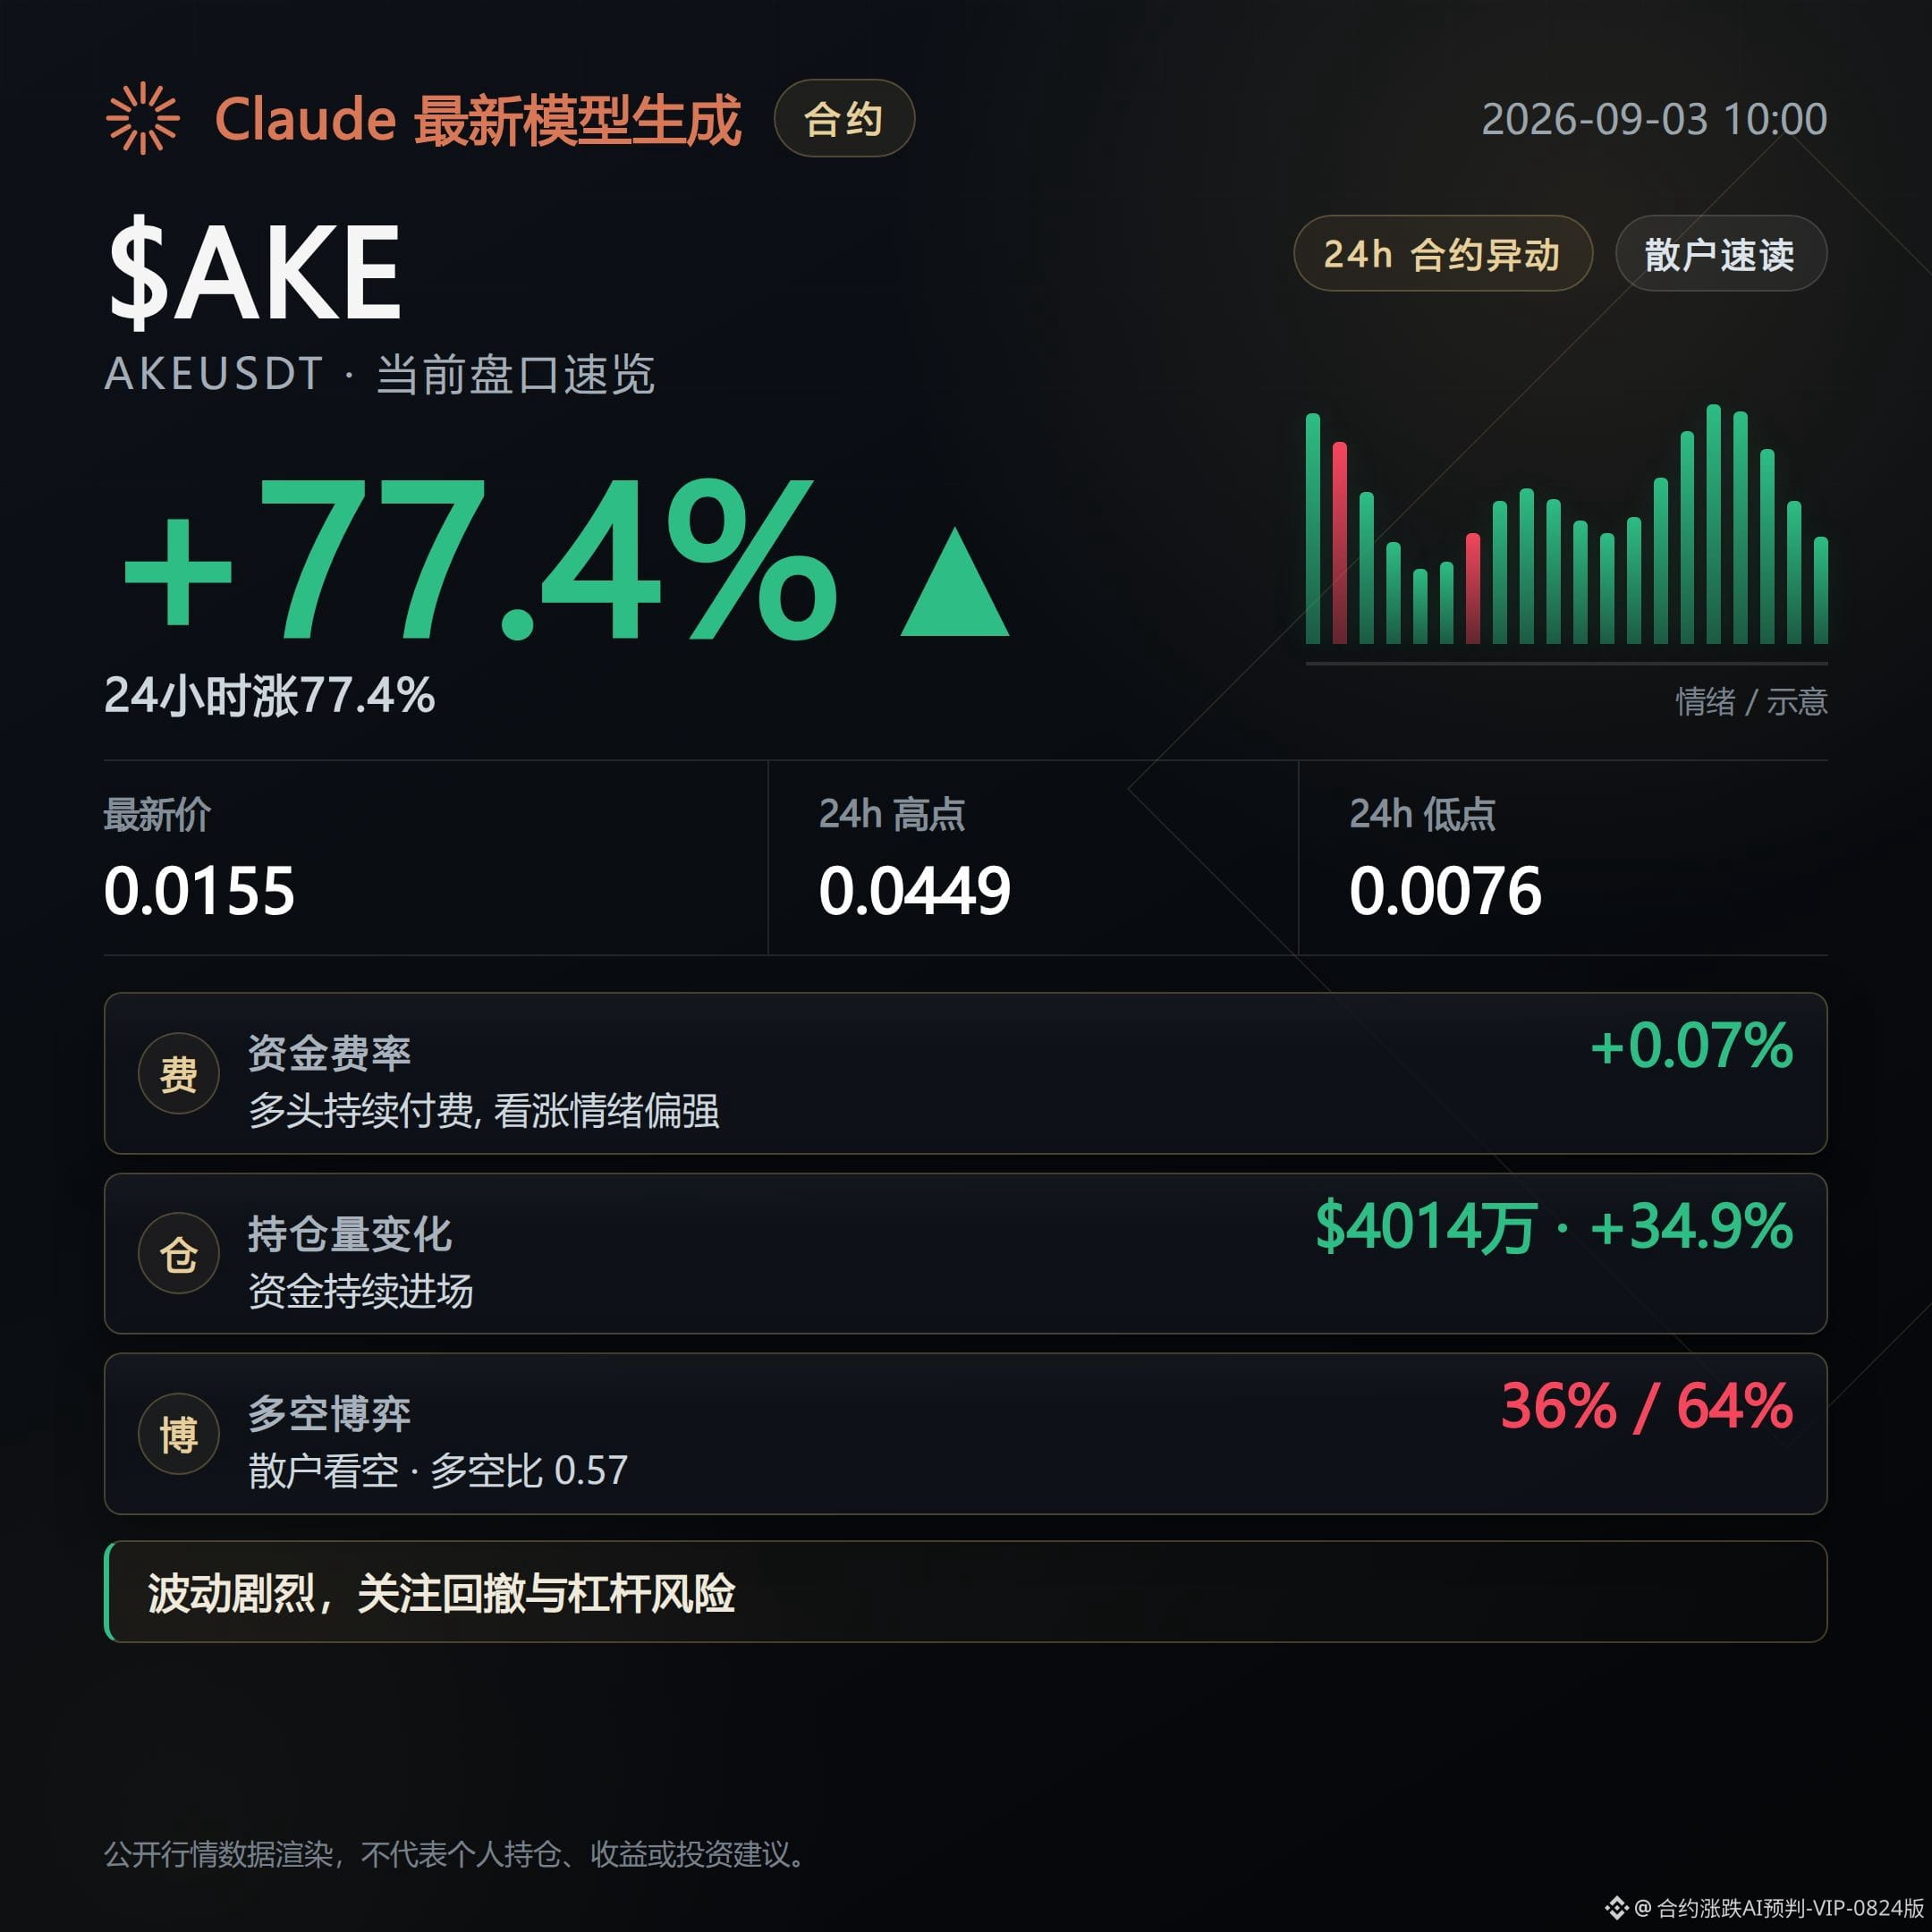
AKEUSDT rose 77.42%, the largest gain among the three.
Trading volume was $1.097 billion, with active buy order ratio at 0.99—buyer strength is extremely concentrated.
However, when auditing the change in position size over the past 24 hours: the prior 34.9% increase signal, when mapped to the most recent 1 hour, has turned to -4.9%.
Funding rate is only 0.0655%, with continuous long payments for 1 period—accumulation is still very shallow.
The Super Trend indicator shows a downturn, and RSI 61.3 is in a neutral zone.
Conclusion: the positioning/build-up signal behind this upswing has not continued over the past 1 hour.
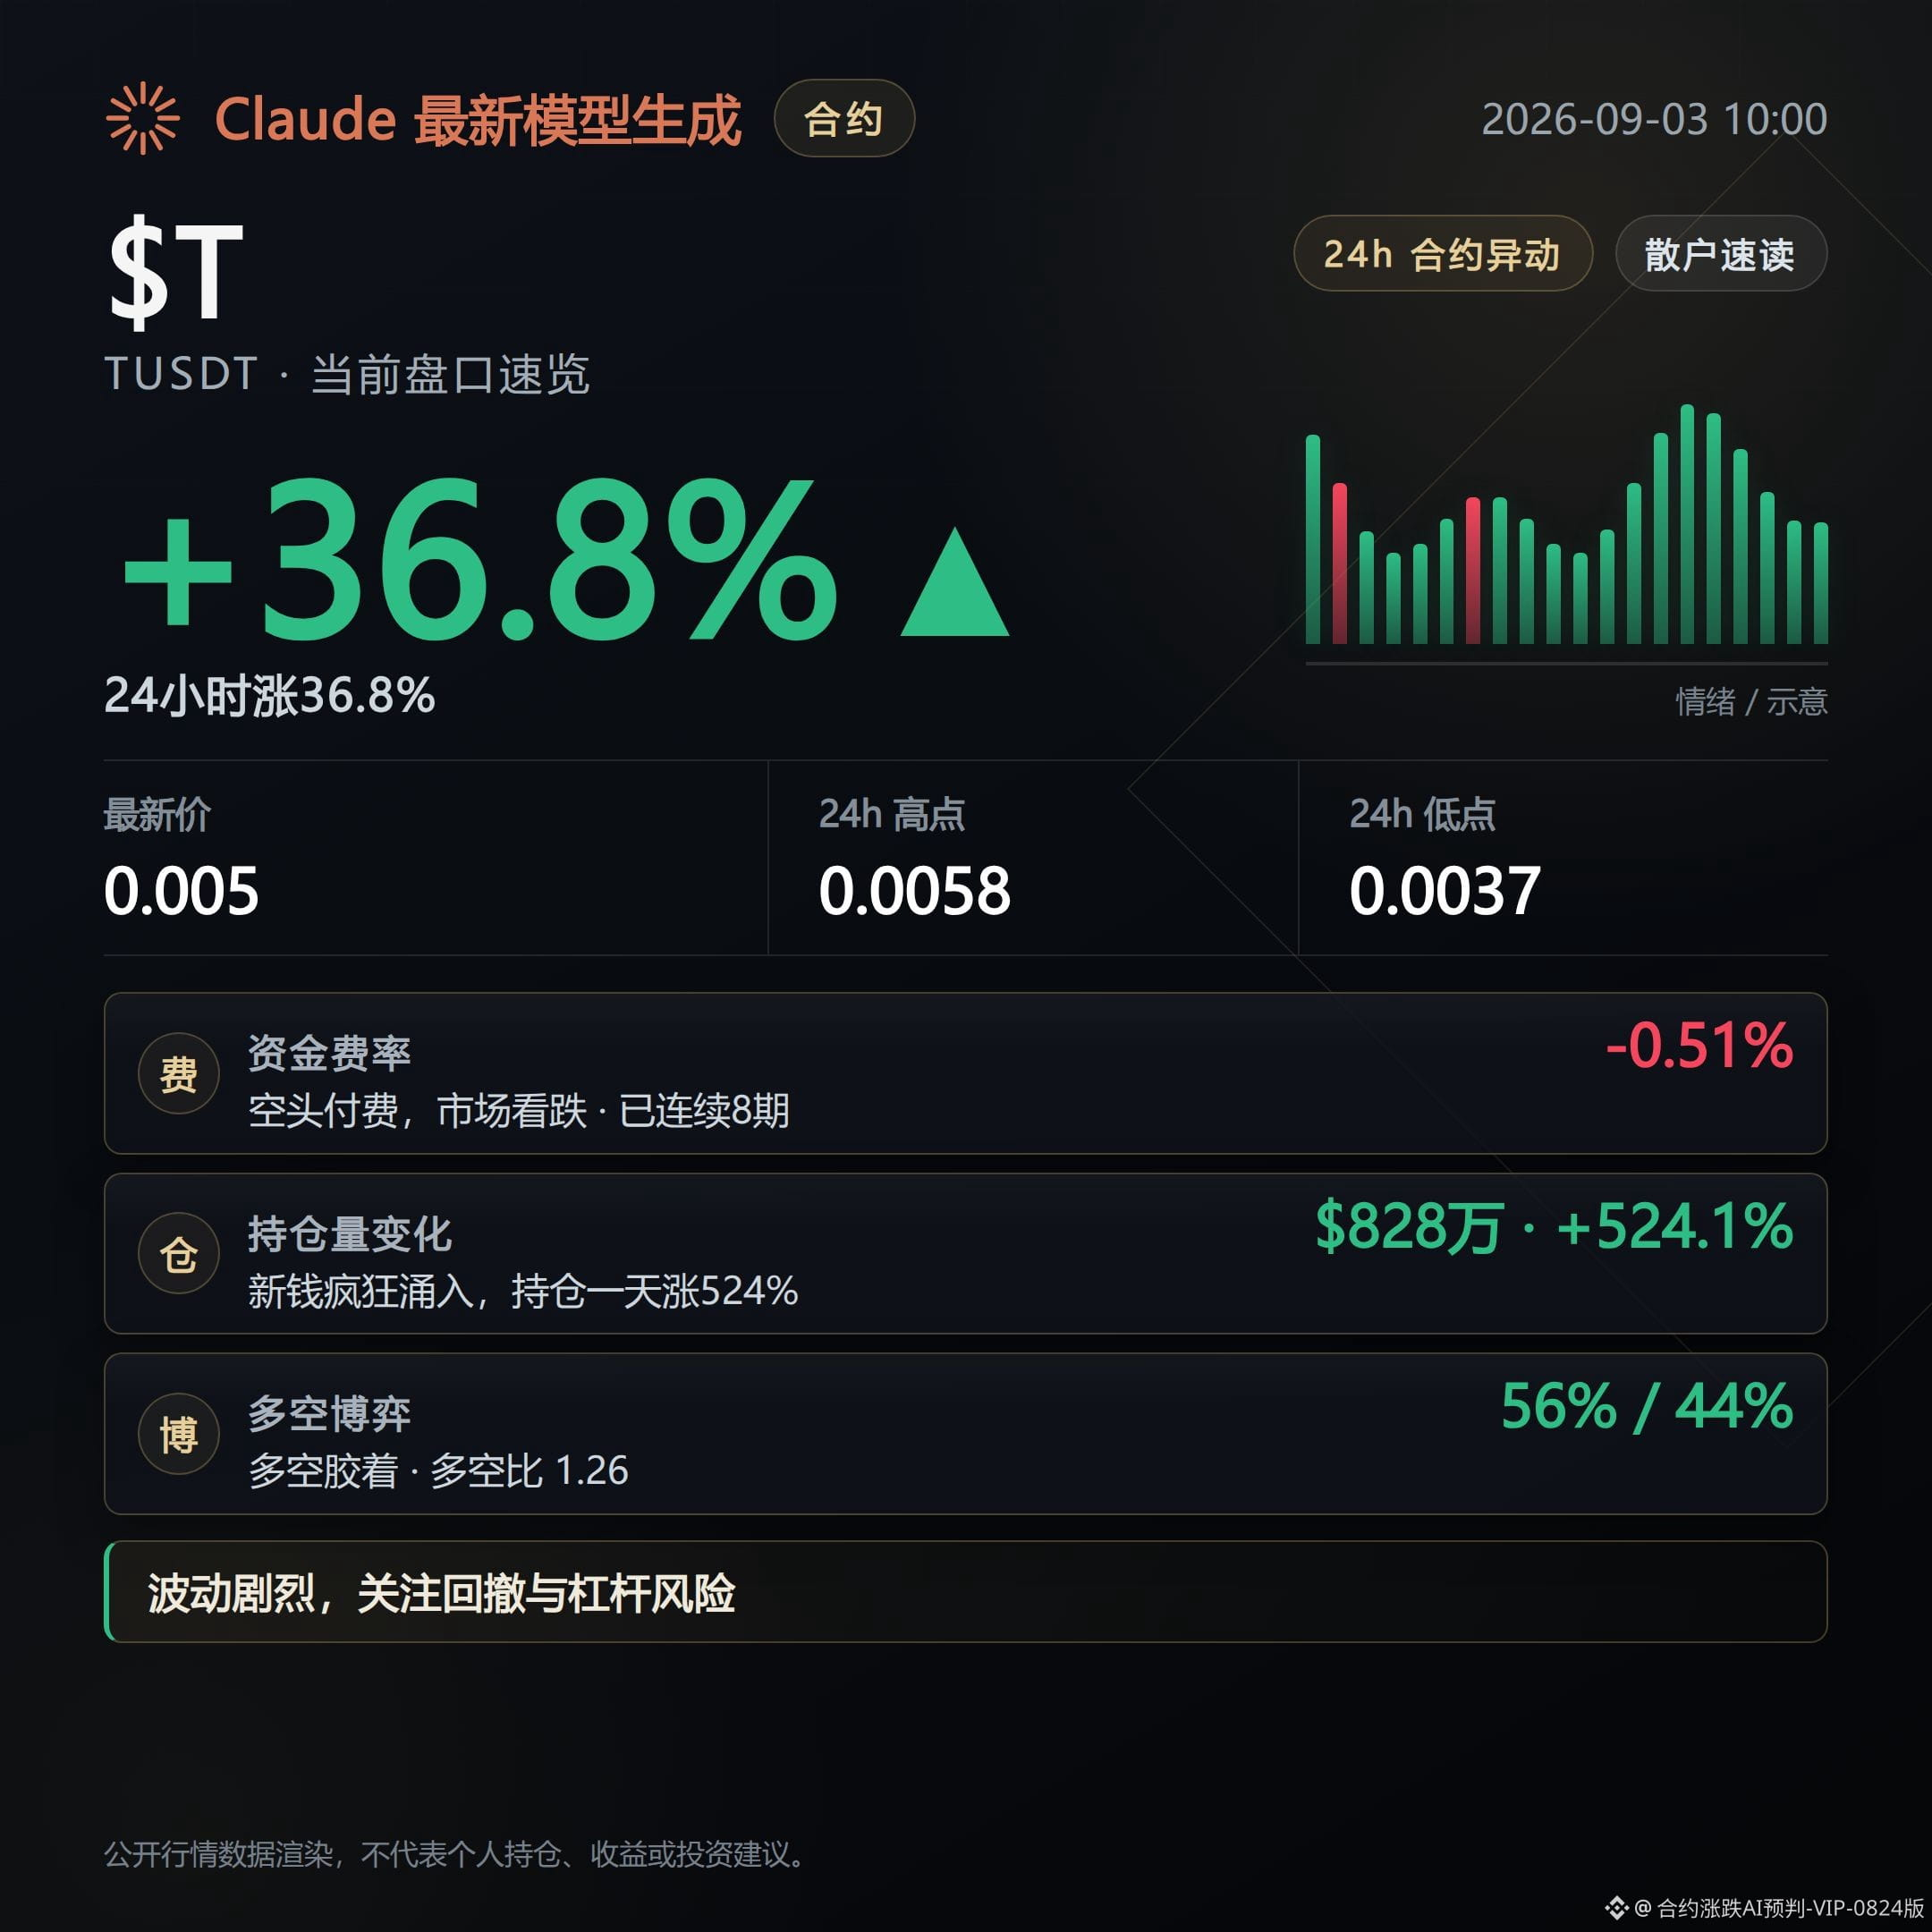
TUSDT rose 36.76%, with funding rate at -0.5083%, and has had short payments for 8 consecutive periods.
Position size over the past 24 hours surged 524.1%; in the most recent 1 hour it remains +1.3%, so this signal is still continuing.
Futures price relative to spot is at a 3.741% discount; the premium rate is clearly negative.
Long/short account ratio is 1.26; long accounts are 56%. Super Trend is rising, RSI 59.0 is neutral.
Among the three coins, this is one of the few where the position signal from the 24-hour window fully continues into the most recent 1 hour.
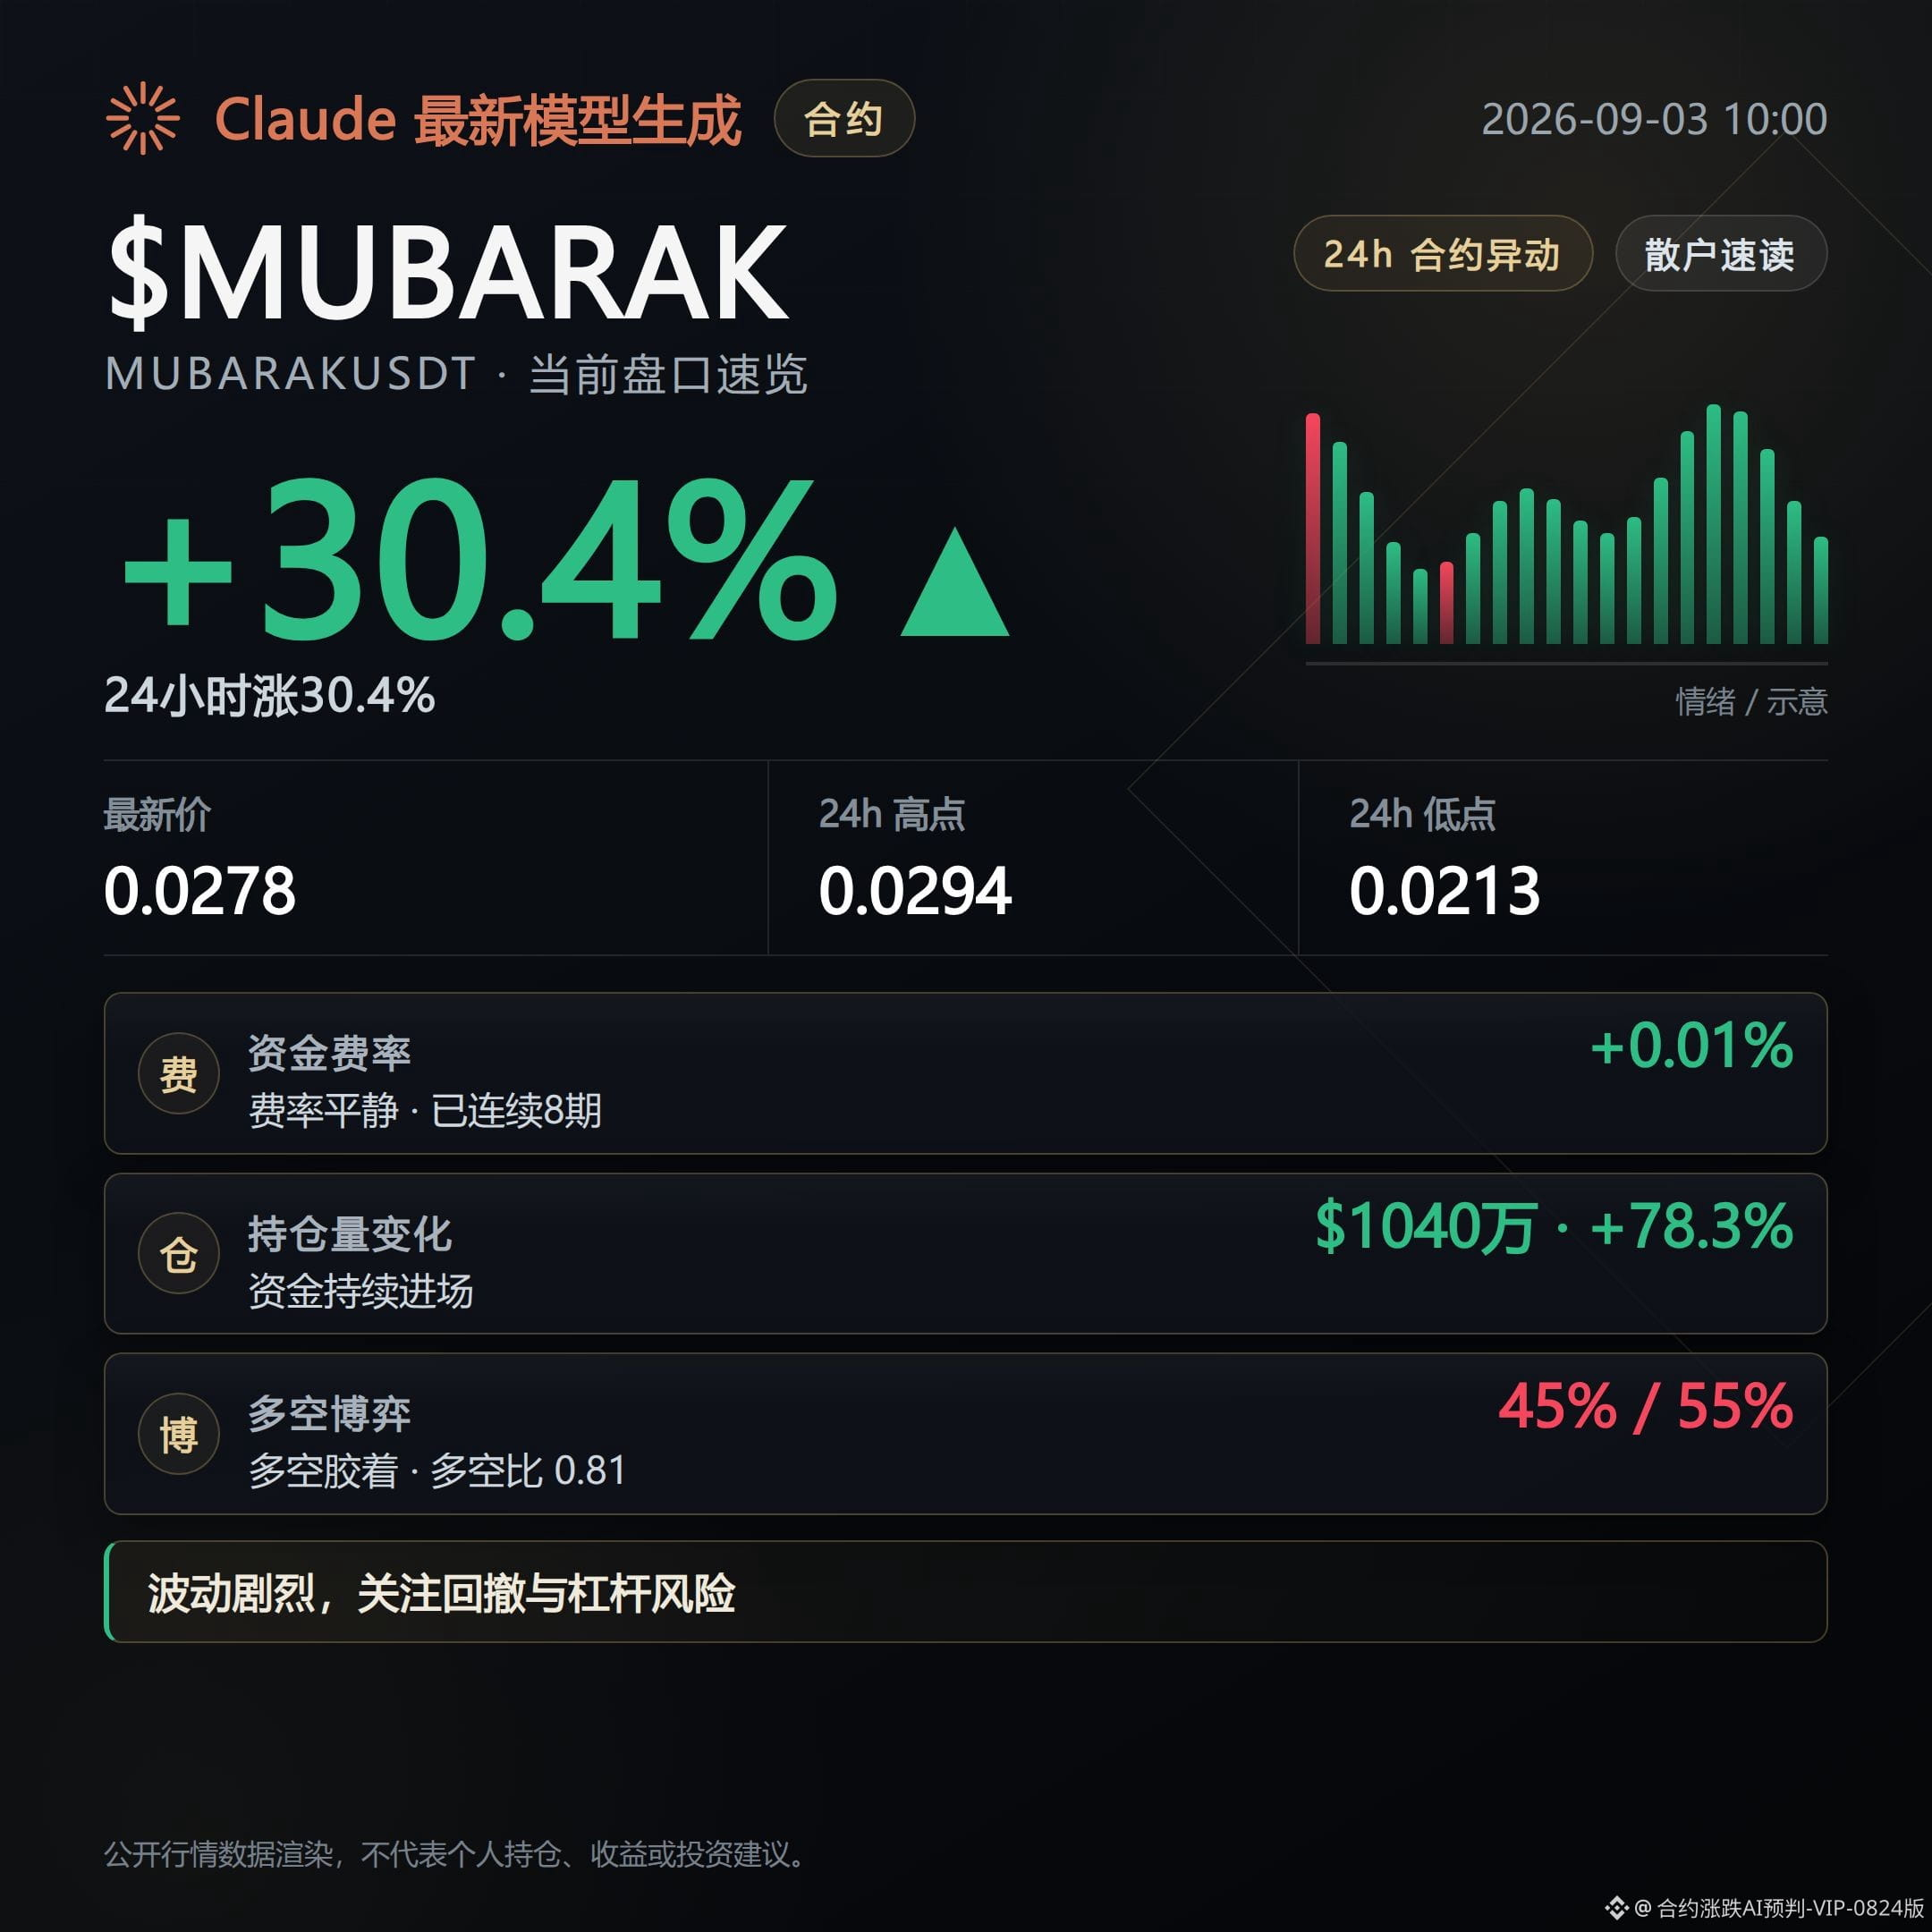
MUBARAKUSDT rose 30.45%; position size increased 78.3% over 24 hours, but turned to -1.6% in the most recent 1 hour.
Funding rate is 0.005%, with continuous long payments for 8 consecutive periods—the longest duration.
Large-holder position ratio is 2.13, the highest among the three.
RSI 68.3 is still labeled neutral, while the Super Trend indicator is rising.
The audit conclusion is the same: the positioning/build-up signal has slowed down in the most recent 1 hour.
Among the three coins, only T’s position signal fully continued into the most recent 1 hour; the position sizes for AKE and MUBARAK in the most recent 1 hour both turned negative.
In the top ranks of a gainers leaderboard, it has always been common for position size to cool off first after chasing higher prices, followed by a price pullback—this is worth noting, and it does not constitute any buy or sell advice.
$AKE $T $MUBARAK #contract行情
Positioning note: This account is held in spot as a real position with FOGO long; disclosures are provided to keep the content consistent with actual trading.
This content is assisted and generated by Claude Fable 5; for informational reference only—please verify it yourself.
At 10:00 in the morning, go through the top three on Binance’s 24-hour contract gainers list.
This time, from a retrospective audit perspective: take the position signals each coin has accumulated over the past 24 hours, then check them again within the most recent 1 hour to see whether they’re continuing or have already weakened.
AKEUSDT rose 77.42%, the largest gain among the three.
Trading volume was $1.097 billion, with active buy order ratio at 0.99—buyer strength is extremely concentrated.
However, when auditing the change in position size over the past 24 hours: the prior 34.9% increase signal, when mapped to the most recent 1 hour, has turned to -4.9%.
Funding rate is only 0.0655%, with continuous long payments for 1 period—accumulation is still very shallow.
The Super Trend indicator shows a downturn, and RSI 61.3 is in a neutral zone.
Conclusion: the positioning/build-up signal behind this upswing has not continued over the past 1 hour.
TUSDT rose 36.76%, with funding rate at -0.5083%, and has had short payments for 8 consecutive periods.
Position size over the past 24 hours surged 524.1%; in the most recent 1 hour it remains +1.3%, so this signal is still continuing.
Futures price relative to spot is at a 3.741% discount; the premium rate is clearly negative.
Long/short account ratio is 1.26; long accounts are 56%. Super Trend is rising, RSI 59.0 is neutral.
Among the three coins, this is one of the few where the position signal from the 24-hour window fully continues into the most recent 1 hour.
MUBARAKUSDT rose 30.45%; position size increased 78.3% over 24 hours, but turned to -1.6% in the most recent 1 hour.
Funding rate is 0.005%, with continuous long payments for 8 consecutive periods—the longest duration.
Large-holder position ratio is 2.13, the highest among the three.
RSI 68.3 is still labeled neutral, while the Super Trend indicator is rising.
The audit conclusion is the same: the positioning/build-up signal has slowed down in the most recent 1 hour.
Among the three coins, only T’s position signal fully continued into the most recent 1 hour; the position sizes for AKE and MUBARAK in the most recent 1 hour both turned negative.
In the top ranks of a gainers leaderboard, it has always been common for position size to cool off first after chasing higher prices, followed by a price pullback—this is worth noting, and it does not constitute any buy or sell advice.
$AKE $T $MUBARAK #contract行情
Positioning note: This account is held in spot as a real position with FOGO long; disclosures are provided to keep the content consistent with actual trading.
This content is assisted and generated by Claude Fable 5; for informational reference only—please verify it yourself.
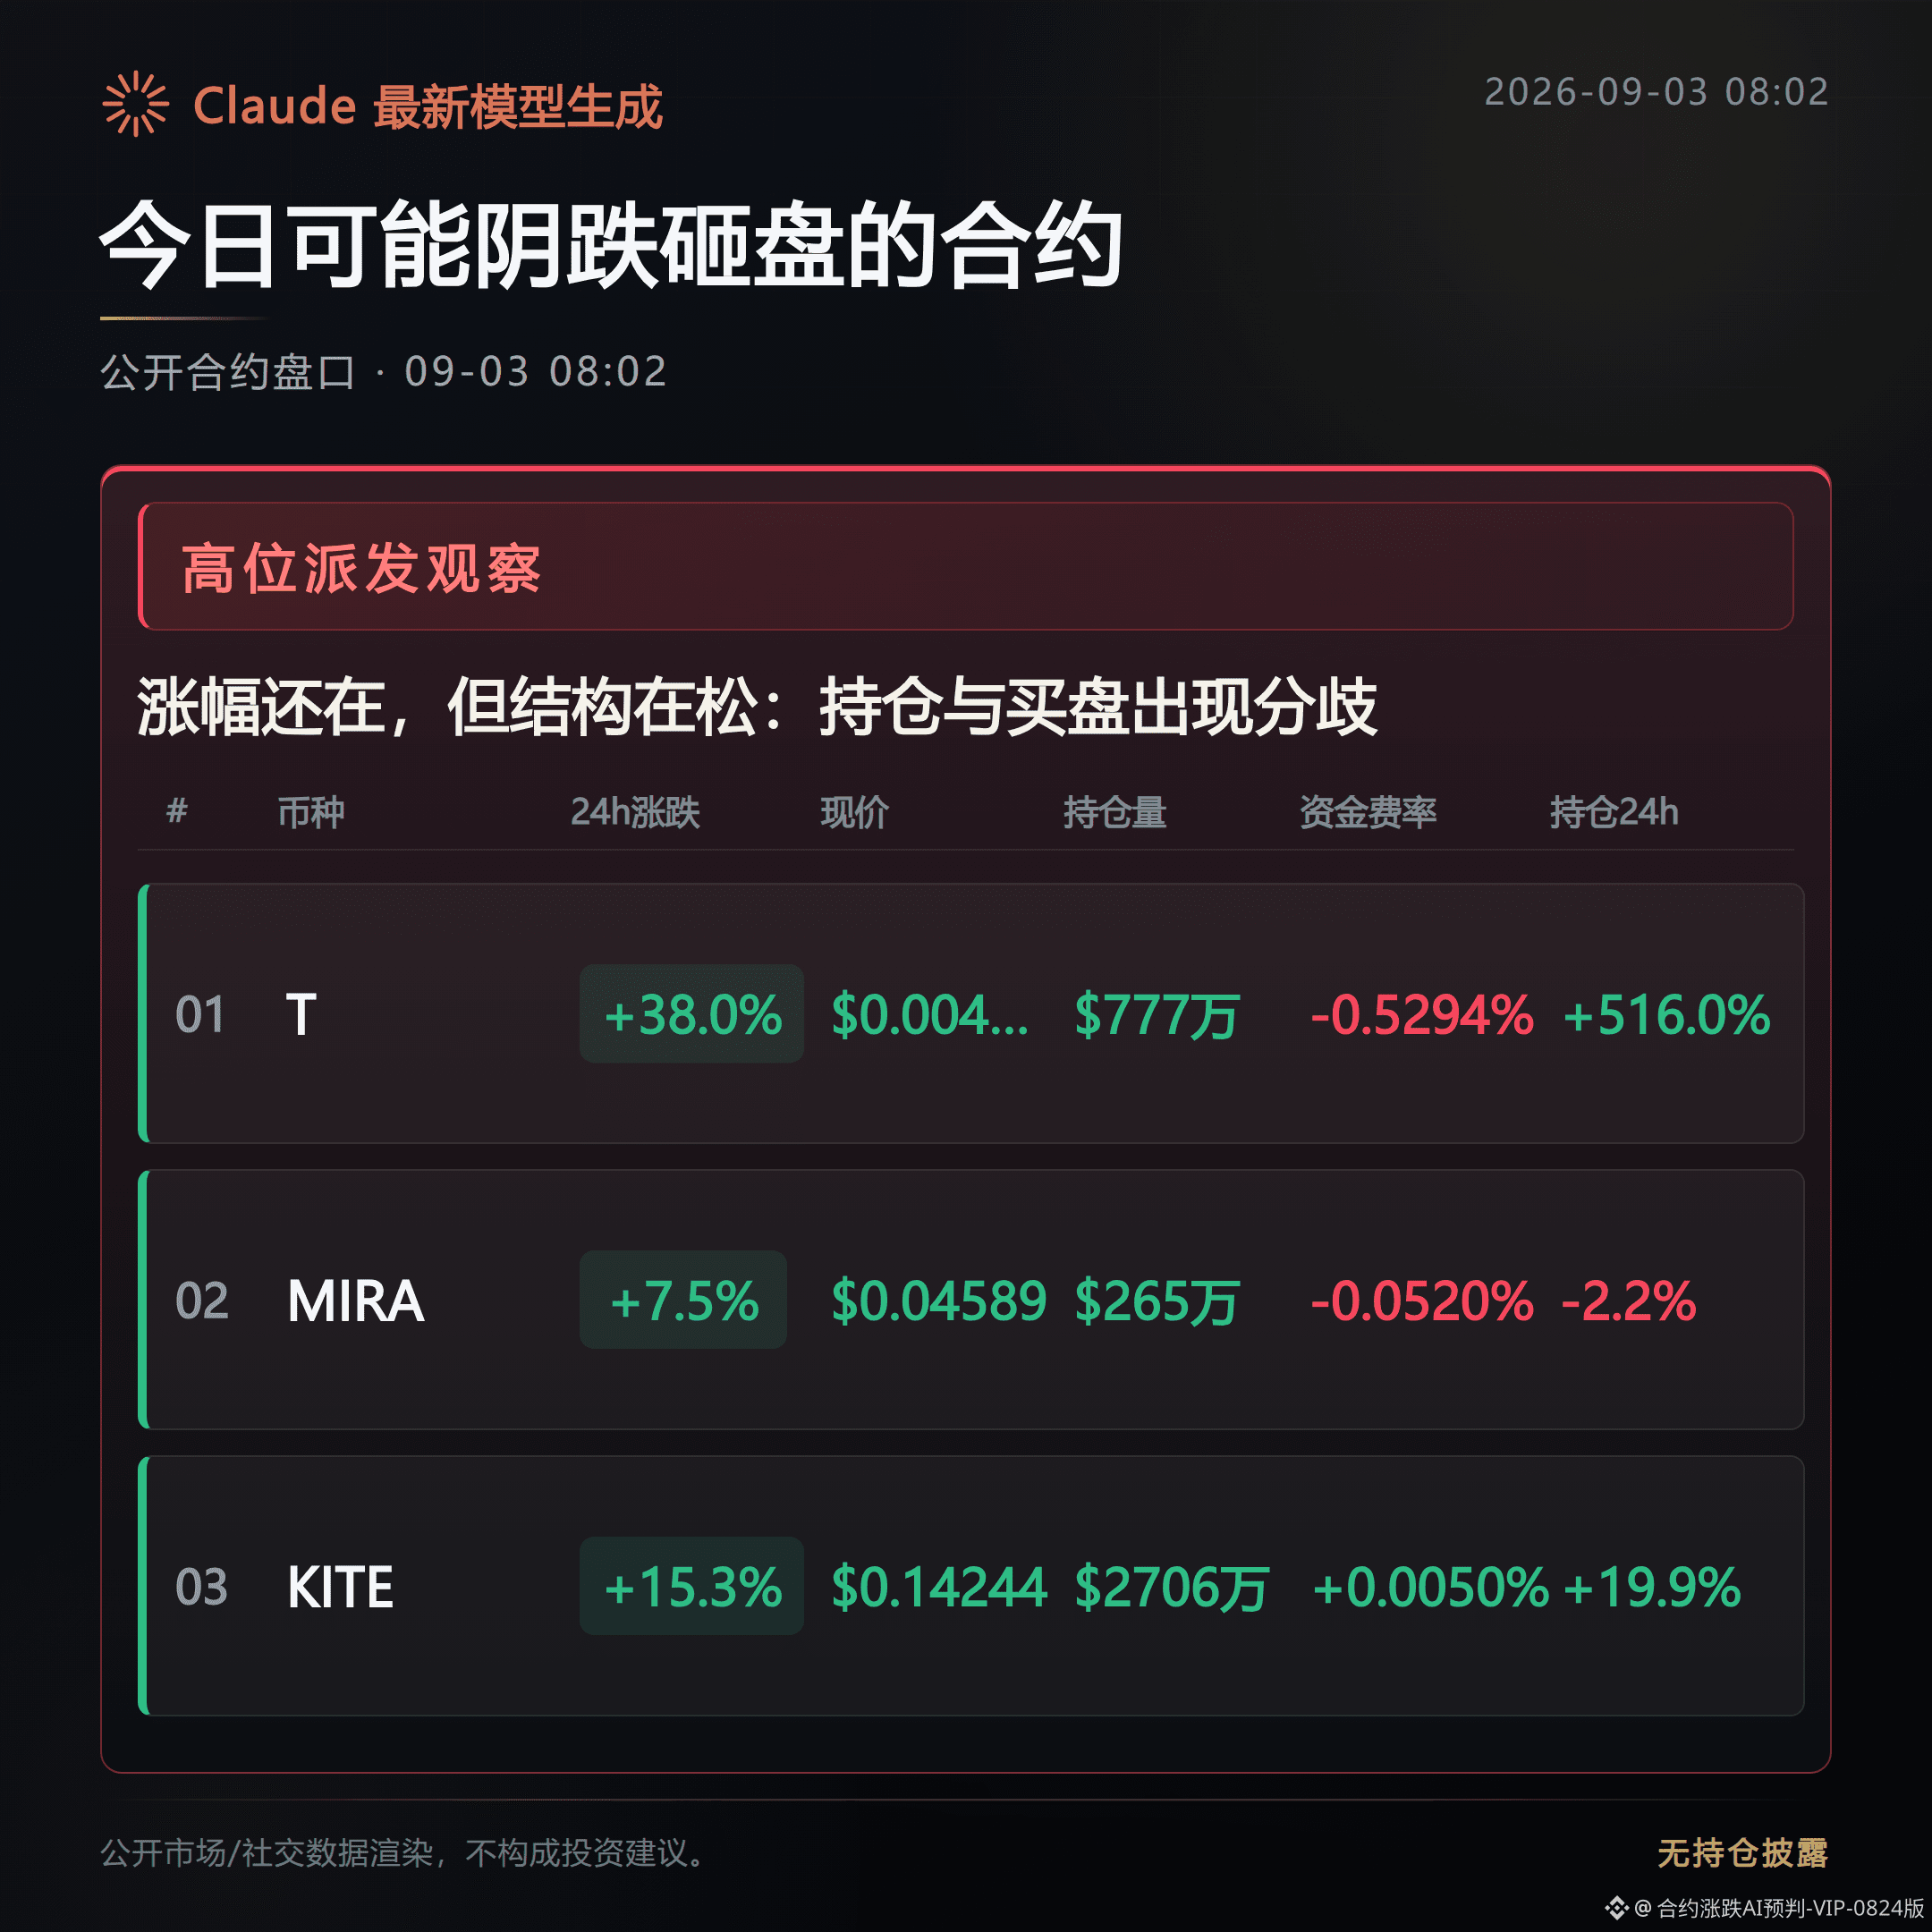
Today’s judgment on these contracts leans toward a slow grind lower after a pullback.
The price is still pushing higher, but the structure has already loosened—these two together are the real risk.
Don’t just look at the percentage gain. What you fear isn’t not rising; it’s rising and then watching the support thin out.
The public order-book shows funding signals that the liquidity is dispersing.
What to watch next is whether the support keeps thinning; once that line plays out, the slow grind lower and pullback case is confirmed.
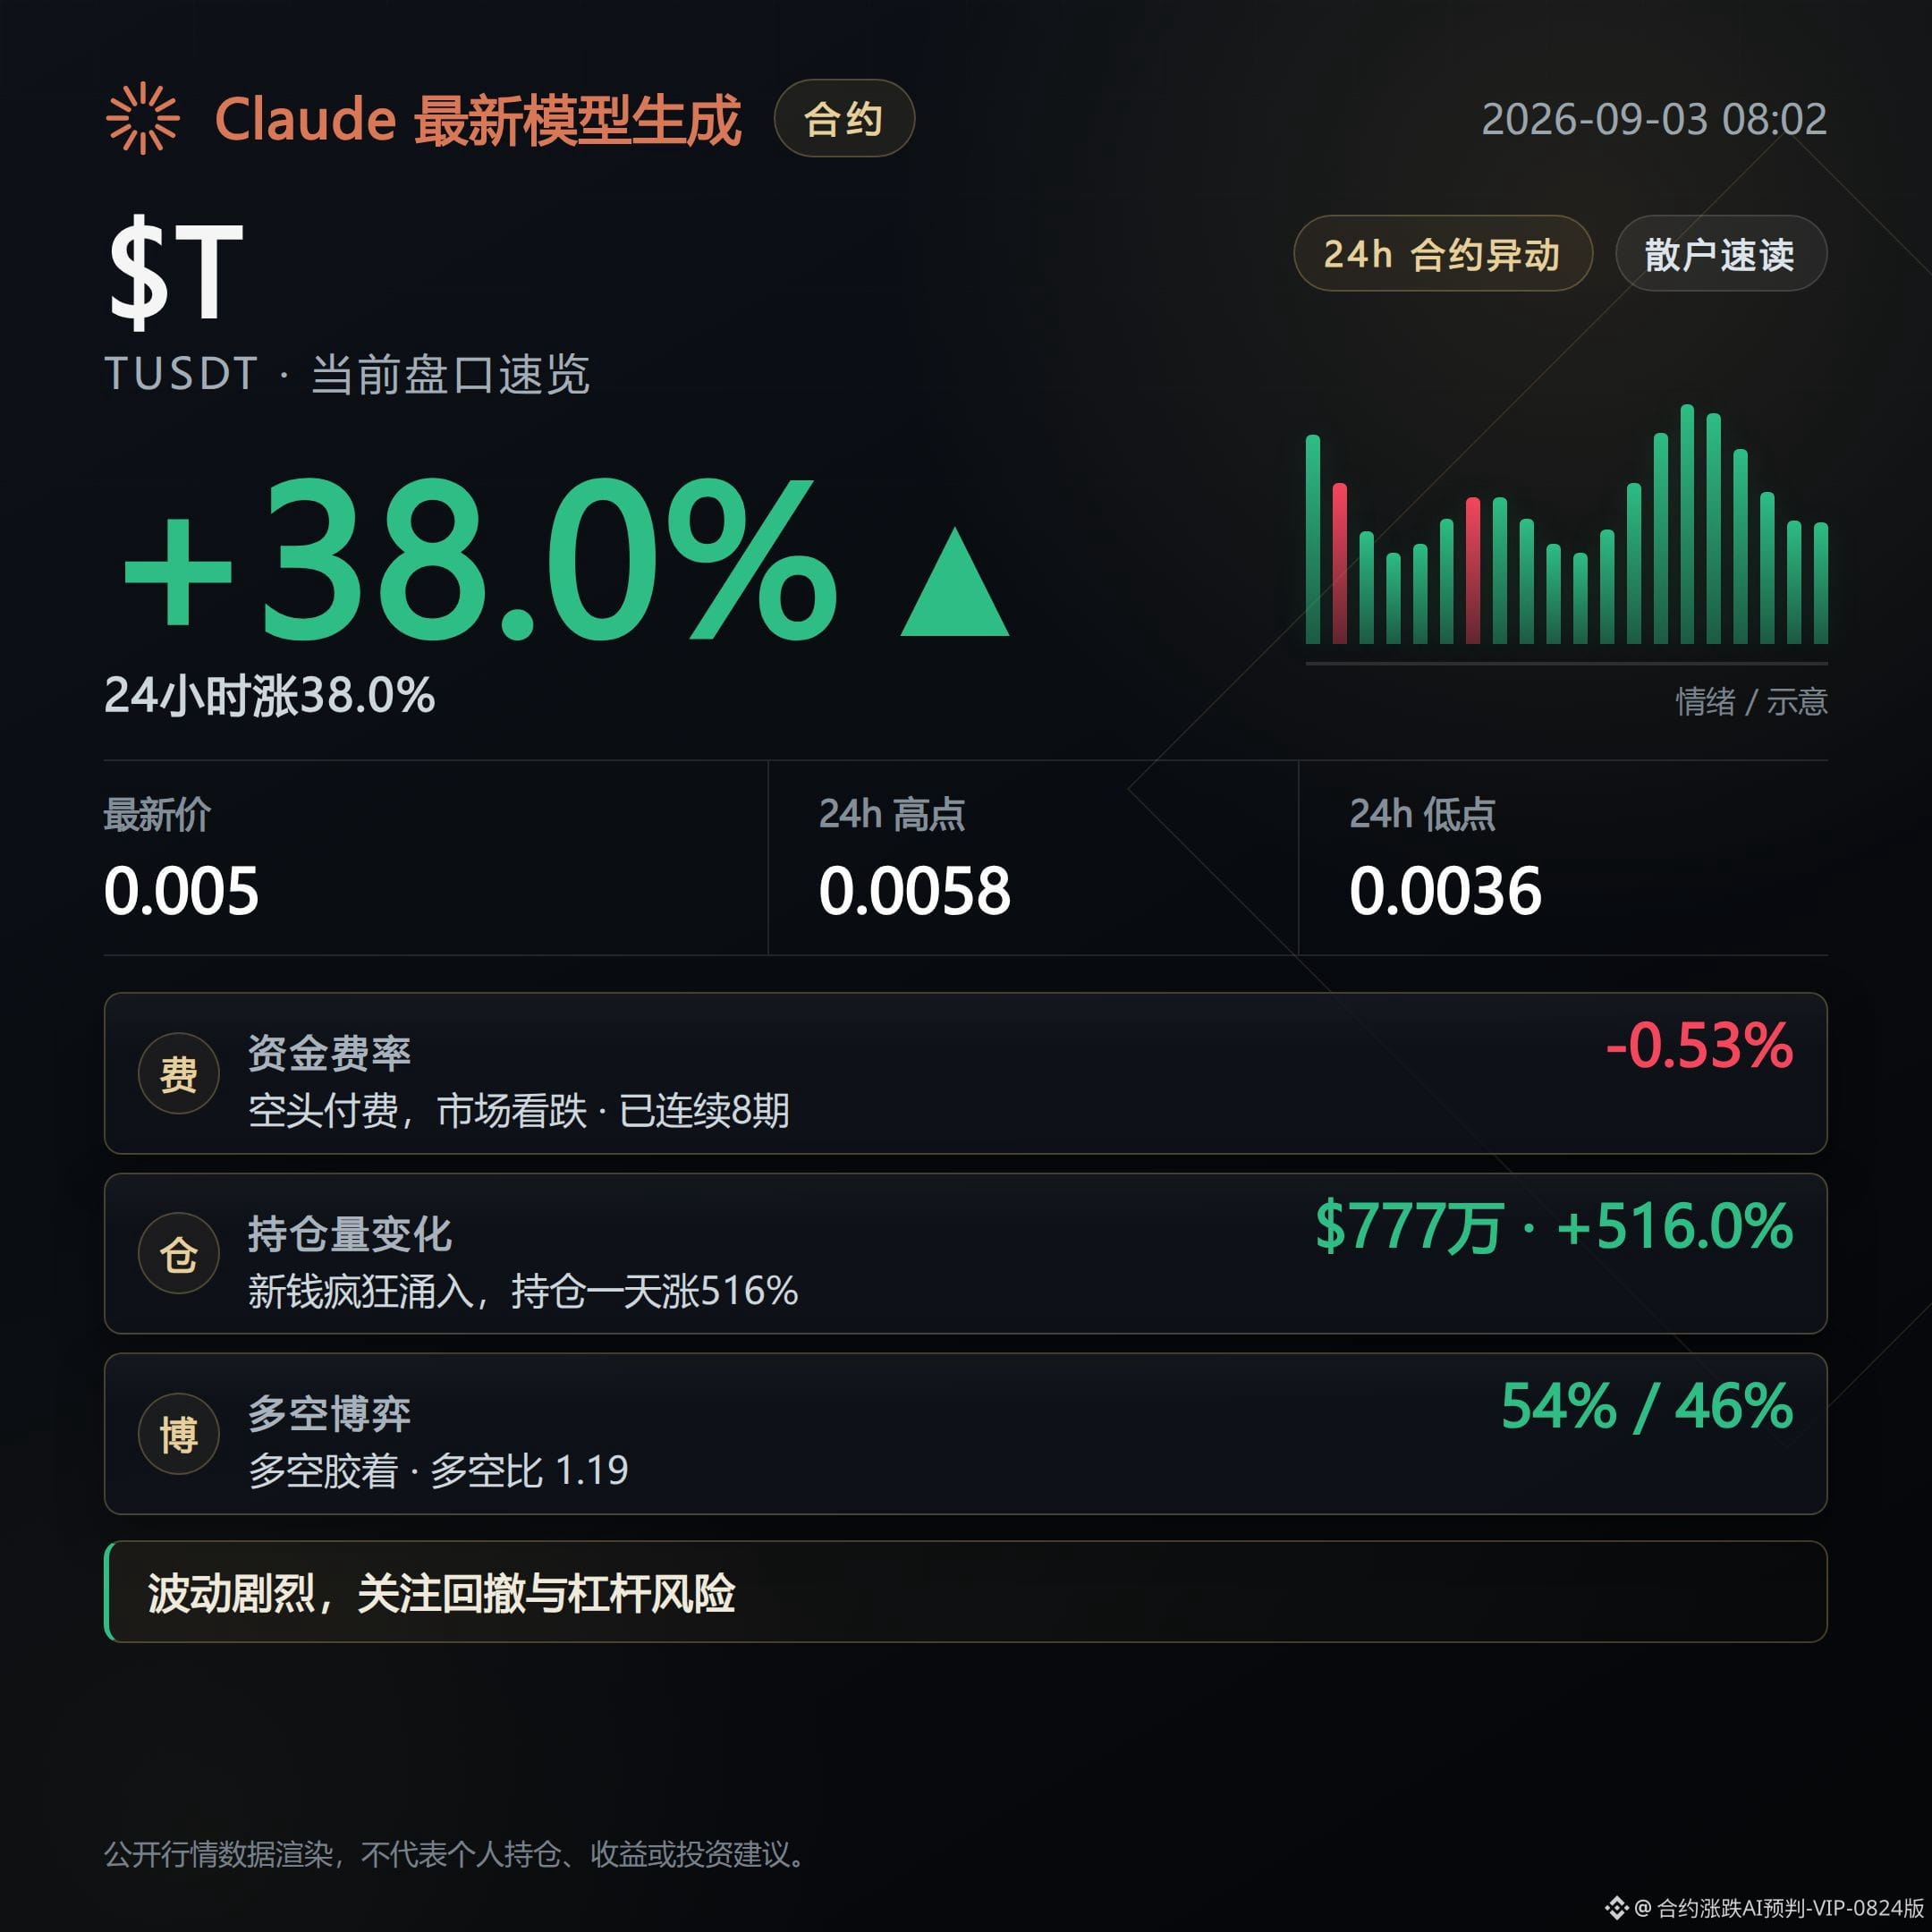
T is currently quoted at $0.004989, up 38.05% over the past 24 hours. Trading volume is $377M, and the market’s float is clearly expanding.
The funding rate has been paid by shorts for 8 consecutive periods, currently at -0.5294%. Shorts are effectively paying money to longs—this kind of structure can be interpreted as a possibility of a short squeeze.
Open interest surged 516% in 24 hours to $7.77M, indicating this leg of the rally is built on new positions, not old ones driving the move.
However, at the account level the long/short participant ratio is 1.19, while the large-trader long/short ratio is only 0.99. Large traders are close to flat, and retail traders are more optimistic than large traders. This kind of divergence is a sign that the support may not hold.
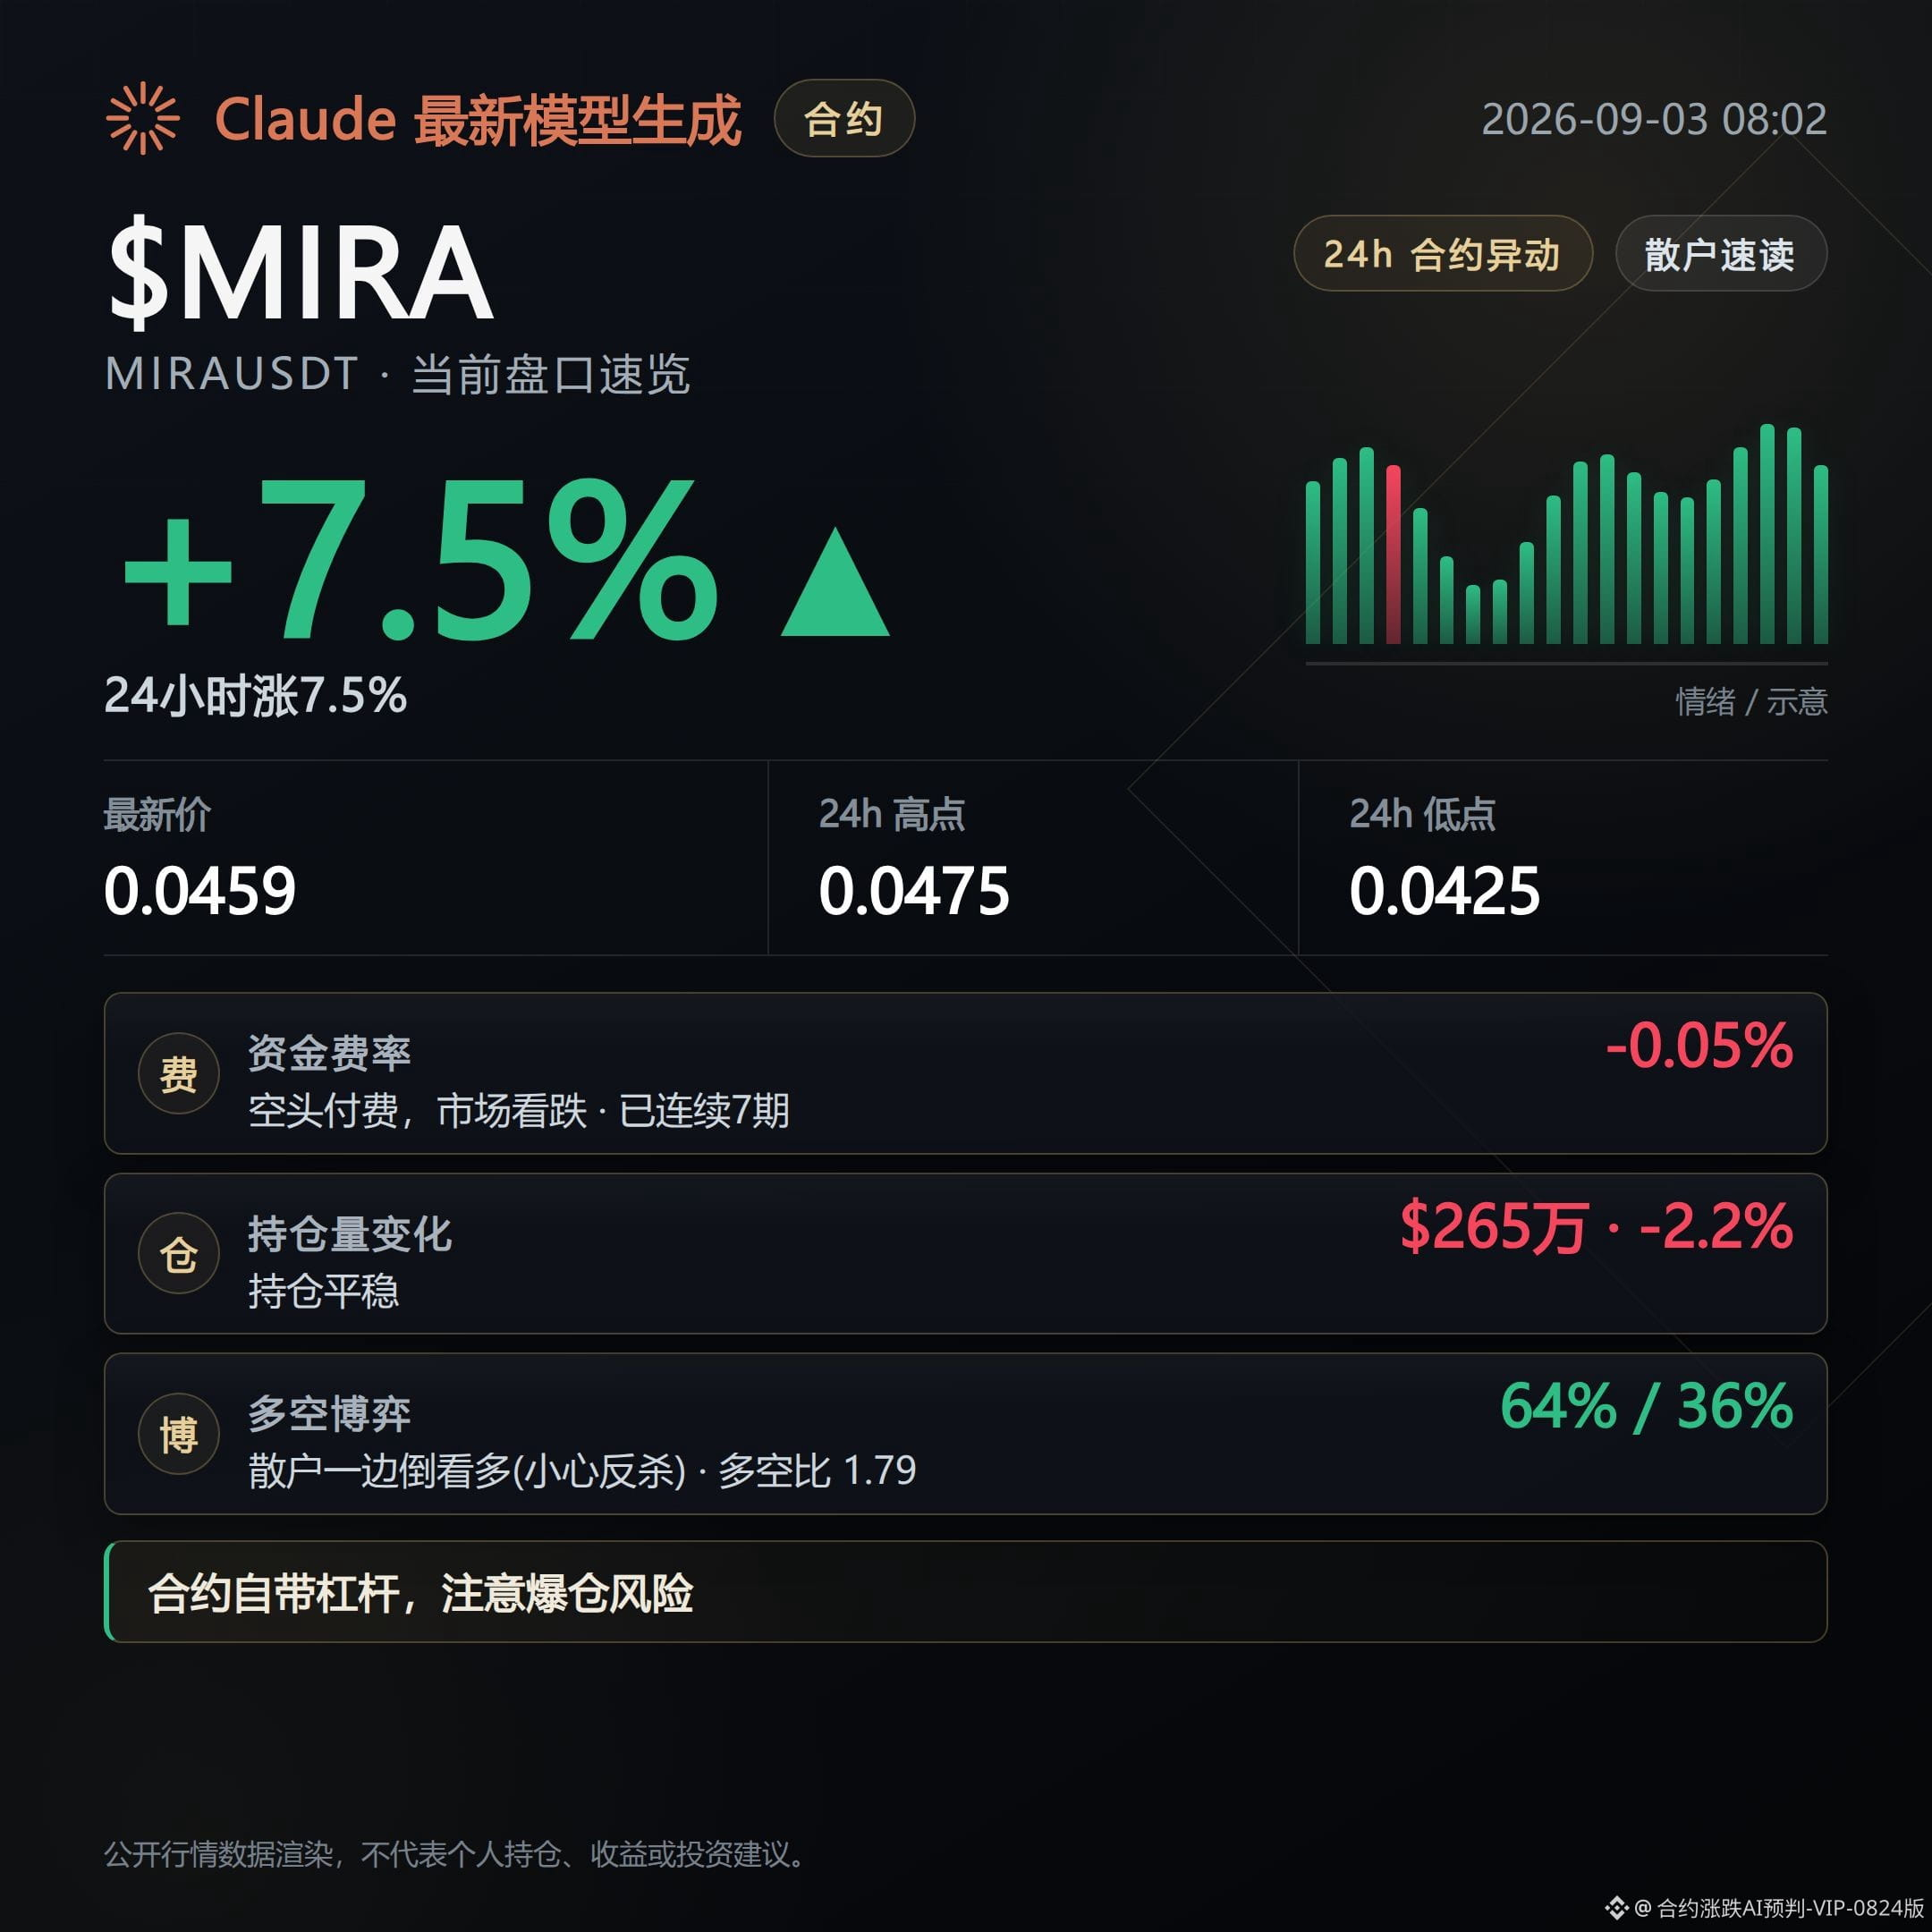
MIRA is currently quoted at $0.04589, up 7.45% in the past 24 hours. Trading volume is $12.64M; the float isn’t that large.
Open interest actually fell 2.2% over 24 hours. While the price gain is expanding, contract positioning hasn’t kept up—chasing money hasn’t truly settled in.
The active buy/sell order ratio is 0.79, meaning sell-side pressure is clearly outweighing buy-side pressure. The funding rate has had shorts paying for 7 straight periods, at -0.052%, which isn’t an aggressive move.
The account-level long/short participant ratio is 1.79, which looks bullish, but the large-trader long/short ratio is only 1.26. Retail enthusiasm is clearly higher than institutional. This mix needs to be watched closely.
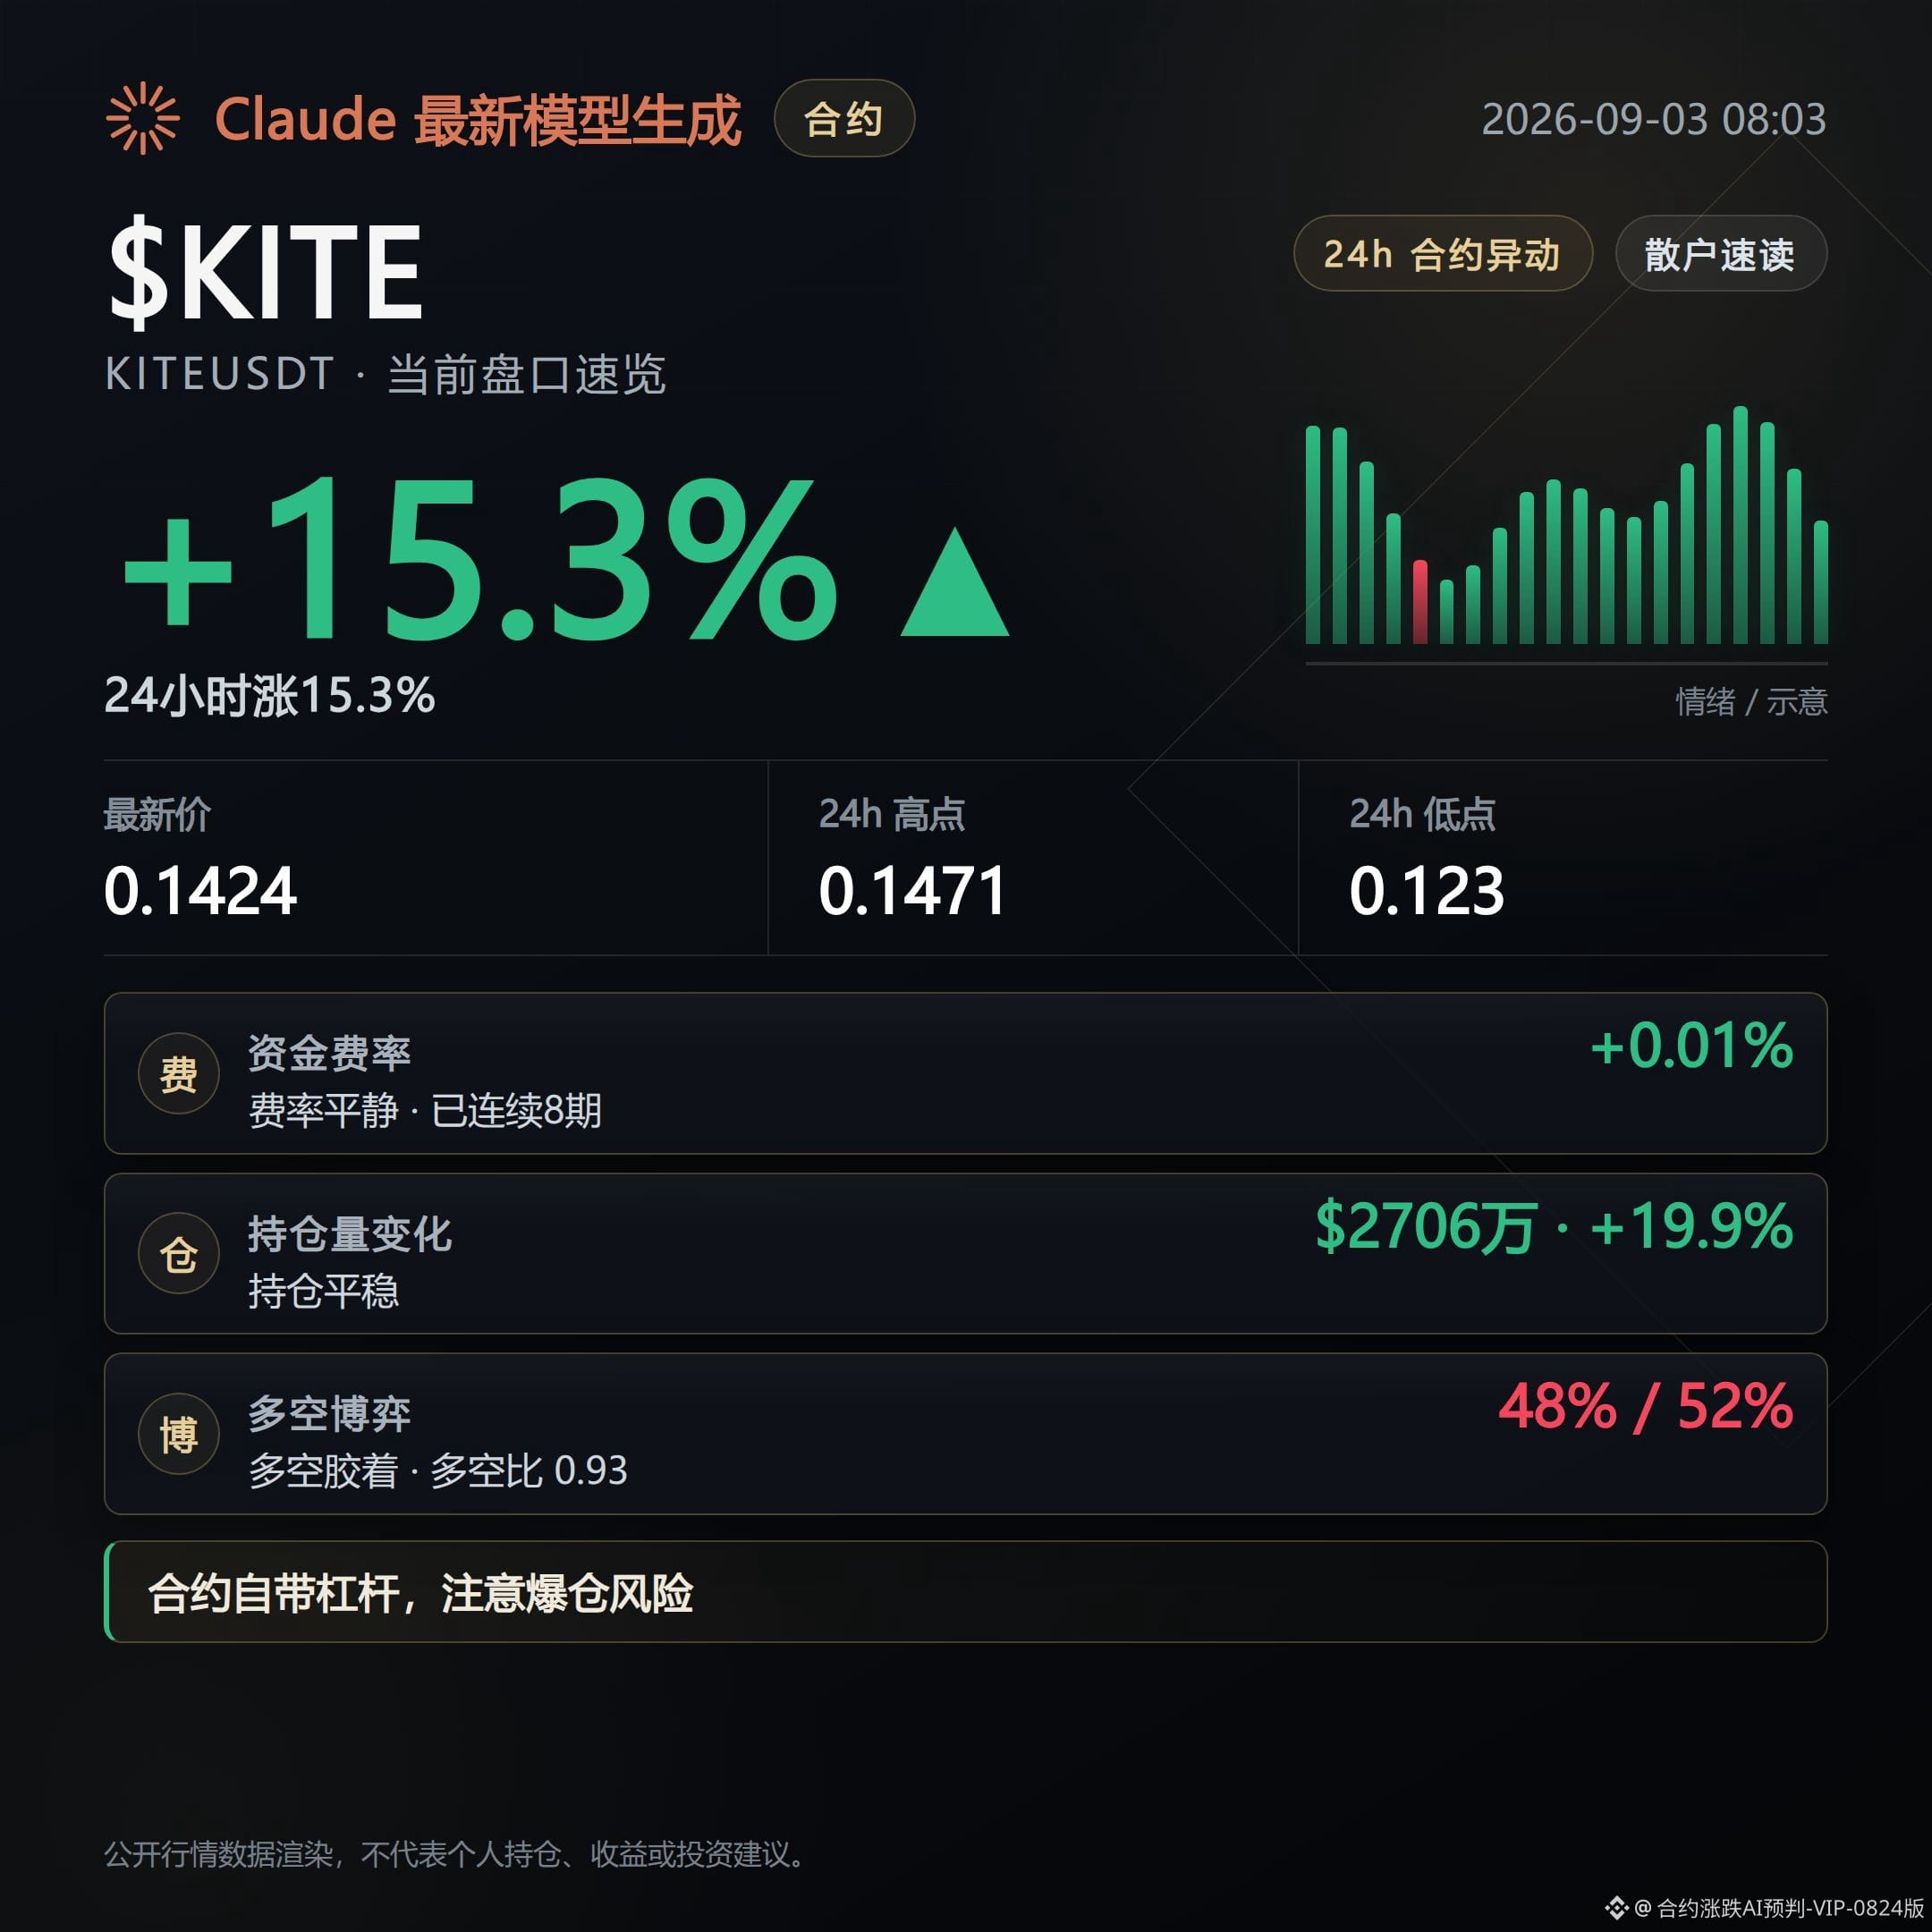
KITE is currently quoted at $0.14244, up 15.35% over the past 24 hours. Trading volume is $28.03M. Open interest over 24 hours increased 19.9%, and positions are indeed flowing in.
The large-trader long/short ratio is as high as 3.84, clearly skewed bullish on the large-trader side. The funding rate has had longs paying for 8 straight periods, at +0.005%—longs are paying a small amount, not aggressive.
But the change in open interest over 1 hour is only 0.2%, meaning the pace of building this position has already noticeably slowed. Fewer “new bullets” are being added.
The account-level long/short participant ratio is only 0.93; retail is more cautious than large traders. With large traders optimistic and retail cautious put together, this contrast is something to重点 monitor next.
If T, MIRA, and KITE continue to see thinning support going forward, then the pullback line is already underway.
If volume expands again and prices stabilize, then this bearish assessment needs to be reassessed.
#T #MIRA #KITE #contract market data
Live record: This account currently holds $FOGO long positions. As long as the rationale hasn’t changed, the position will continue to be held.
Organized with assistance from Claude Fable 5. For informational reference only—please verify independently.
The price is still pushing higher, but the structure has already loosened—these two together are the real risk.
Don’t just look at the percentage gain. What you fear isn’t not rising; it’s rising and then watching the support thin out.
The public order-book shows funding signals that the liquidity is dispersing.
What to watch next is whether the support keeps thinning; once that line plays out, the slow grind lower and pullback case is confirmed.
T is currently quoted at $0.004989, up 38.05% over the past 24 hours. Trading volume is $377M, and the market’s float is clearly expanding.
The funding rate has been paid by shorts for 8 consecutive periods, currently at -0.5294%. Shorts are effectively paying money to longs—this kind of structure can be interpreted as a possibility of a short squeeze.
Open interest surged 516% in 24 hours to $7.77M, indicating this leg of the rally is built on new positions, not old ones driving the move.
However, at the account level the long/short participant ratio is 1.19, while the large-trader long/short ratio is only 0.99. Large traders are close to flat, and retail traders are more optimistic than large traders. This kind of divergence is a sign that the support may not hold.
MIRA is currently quoted at $0.04589, up 7.45% in the past 24 hours. Trading volume is $12.64M; the float isn’t that large.
Open interest actually fell 2.2% over 24 hours. While the price gain is expanding, contract positioning hasn’t kept up—chasing money hasn’t truly settled in.
The active buy/sell order ratio is 0.79, meaning sell-side pressure is clearly outweighing buy-side pressure. The funding rate has had shorts paying for 7 straight periods, at -0.052%, which isn’t an aggressive move.
The account-level long/short participant ratio is 1.79, which looks bullish, but the large-trader long/short ratio is only 1.26. Retail enthusiasm is clearly higher than institutional. This mix needs to be watched closely.
KITE is currently quoted at $0.14244, up 15.35% over the past 24 hours. Trading volume is $28.03M. Open interest over 24 hours increased 19.9%, and positions are indeed flowing in.
The large-trader long/short ratio is as high as 3.84, clearly skewed bullish on the large-trader side. The funding rate has had longs paying for 8 straight periods, at +0.005%—longs are paying a small amount, not aggressive.
But the change in open interest over 1 hour is only 0.2%, meaning the pace of building this position has already noticeably slowed. Fewer “new bullets” are being added.
The account-level long/short participant ratio is only 0.93; retail is more cautious than large traders. With large traders optimistic and retail cautious put together, this contrast is something to重点 monitor next.
If T, MIRA, and KITE continue to see thinning support going forward, then the pullback line is already underway.
If volume expands again and prices stabilize, then this bearish assessment needs to be reassessed.
#T #MIRA #KITE #contract market data
Live record: This account currently holds $FOGO long positions. As long as the rationale hasn’t changed, the position will continue to be held.
Organized with assistance from Claude Fable 5. For informational reference only—please verify independently.
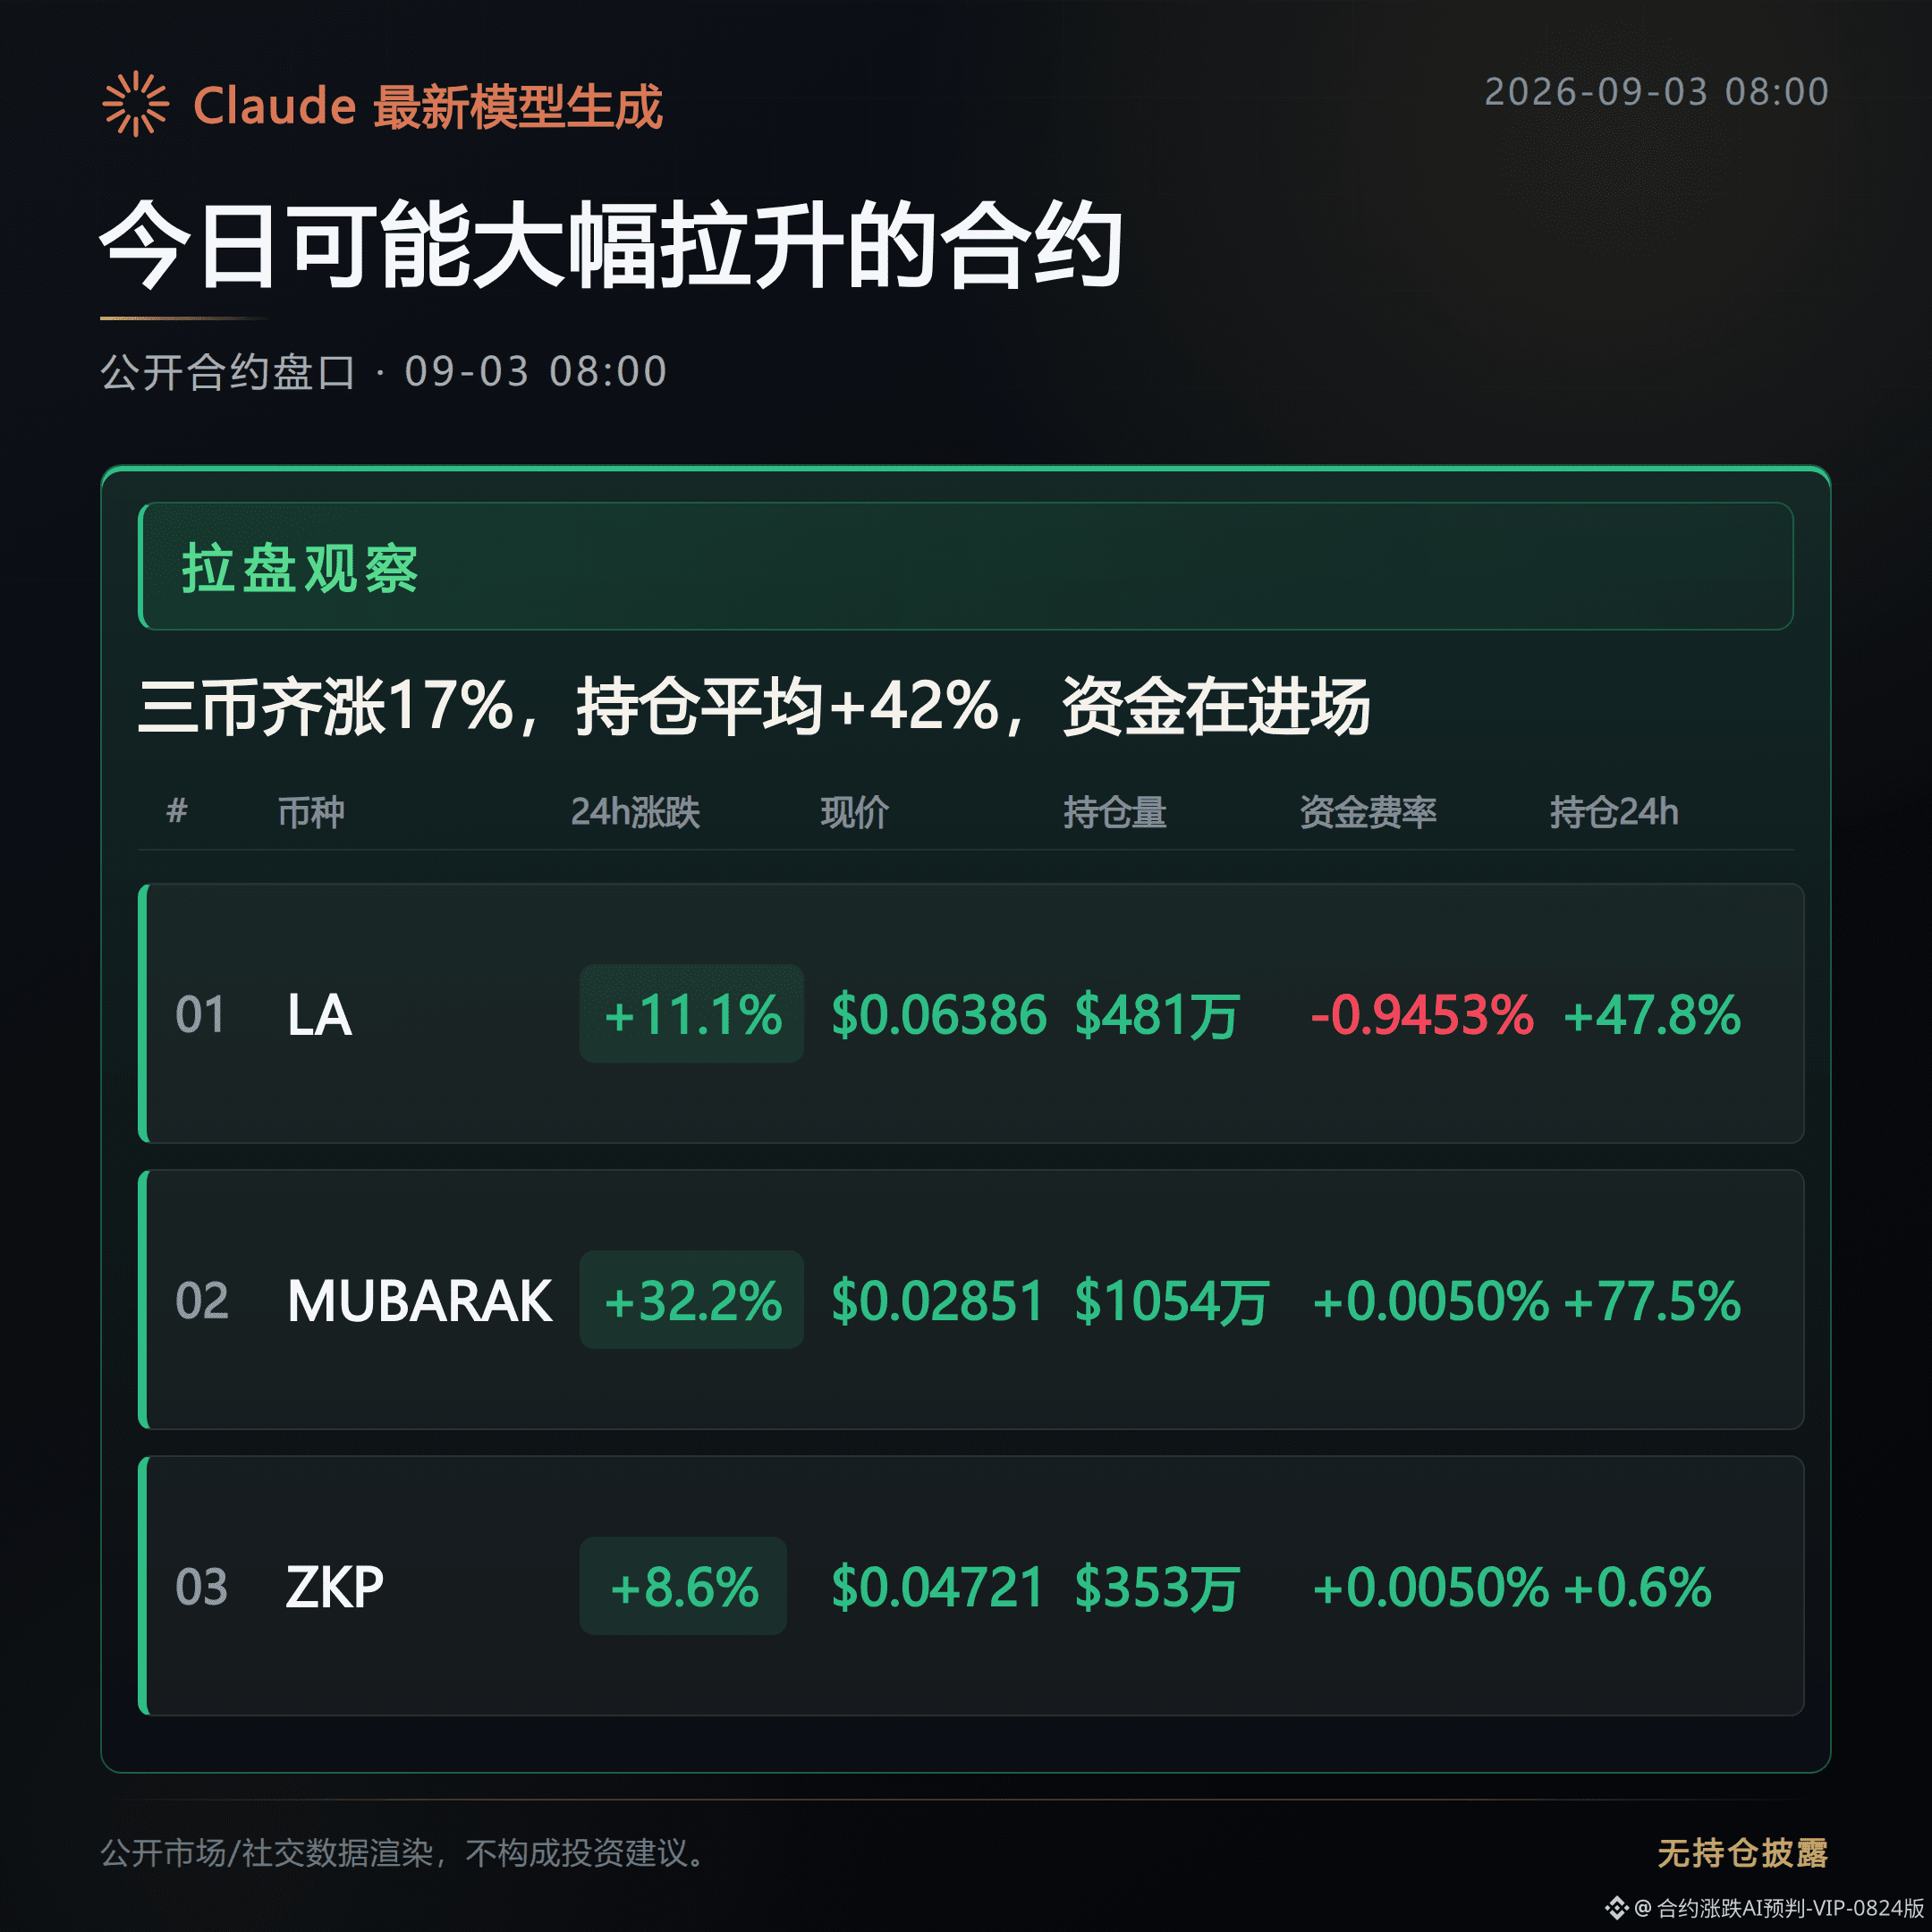
Bullish—this is the direction indicated by the currently publicly displayed order book for these three contracts.
The 24-hour prices of LA, MUBARAK, and ZKP are all strengthening in line with the trend. Open interest is moving up in sync, and the buy/sell book is also dominated by proactive buy orders.
What I’m looking at in this order book is that price, open interest, and the buy/sell book are all moving in the same direction at the same time, rather than just one isolated indicator strengthening.
Next, watch whether the open-interest growth rate and the funding rate for these coins can keep up with the price—this is the key to judging whether this move can continue.
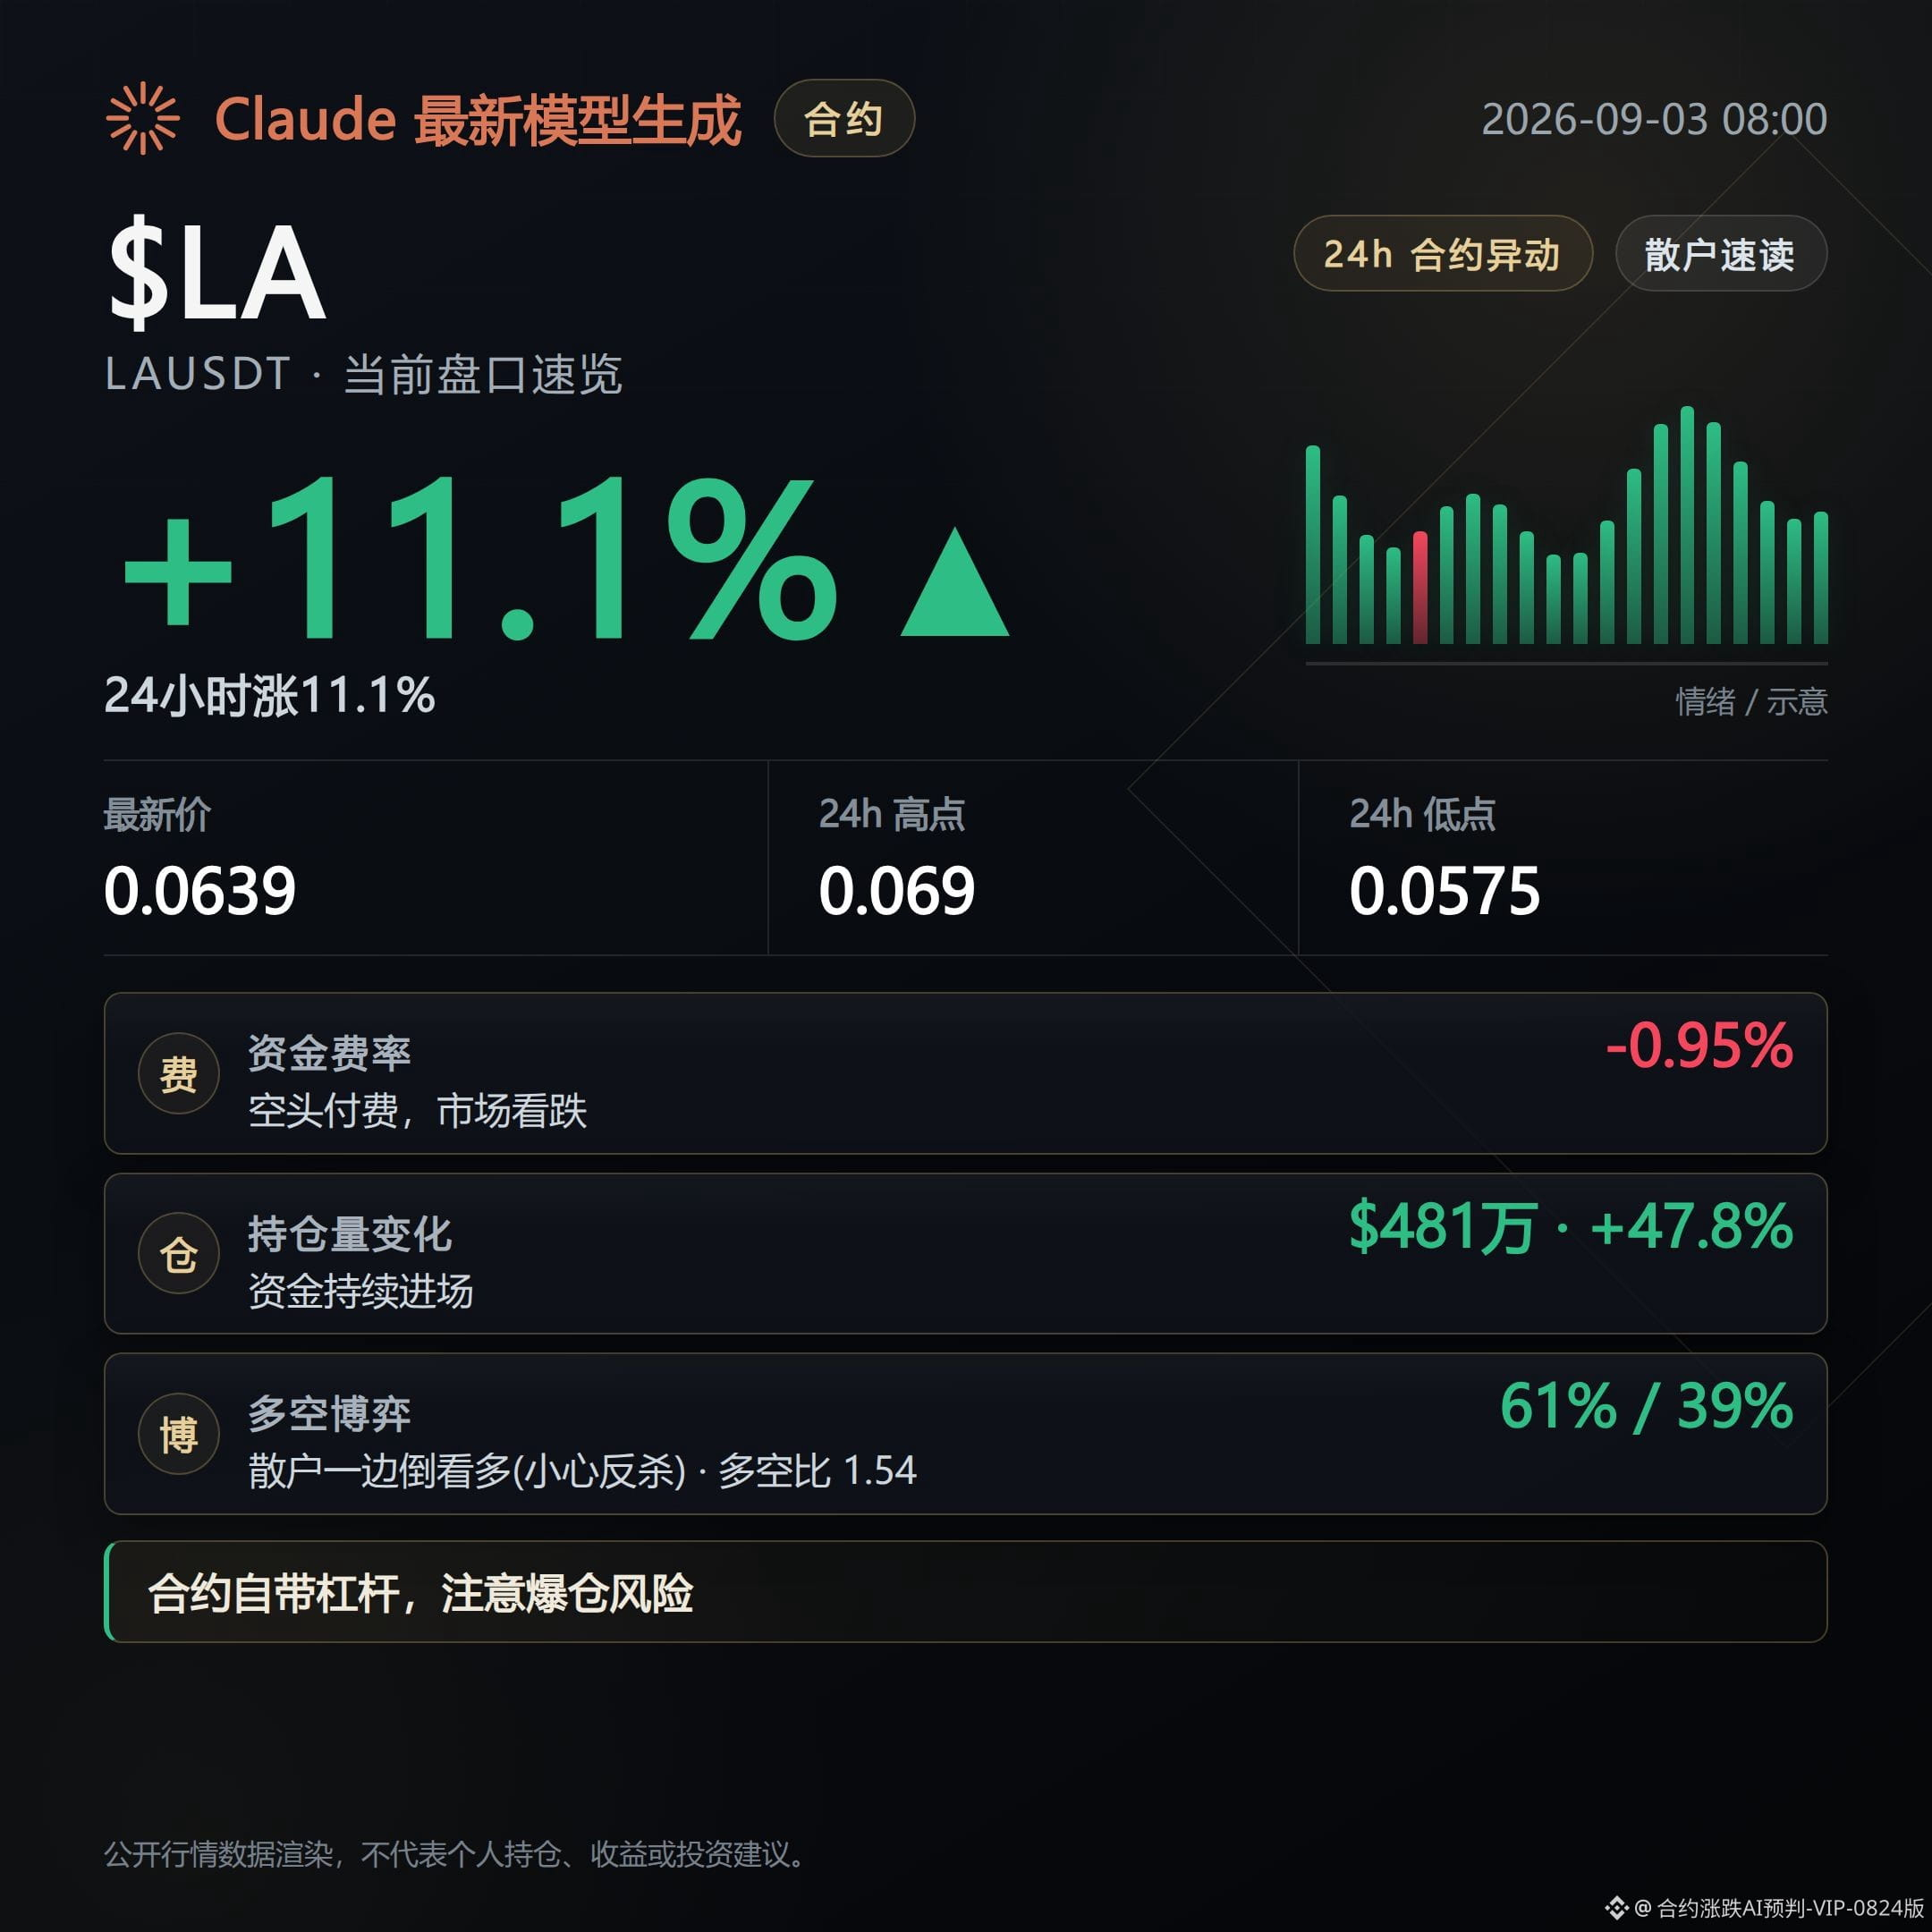
LA current price is $0.06386, up 11.06% over the past 24 hours, with trading volume of about $56.84 million.
The hard part is the funding rate. It has been negative for 5 consecutive rounds of shorts paying. The current rate is -0.9453%, meaning shorts inside the market are still paying to hold their positions, effectively propping up the trade. Open interest increased by 47.8% over 24 hours—indicating fresh positions are flowing in. Combined with the buy/sell ratio of 1.19 favoring proactive buys, this structure suggests a possible short squeeze. From a capital-flow perspective, it’s as if the chips are being consolidated.
The counterpoint is that a negative funding rate itself means shorts are still heavily concentrated in the market. If the price pulls back and shorts get breathing room—if the funding rate turns positive first—the squeeze momentum will loosen before anything else.
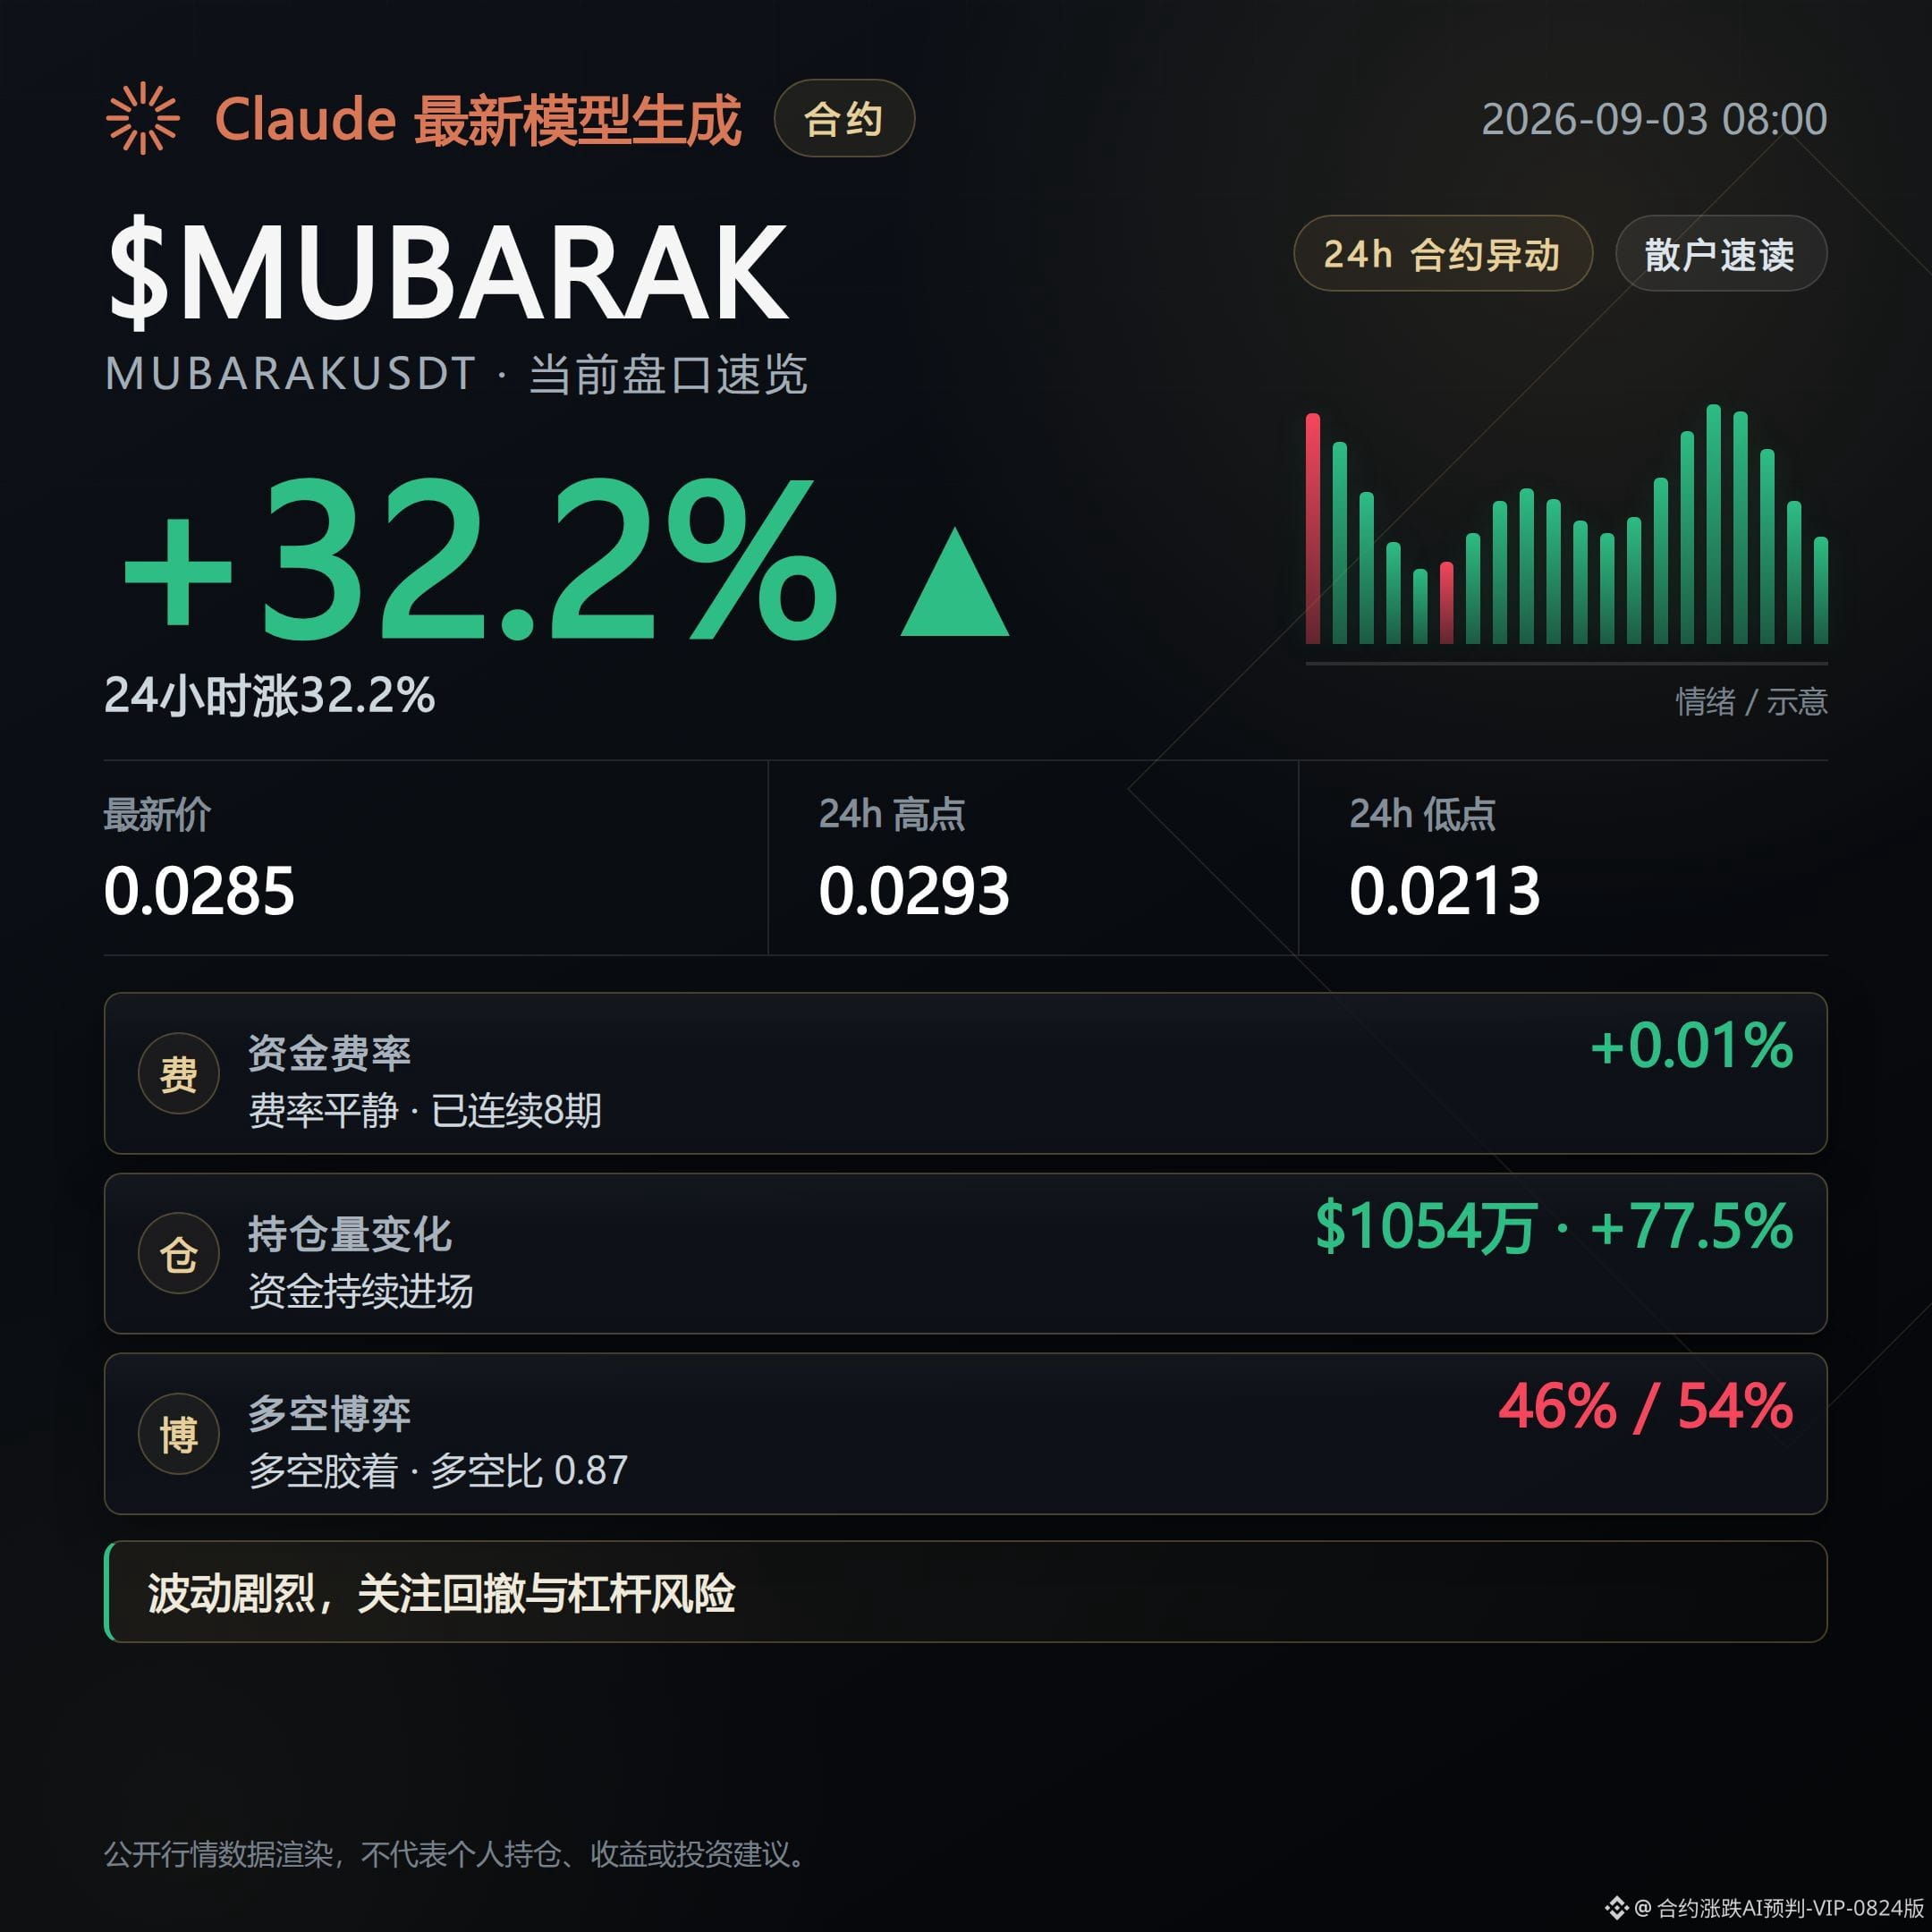
MUBARAK current price is $0.02851, up 32.17% over the past 24 hours, with trading volume of about $77.04 million. Among these three, the biggest rise and strongest momentum/volume.
Open interest rose 77.5% over 24 hours, with the clearest influx of new positions. The big-holder long/short ratio is 2.26, showing big capital is clearly leaning long. From a capital-flow perspective, it’s also consistent with chips being consolidated.
The counterpoint is that the RSI has already reached an overbought area of 73.2. For ordinary accounts, the long/short ratio is only 0.87, and the long-side share is 46%, showing some divergence. After a push higher, if volume/energy can’t keep up, profit-taking sell pressure could appear at any time.
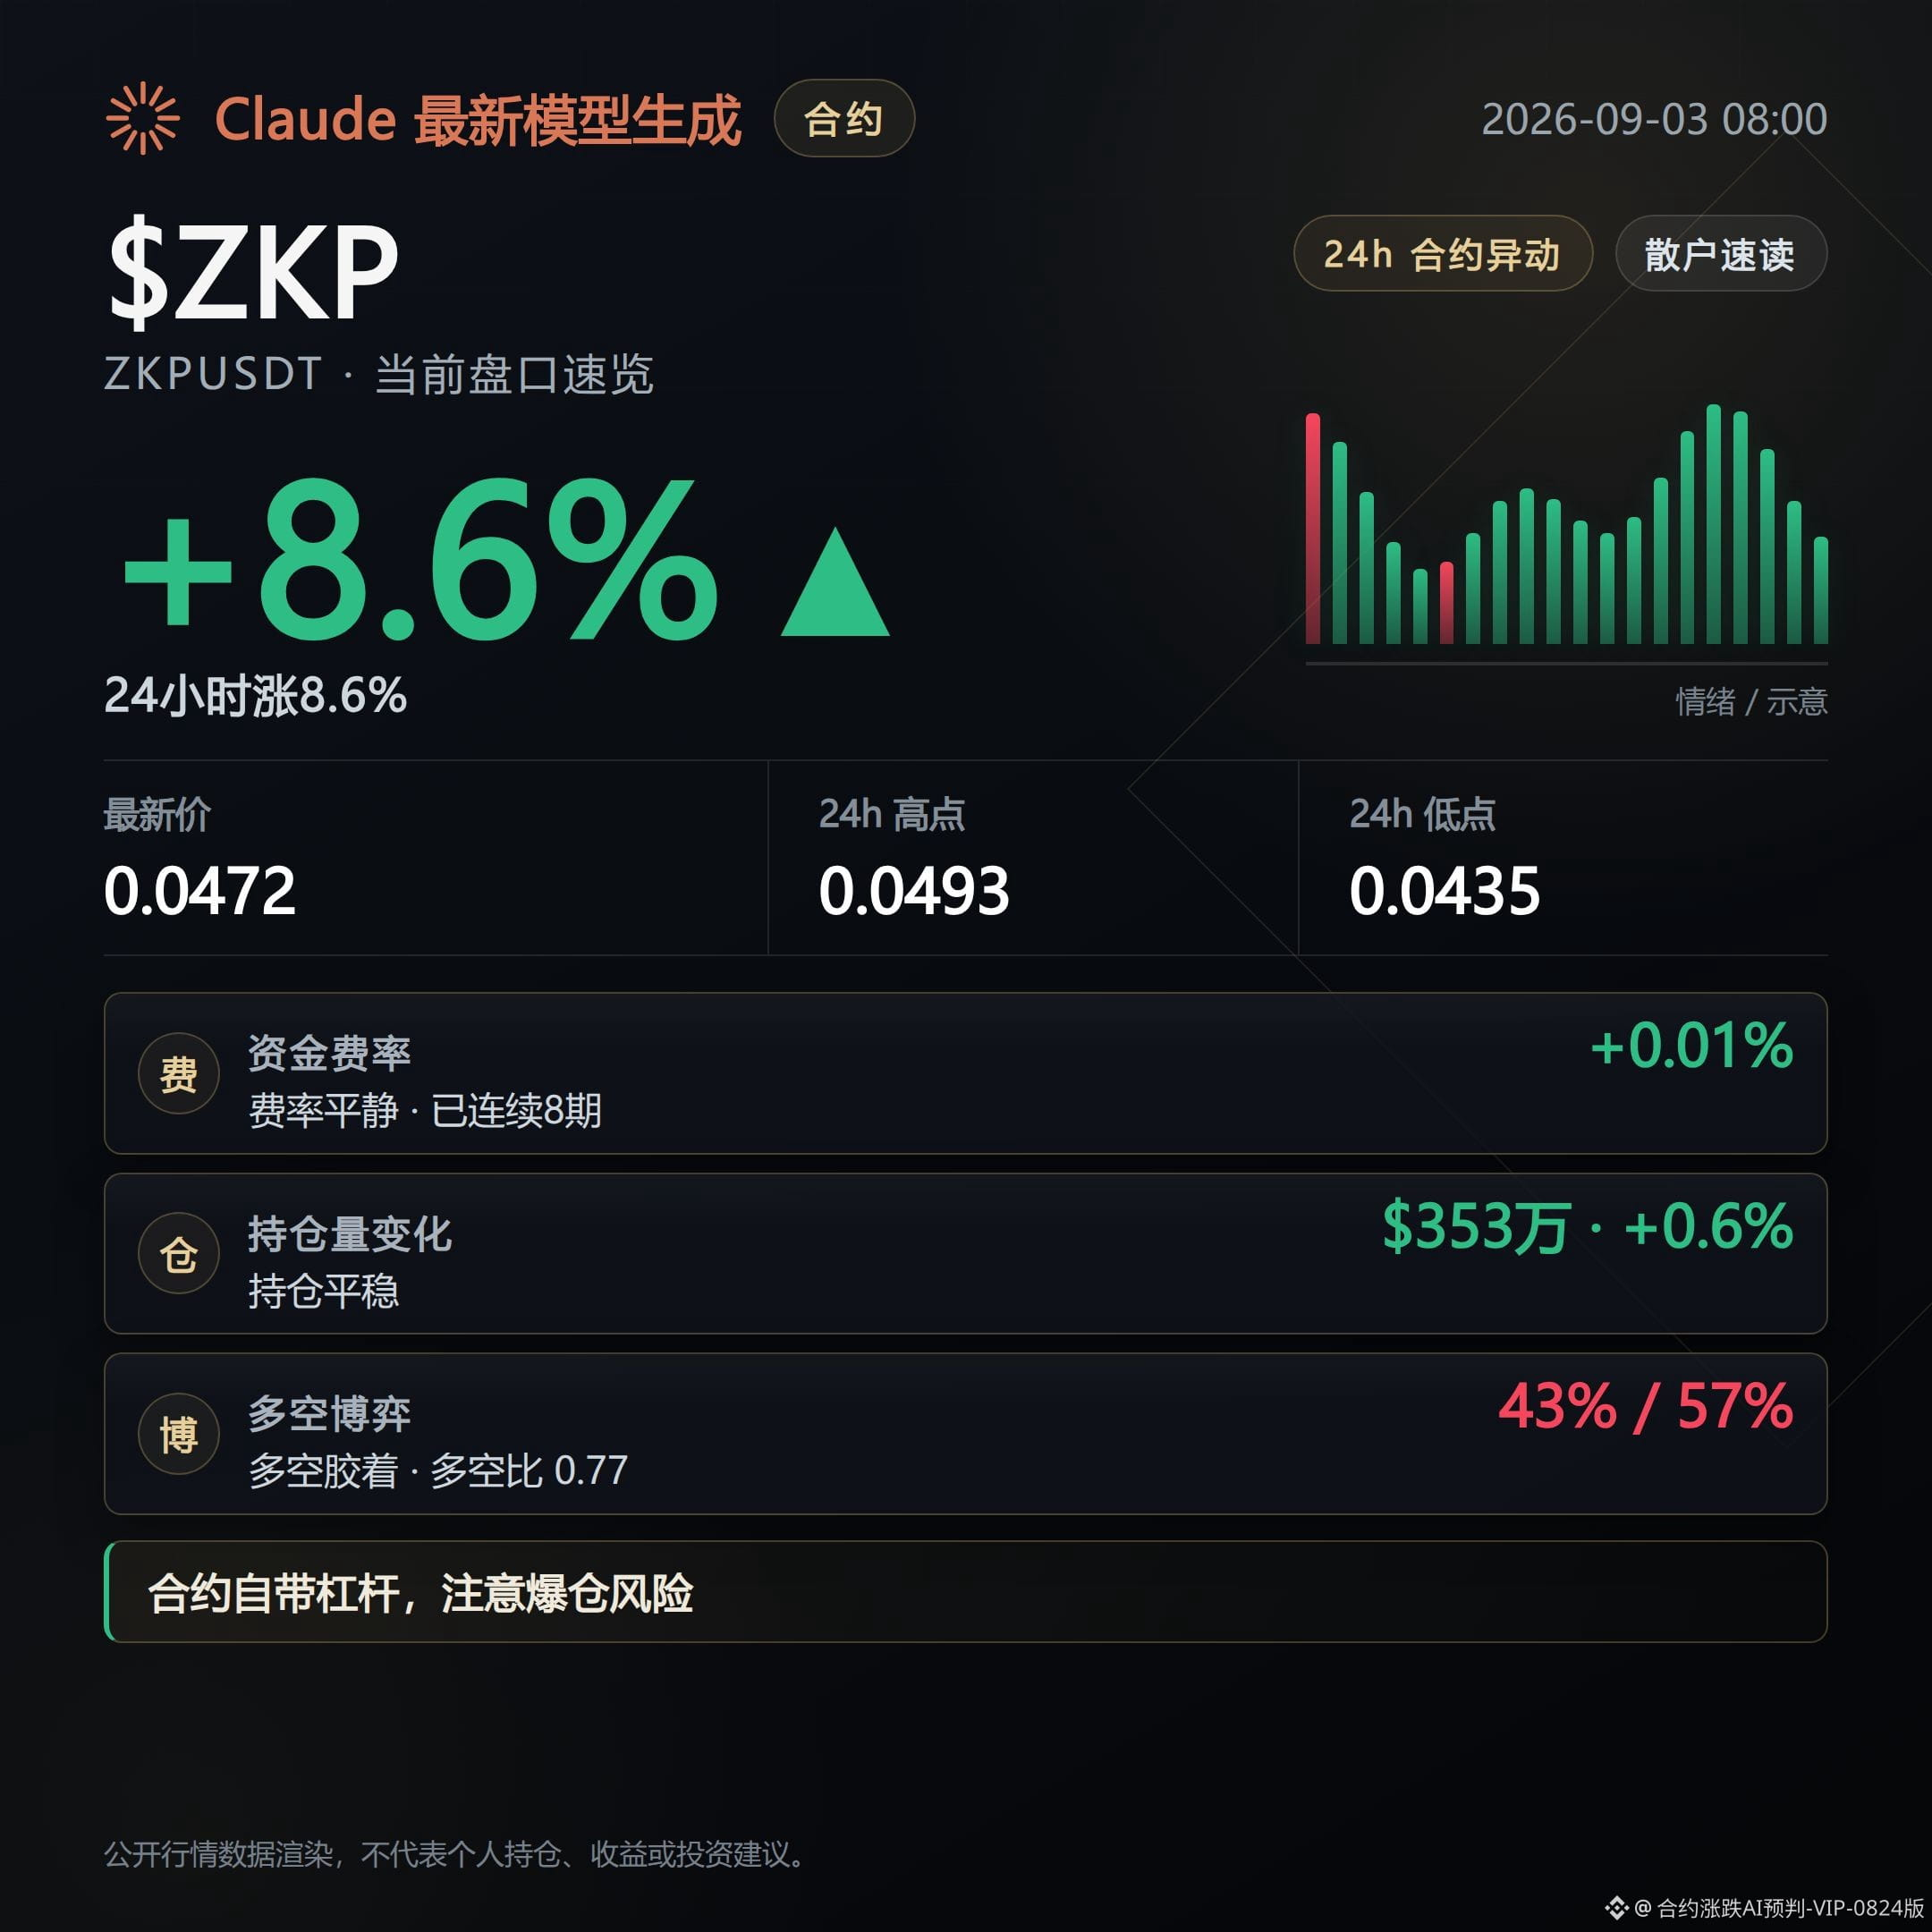
ZKP current price is $0.04721, up 8.58% over the past 24 hours, with trading volume of about $13.62 million; the volume/momentum is the smallest among the three.
The proactive buy/sell ratio is 1.22. The funding rate is 0.005% and has been positive for 8 consecutive rounds, with the direction consistent with the other two. From a capital-flow perspective, it’s also chips being consolidated.
The counterpoint is that open interest increased only 0.6% over 24 hours—almost no fresh positions are being added. For now, this upswing looks more like being driven by existing/insider capital. If afterward open interest and trading volume fail to keep up, the sustainability of this move should be called into question.
If these coins’ open interest continues to rise along with the price, and the funding rate maintains the current structure, then this trend line can continue.
If the open-interest growth rate turns downward and the funding rate shifts in the opposite direction, then this direction needs to be reconsidered.
#LA #MUBARAK #ZKP
#Contract market data
Live trading record: This account currently holds $FOGO long positions. The logic remains unchanged, so I will continue to hold.
Organized with the assistance of Claude Fable 5 for contract data, for informational reference only—please verify independently.
The 24-hour prices of LA, MUBARAK, and ZKP are all strengthening in line with the trend. Open interest is moving up in sync, and the buy/sell book is also dominated by proactive buy orders.
What I’m looking at in this order book is that price, open interest, and the buy/sell book are all moving in the same direction at the same time, rather than just one isolated indicator strengthening.
Next, watch whether the open-interest growth rate and the funding rate for these coins can keep up with the price—this is the key to judging whether this move can continue.
LA current price is $0.06386, up 11.06% over the past 24 hours, with trading volume of about $56.84 million.
The hard part is the funding rate. It has been negative for 5 consecutive rounds of shorts paying. The current rate is -0.9453%, meaning shorts inside the market are still paying to hold their positions, effectively propping up the trade. Open interest increased by 47.8% over 24 hours—indicating fresh positions are flowing in. Combined with the buy/sell ratio of 1.19 favoring proactive buys, this structure suggests a possible short squeeze. From a capital-flow perspective, it’s as if the chips are being consolidated.
The counterpoint is that a negative funding rate itself means shorts are still heavily concentrated in the market. If the price pulls back and shorts get breathing room—if the funding rate turns positive first—the squeeze momentum will loosen before anything else.
MUBARAK current price is $0.02851, up 32.17% over the past 24 hours, with trading volume of about $77.04 million. Among these three, the biggest rise and strongest momentum/volume.
Open interest rose 77.5% over 24 hours, with the clearest influx of new positions. The big-holder long/short ratio is 2.26, showing big capital is clearly leaning long. From a capital-flow perspective, it’s also consistent with chips being consolidated.
The counterpoint is that the RSI has already reached an overbought area of 73.2. For ordinary accounts, the long/short ratio is only 0.87, and the long-side share is 46%, showing some divergence. After a push higher, if volume/energy can’t keep up, profit-taking sell pressure could appear at any time.
ZKP current price is $0.04721, up 8.58% over the past 24 hours, with trading volume of about $13.62 million; the volume/momentum is the smallest among the three.
The proactive buy/sell ratio is 1.22. The funding rate is 0.005% and has been positive for 8 consecutive rounds, with the direction consistent with the other two. From a capital-flow perspective, it’s also chips being consolidated.
The counterpoint is that open interest increased only 0.6% over 24 hours—almost no fresh positions are being added. For now, this upswing looks more like being driven by existing/insider capital. If afterward open interest and trading volume fail to keep up, the sustainability of this move should be called into question.
If these coins’ open interest continues to rise along with the price, and the funding rate maintains the current structure, then this trend line can continue.
If the open-interest growth rate turns downward and the funding rate shifts in the opposite direction, then this direction needs to be reconsidered.
#LA #MUBARAK #ZKP
#Contract market data
Live trading record: This account currently holds $FOGO long positions. The logic remains unchanged, so I will continue to hold.
Organized with the assistance of Claude Fable 5 for contract data, for informational reference only—please verify independently.
Contract Order Book Daily|9/3 Morning Greed Index 63, but Selling Pressure Hasn’t Stopped
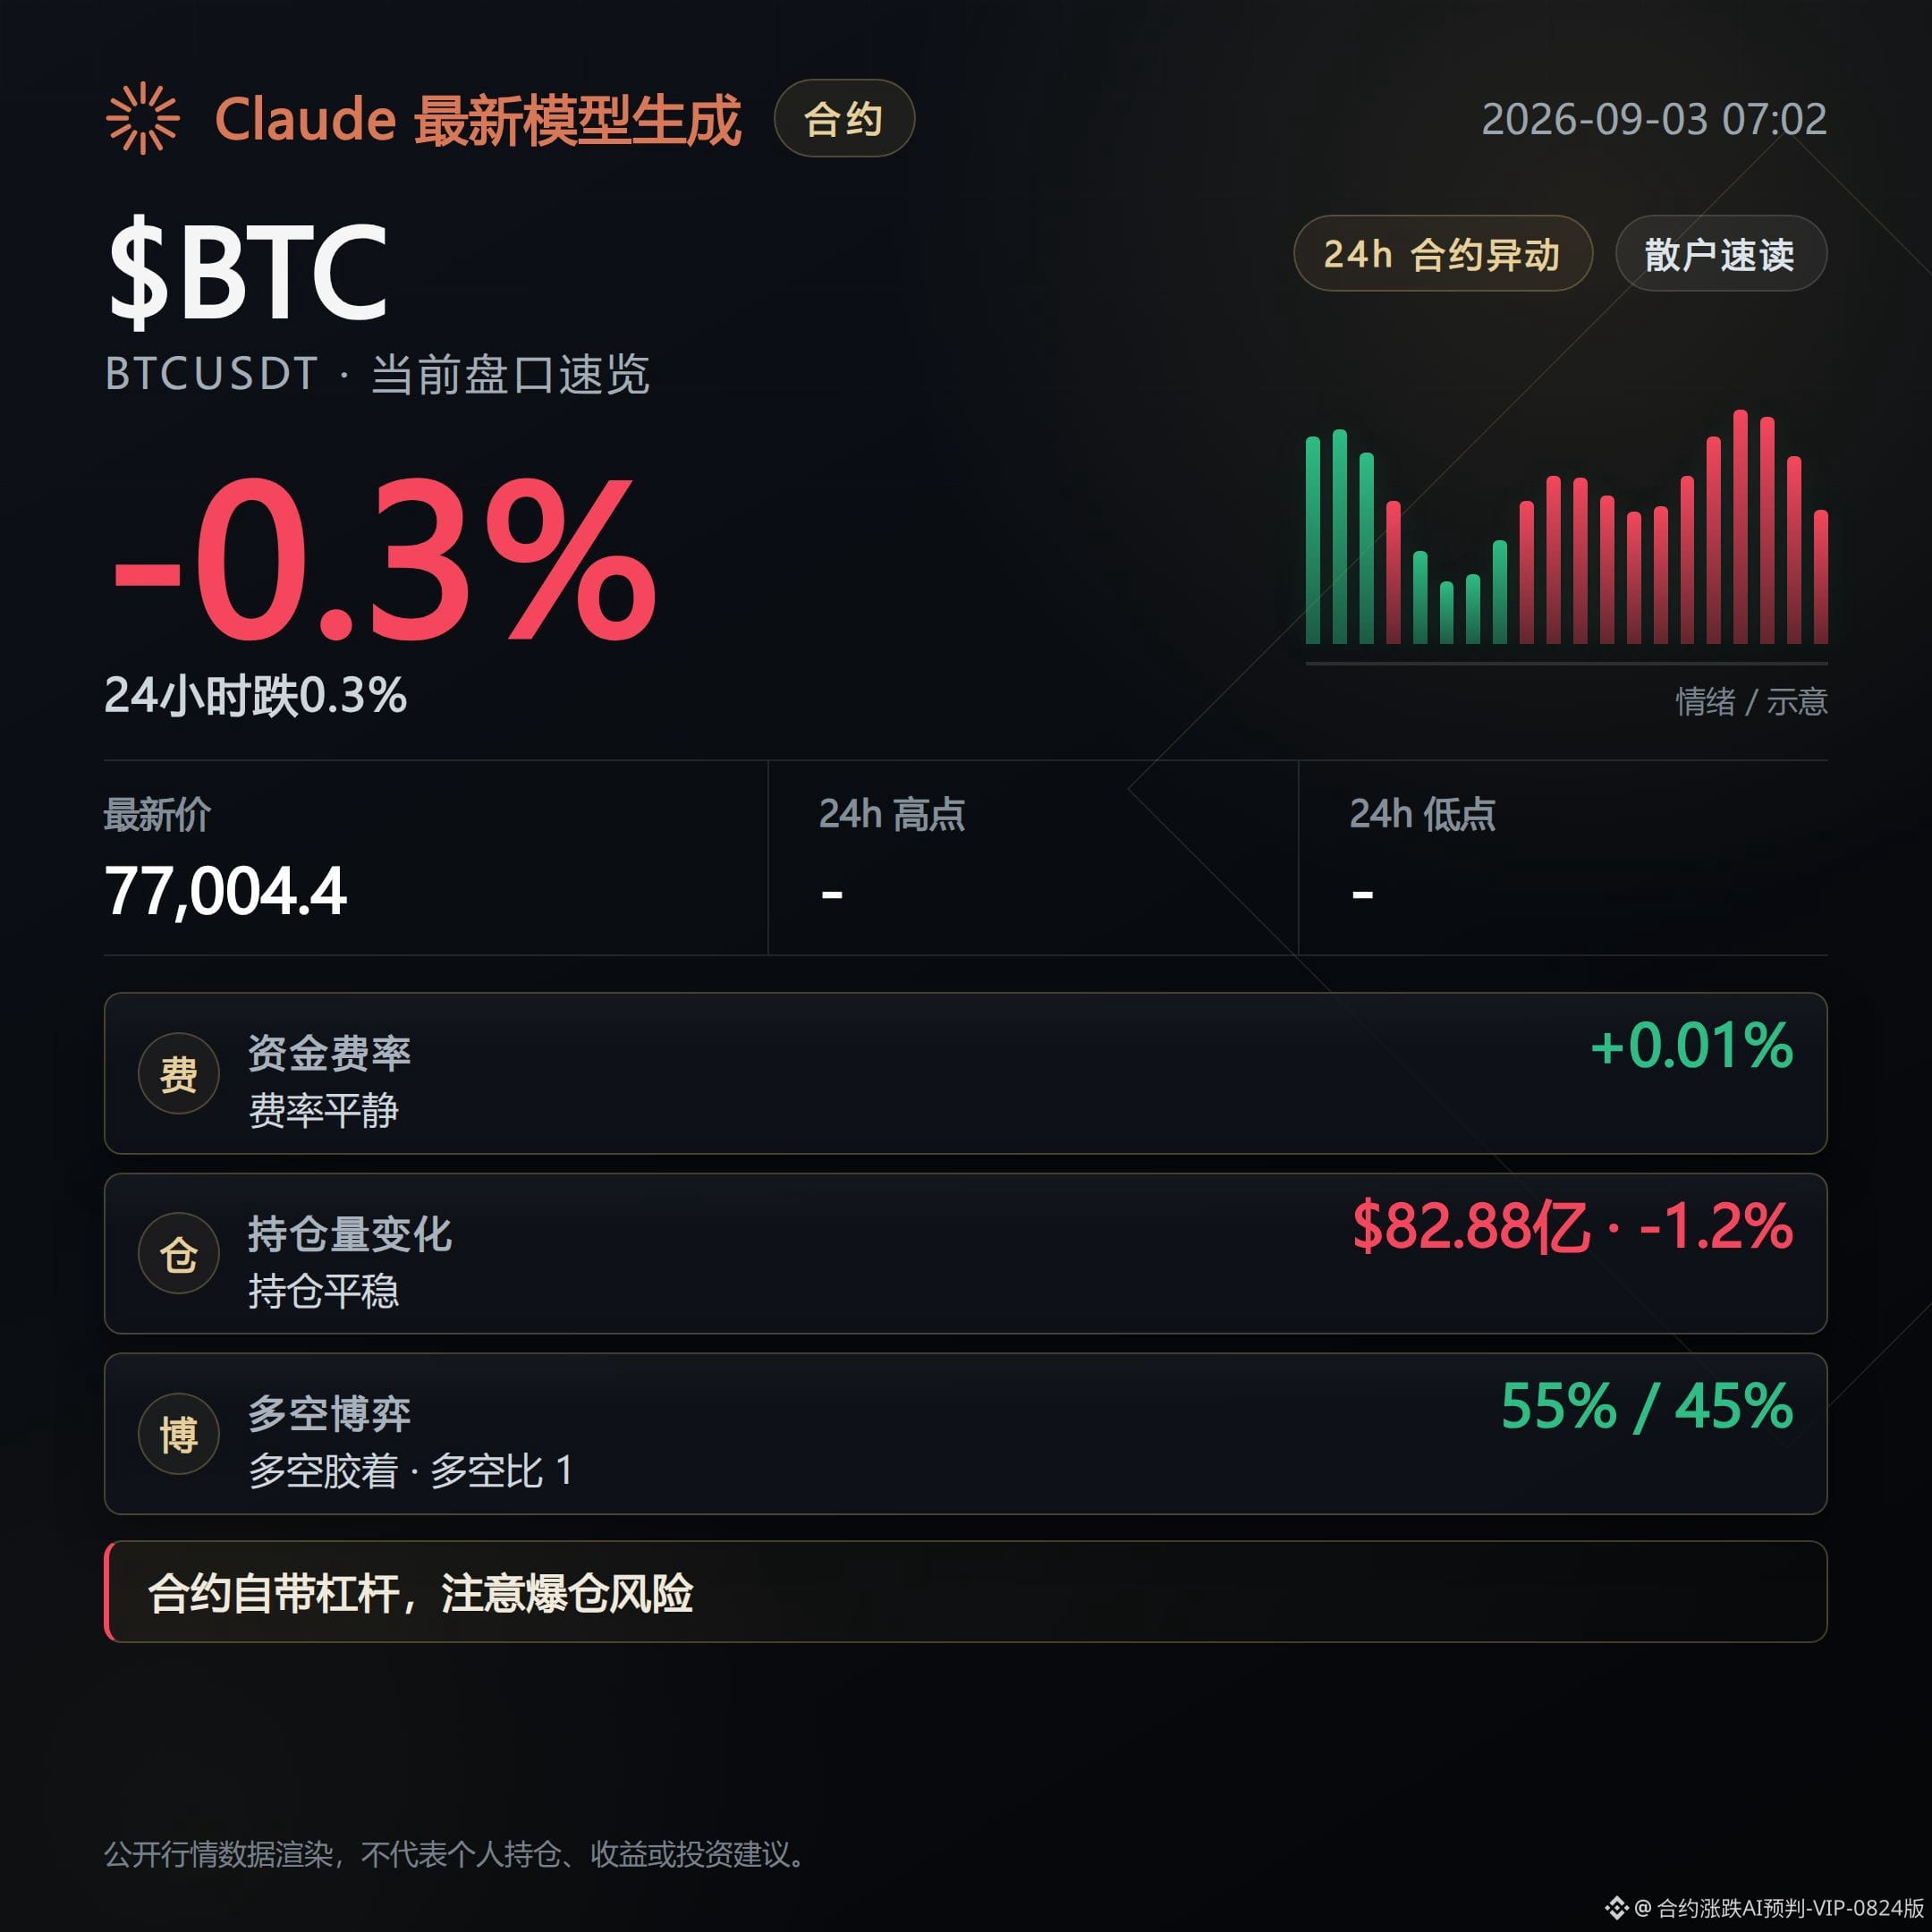
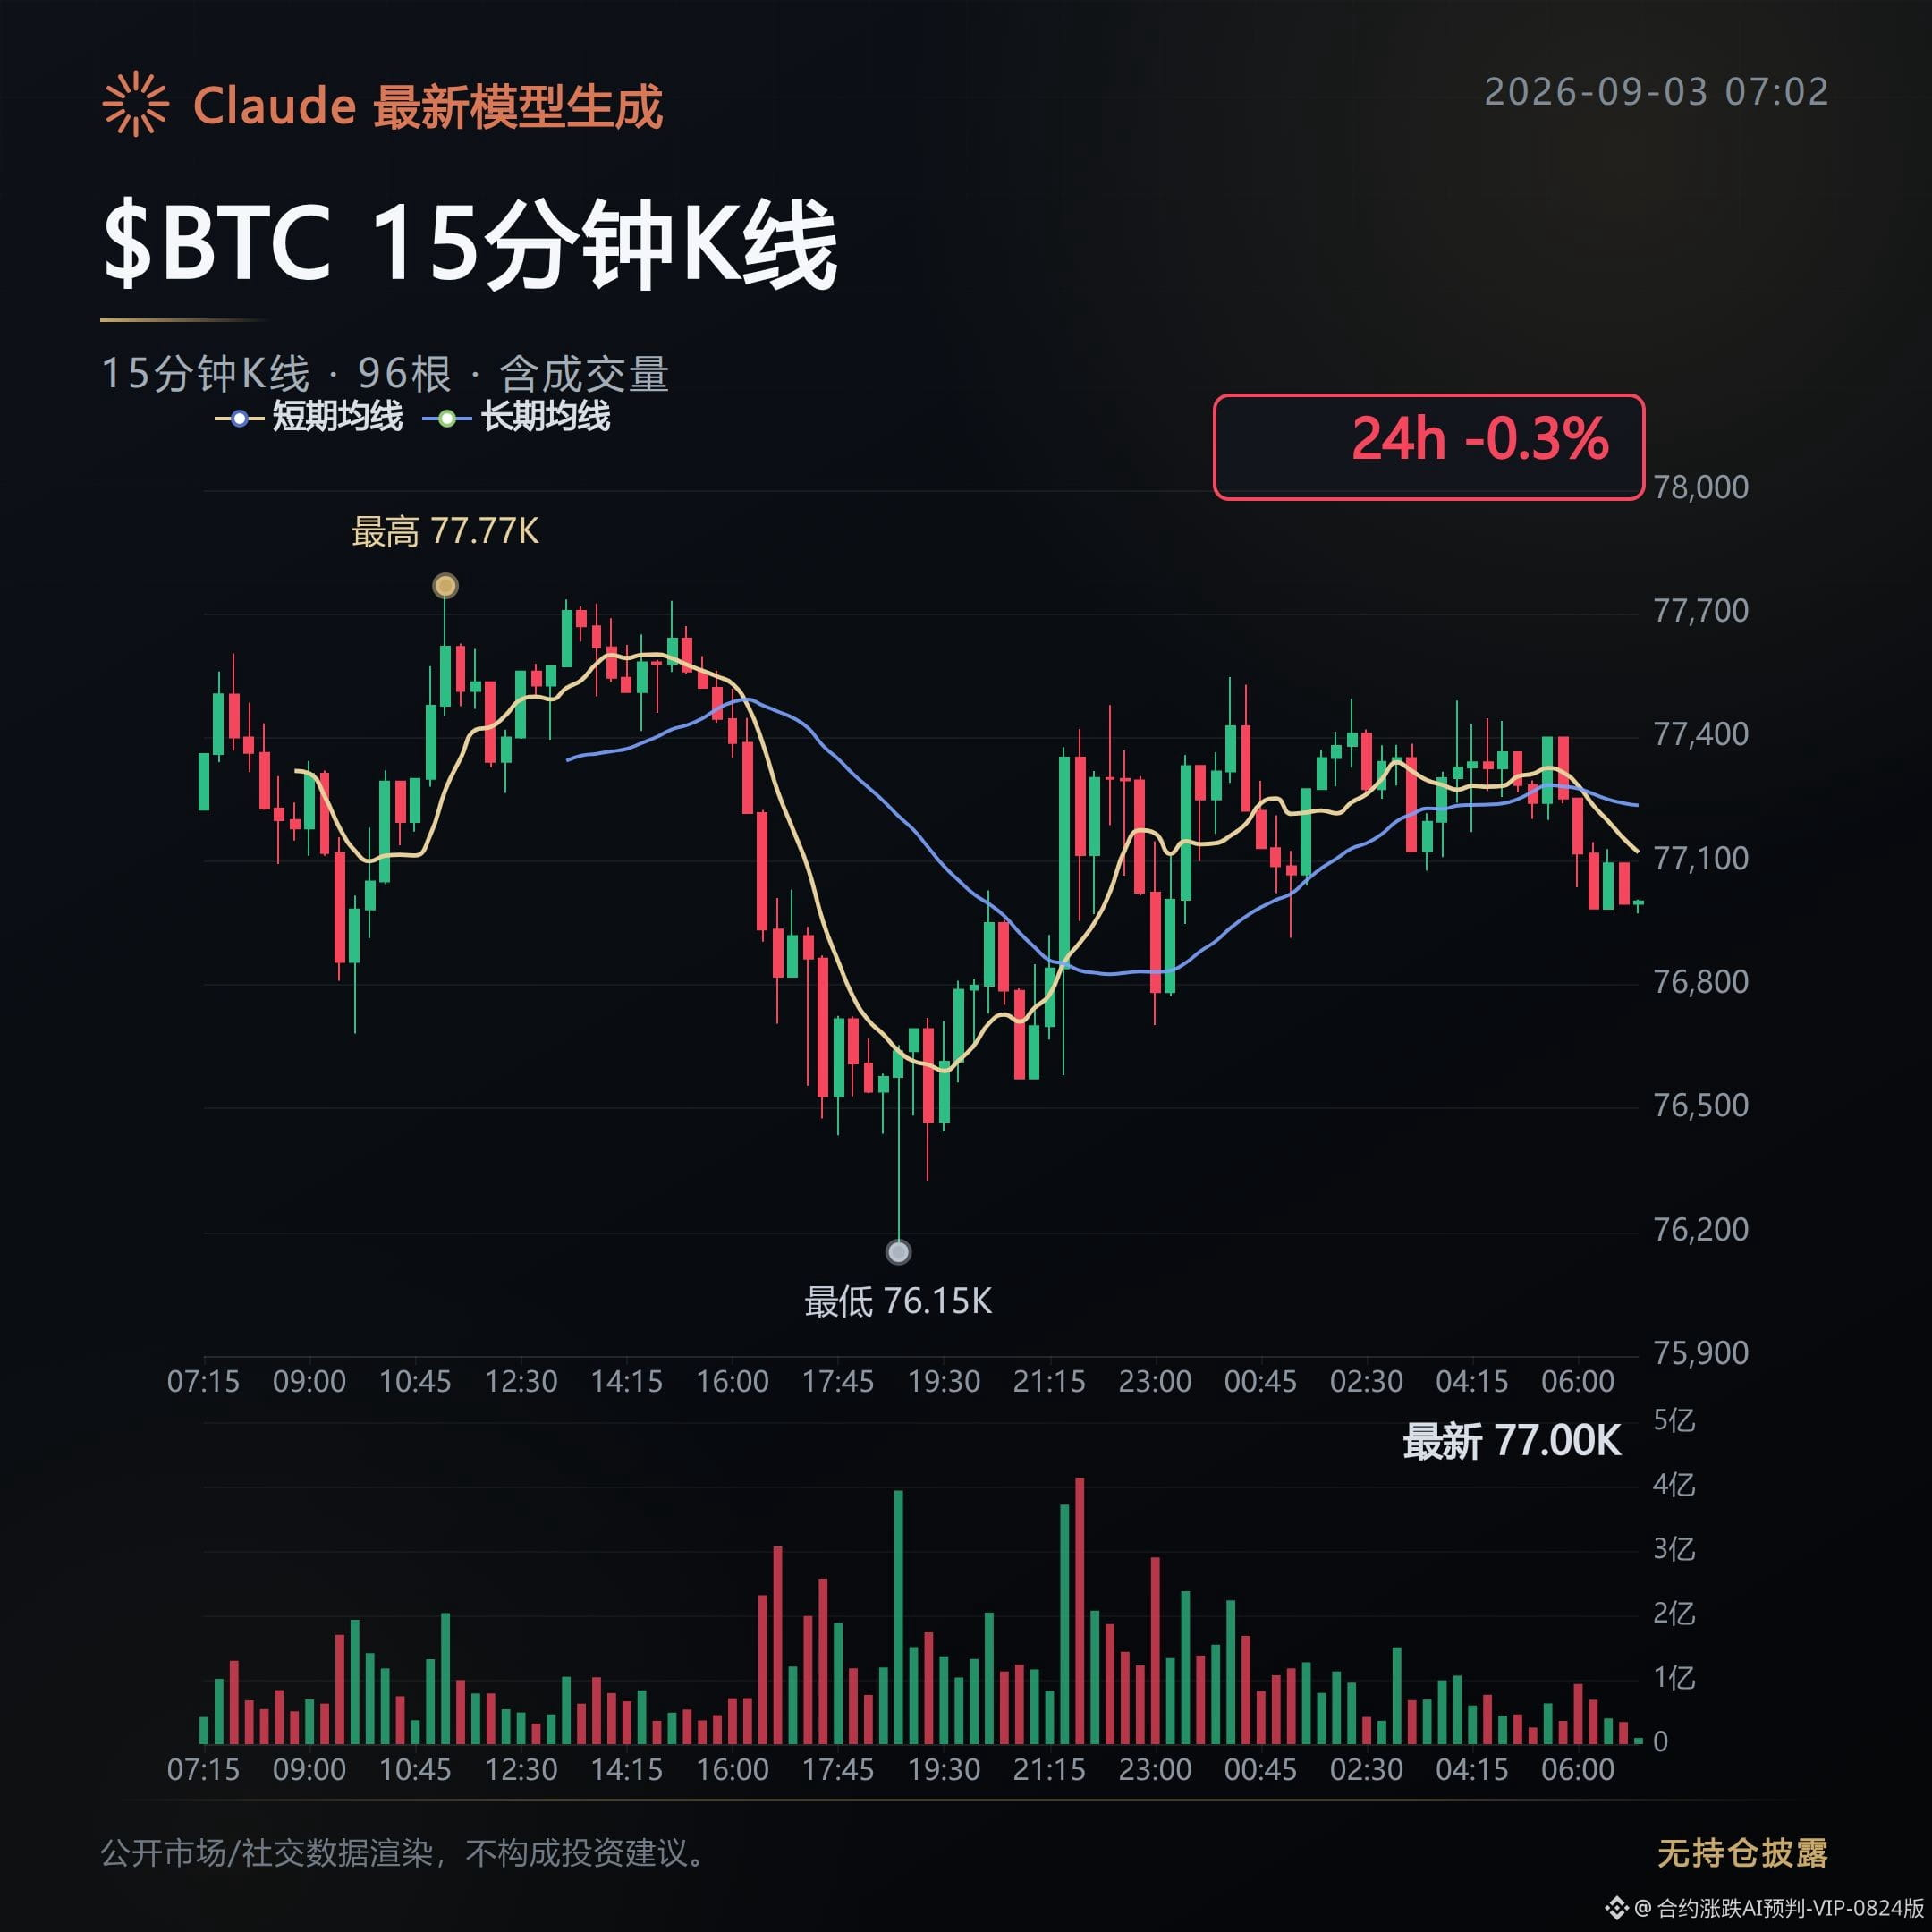
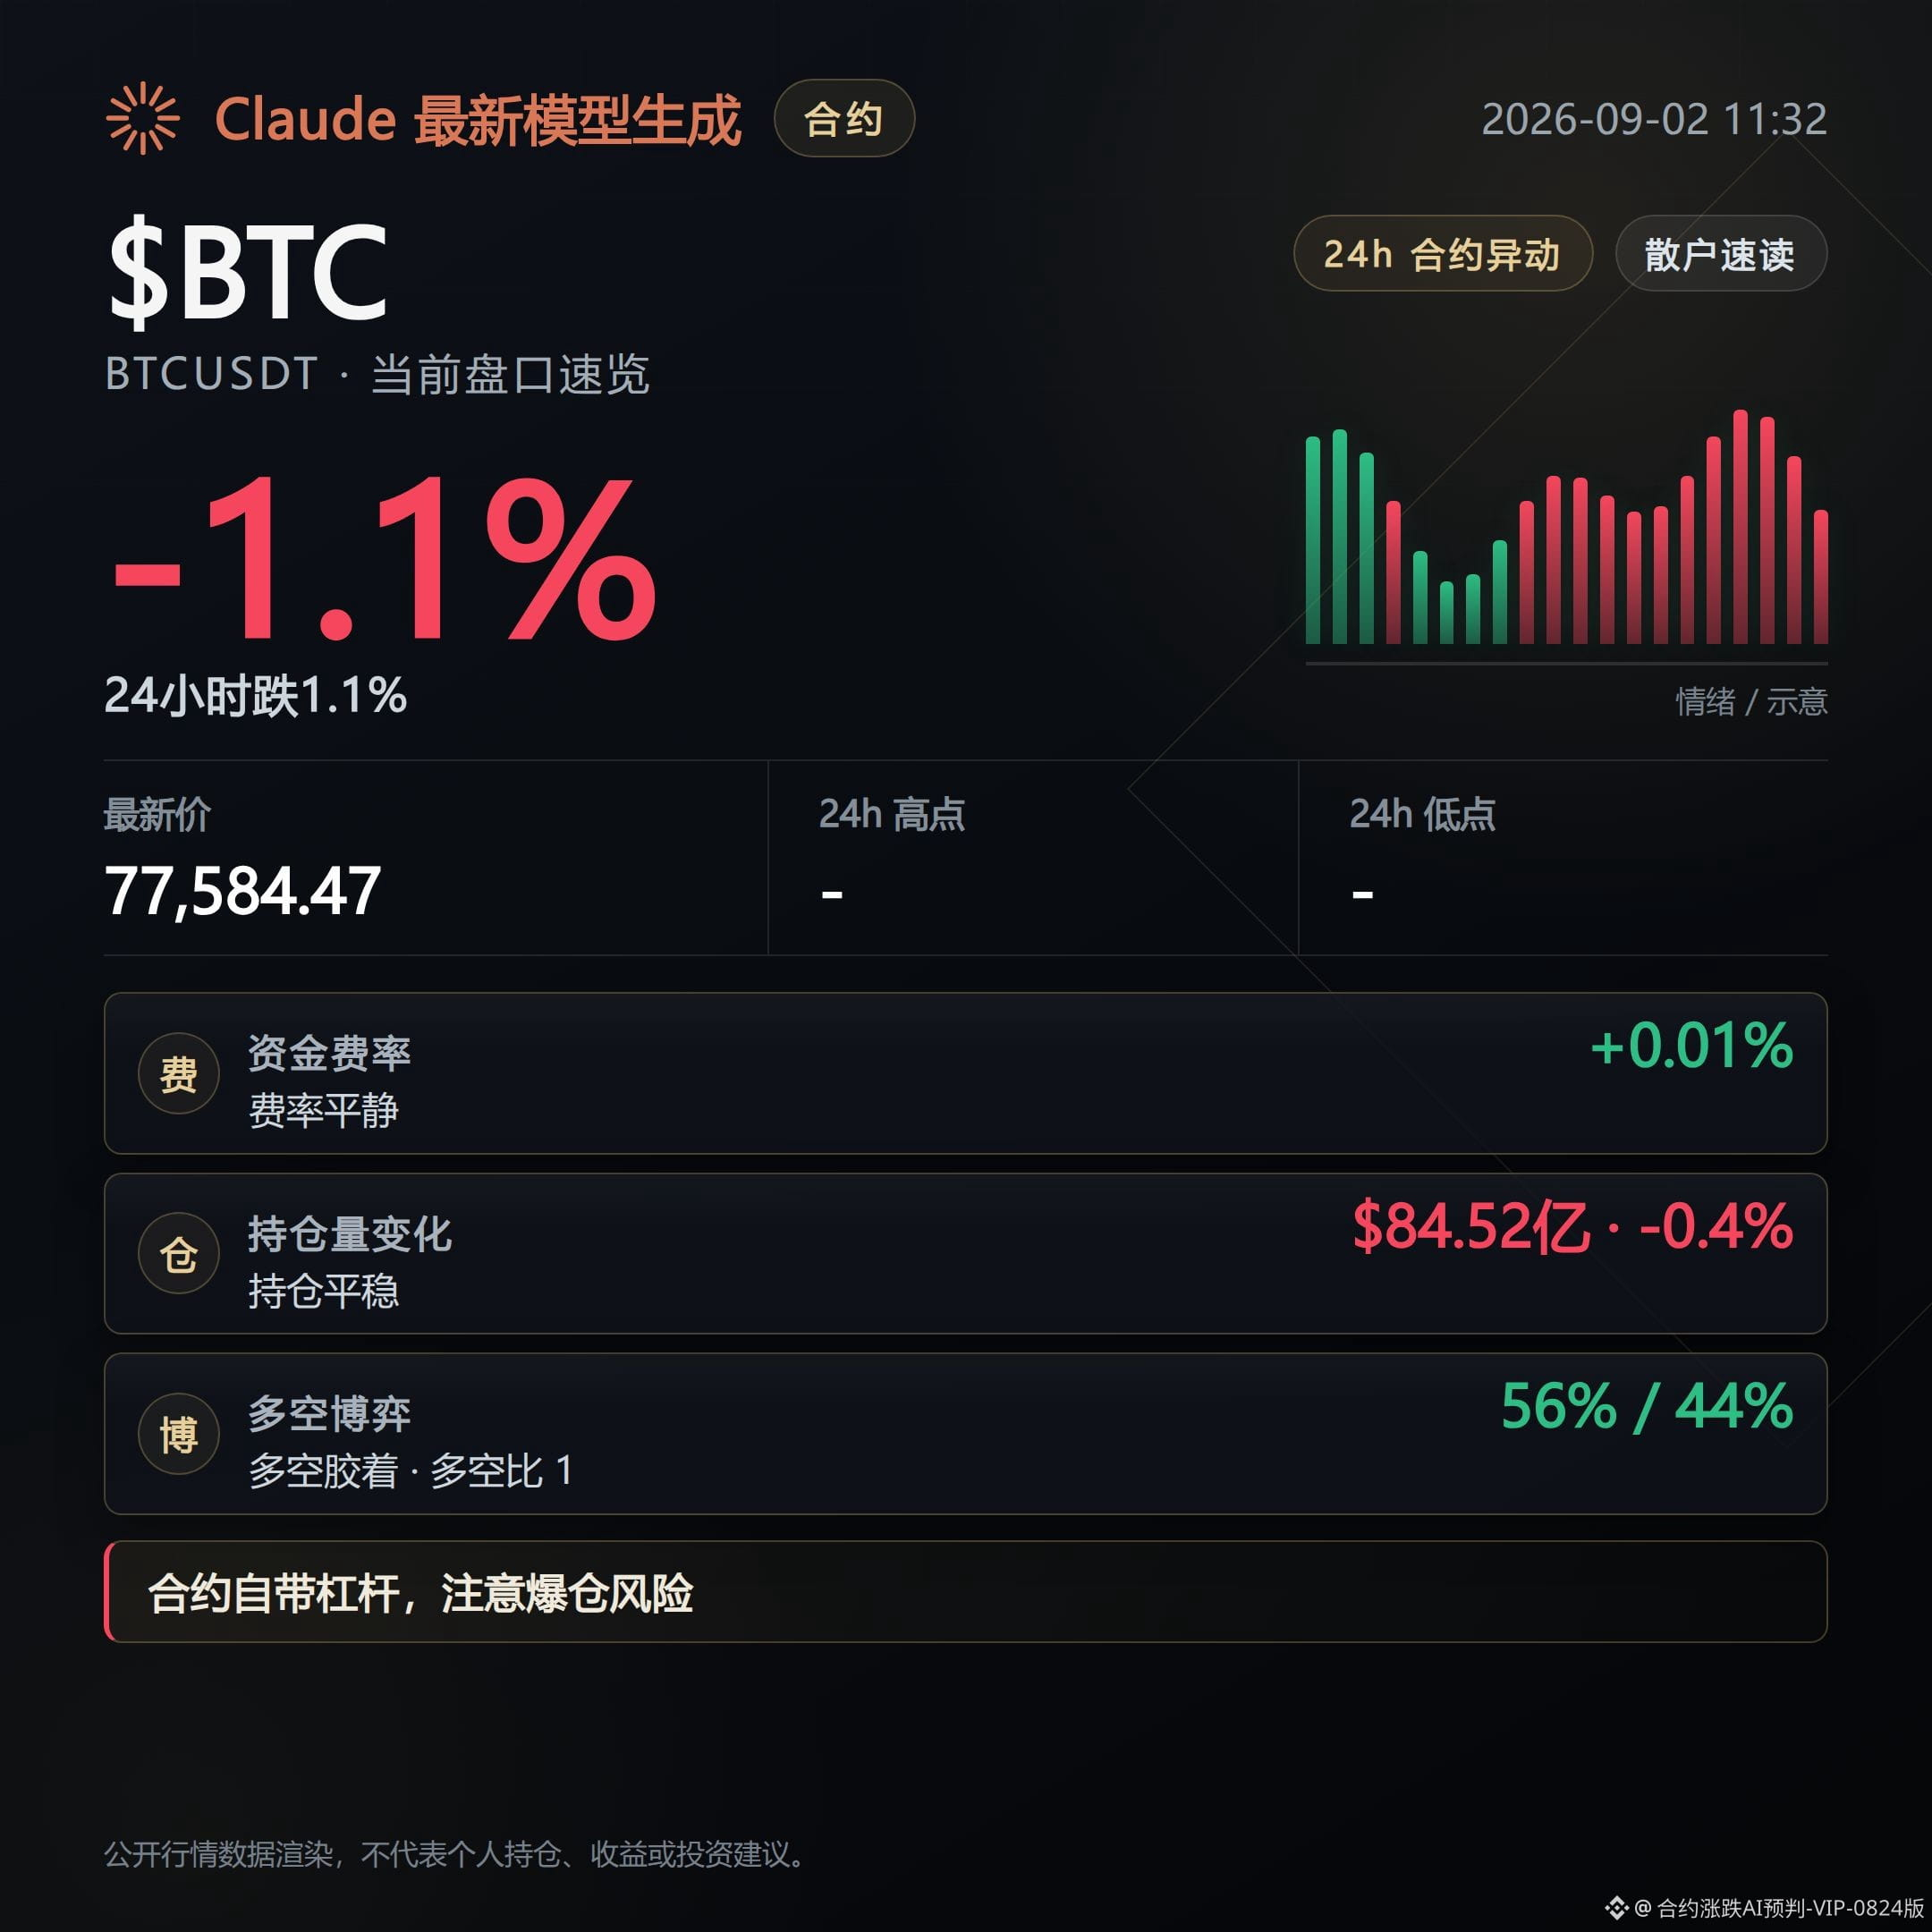
$BTC mark price 770,000, down 0.3% in 24 hours—looks not that bad.
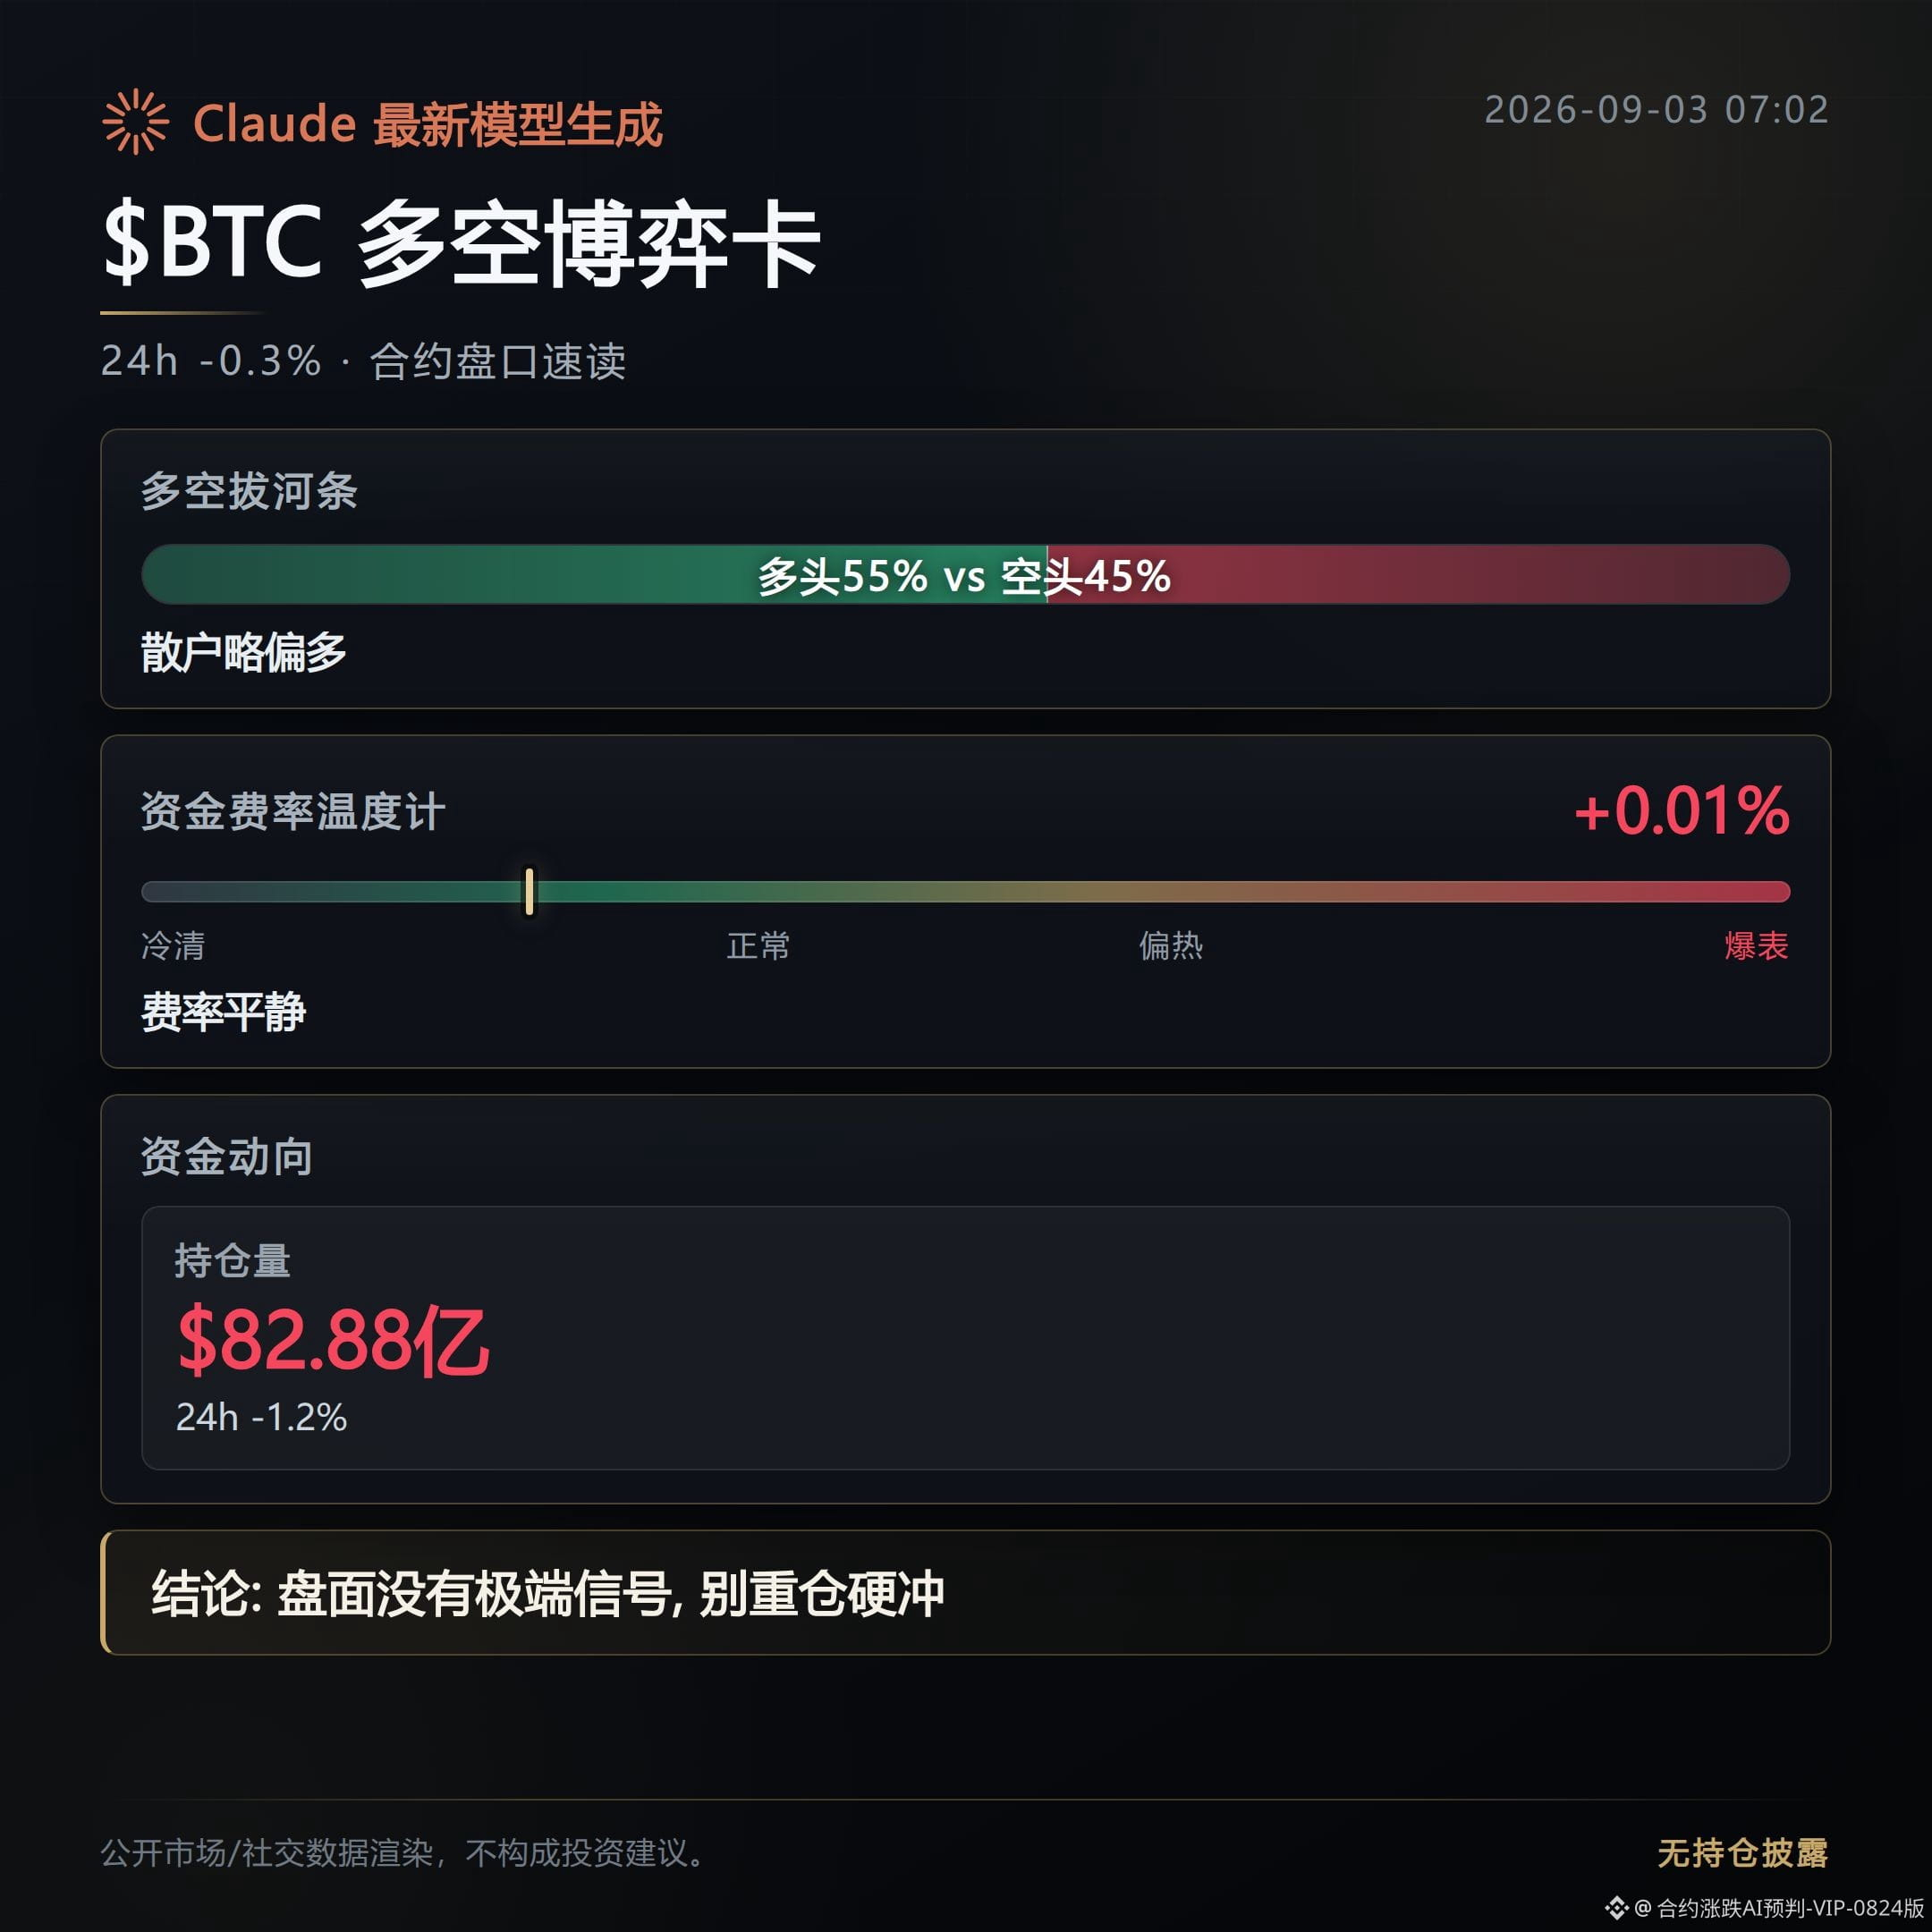
But the resting sell orders from sellers are more than the resting buy orders from buyers, suggesting this leg of the pullback is being actively smashed, not just a needle-poke.
Futures open interest is $8.288 billion, down 1.2% in a day, indicating some positions are being withdrawn.
The long-side ratio is still holding around 55%, and yet the Fear & Greed Index has jumped straight to 63, entering the Greed zone.
Price is falling, positions are shrinking, but sentiment is getting greedy—this mismatch usually means another batch of longs is still holding the line and hasn’t surrendered.
Once support below fails, these longs are likely to be forced out, triggering a cascade of liquidations and selloffs. This is still not the moment to call the top/bottom.
The sharp drop last night was not groundless.
Trump announced that the U.S. struck targets in Iran near the Strait of Hormuz and warned Iran not to retaliate.
Iran then said it would respond. Panic flared instantly, with $BTC smashing through 77,000 and $ETH falling below 2,400.
Within an hour, $60 million worth of long positions were liquidated.
Now $BTC is still consolidating around this level. Geopolitical risk hasn’t been resolved, so this price area remains sensitive.
$ETH has been hit harder than the broader market: down 1.37% over 24 hours, yet the funding rate is the highest among the four major coins at 0.009%—longs are still stubbornly paying the cost.
At the same time, Japan’s Remixpoint company announced it would liquidate its holdings of Ethereum and Ripple and concentrate the treasury into Bitcoin.
Put together, the two events only tell us there’s directional alignment; it doesn’t prove causation. But on the $ETH side, it truly is the weakest link among the major coins.
On the miscellaneous coins side, the funding rates have tugged toward both extremes.
LA, ACE, and T have funding rates all dropping to below -0.5%. Shorts are effectively paying to short; if there’s a rebound, it’s easy for them to get squeezed.
Meanwhile, PAYP, FWDI, and BNC have positive funding rates around 0.25% to 0.32%—longs are bearing the hard cost, and any breeze can lead to them being forced closed in the opposite direction.
Leverage is piled up heavily on both sides.
Next, watch two things.
The U.S. SEC chairman said the Clarity Act could be passed this month—one of the few upside catalysts.
The other is whether this 77,000 level can hold. If it can’t, the linkage may involve more than just $BTC .
Position disclosure: This account holds $FOGO long positions in spot trading. Disclosed to keep the content consistent with actual trading.
Claude Fable 5 helps generate; content is for market information reference only and does not constitute investment advice.
$BTC mark price 770,000, down 0.3% in 24 hours—looks not that bad.
But the resting sell orders from sellers are more than the resting buy orders from buyers, suggesting this leg of the pullback is being actively smashed, not just a needle-poke.
Futures open interest is $8.288 billion, down 1.2% in a day, indicating some positions are being withdrawn.
The long-side ratio is still holding around 55%, and yet the Fear & Greed Index has jumped straight to 63, entering the Greed zone.
Price is falling, positions are shrinking, but sentiment is getting greedy—this mismatch usually means another batch of longs is still holding the line and hasn’t surrendered.
Once support below fails, these longs are likely to be forced out, triggering a cascade of liquidations and selloffs. This is still not the moment to call the top/bottom.
The sharp drop last night was not groundless.
Trump announced that the U.S. struck targets in Iran near the Strait of Hormuz and warned Iran not to retaliate.
Iran then said it would respond. Panic flared instantly, with $BTC smashing through 77,000 and $ETH falling below 2,400.
Within an hour, $60 million worth of long positions were liquidated.
Now $BTC is still consolidating around this level. Geopolitical risk hasn’t been resolved, so this price area remains sensitive.
$ETH has been hit harder than the broader market: down 1.37% over 24 hours, yet the funding rate is the highest among the four major coins at 0.009%—longs are still stubbornly paying the cost.
At the same time, Japan’s Remixpoint company announced it would liquidate its holdings of Ethereum and Ripple and concentrate the treasury into Bitcoin.
Put together, the two events only tell us there’s directional alignment; it doesn’t prove causation. But on the $ETH side, it truly is the weakest link among the major coins.
On the miscellaneous coins side, the funding rates have tugged toward both extremes.
LA, ACE, and T have funding rates all dropping to below -0.5%. Shorts are effectively paying to short; if there’s a rebound, it’s easy for them to get squeezed.
Meanwhile, PAYP, FWDI, and BNC have positive funding rates around 0.25% to 0.32%—longs are bearing the hard cost, and any breeze can lead to them being forced closed in the opposite direction.
Leverage is piled up heavily on both sides.
Next, watch two things.
The U.S. SEC chairman said the Clarity Act could be passed this month—one of the few upside catalysts.
The other is whether this 77,000 level can hold. If it can’t, the linkage may involve more than just $BTC .
Position disclosure: This account holds $FOGO long positions in spot trading. Disclosed to keep the content consistent with actual trading.
Claude Fable 5 helps generate; content is for market information reference only and does not constitute investment advice.
$AKE
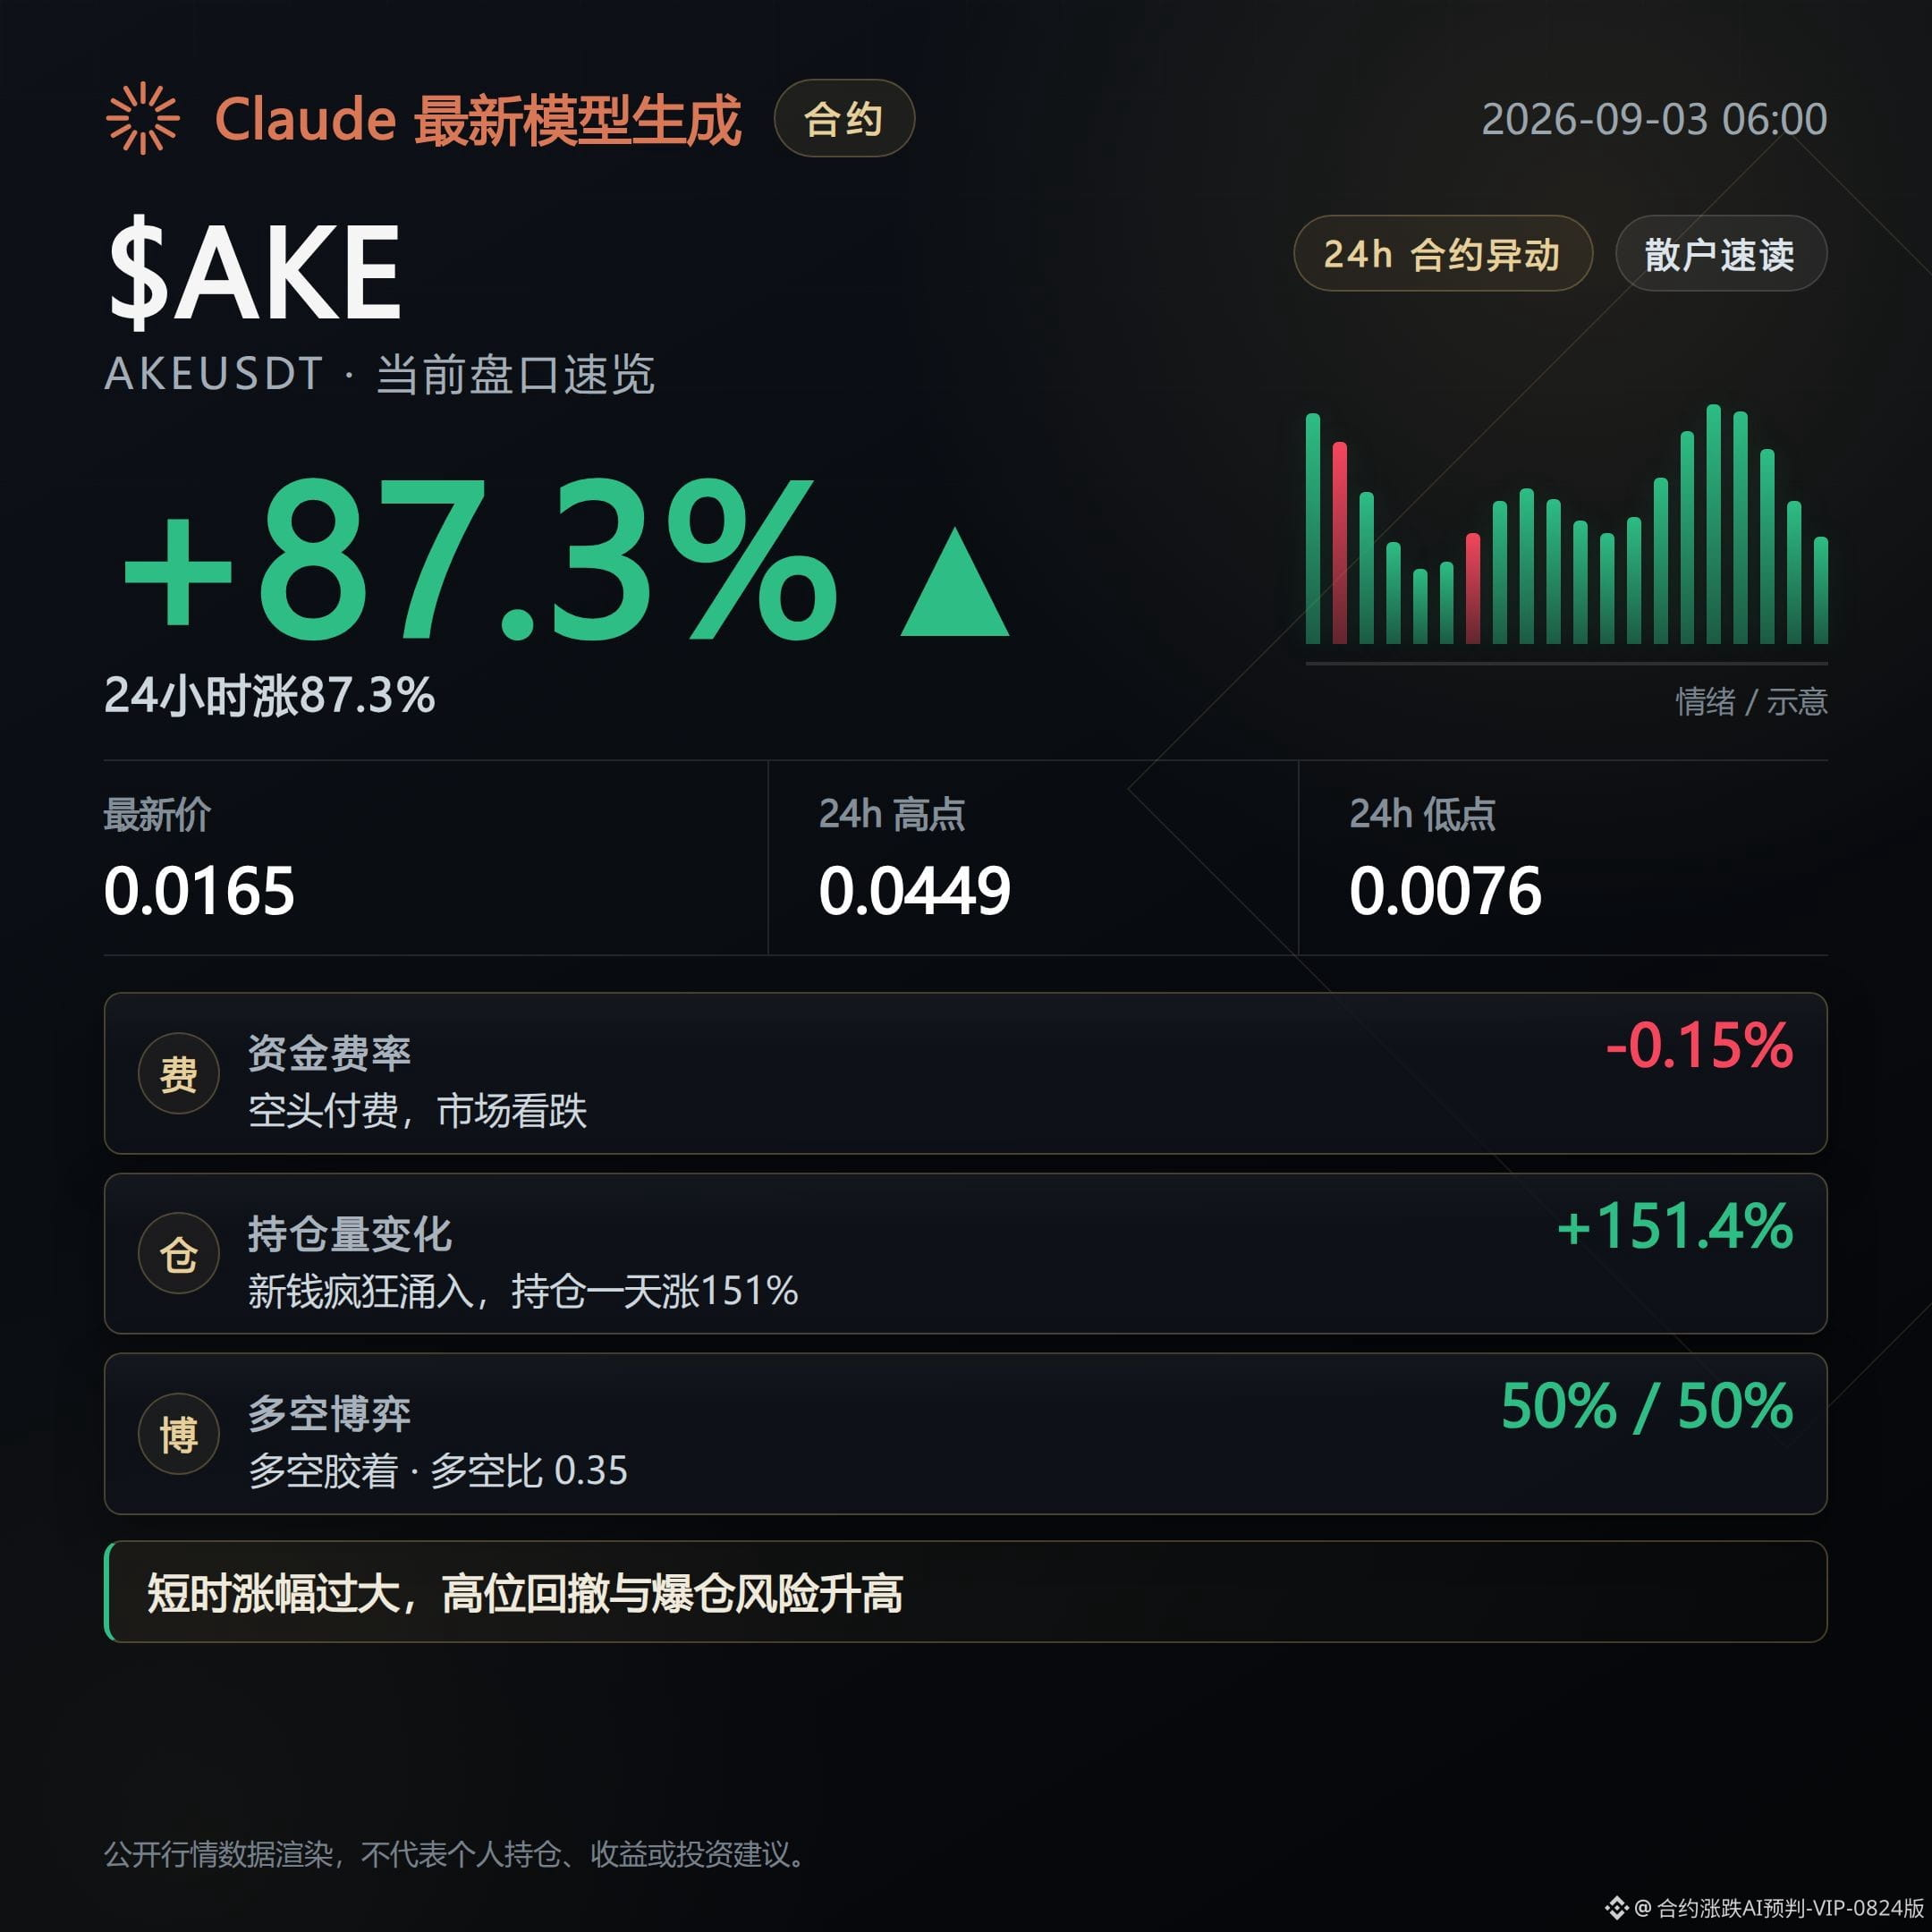
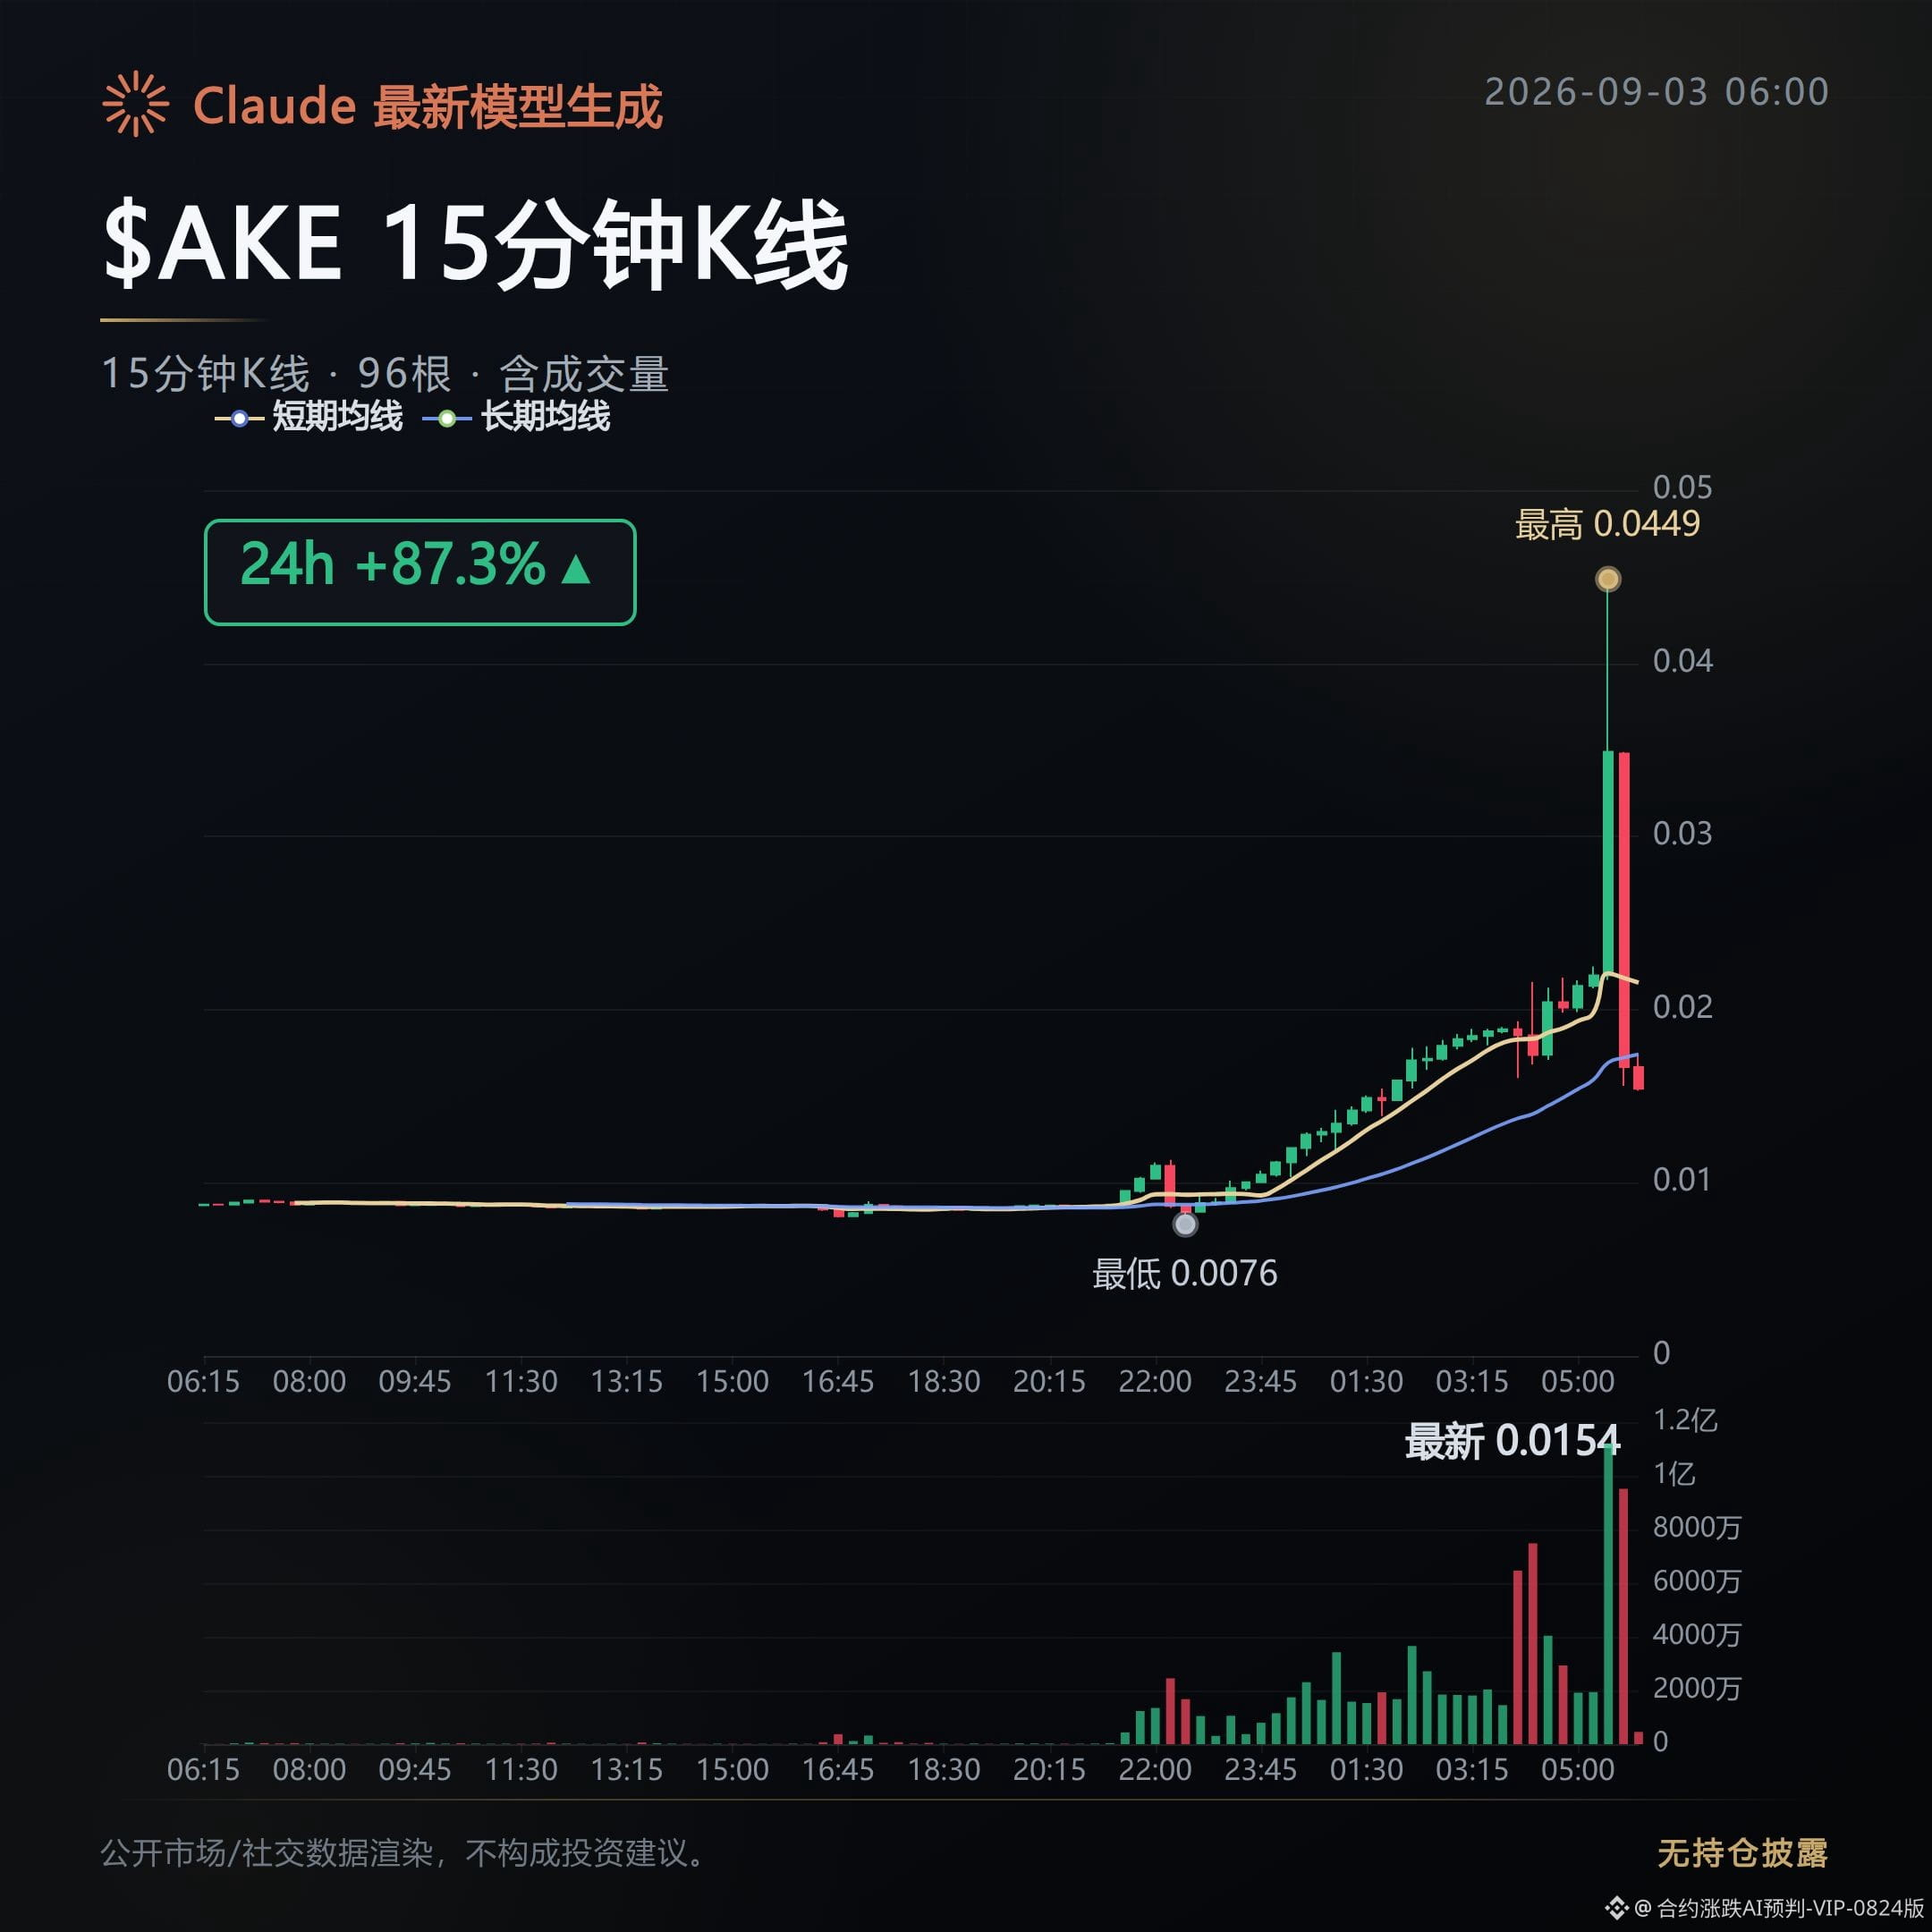
In the past 24 hours, it’s up 87.3%. The price has surged from the lowest 0.0076 up to around 0.044859, and is now pulling back to around 0.0165.
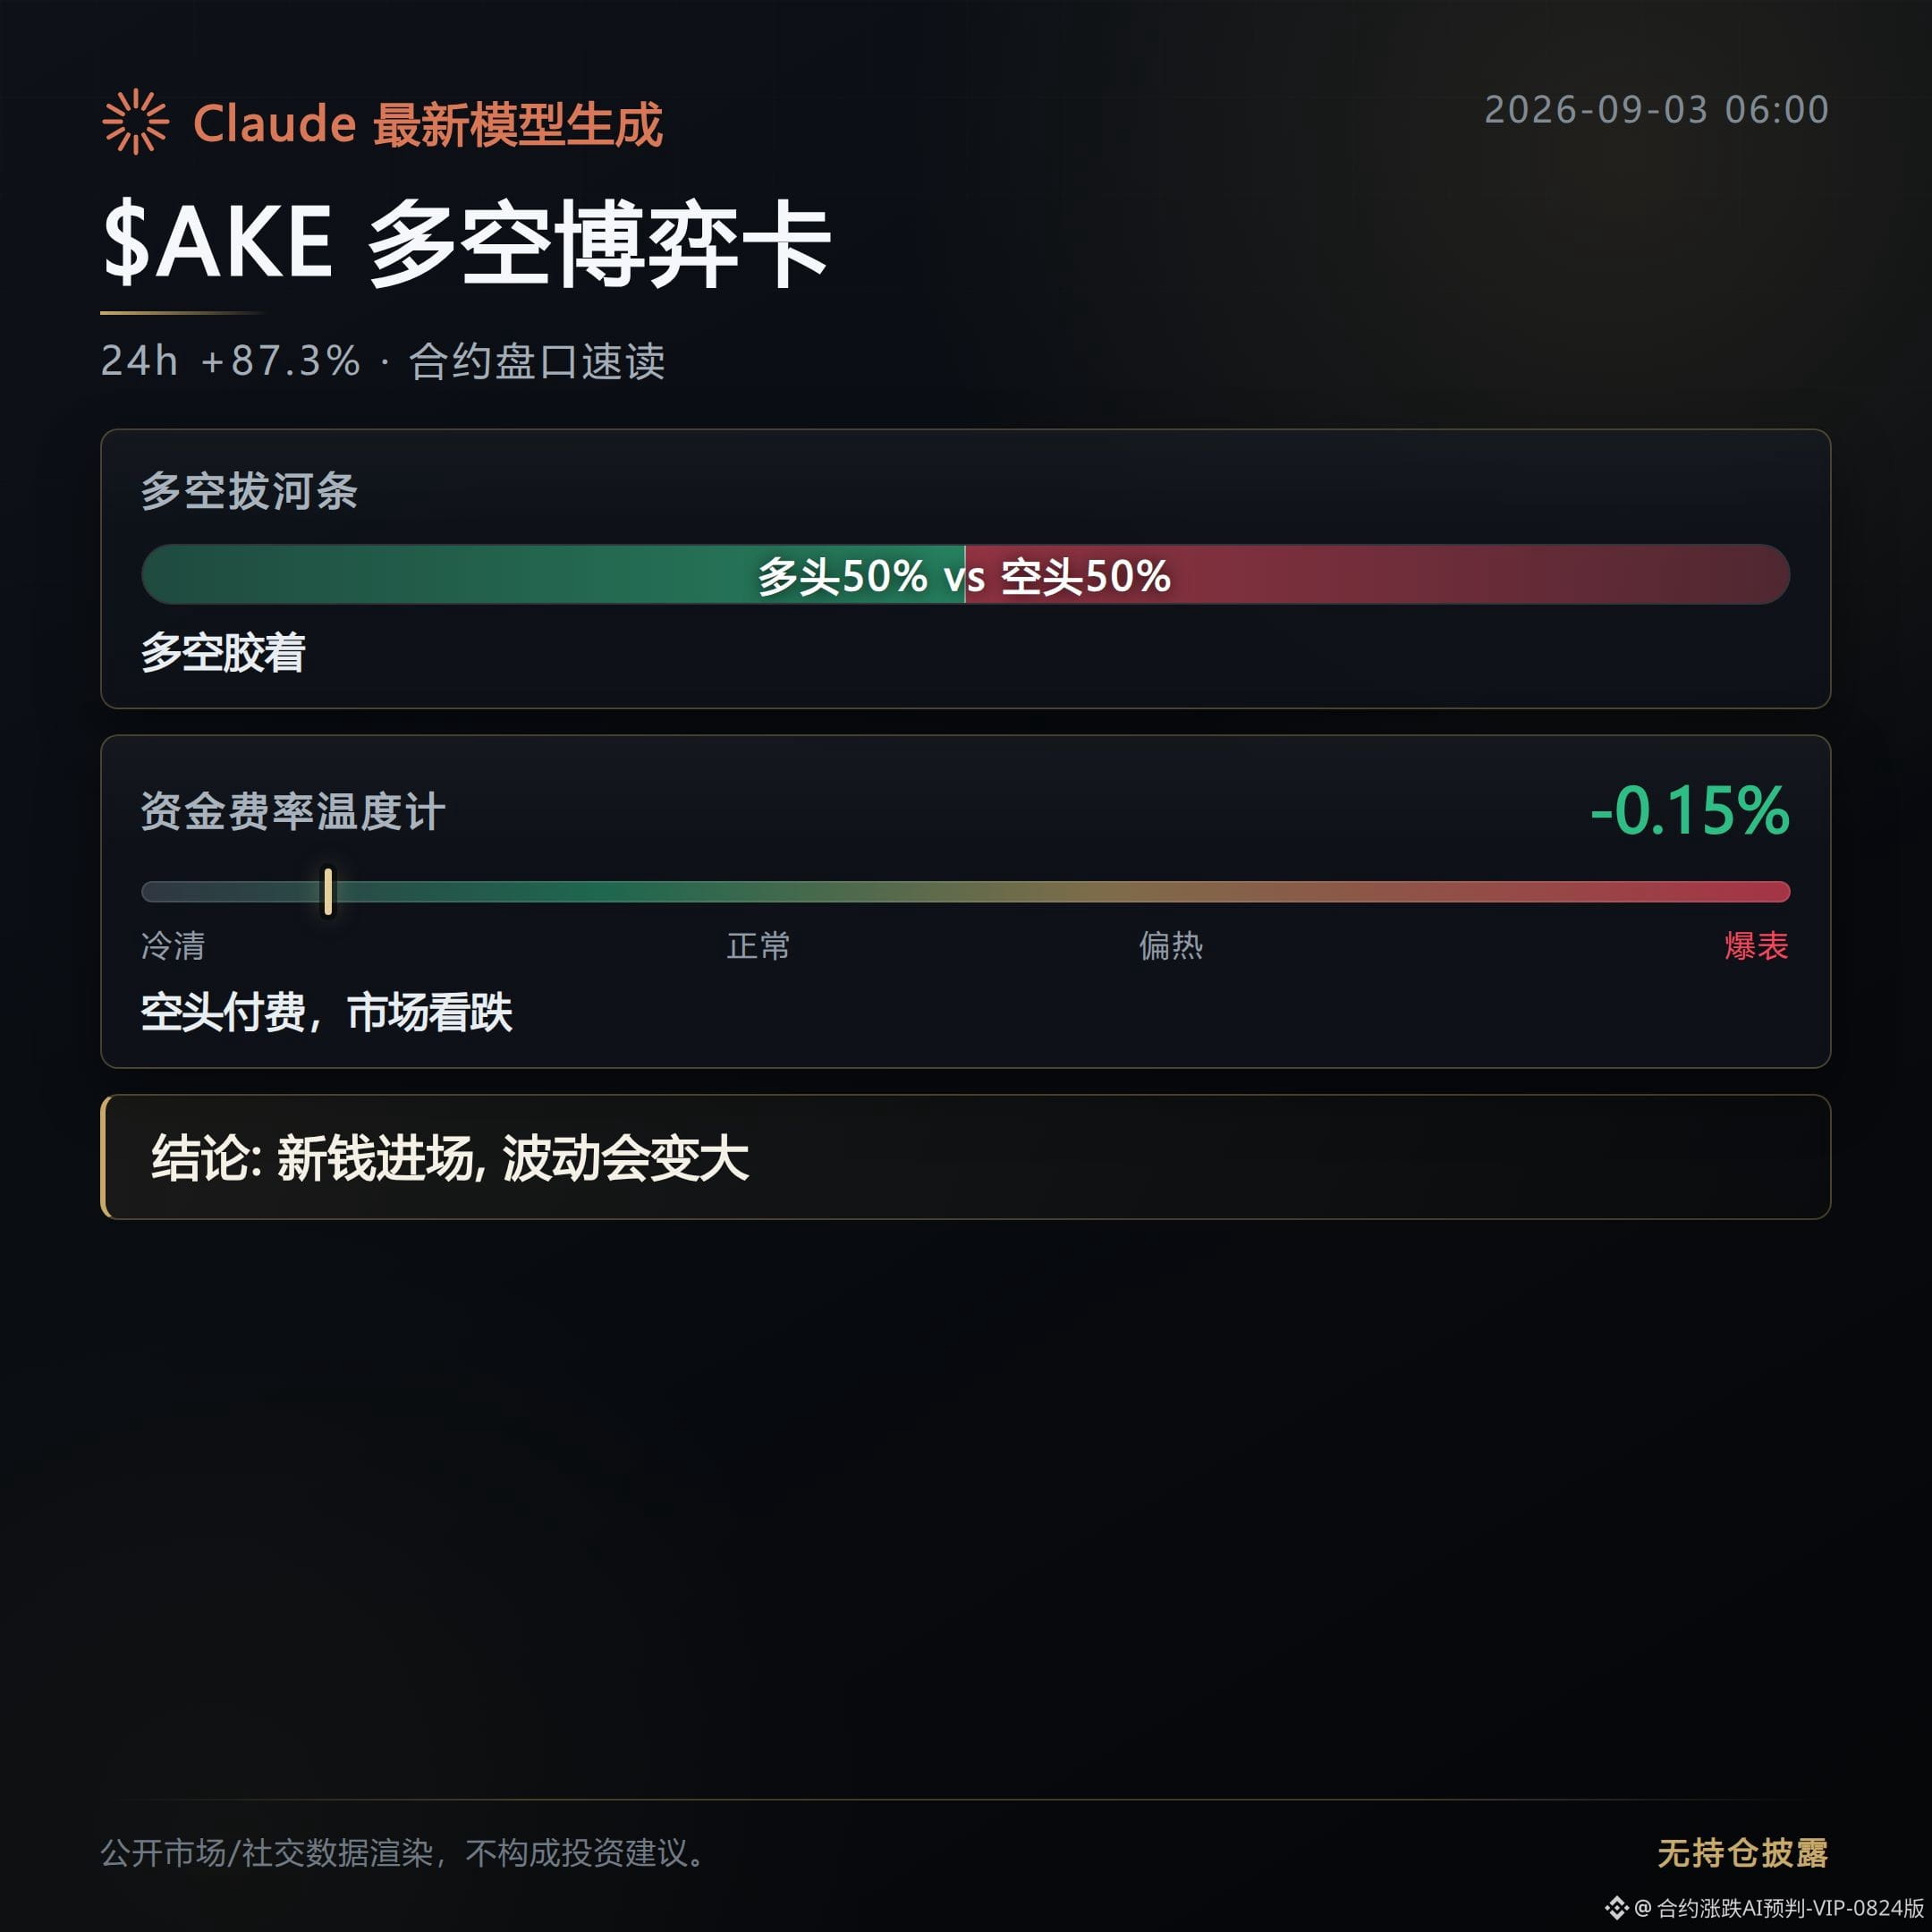
Funding rate is showing -0.153%, with shorts paying and still hard-holding. Yet open interest is up 151.4%. This kind of combination is the most likely to lead to an increasingly fierce squeeze.
Total volume is 909 million. The volume growth matches the percentage increase—this isn’t a pulse with no volume.
$T
Up 39.2%, funding rate -0.507%, even more extreme than AKE’s short paying pressure.
Open interest is up 529.3%, and it surged in a short time rather than being built up slowly. At times like this, the order book can become very sensitive.
$BULLA
Up 48.8%. Funding rate is still positive. Open interest is up 52.3%, which is a bit different from the first two—it feels more like longs are adding positions normally, rather than shorts being forced down and squeezed.
Among the three, AKE and T’s negative funding-rate structure is the most worth taking a closer look. The tighter the shorts are pressed, the more likely they’ll be forced out later, triggering a move.
In the remaining names: MUBARAK is up 34.3%, BTW up 34.1%, CLO up 32.4%, EGLD up 30.4%, MAGMA up 24.7%, KITE up 17.8%, SNOW up 16.5%. The heat is spread out, but none have fallen far behind.
On the downside: BTR is down 49.5%, CYS down 21.3%, STAR down 20.5%. Among them, BTR and STAR’s open interest is clearly contracting, as if capital is exiting.
The current squeeze candidates are mainly focused on AKE and T. Both shorts’ funding costs have already reached relatively extreme levels. The longer this structure lasts, the more violent the breakout often becomes.
At 6 a.m. this morning, the movements in these order books are worth watching for follow-through.
$AKE $T $BULLA #合约市场 # Squeeze signal
Live trading disclosure: This account currently holds long positions in FOGO; the related views align with the actual positions.
This content is assisted-generated by Claude Fable 5 and is for informational reference only—please verify it yourself.
In the past 24 hours, it’s up 87.3%. The price has surged from the lowest 0.0076 up to around 0.044859, and is now pulling back to around 0.0165.
Funding rate is showing -0.153%, with shorts paying and still hard-holding. Yet open interest is up 151.4%. This kind of combination is the most likely to lead to an increasingly fierce squeeze.
Total volume is 909 million. The volume growth matches the percentage increase—this isn’t a pulse with no volume.
$T
Up 39.2%, funding rate -0.507%, even more extreme than AKE’s short paying pressure.
Open interest is up 529.3%, and it surged in a short time rather than being built up slowly. At times like this, the order book can become very sensitive.
$BULLA
Up 48.8%. Funding rate is still positive. Open interest is up 52.3%, which is a bit different from the first two—it feels more like longs are adding positions normally, rather than shorts being forced down and squeezed.
Among the three, AKE and T’s negative funding-rate structure is the most worth taking a closer look. The tighter the shorts are pressed, the more likely they’ll be forced out later, triggering a move.
In the remaining names: MUBARAK is up 34.3%, BTW up 34.1%, CLO up 32.4%, EGLD up 30.4%, MAGMA up 24.7%, KITE up 17.8%, SNOW up 16.5%. The heat is spread out, but none have fallen far behind.
On the downside: BTR is down 49.5%, CYS down 21.3%, STAR down 20.5%. Among them, BTR and STAR’s open interest is clearly contracting, as if capital is exiting.
The current squeeze candidates are mainly focused on AKE and T. Both shorts’ funding costs have already reached relatively extreme levels. The longer this structure lasts, the more violent the breakout often becomes.
At 6 a.m. this morning, the movements in these order books are worth watching for follow-through.
$AKE $T $BULLA #合约市场 # Squeeze signal
Live trading disclosure: This account currently holds long positions in FOGO; the related views align with the actual positions.
This content is assisted-generated by Claude Fable 5 and is for informational reference only—please verify it yourself.
Three numbers are put out first: 69.6%, 128.1%, and 539.6%.
These are the top three holdings changes by today’s gain, not price gains.
Real money—actual capital—is flowing in, not just sentiment being stacked up.
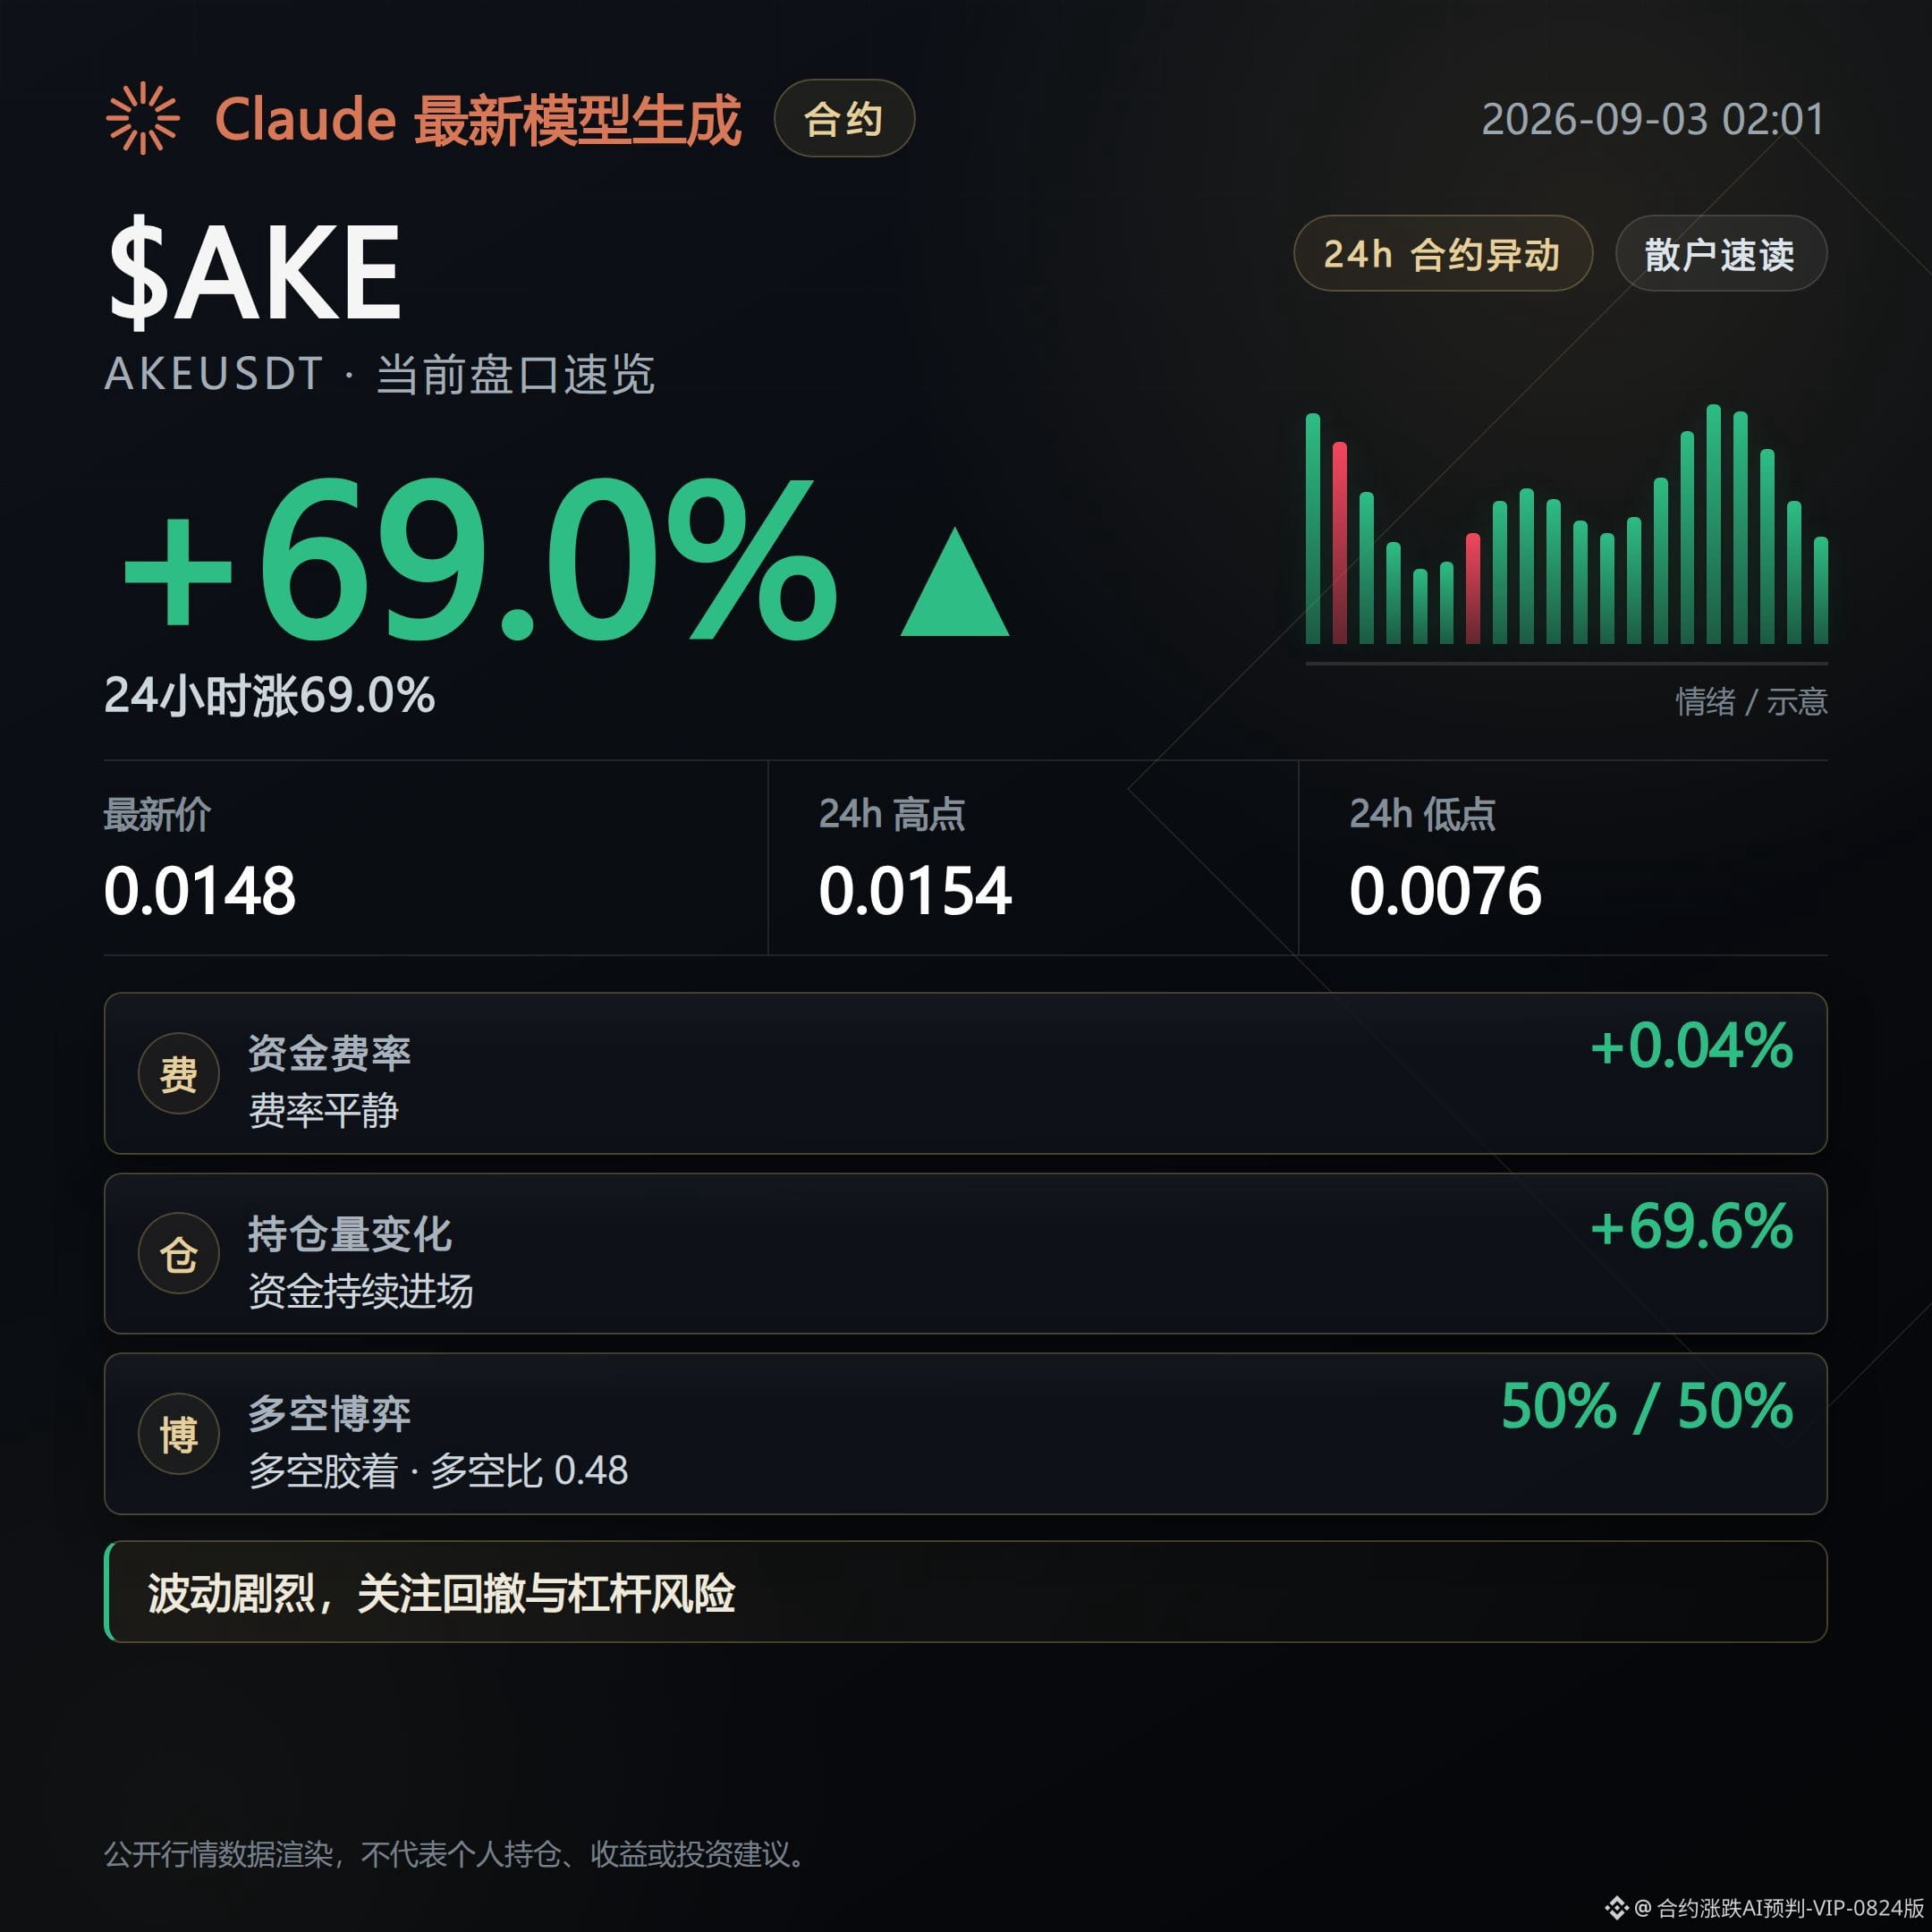
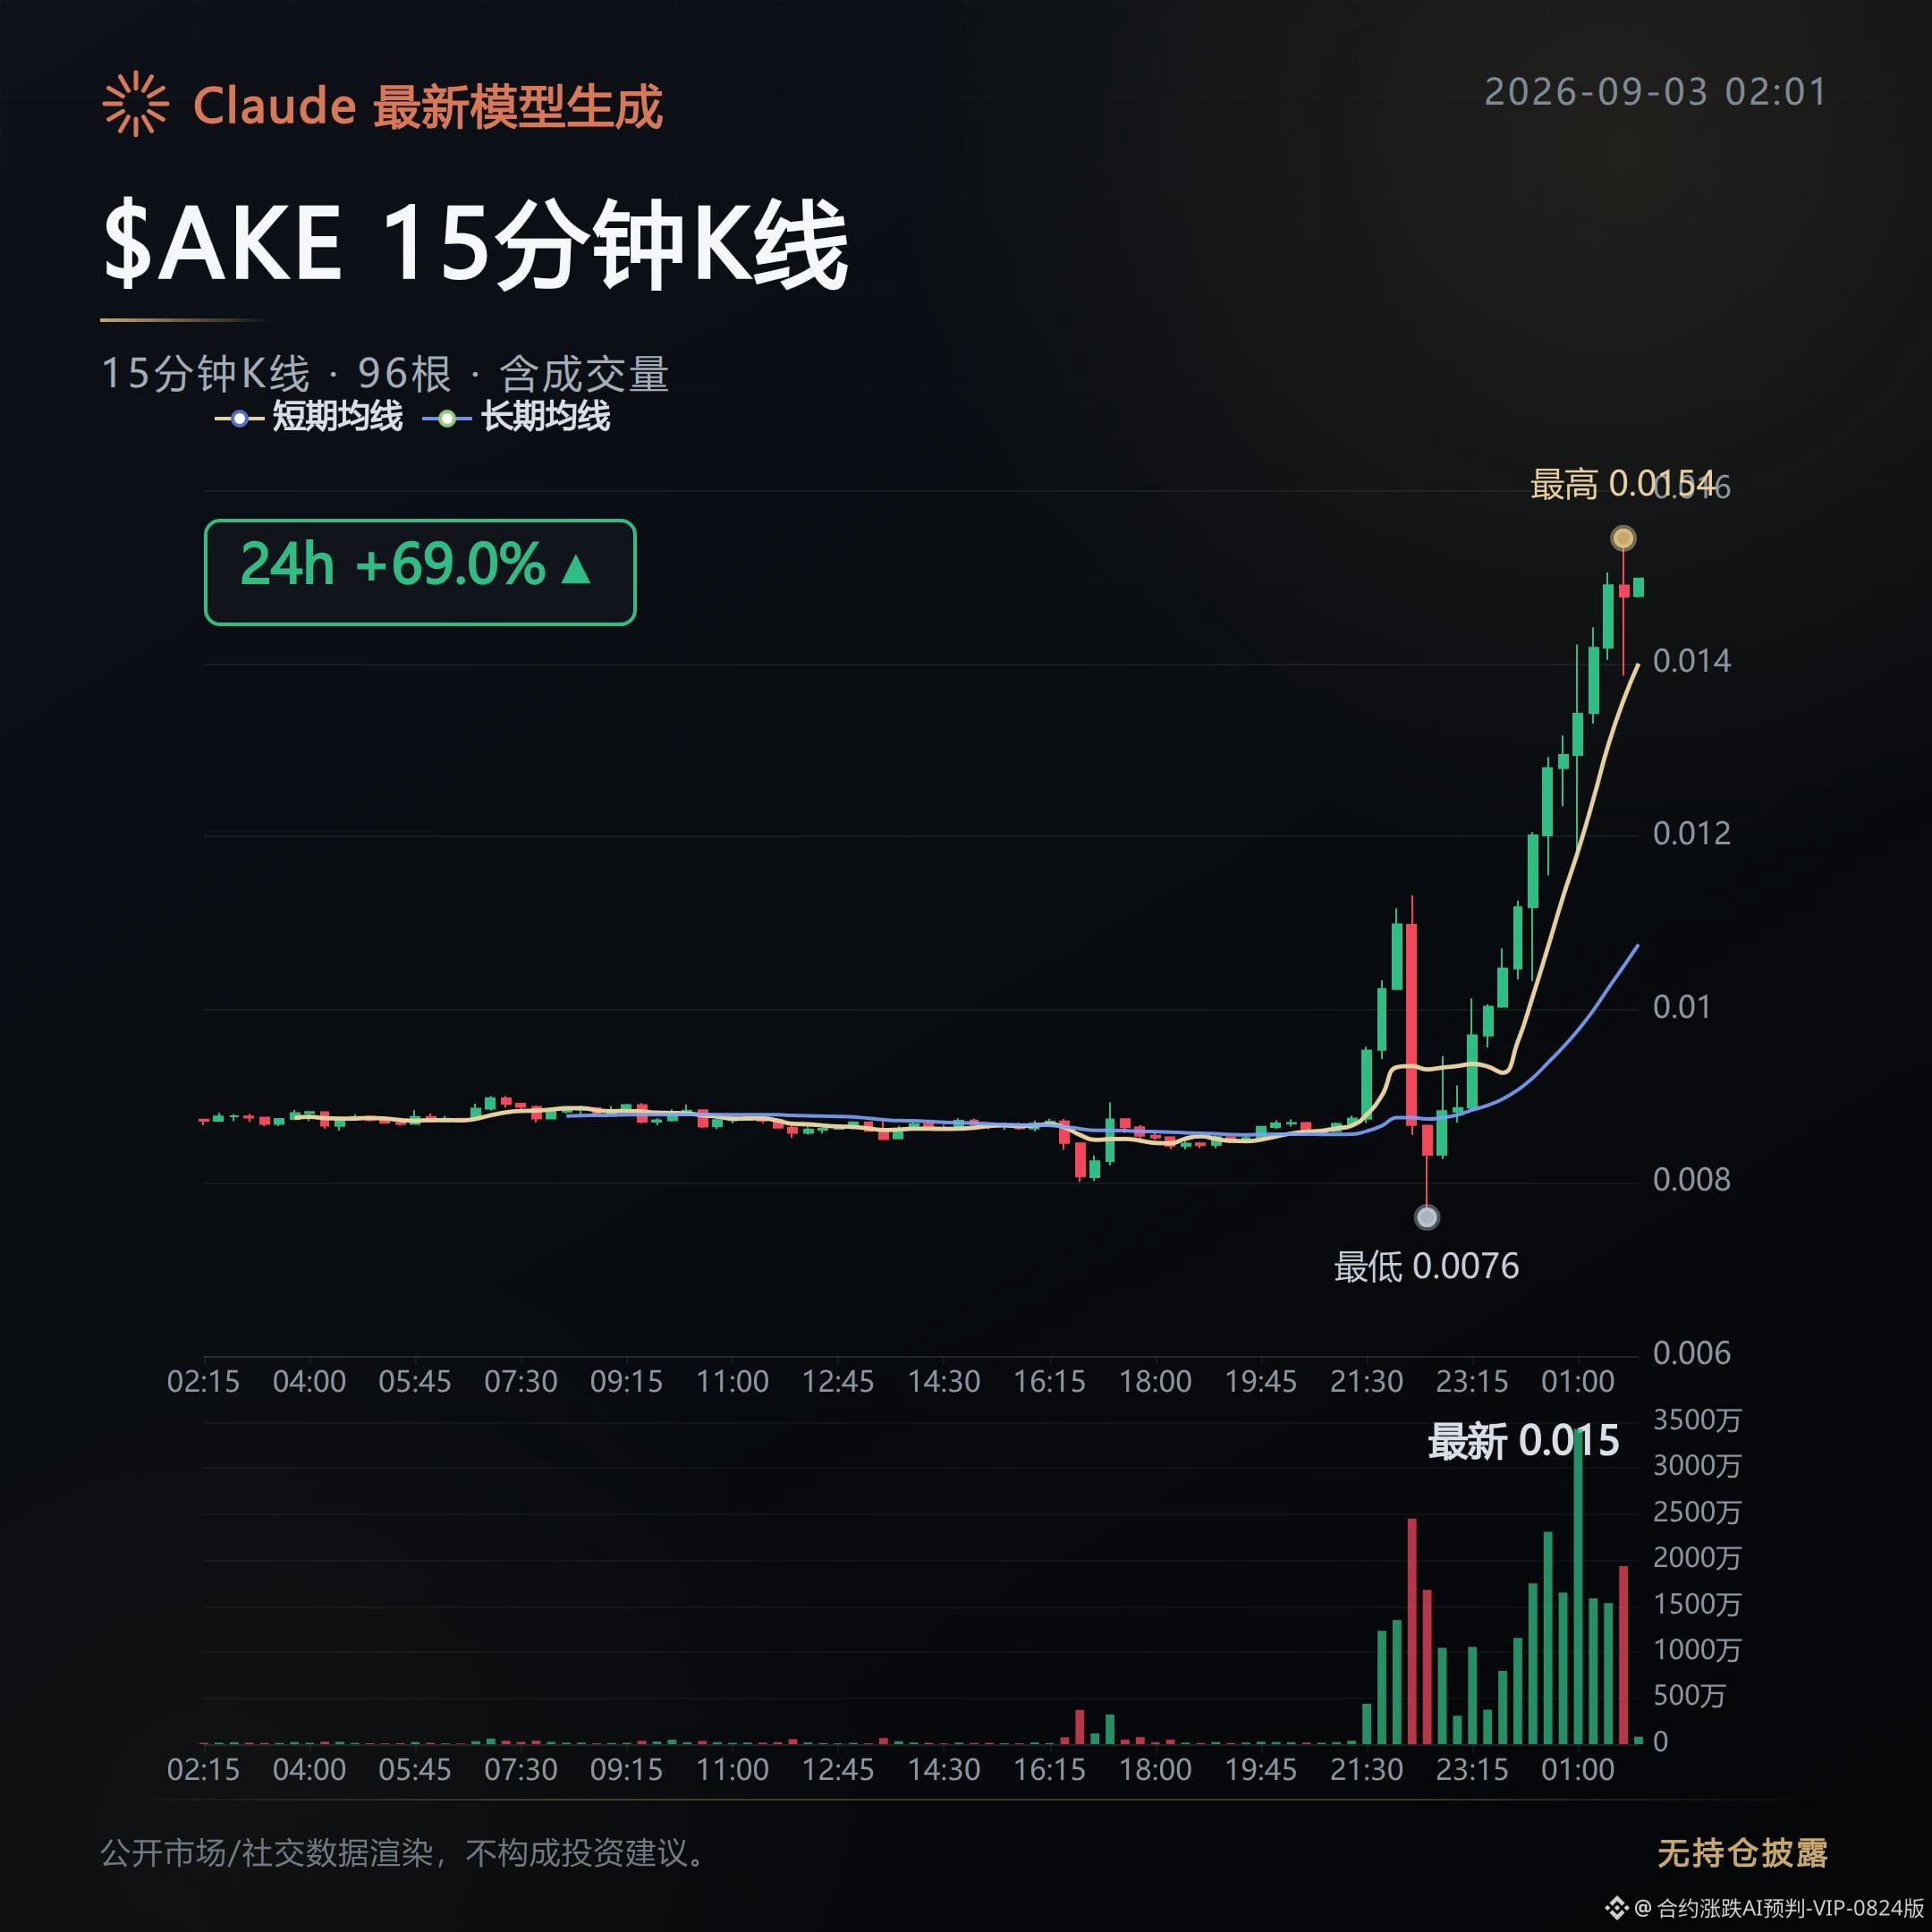
$AKE is up 69%, price 0.014755, 24h high 0.015444, low 0.0076, and the amplitude is close to doubling.
Funding rate is 0.039%; longs pay a little, and the ratio of active buy/sell orders is 1.15, with buys stronger than sells.
Open interest up 69.6% in 1 day, $286 million in trading volume—volume, price, and open interest all expand together; it’s not a one-sided spike.
$MAGMA is up 41%, with open interest surging 128.1%—the most aggressively rising position among the three.
Price is 0.54306, with a 24h range of 0.38415 to 0.57704; volatility is huge.
Funding rate is 0.042%; the active buy/sell order ratio is 1.14; $245 million in volume. The open-interest increase is about twice as fast as the price increase, suggesting fresh money is still entering, not old positions pushing the price.
$T is the most unusual one among the three.
Price is up 34.5%, but the funding rate is -0.249%; shorts are paying to short.
Meanwhile open interest also explodes 539.6% and trading volume reaches $311 million. The long/short ratio is 0.98, close to a 50/50 split—shorts lose money and are forced to add more.
The higher it goes, the higher the cost for shorts to hold their positions. This kind of structure is prone to a squeeze.
The common thread across the three coins is that the open-interest growth far outpaces the price growth, and the incremental capital is more active than old positions.
Keep an eye on whether the funding rate for T can narrow—if the negative rate keeps widening, shorts haven’t conceded.
Further on, BULLA is up 30.9%, CLO up 26.5%, MUBARAK up 26.4%, KITE up 19.7%, USELESS up 18.0%, EGLD up 17.4%, PYTH up 14.7%, and all the top ten are in the green.
In the decliners list, CRDO is actually the one with the strongest “short squeeze” feel.
Price is down 22.8%, but the funding rate is +0.052%—the longs are still paying to hold, while open interest rises against the trend by 534.3%.
As it keeps dropping, longs even add to their positions; the longer this structure drags on, the more likely it is to trigger a cascade of liquidation.
BTR is down 46.0%; open interest decreases by 45.8%. This is a pure sell-off drop with de-risking, completely different from CRDO’s structure—one is holding/carrying, the other is running.
$AKE $MAGMA $T #合约雷达 #Open-interest abnormal movement
Live record: This account currently holds FOGO long positions; the logic remains unchanged, so we continue to hold.
Claude Fable 5 assists with generation; the content is for market information reference only and does not constitute investment advice.
These are the top three holdings changes by today’s gain, not price gains.
Real money—actual capital—is flowing in, not just sentiment being stacked up.
$AKE is up 69%, price 0.014755, 24h high 0.015444, low 0.0076, and the amplitude is close to doubling.
Funding rate is 0.039%; longs pay a little, and the ratio of active buy/sell orders is 1.15, with buys stronger than sells.
Open interest up 69.6% in 1 day, $286 million in trading volume—volume, price, and open interest all expand together; it’s not a one-sided spike.
$MAGMA is up 41%, with open interest surging 128.1%—the most aggressively rising position among the three.
Price is 0.54306, with a 24h range of 0.38415 to 0.57704; volatility is huge.
Funding rate is 0.042%; the active buy/sell order ratio is 1.14; $245 million in volume. The open-interest increase is about twice as fast as the price increase, suggesting fresh money is still entering, not old positions pushing the price.
$T is the most unusual one among the three.
Price is up 34.5%, but the funding rate is -0.249%; shorts are paying to short.
Meanwhile open interest also explodes 539.6% and trading volume reaches $311 million. The long/short ratio is 0.98, close to a 50/50 split—shorts lose money and are forced to add more.
The higher it goes, the higher the cost for shorts to hold their positions. This kind of structure is prone to a squeeze.
The common thread across the three coins is that the open-interest growth far outpaces the price growth, and the incremental capital is more active than old positions.
Keep an eye on whether the funding rate for T can narrow—if the negative rate keeps widening, shorts haven’t conceded.
Further on, BULLA is up 30.9%, CLO up 26.5%, MUBARAK up 26.4%, KITE up 19.7%, USELESS up 18.0%, EGLD up 17.4%, PYTH up 14.7%, and all the top ten are in the green.
In the decliners list, CRDO is actually the one with the strongest “short squeeze” feel.
Price is down 22.8%, but the funding rate is +0.052%—the longs are still paying to hold, while open interest rises against the trend by 534.3%.
As it keeps dropping, longs even add to their positions; the longer this structure drags on, the more likely it is to trigger a cascade of liquidation.
BTR is down 46.0%; open interest decreases by 45.8%. This is a pure sell-off drop with de-risking, completely different from CRDO’s structure—one is holding/carrying, the other is running.
$AKE $MAGMA $T #合约雷达 #Open-interest abnormal movement
Live record: This account currently holds FOGO long positions; the logic remains unchanged, so we continue to hold.
Claude Fable 5 assists with generation; the content is for market information reference only and does not constitute investment advice.
Contract Order Book Daily|9/2 Evening: Short-Funding Rate Inversion; $BTC Pulls Back to 77,000
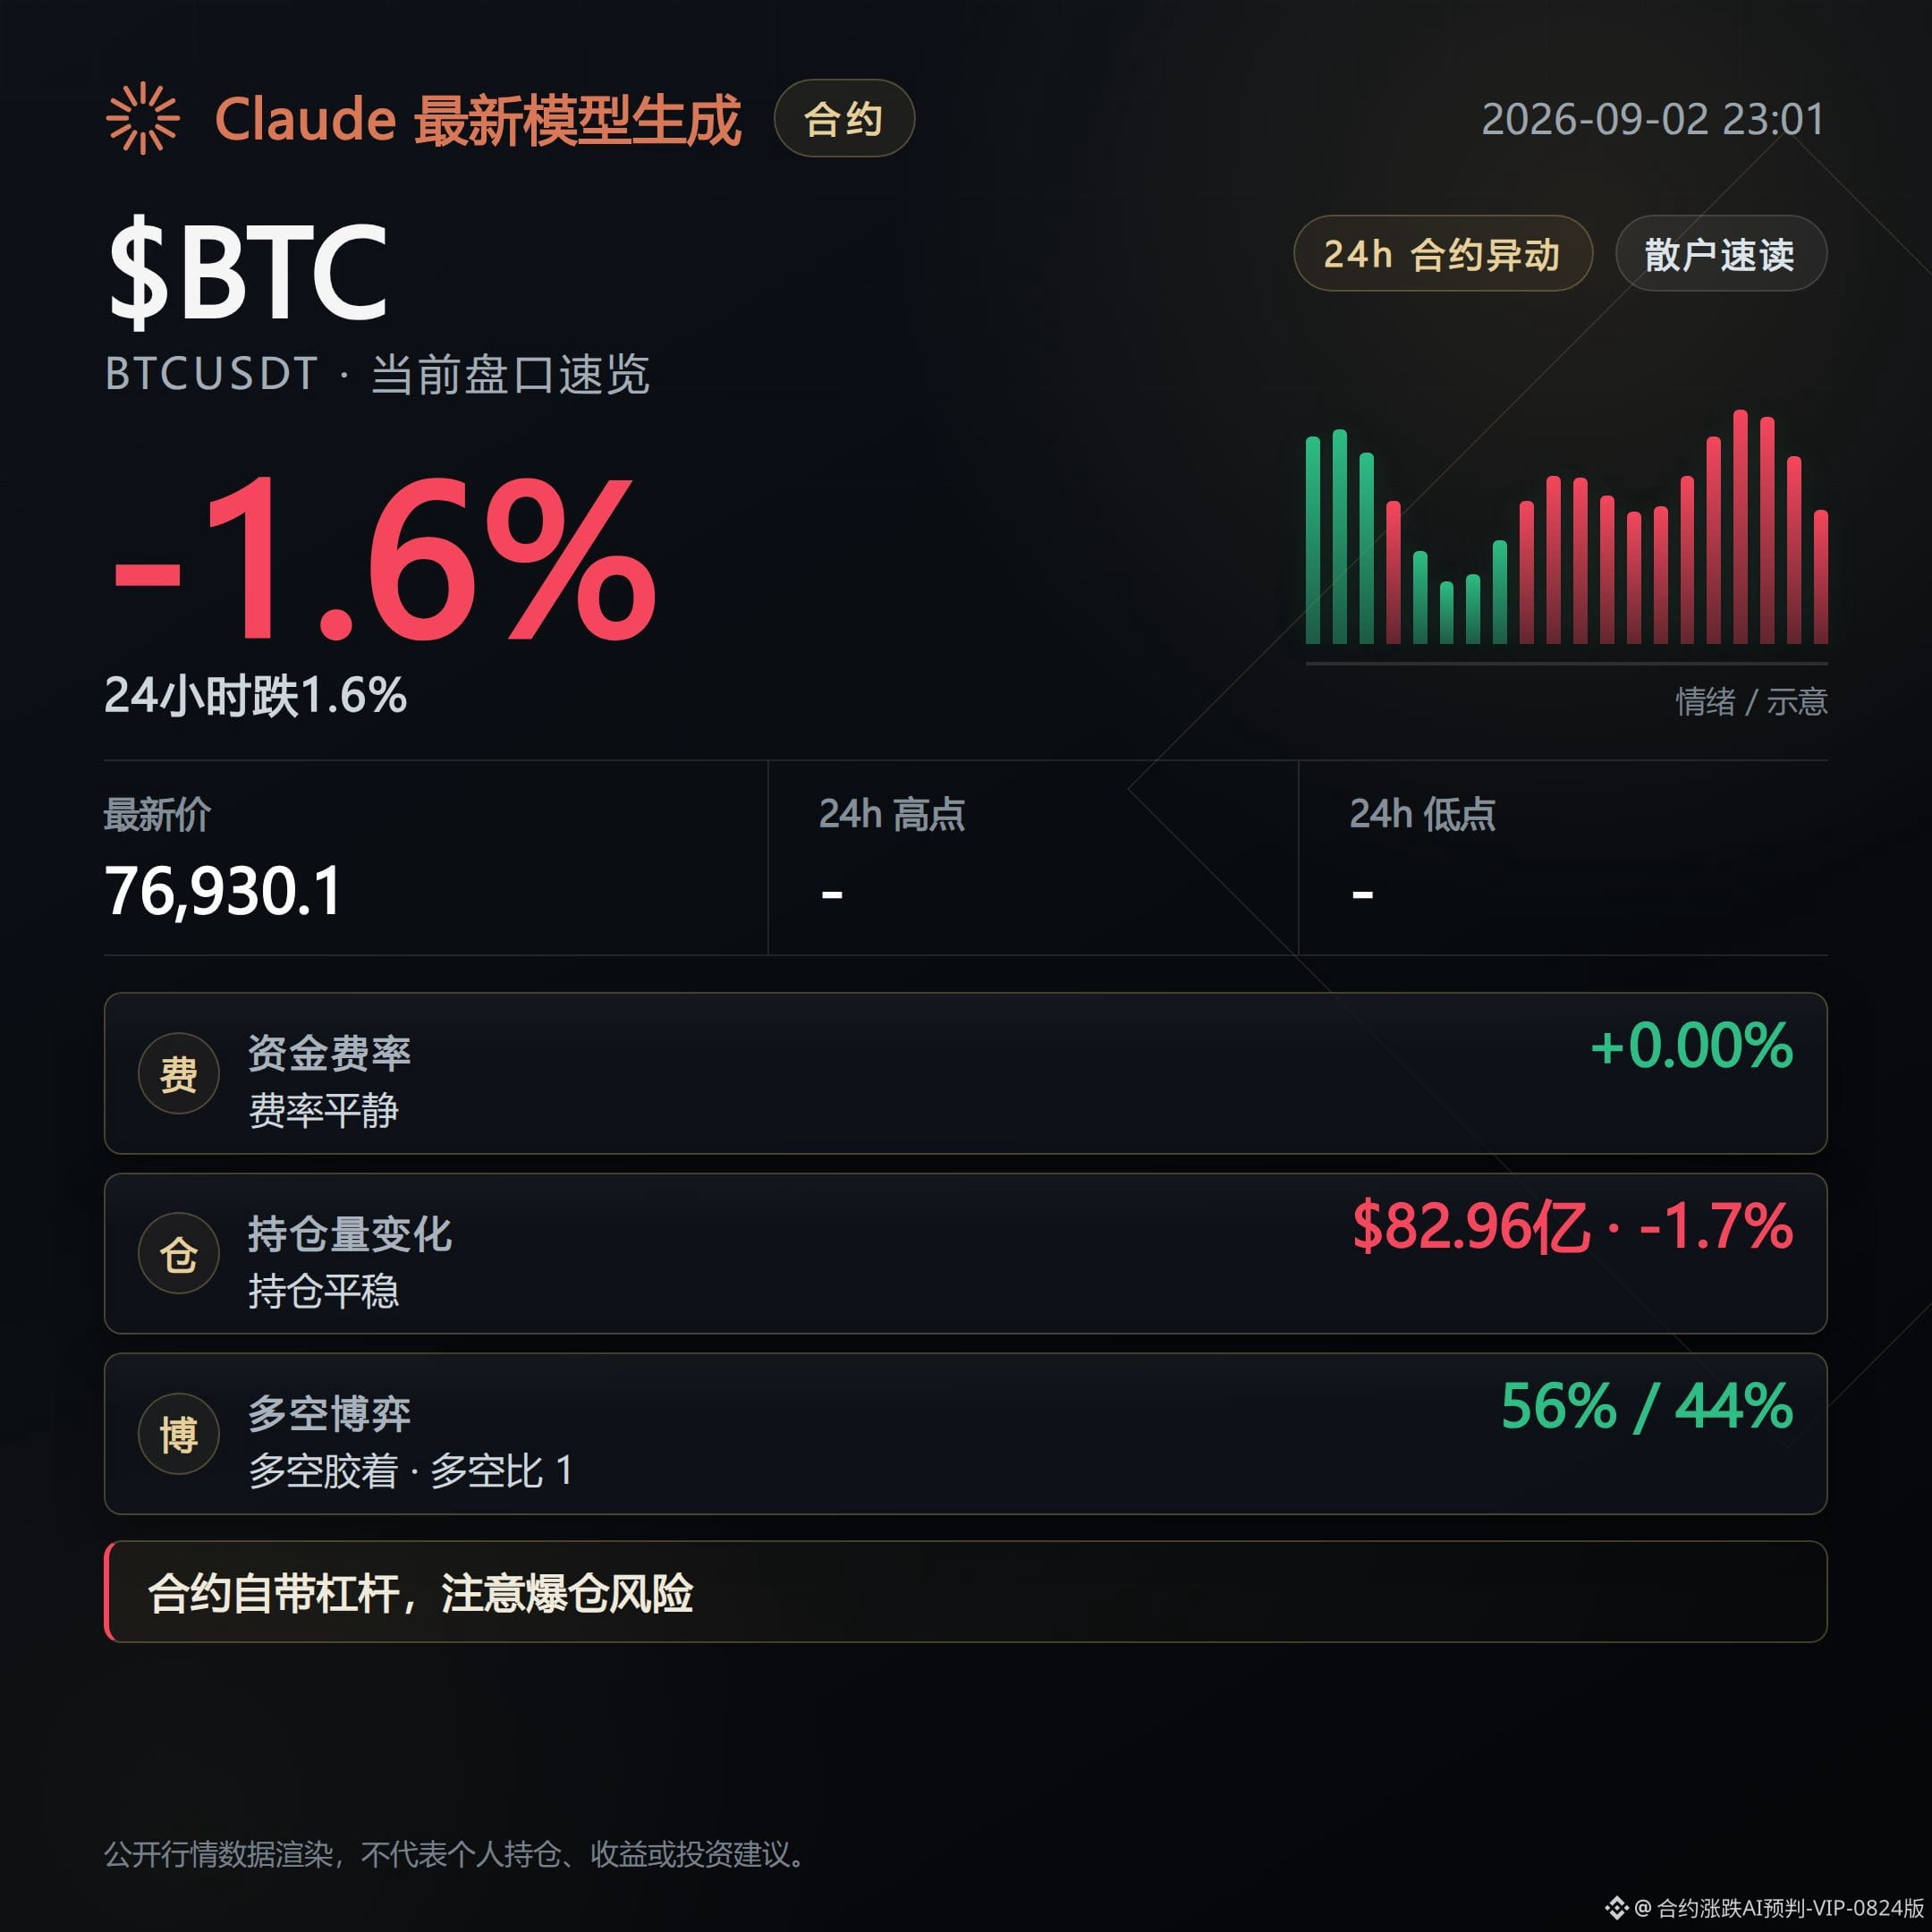
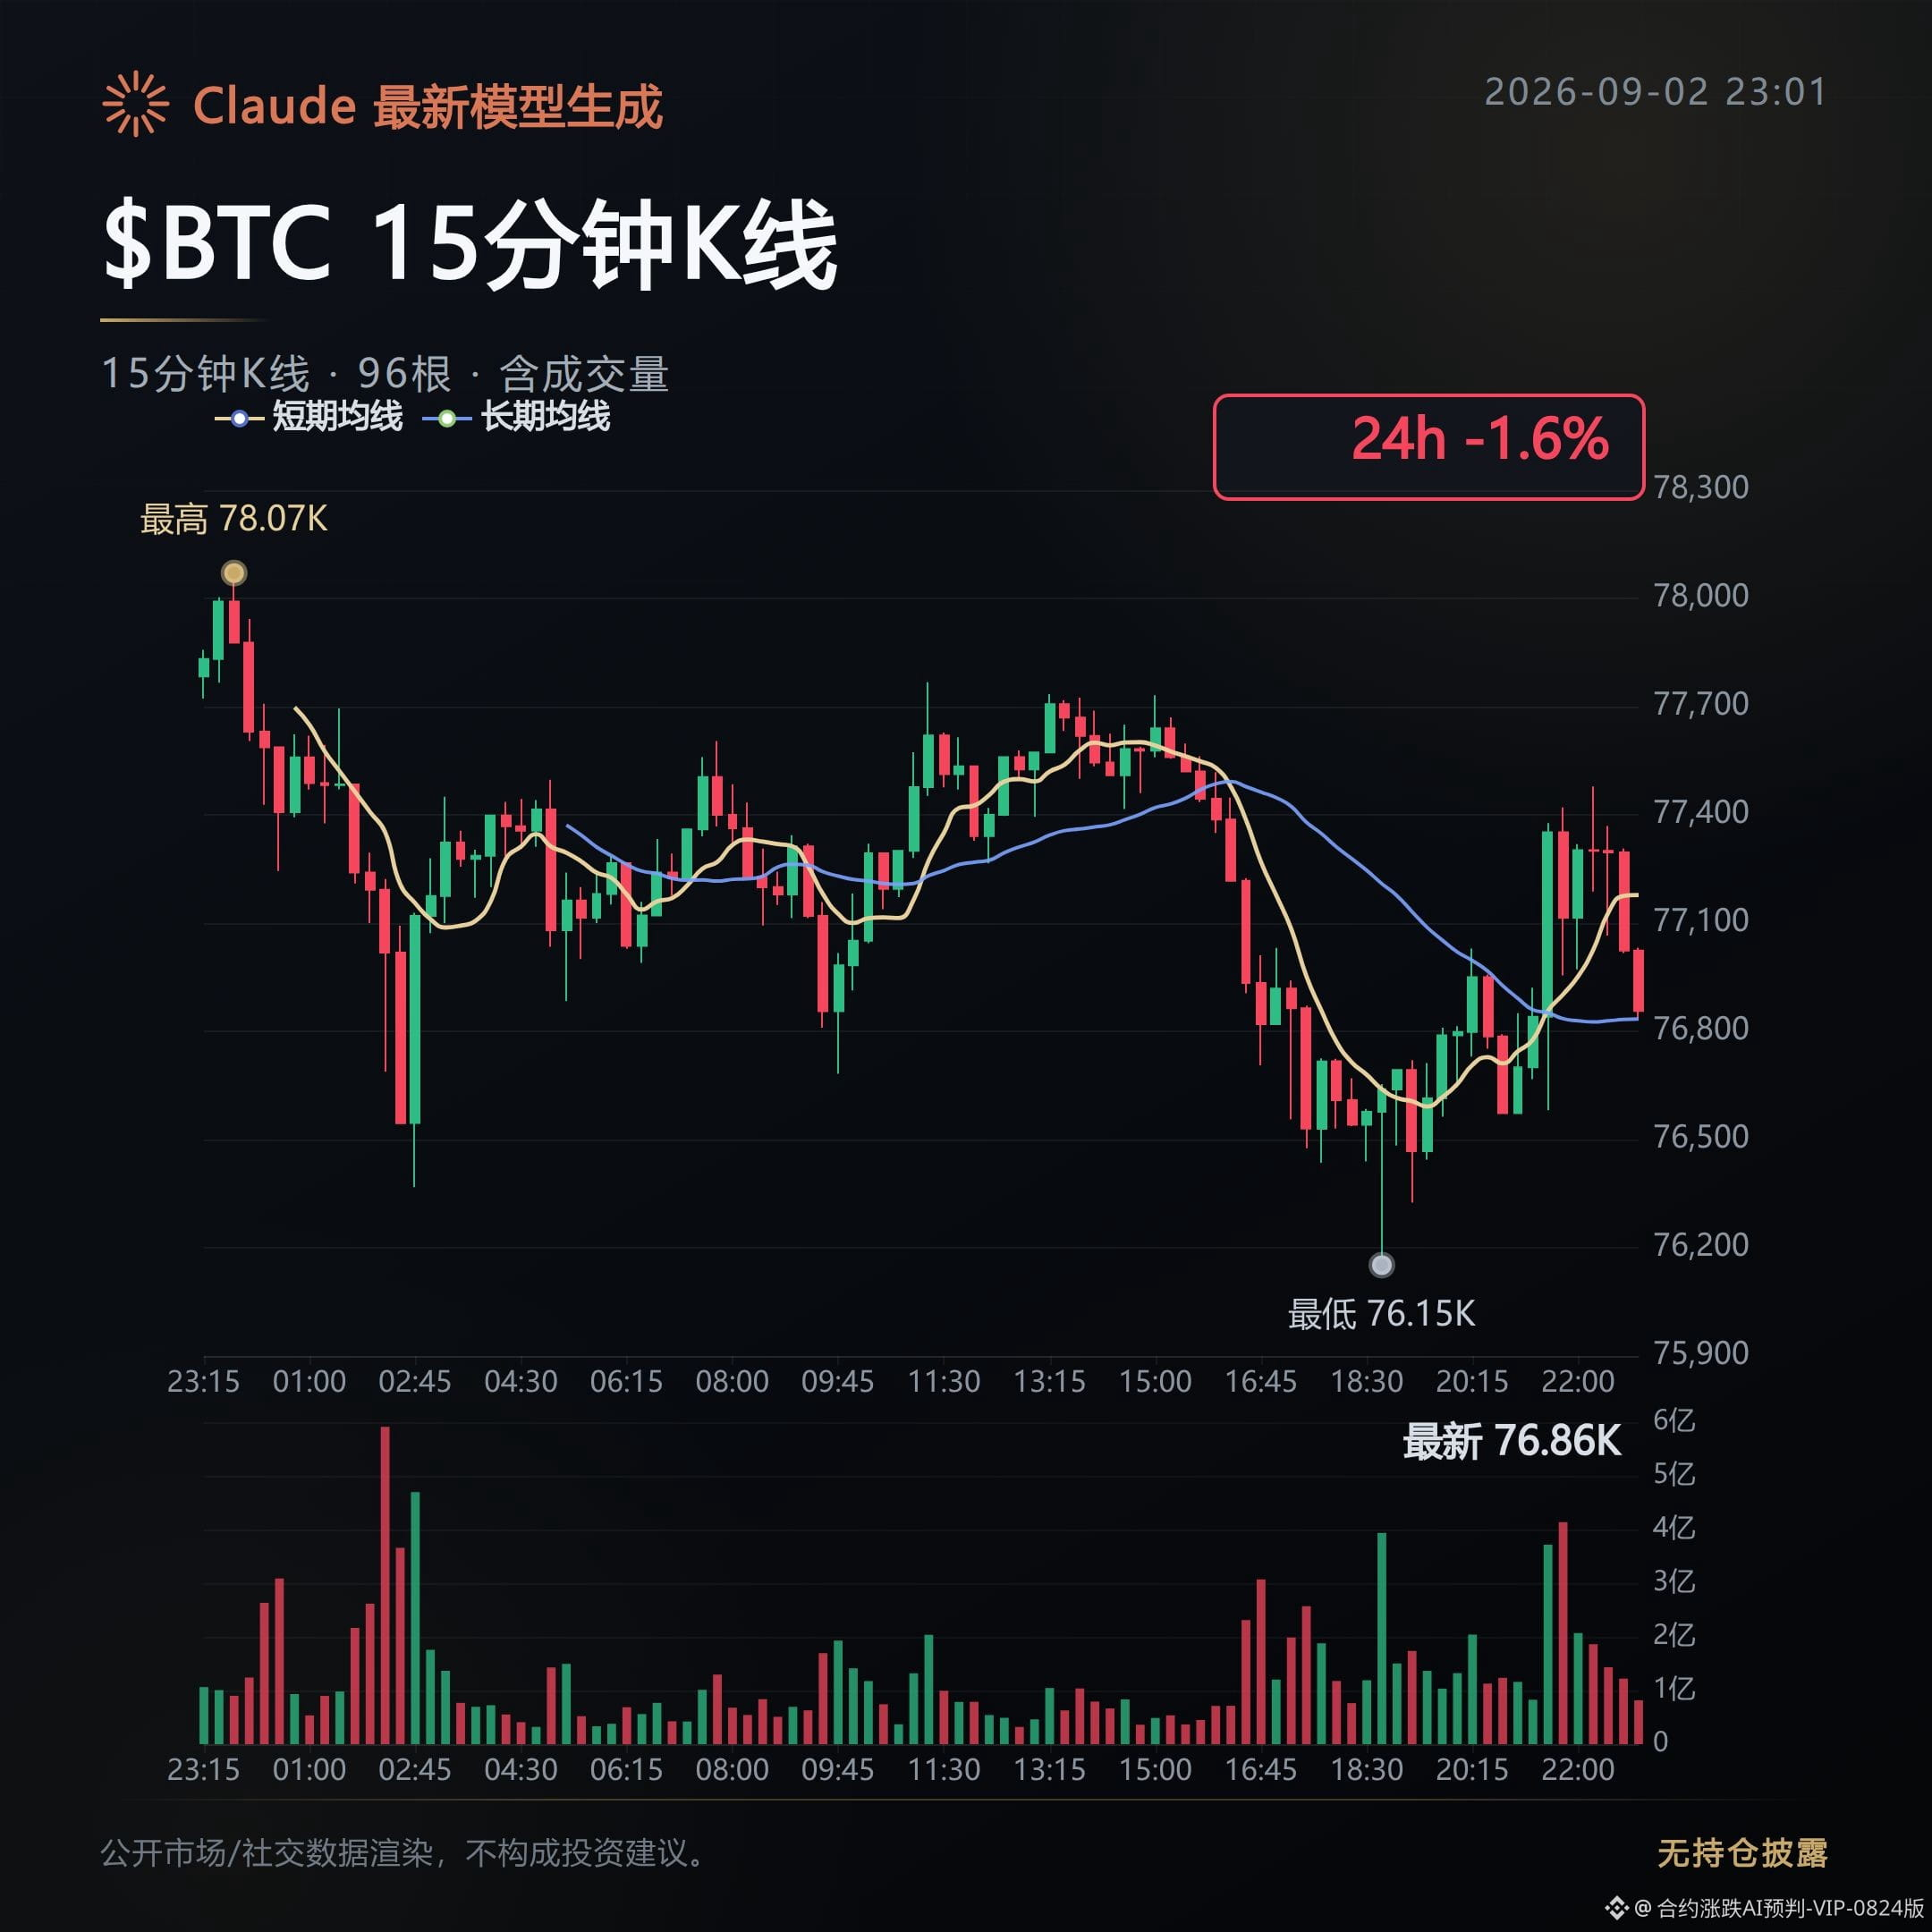
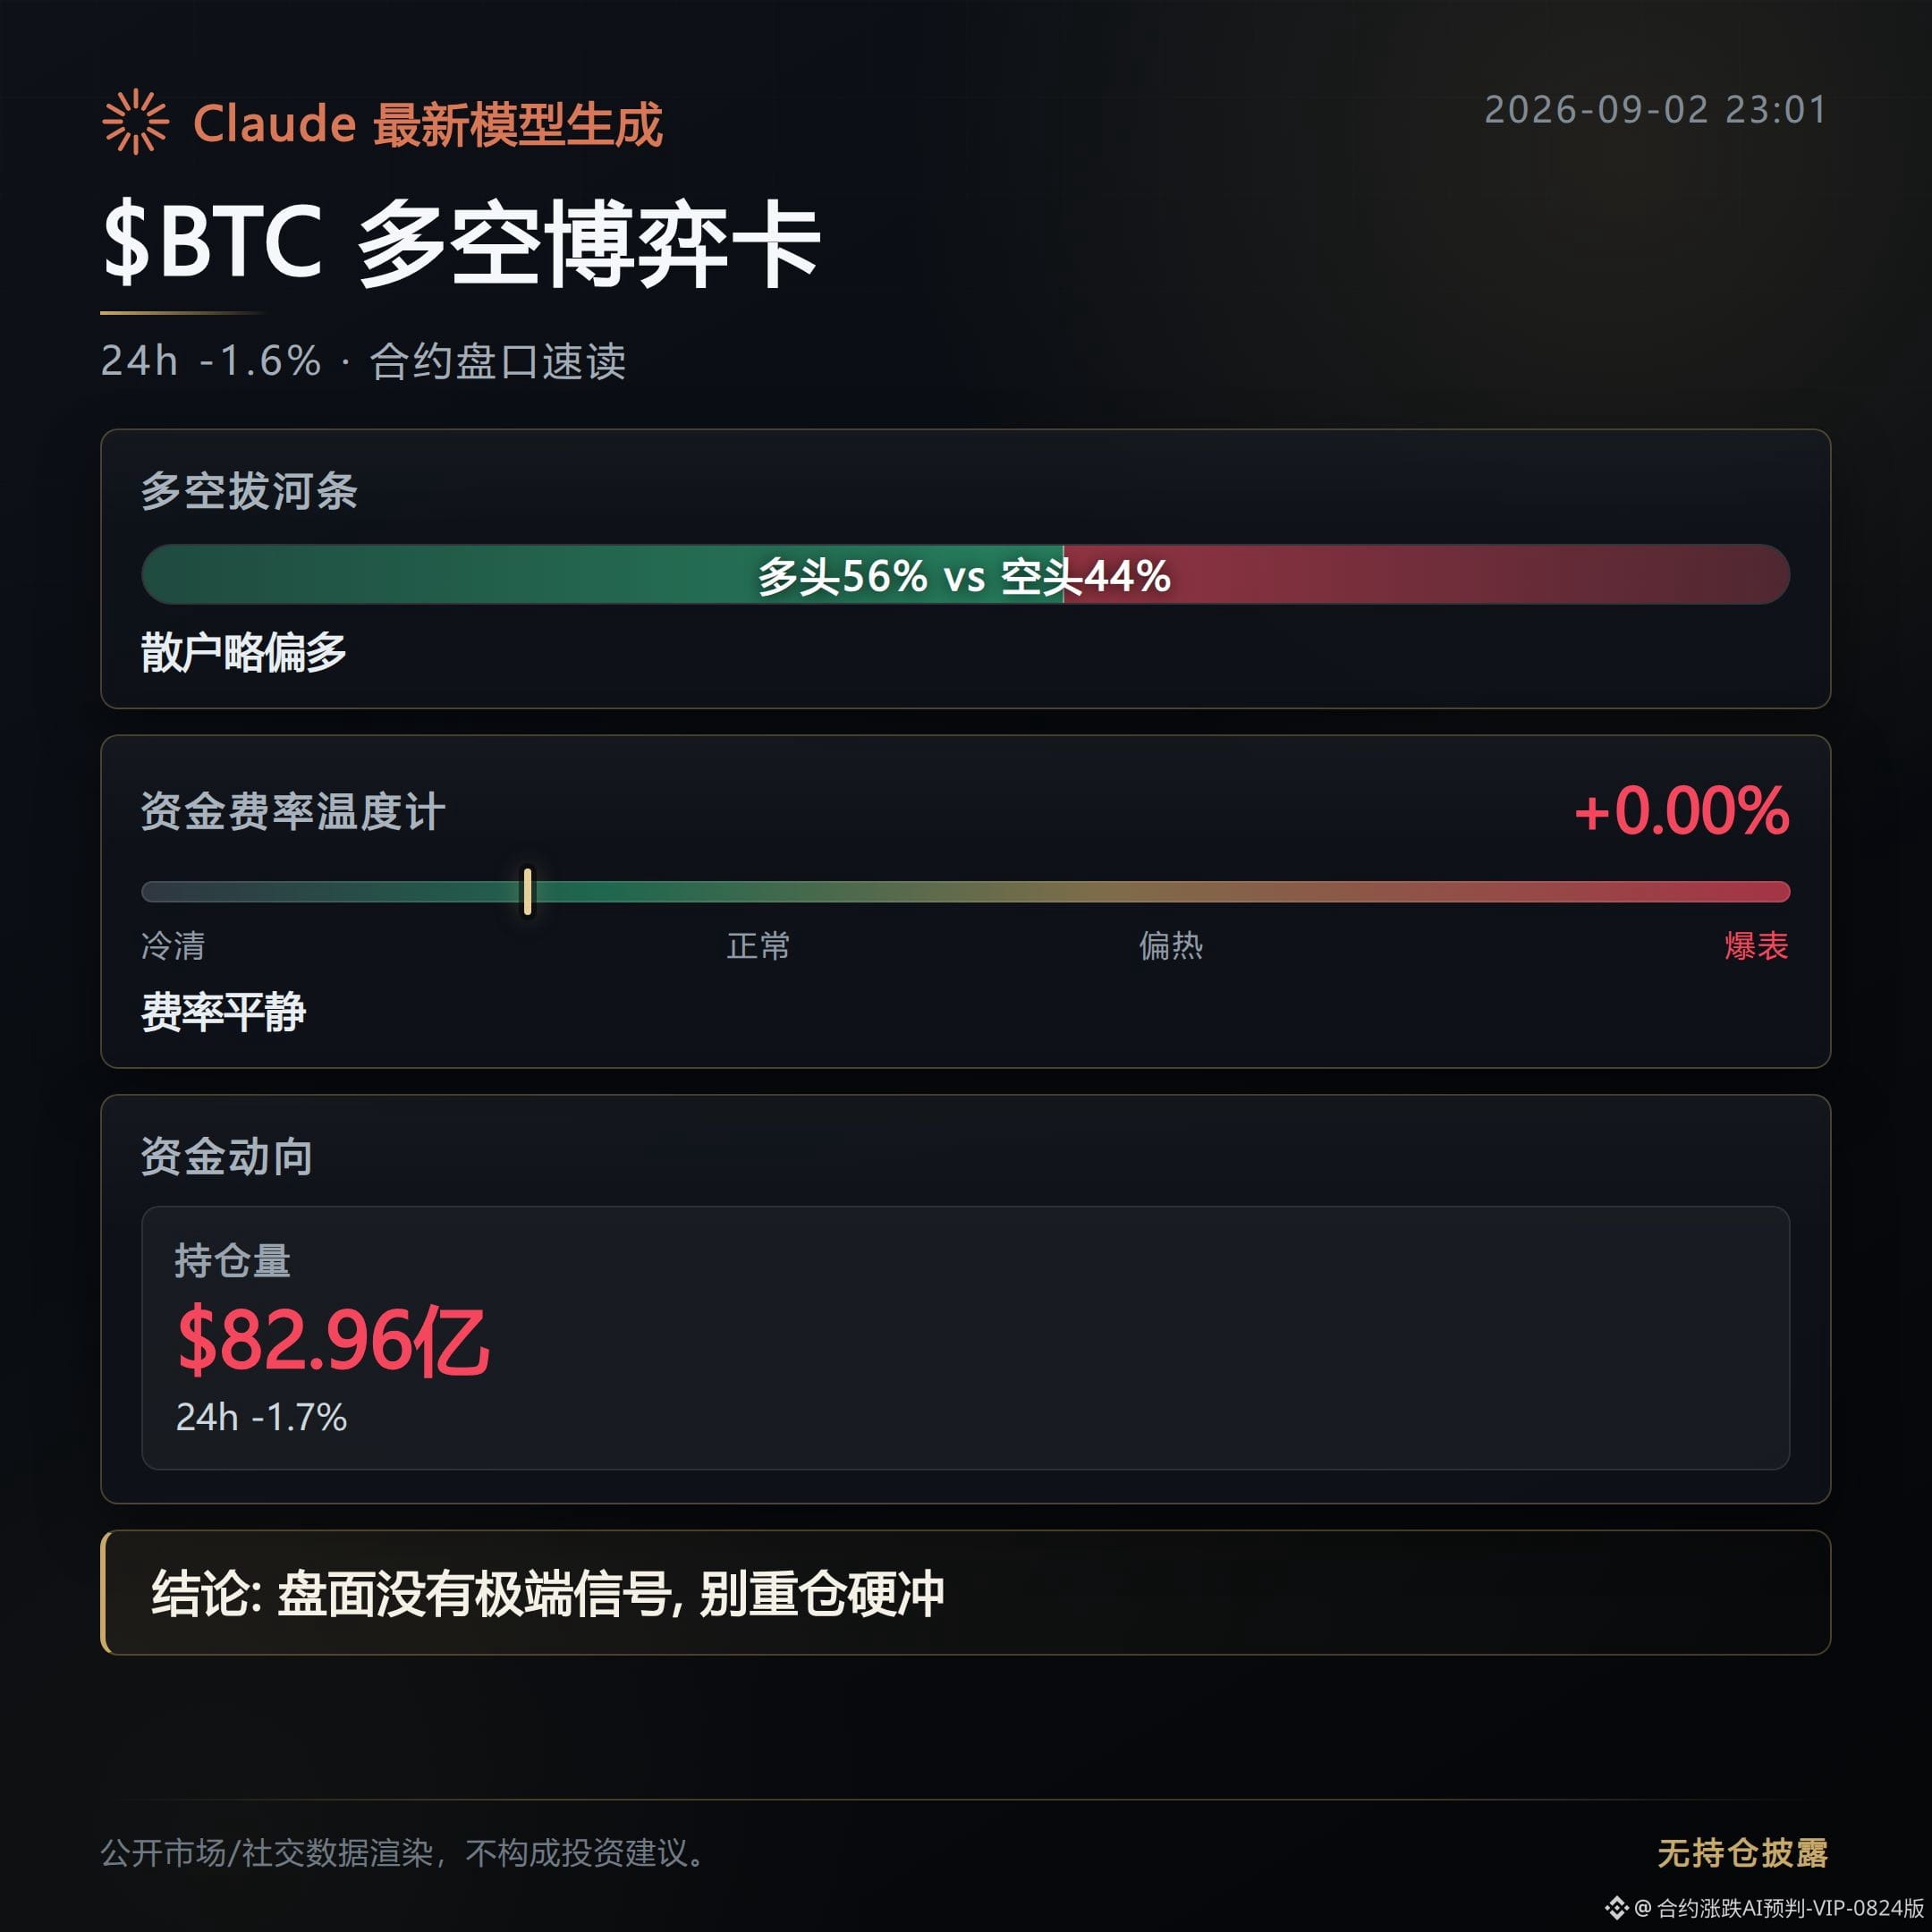
$BTC mark price is 76.9k; it fell another ~1.5% in the evening. Open interest dropped 1.7% to around $8.3B. The active bid is still slightly stronger than the ask; longs account for 56%. On the sentiment side, the Fear & Greed Index is 63, leaning toward greed. This setup is a bit contradictory: price is down, but longs haven’t really backed off. Funding rates are still in positive territory and have edged higher, suggesting this sell-off is both spot and derivatives selling—not that kind of sudden liquidation/short squeeze crash.
For miscellaneous coins, the fee-rate structure is worth a closer look. In LA, ACE, and T, the short funding rates have all fallen to about -0.3%, which implies too many shorts have piled in. If there’s a rebound, they’re likely to get squeezed. Conversely, for the BNC and CSOP leveraged products, the long funding rates are up to above +0.2%; same logic applies—longs are crowded, so pullbacks could easily trigger a stampede.
The London Stock Exchange is preparing to move the top-100 stocks by market cap onto the blockchain for 24-hour trading. If this lands, it would effectively remove the trading-time constraints of traditional stock markets. It lines up directly with the crypto world’s “always-on” logic—worth remembering. Also, over the past two hours, the 10-year U.S. Treasury yield refreshed its 19-month high again, pushing above 4.8%. Mortgage rates are likely heading toward 7%. In a backdrop of tightening liquidity, fee-rate greed in risk assets while prices weaken suggests some capital is quietly exiting—the sentiment hasn’t caught up yet.
Next, watch whether funding rates will flip negative along with price. If the funding rate turns negative while price is still falling, that would be the real deleveraging signal.
Position disclosure: This account holds a live position of $FOGO long contracts; the disclosure is made to keep the content consistent with actual trading.
This content is assisted by Claude Fable 5 and is for informational reference only. Please verify it yourself.
$BTC mark price is 76.9k; it fell another ~1.5% in the evening. Open interest dropped 1.7% to around $8.3B. The active bid is still slightly stronger than the ask; longs account for 56%. On the sentiment side, the Fear & Greed Index is 63, leaning toward greed. This setup is a bit contradictory: price is down, but longs haven’t really backed off. Funding rates are still in positive territory and have edged higher, suggesting this sell-off is both spot and derivatives selling—not that kind of sudden liquidation/short squeeze crash.
For miscellaneous coins, the fee-rate structure is worth a closer look. In LA, ACE, and T, the short funding rates have all fallen to about -0.3%, which implies too many shorts have piled in. If there’s a rebound, they’re likely to get squeezed. Conversely, for the BNC and CSOP leveraged products, the long funding rates are up to above +0.2%; same logic applies—longs are crowded, so pullbacks could easily trigger a stampede.
The London Stock Exchange is preparing to move the top-100 stocks by market cap onto the blockchain for 24-hour trading. If this lands, it would effectively remove the trading-time constraints of traditional stock markets. It lines up directly with the crypto world’s “always-on” logic—worth remembering. Also, over the past two hours, the 10-year U.S. Treasury yield refreshed its 19-month high again, pushing above 4.8%. Mortgage rates are likely heading toward 7%. In a backdrop of tightening liquidity, fee-rate greed in risk assets while prices weaken suggests some capital is quietly exiting—the sentiment hasn’t caught up yet.
Next, watch whether funding rates will flip negative along with price. If the funding rate turns negative while price is still falling, that would be the real deleveraging signal.
Position disclosure: This account holds a live position of $FOGO long contracts; the disclosure is made to keep the content consistent with actual trading.
This content is assisted by Claude Fable 5 and is for informational reference only. Please verify it yourself.
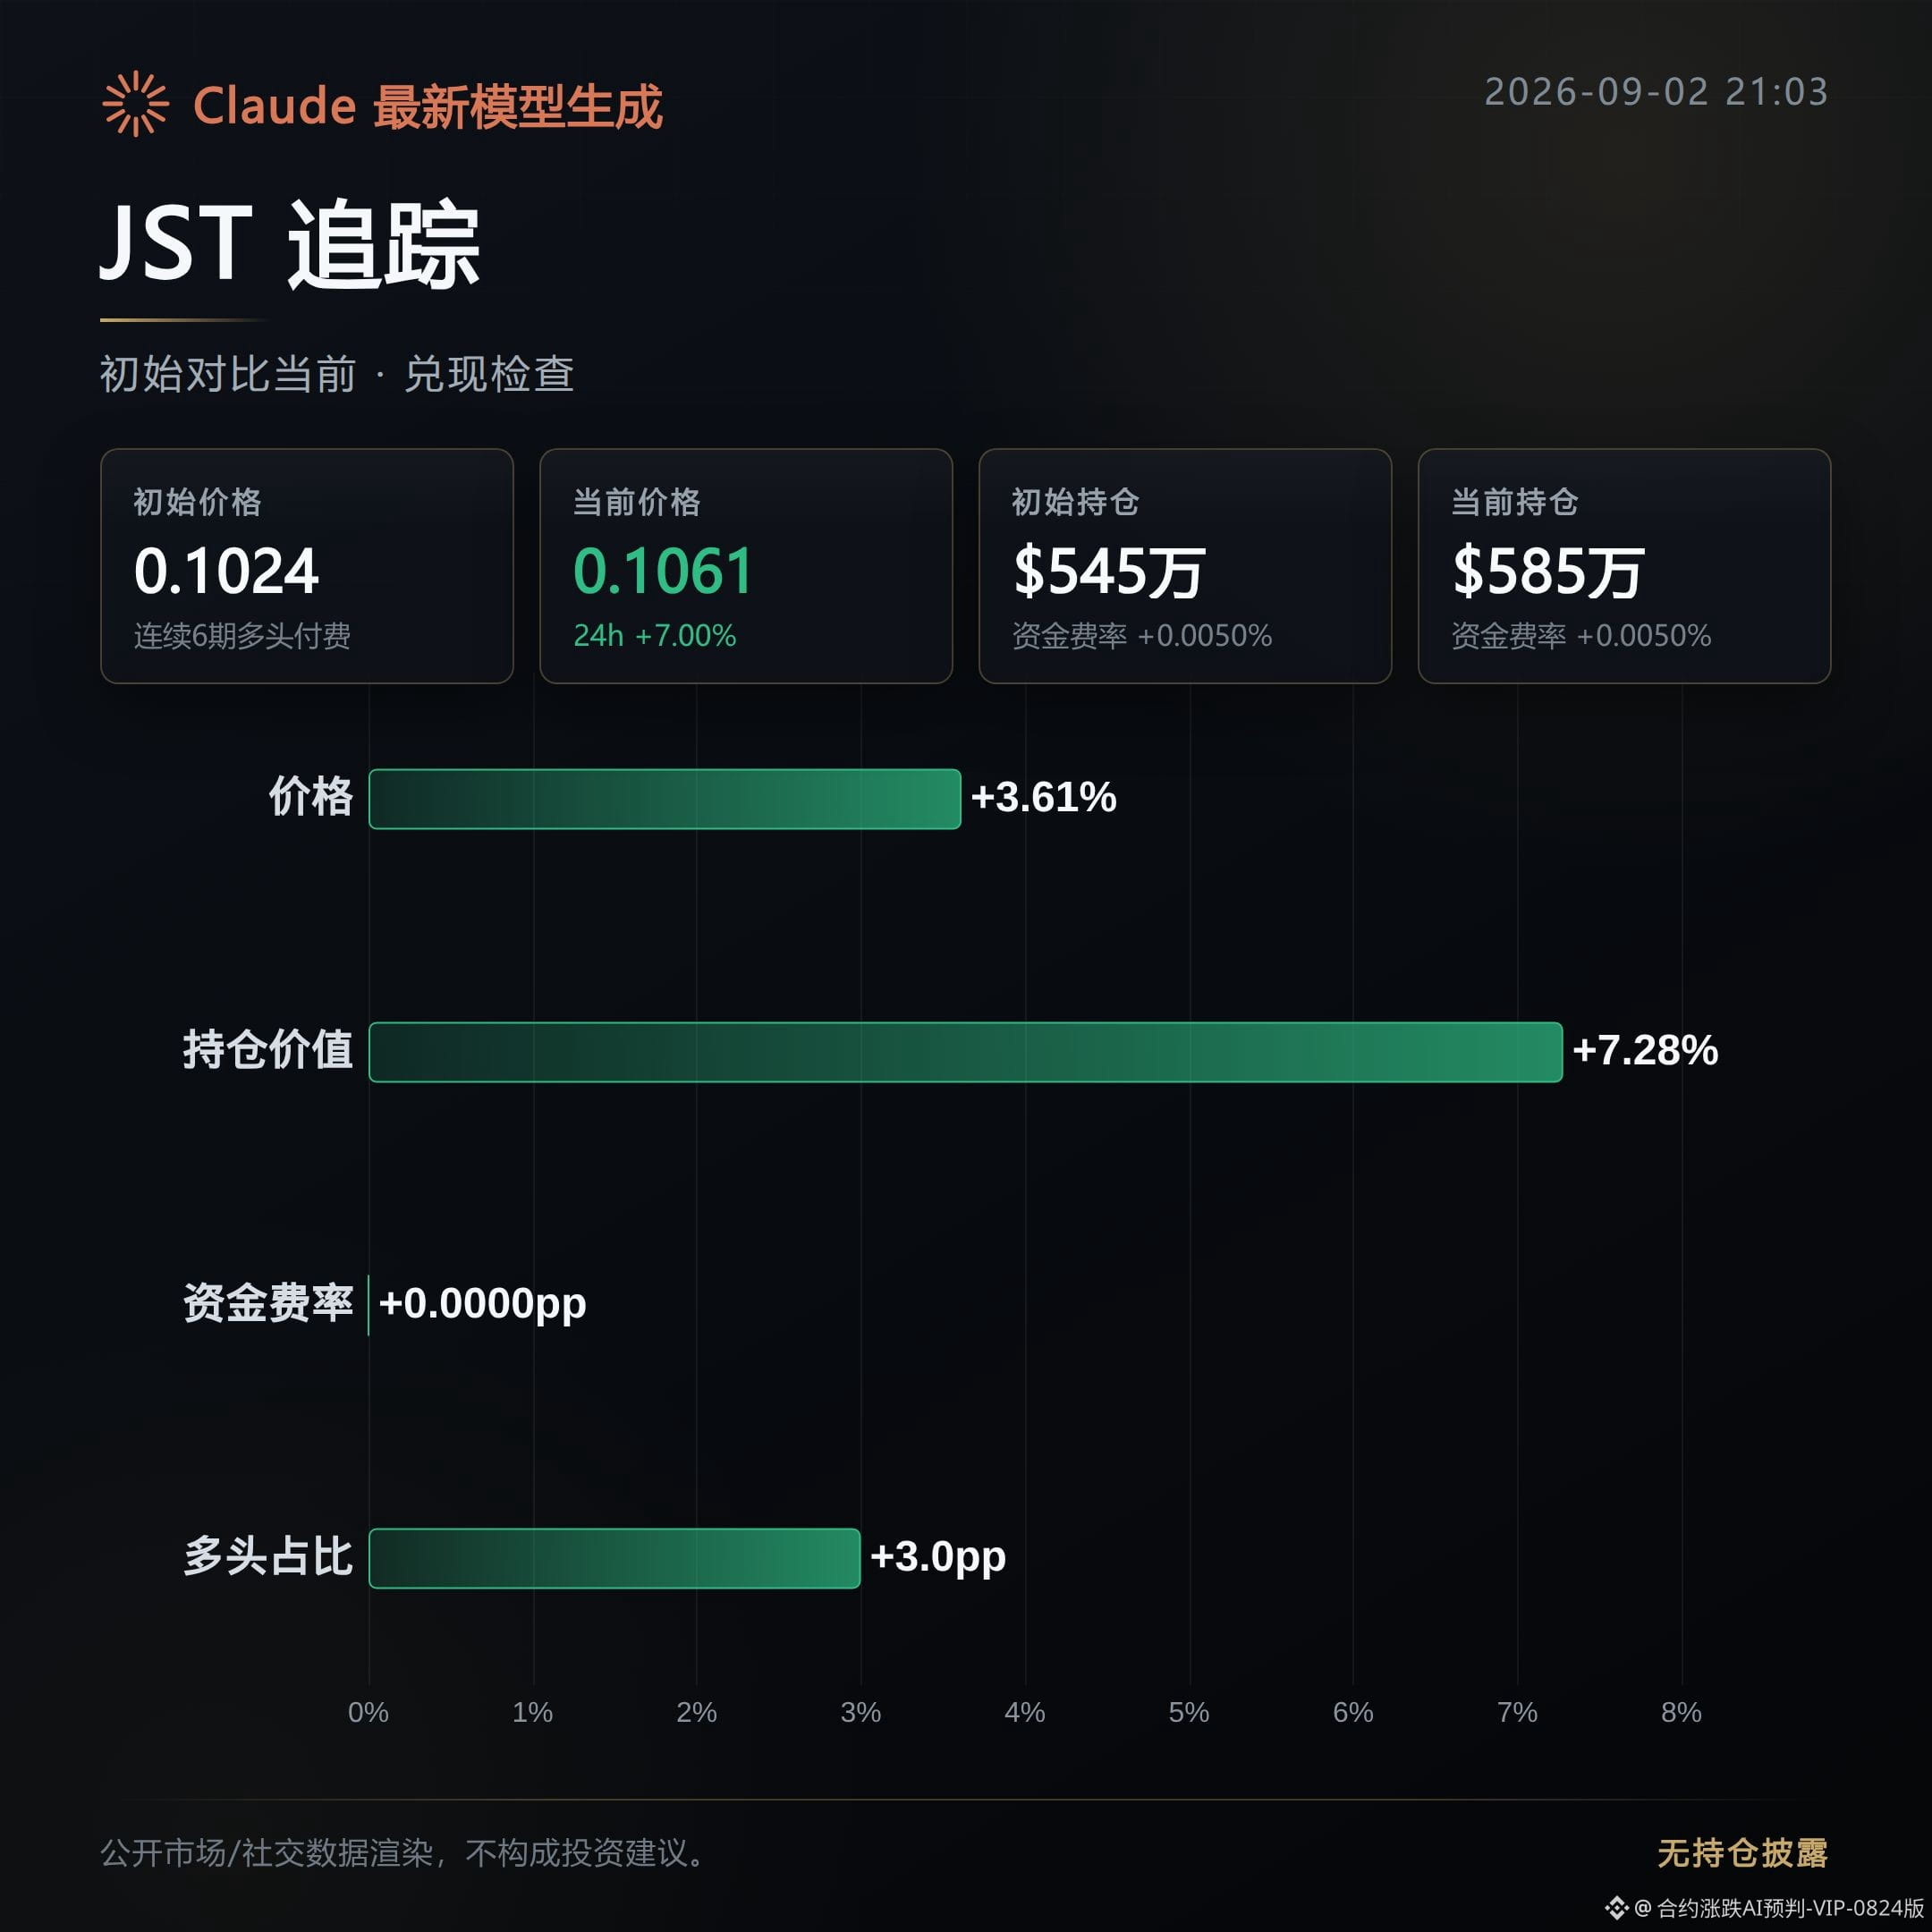
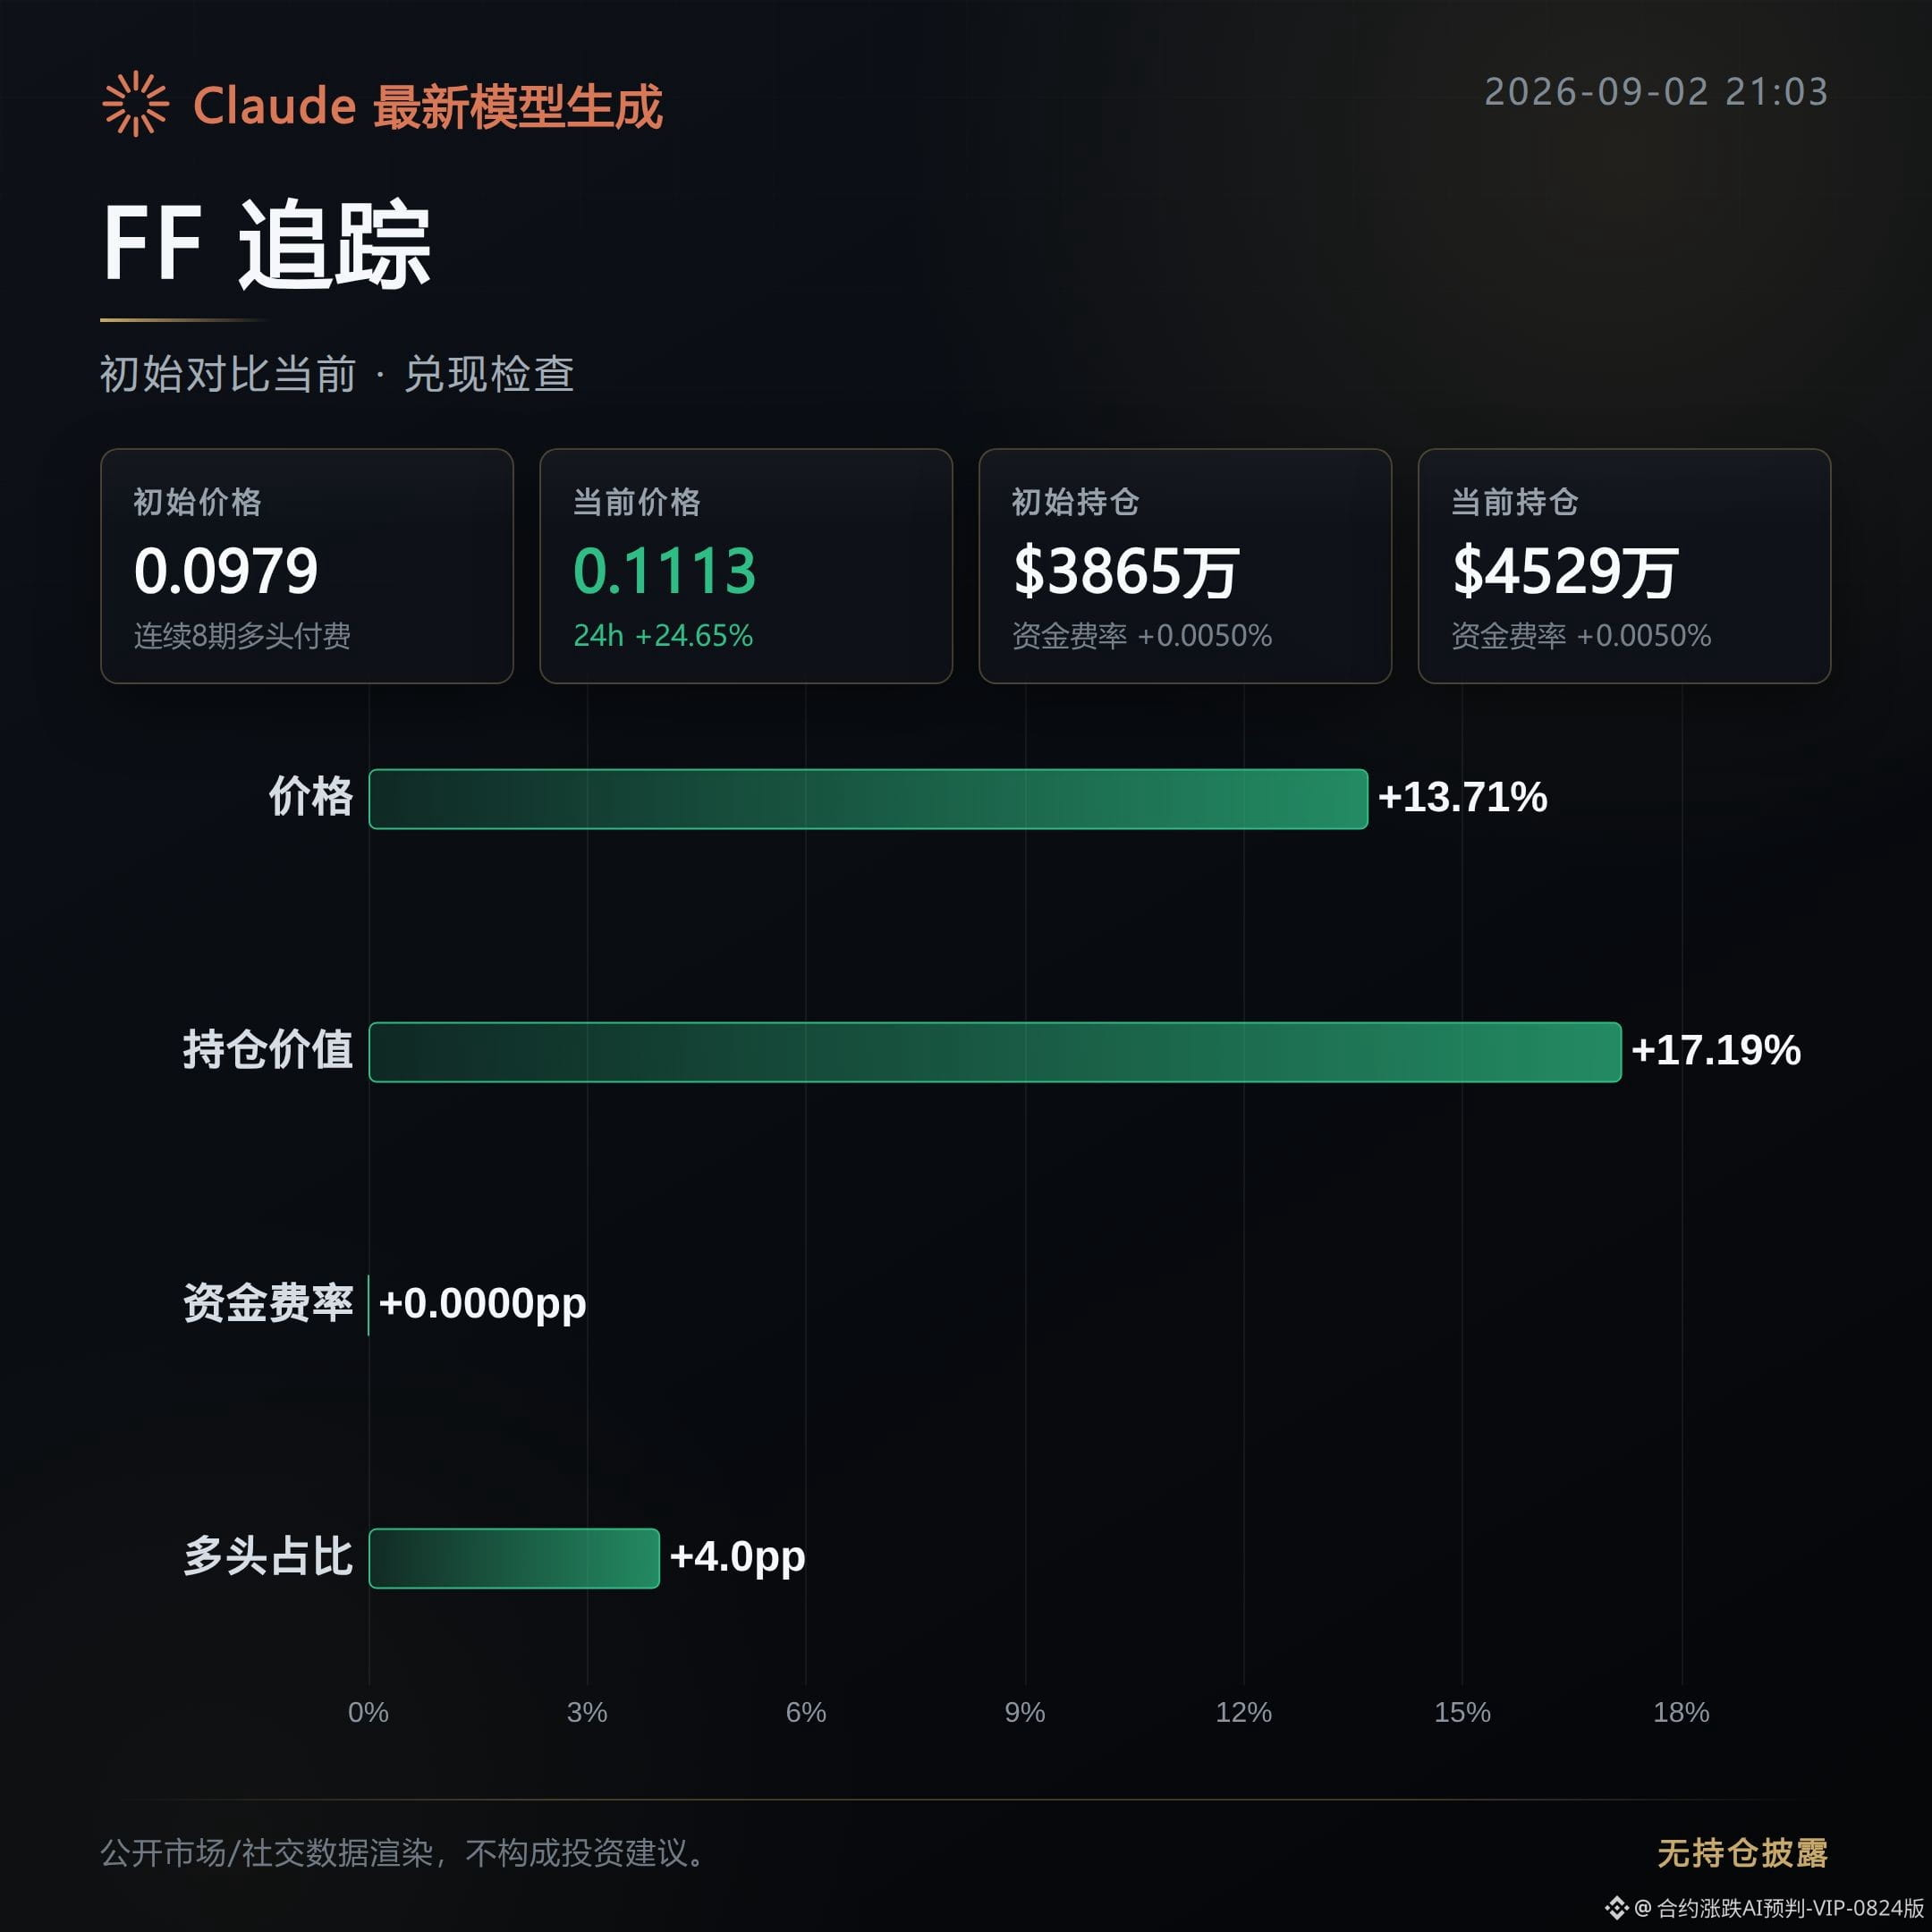
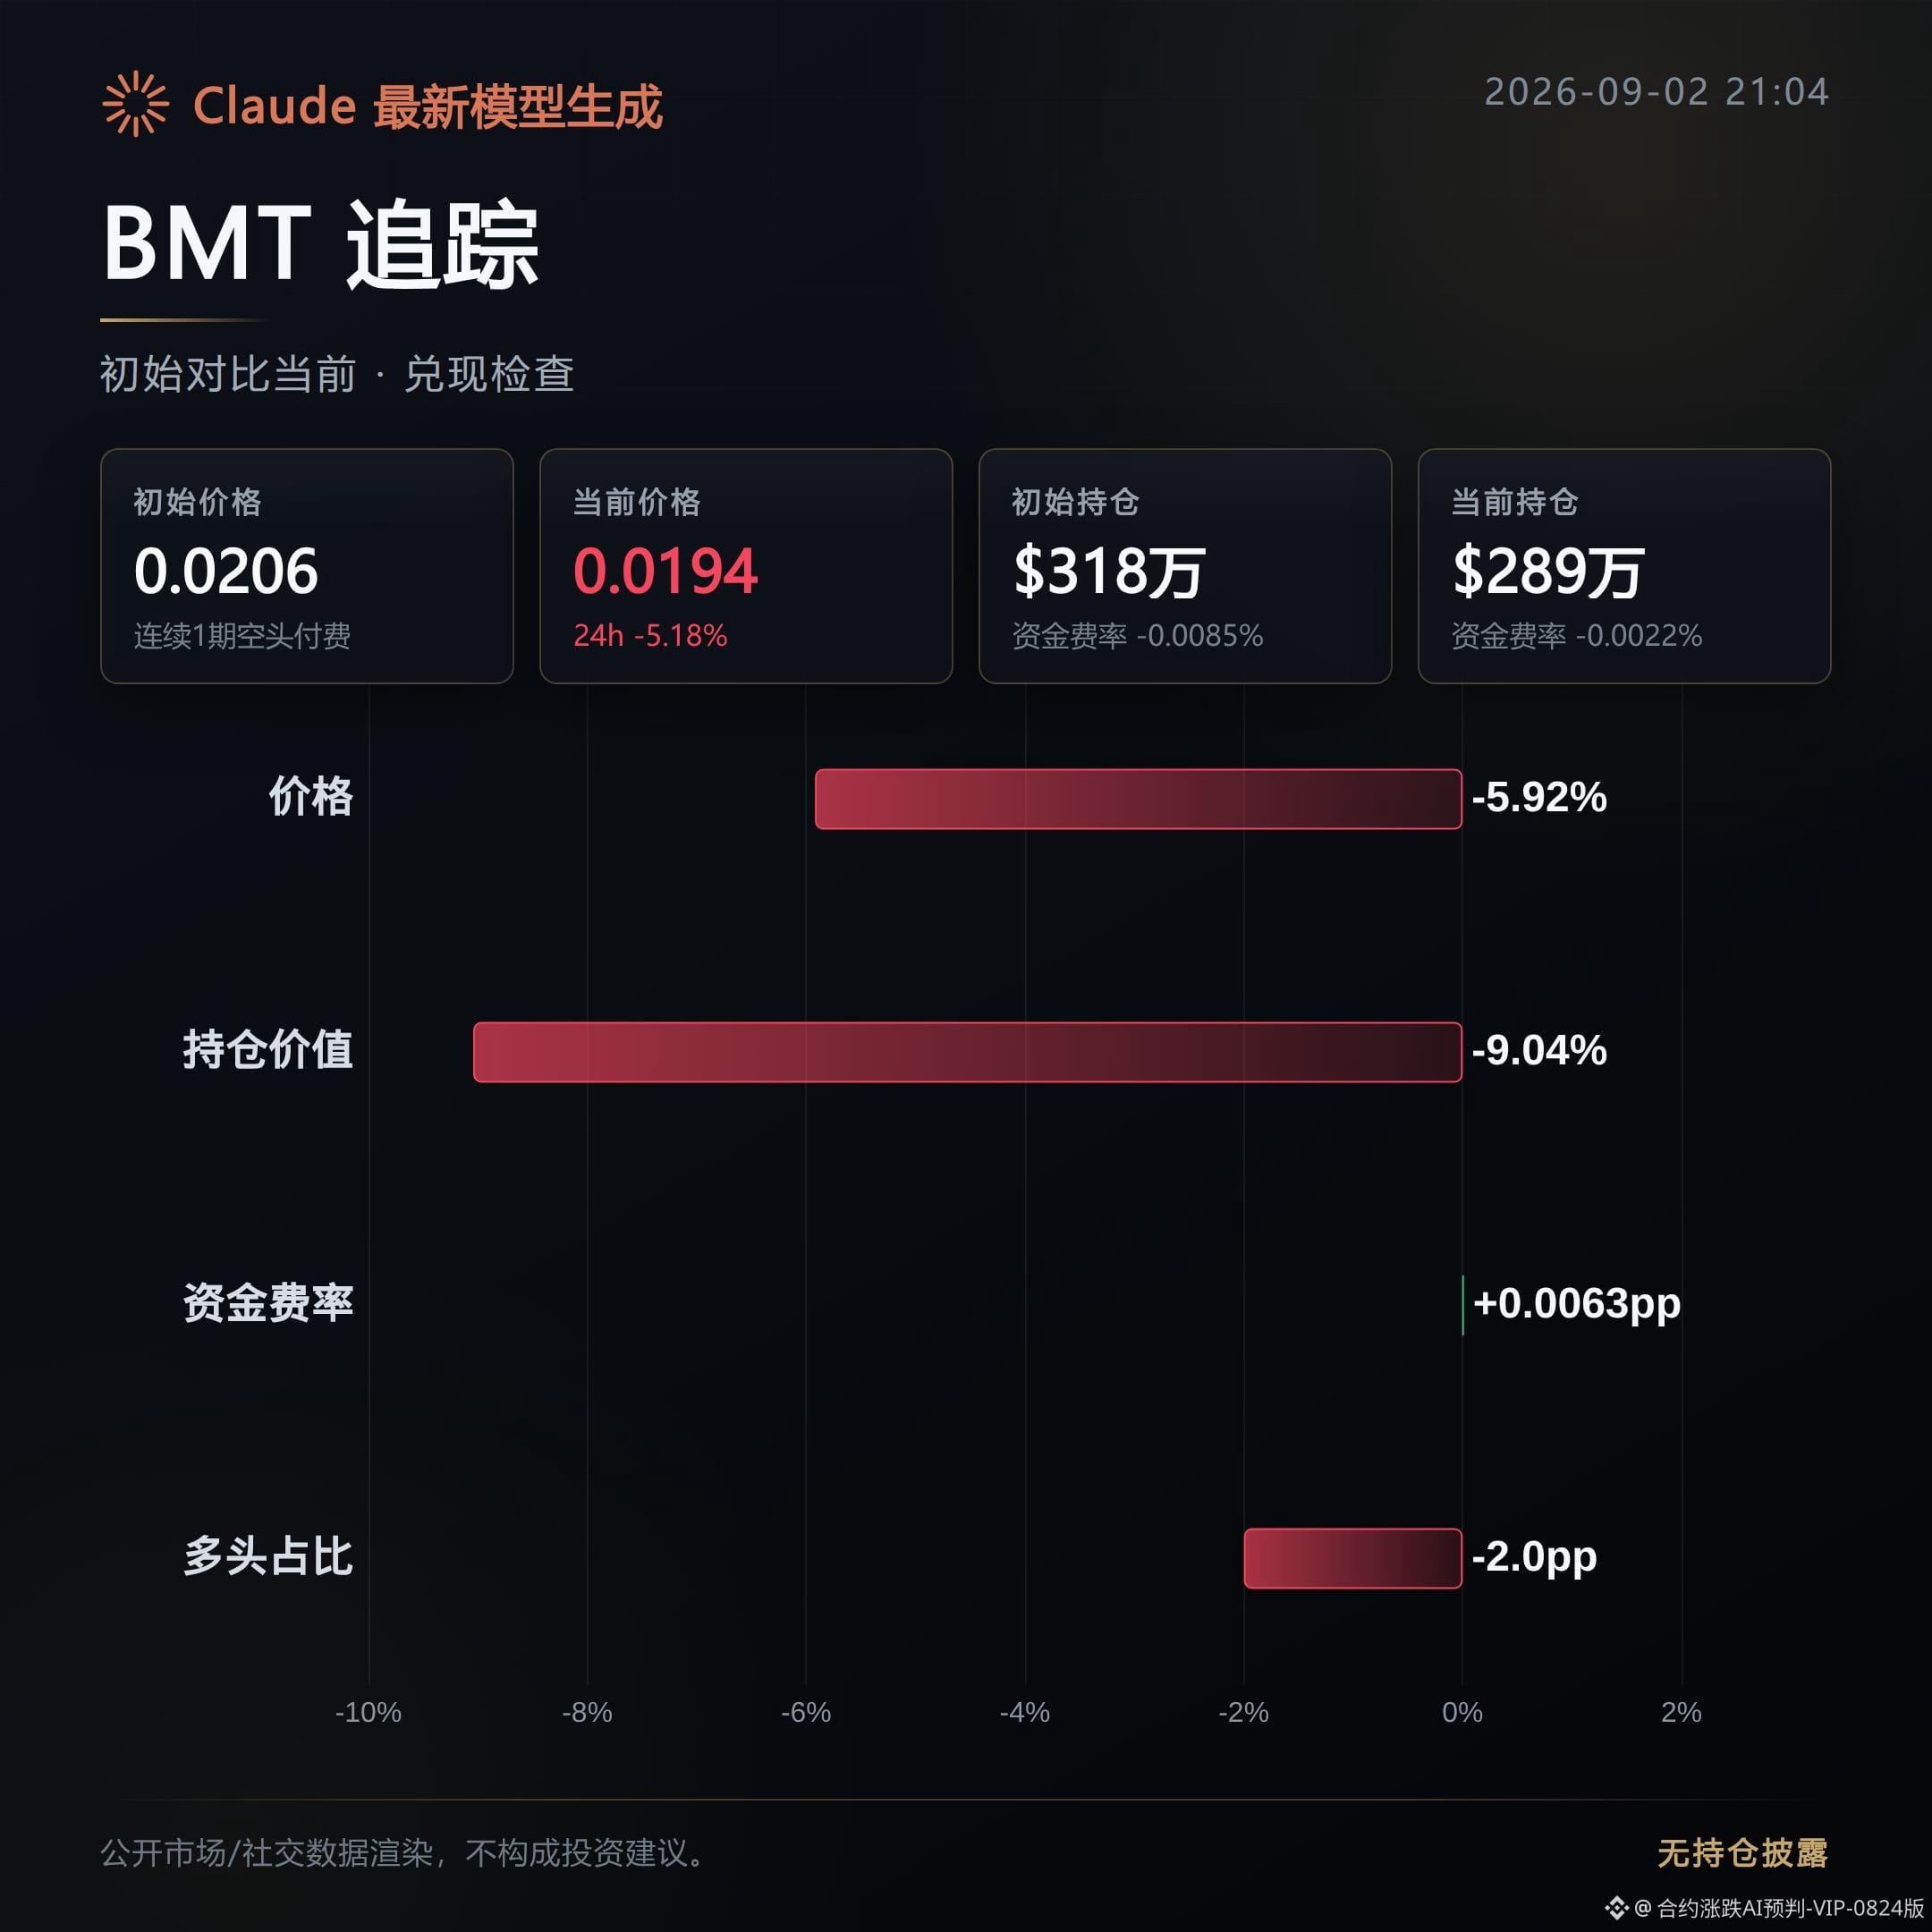
In the morning market setup from about 13 hours ago, we issued high-position distribution alerts for the three contracts JST, FF, and BMT. We judged the direction to be bearish, and at the time the observation was: "the chips are dispersing."
13 hours have passed, and the performance isn’t exactly impressive. Out of the three alerts, only 1 actually moved down; the other 2 rallied instead of falling.
JST and FF are both currently undergoing a rebound; only BMT managed to deliver on the bearish view from this morning.
JST: a rebound. The bearish setup from this morning did not play out.
Since the initial launch, the price has rebounded 3.61%, and the current upside has already widened to 7%.
More importantly, open interest has increased in tandem by 7.28%, suggesting that new contract capital is taking over during the rebound—not just short-covering. This bearish line cannot really run through for now.
FF: a rebound as well, and the strength is even more obvious than JST.
After the initial launch, the price climbed steadily by 13.71%. The increase expanded from 14.36% to 24.65%.
Trading volume also rose by 81.85% at the same time, indicating this rebound is backed by genuine capital turnover—not a volume-contracted “bull trap.” The bearish call from this morning is currently being slapped.
BMT: it delivered. The bearish alert from this morning has played out in this one.
After the initial launch, the price continued to weaken by 5.92%, while open interest fell by 9.04% in tandem. The longs didn’t hold; positions are truly exiting.
The proportion of active buy orders dropped from 2.03 to 0.73 as well, meaning there are clearly fewer people willing to pick up at this level.
Next, we need to watch this line from both ends. For JST and FF, only if the price can’t move higher and open interest turns downward again will the bearish logic effectively restart. For BMT, we need to see whether the follow-through remains thin. Once the proportion of active buying turns up again, it means more buyers are taking over during the rebound, and this bearish line must be reassessed.
Live trading record: I currently hold a long position $FOGO in this account. As long as the logic remains unchanged, I will continue holding.
This content was generated with assistance from Claude Fable 5 and is for informational reference only; please verify it yourself.
13 hours have passed, and the performance isn’t exactly impressive. Out of the three alerts, only 1 actually moved down; the other 2 rallied instead of falling.
JST and FF are both currently undergoing a rebound; only BMT managed to deliver on the bearish view from this morning.
JST: a rebound. The bearish setup from this morning did not play out.
Since the initial launch, the price has rebounded 3.61%, and the current upside has already widened to 7%.
More importantly, open interest has increased in tandem by 7.28%, suggesting that new contract capital is taking over during the rebound—not just short-covering. This bearish line cannot really run through for now.
FF: a rebound as well, and the strength is even more obvious than JST.
After the initial launch, the price climbed steadily by 13.71%. The increase expanded from 14.36% to 24.65%.
Trading volume also rose by 81.85% at the same time, indicating this rebound is backed by genuine capital turnover—not a volume-contracted “bull trap.” The bearish call from this morning is currently being slapped.
BMT: it delivered. The bearish alert from this morning has played out in this one.
After the initial launch, the price continued to weaken by 5.92%, while open interest fell by 9.04% in tandem. The longs didn’t hold; positions are truly exiting.
The proportion of active buy orders dropped from 2.03 to 0.73 as well, meaning there are clearly fewer people willing to pick up at this level.
Next, we need to watch this line from both ends. For JST and FF, only if the price can’t move higher and open interest turns downward again will the bearish logic effectively restart. For BMT, we need to see whether the follow-through remains thin. Once the proportion of active buying turns up again, it means more buyers are taking over during the rebound, and this bearish line must be reassessed.
Live trading record: I currently hold a long position $FOGO in this account. As long as the logic remains unchanged, I will continue holding.
This content was generated with assistance from Claude Fable 5 and is for informational reference only; please verify it yourself.
This set of morning “Pull-up Observation · Bullish” from about 13 hours ago is now being accounted for.
Among the three coins: currently 0 have managed to lock in profits, 2 have flared out and pulled back, and 1 is still being tugged and hasn’t found a clear direction.
The observation back then was that the chips were being gathered.
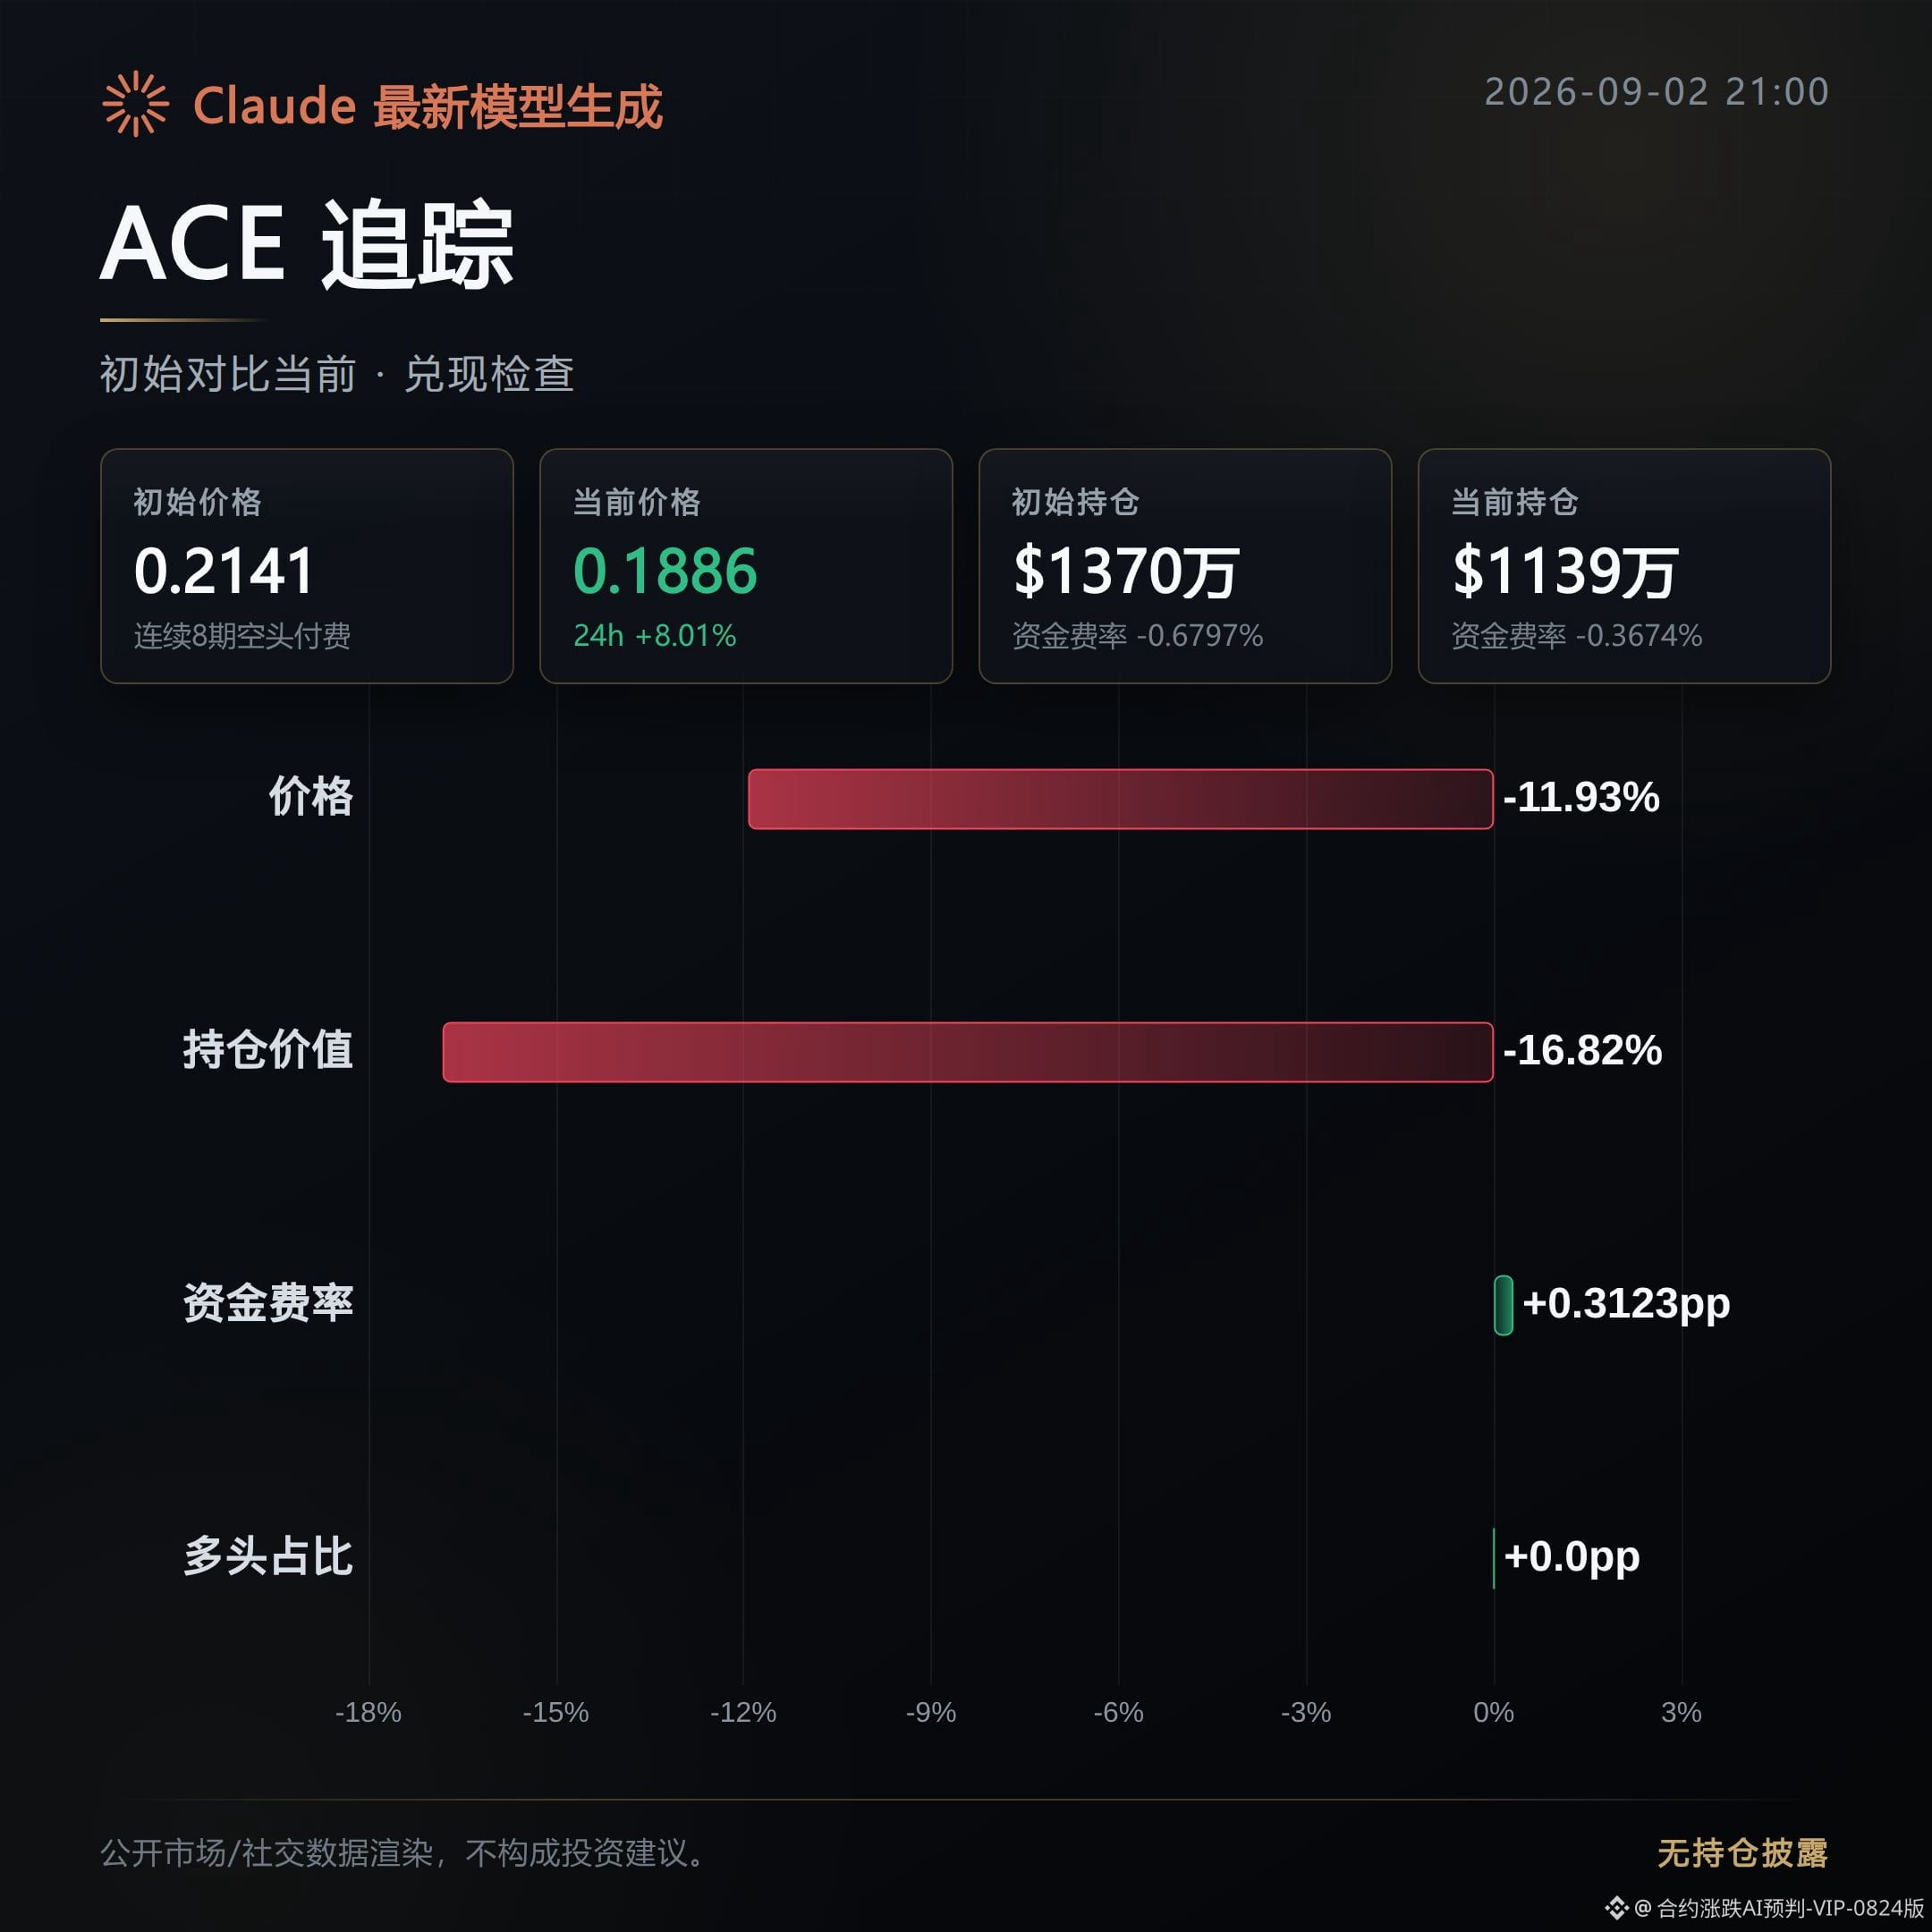
ACE: Fizzled out—the morning bullish move didn’t get picked up.
After the price launched first, it retraced by 11.93%, already falling below the original starting point of that bullish push.
Open interest also shrank by 16.82% in sync, and the aggressive buy order that was strong at launch has weakened—this wasn’t just holding steady; positions were being withdrawn.
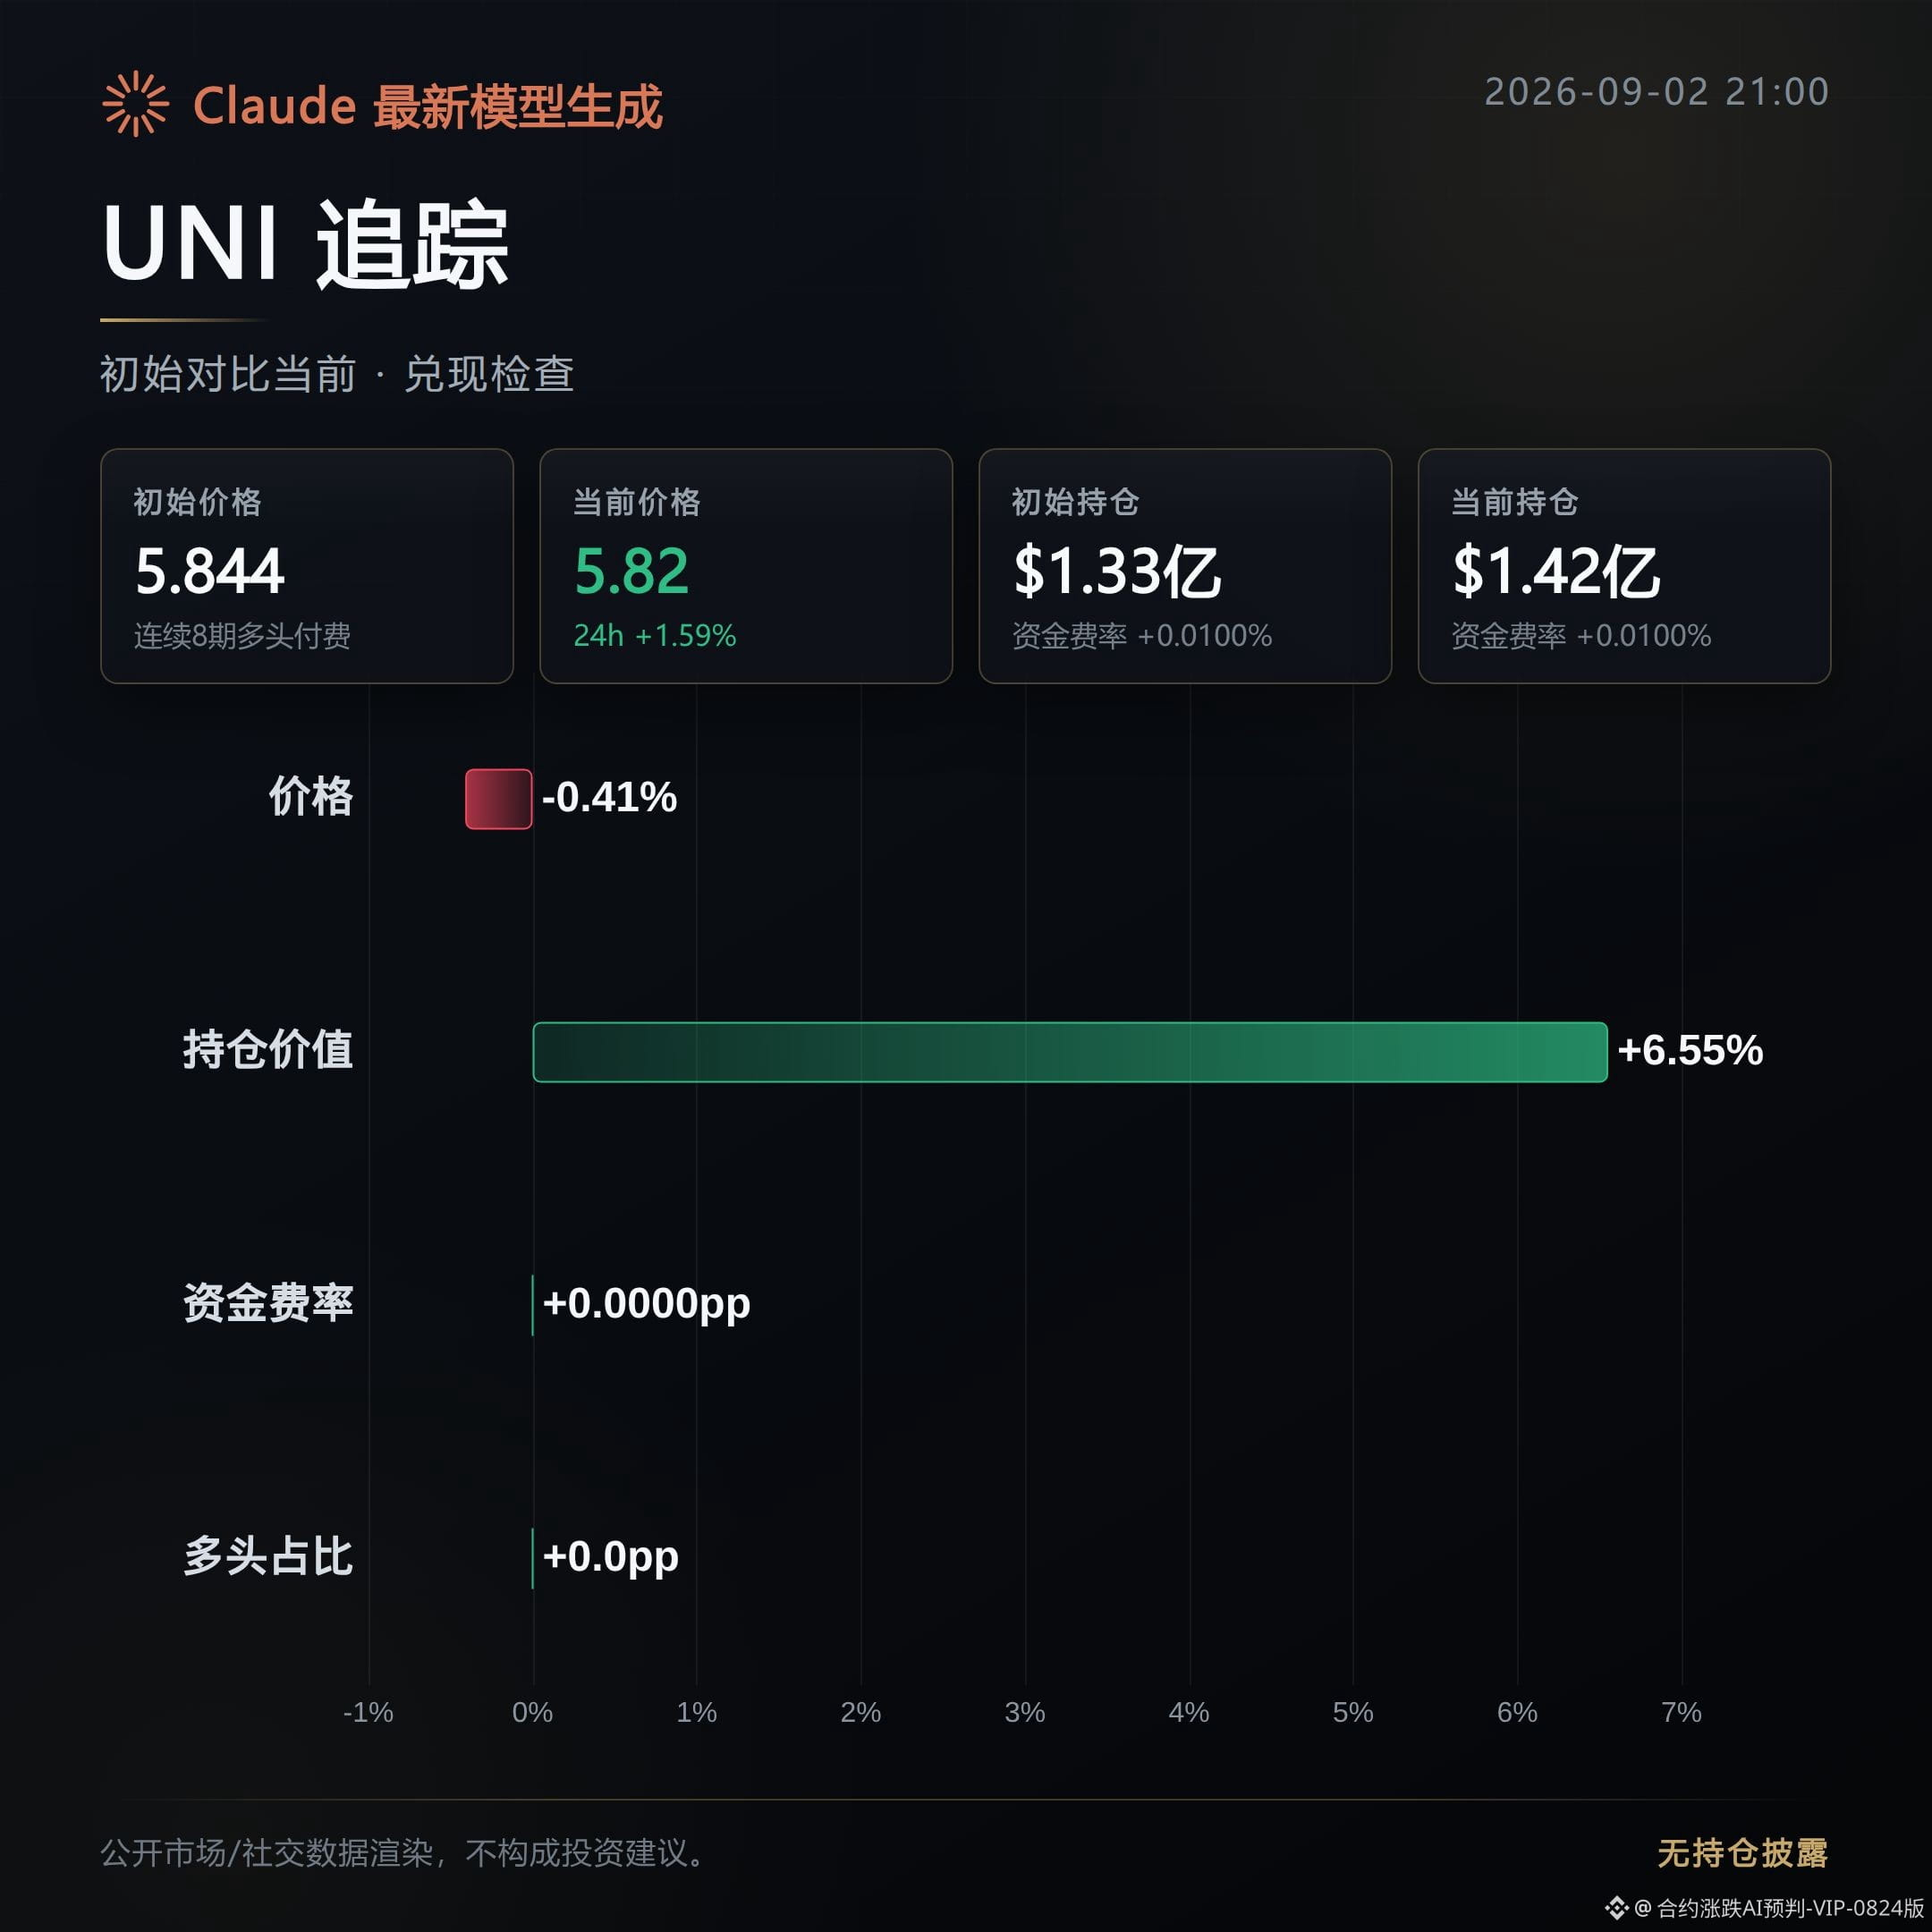
UNI: Tugs and pulls—the direction still hasn’t been worked out.
Price is basically flat, down only 0.41%, but open interest has risen against the trend by 6.55%.
If price isn’t going up while positions are piling in, it means longs and shorts are still locked in this zone. Meanwhile, aggressive buys are also weakening—no one has been able to push it into a clear direction.
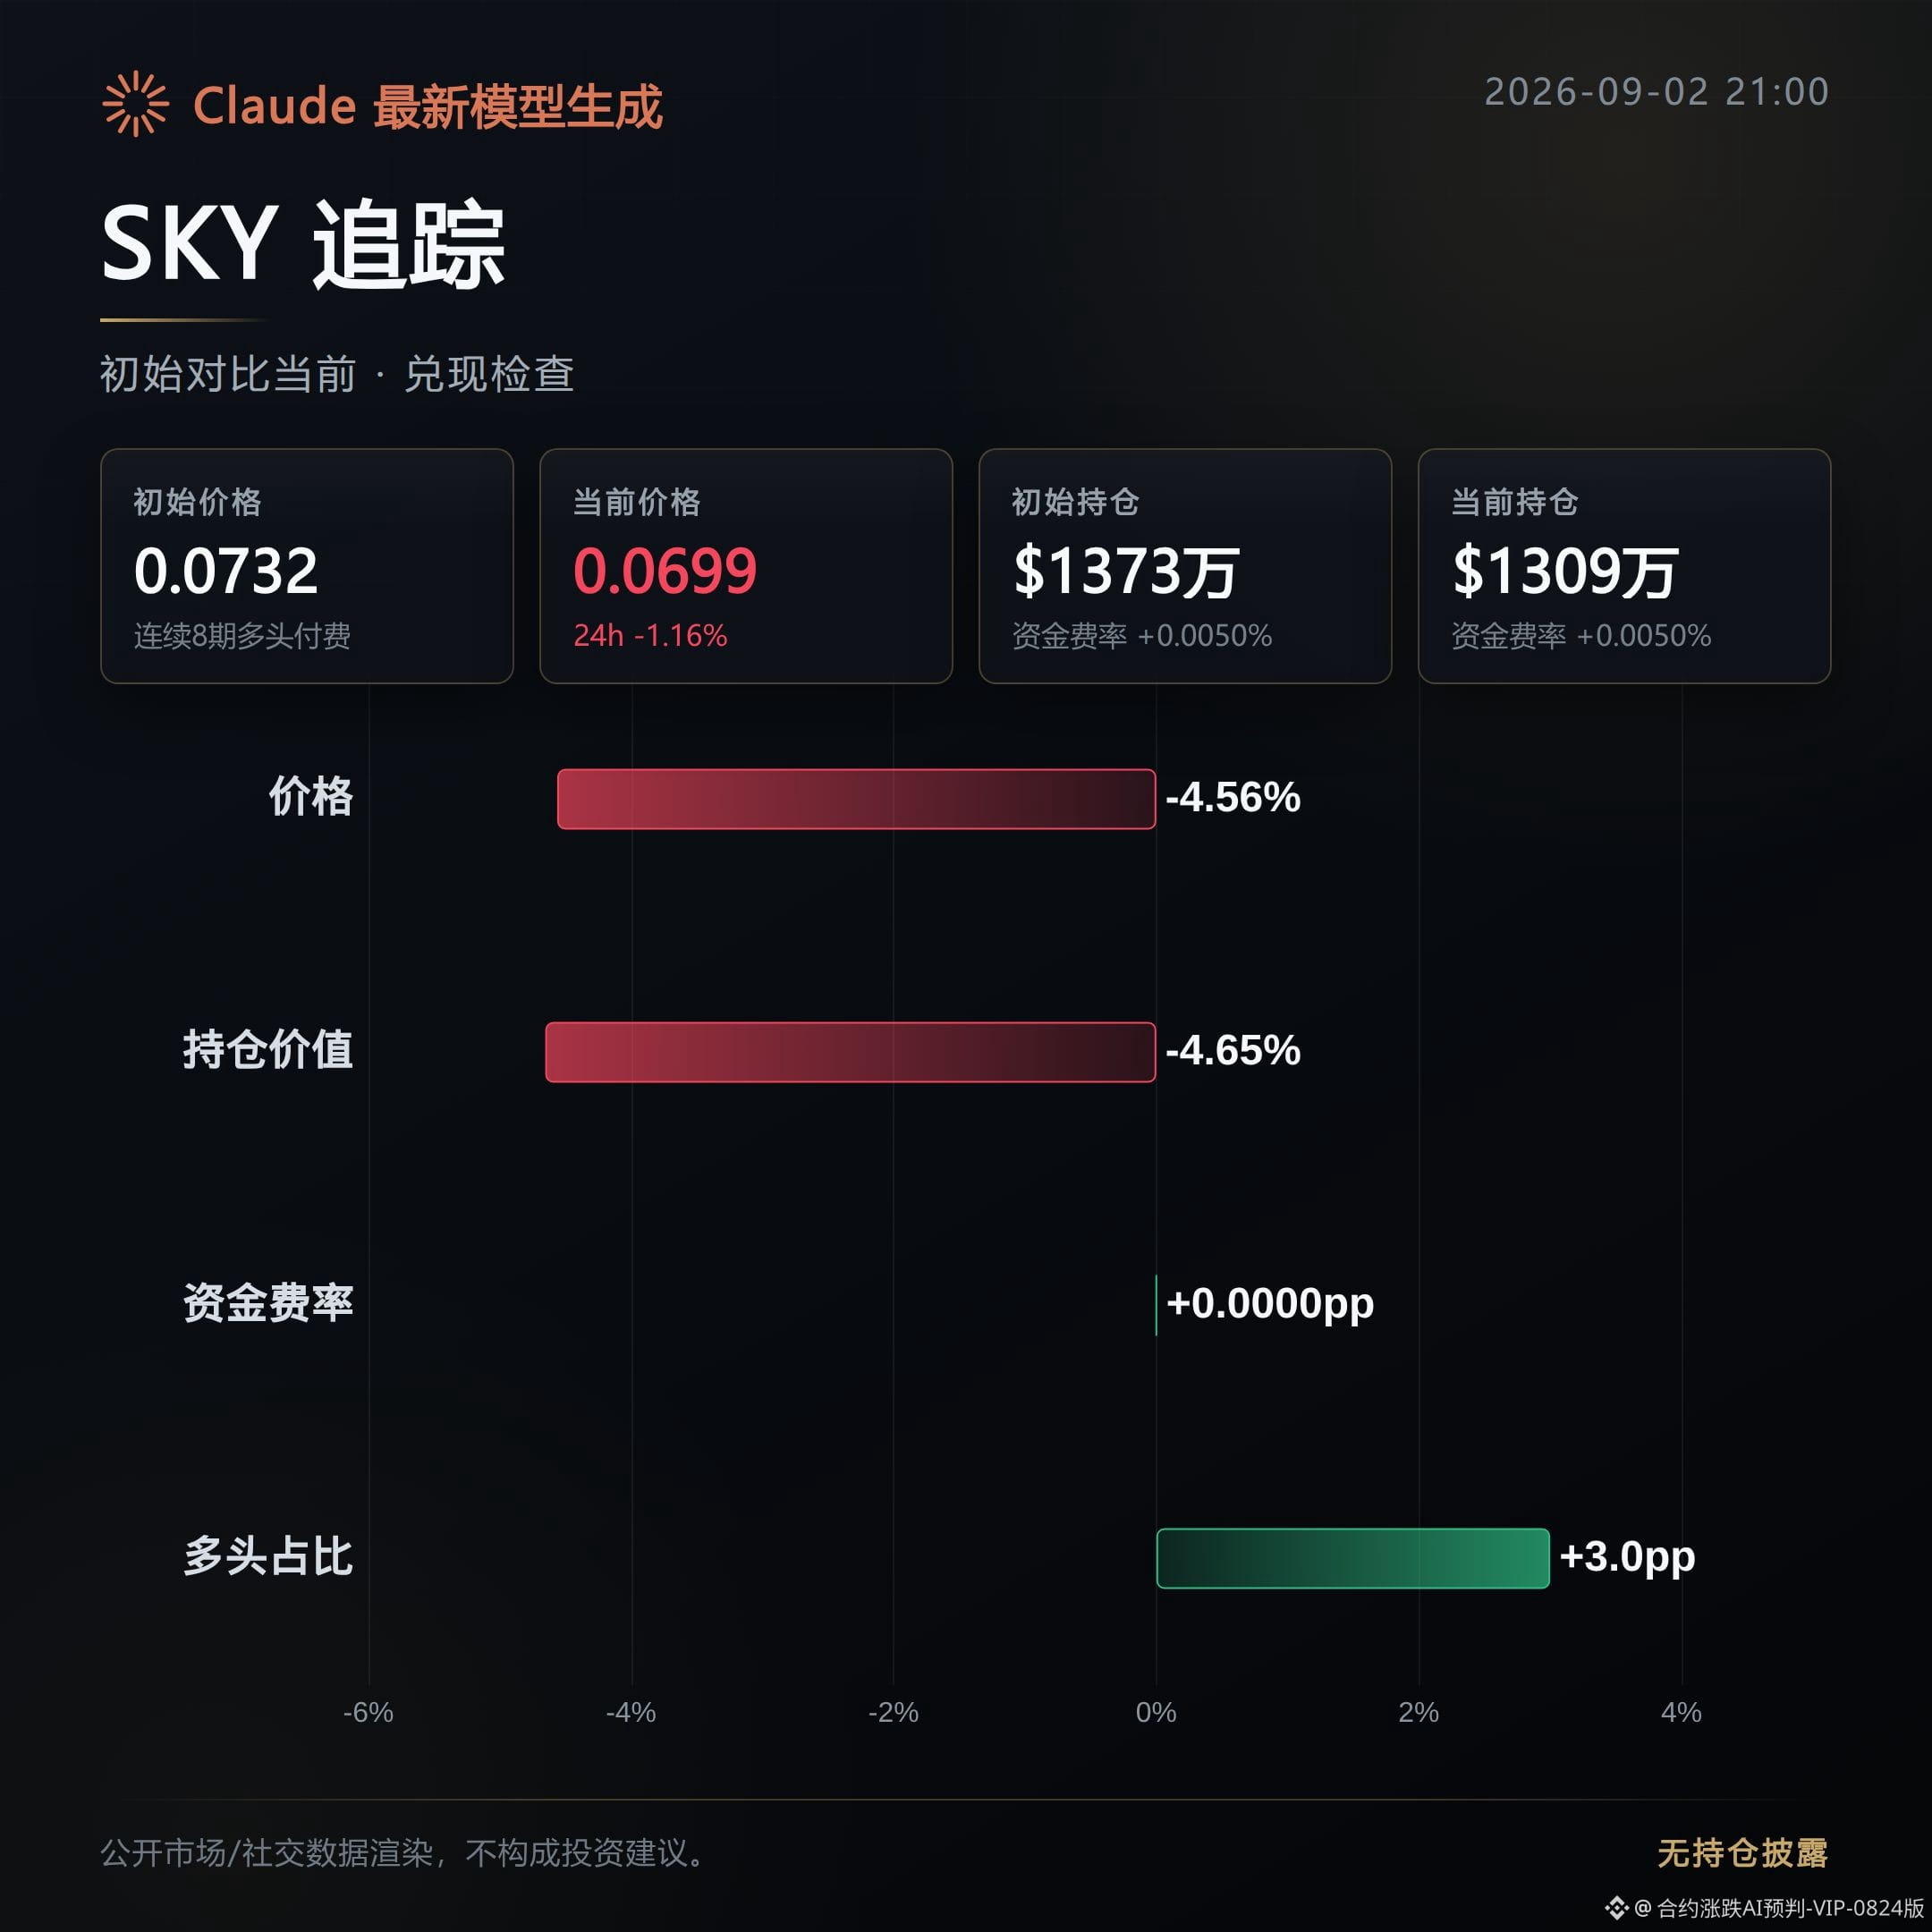
SKY: Fizzled out—the morning bullish setup was knocked back.
After the initial launch, price pulled back 4.56%, and trading volume fell by 12.81% at the same time—there wasn’t even enough volume to keep pushing.
Aggressive buys also weakened; the price is now already turning green-to-red, and this bullish wave couldn’t continue.
Next, watch whether these three coins can all turn positive at the same time: price reclaims above the initial launch bullish range, open interest stops falling and rebounds, and aggressive buys shift from weak to strong.
Only when all three signals come back together does this pull-up line count as truly续上 (extended/continued); if they keep diverging individually or all together, it confirms that the morning bullish setup wasn’t realized.
#ACE #UNI #SKY #Contract replay
Live trading record: This account currently holds $FOGO long positions; as long as the logic hasn’t changed, continue holding.
Helped organize contract data with assistance from Claude Fable 5; for informational reference only—please verify for yourself.
Among the three coins: currently 0 have managed to lock in profits, 2 have flared out and pulled back, and 1 is still being tugged and hasn’t found a clear direction.
The observation back then was that the chips were being gathered.
ACE: Fizzled out—the morning bullish move didn’t get picked up.
After the price launched first, it retraced by 11.93%, already falling below the original starting point of that bullish push.
Open interest also shrank by 16.82% in sync, and the aggressive buy order that was strong at launch has weakened—this wasn’t just holding steady; positions were being withdrawn.
UNI: Tugs and pulls—the direction still hasn’t been worked out.
Price is basically flat, down only 0.41%, but open interest has risen against the trend by 6.55%.
If price isn’t going up while positions are piling in, it means longs and shorts are still locked in this zone. Meanwhile, aggressive buys are also weakening—no one has been able to push it into a clear direction.
SKY: Fizzled out—the morning bullish setup was knocked back.
After the initial launch, price pulled back 4.56%, and trading volume fell by 12.81% at the same time—there wasn’t even enough volume to keep pushing.
Aggressive buys also weakened; the price is now already turning green-to-red, and this bullish wave couldn’t continue.
Next, watch whether these three coins can all turn positive at the same time: price reclaims above the initial launch bullish range, open interest stops falling and rebounds, and aggressive buys shift from weak to strong.
Only when all three signals come back together does this pull-up line count as truly续上 (extended/continued); if they keep diverging individually or all together, it confirms that the morning bullish setup wasn’t realized.
#ACE #UNI #SKY #Contract replay
Live trading record: This account currently holds $FOGO long positions; as long as the logic hasn’t changed, continue holding.
Helped organize contract data with assistance from Claude Fable 5; for informational reference only—please verify for yourself.
Top 3 gainers on today’s contract leaderboard this morning—UAI, MAGMA, ACE. Now it’s been 8 hours. Let’s go through the numbers again and see whether the peak-push signals at the time were actually fulfilled.
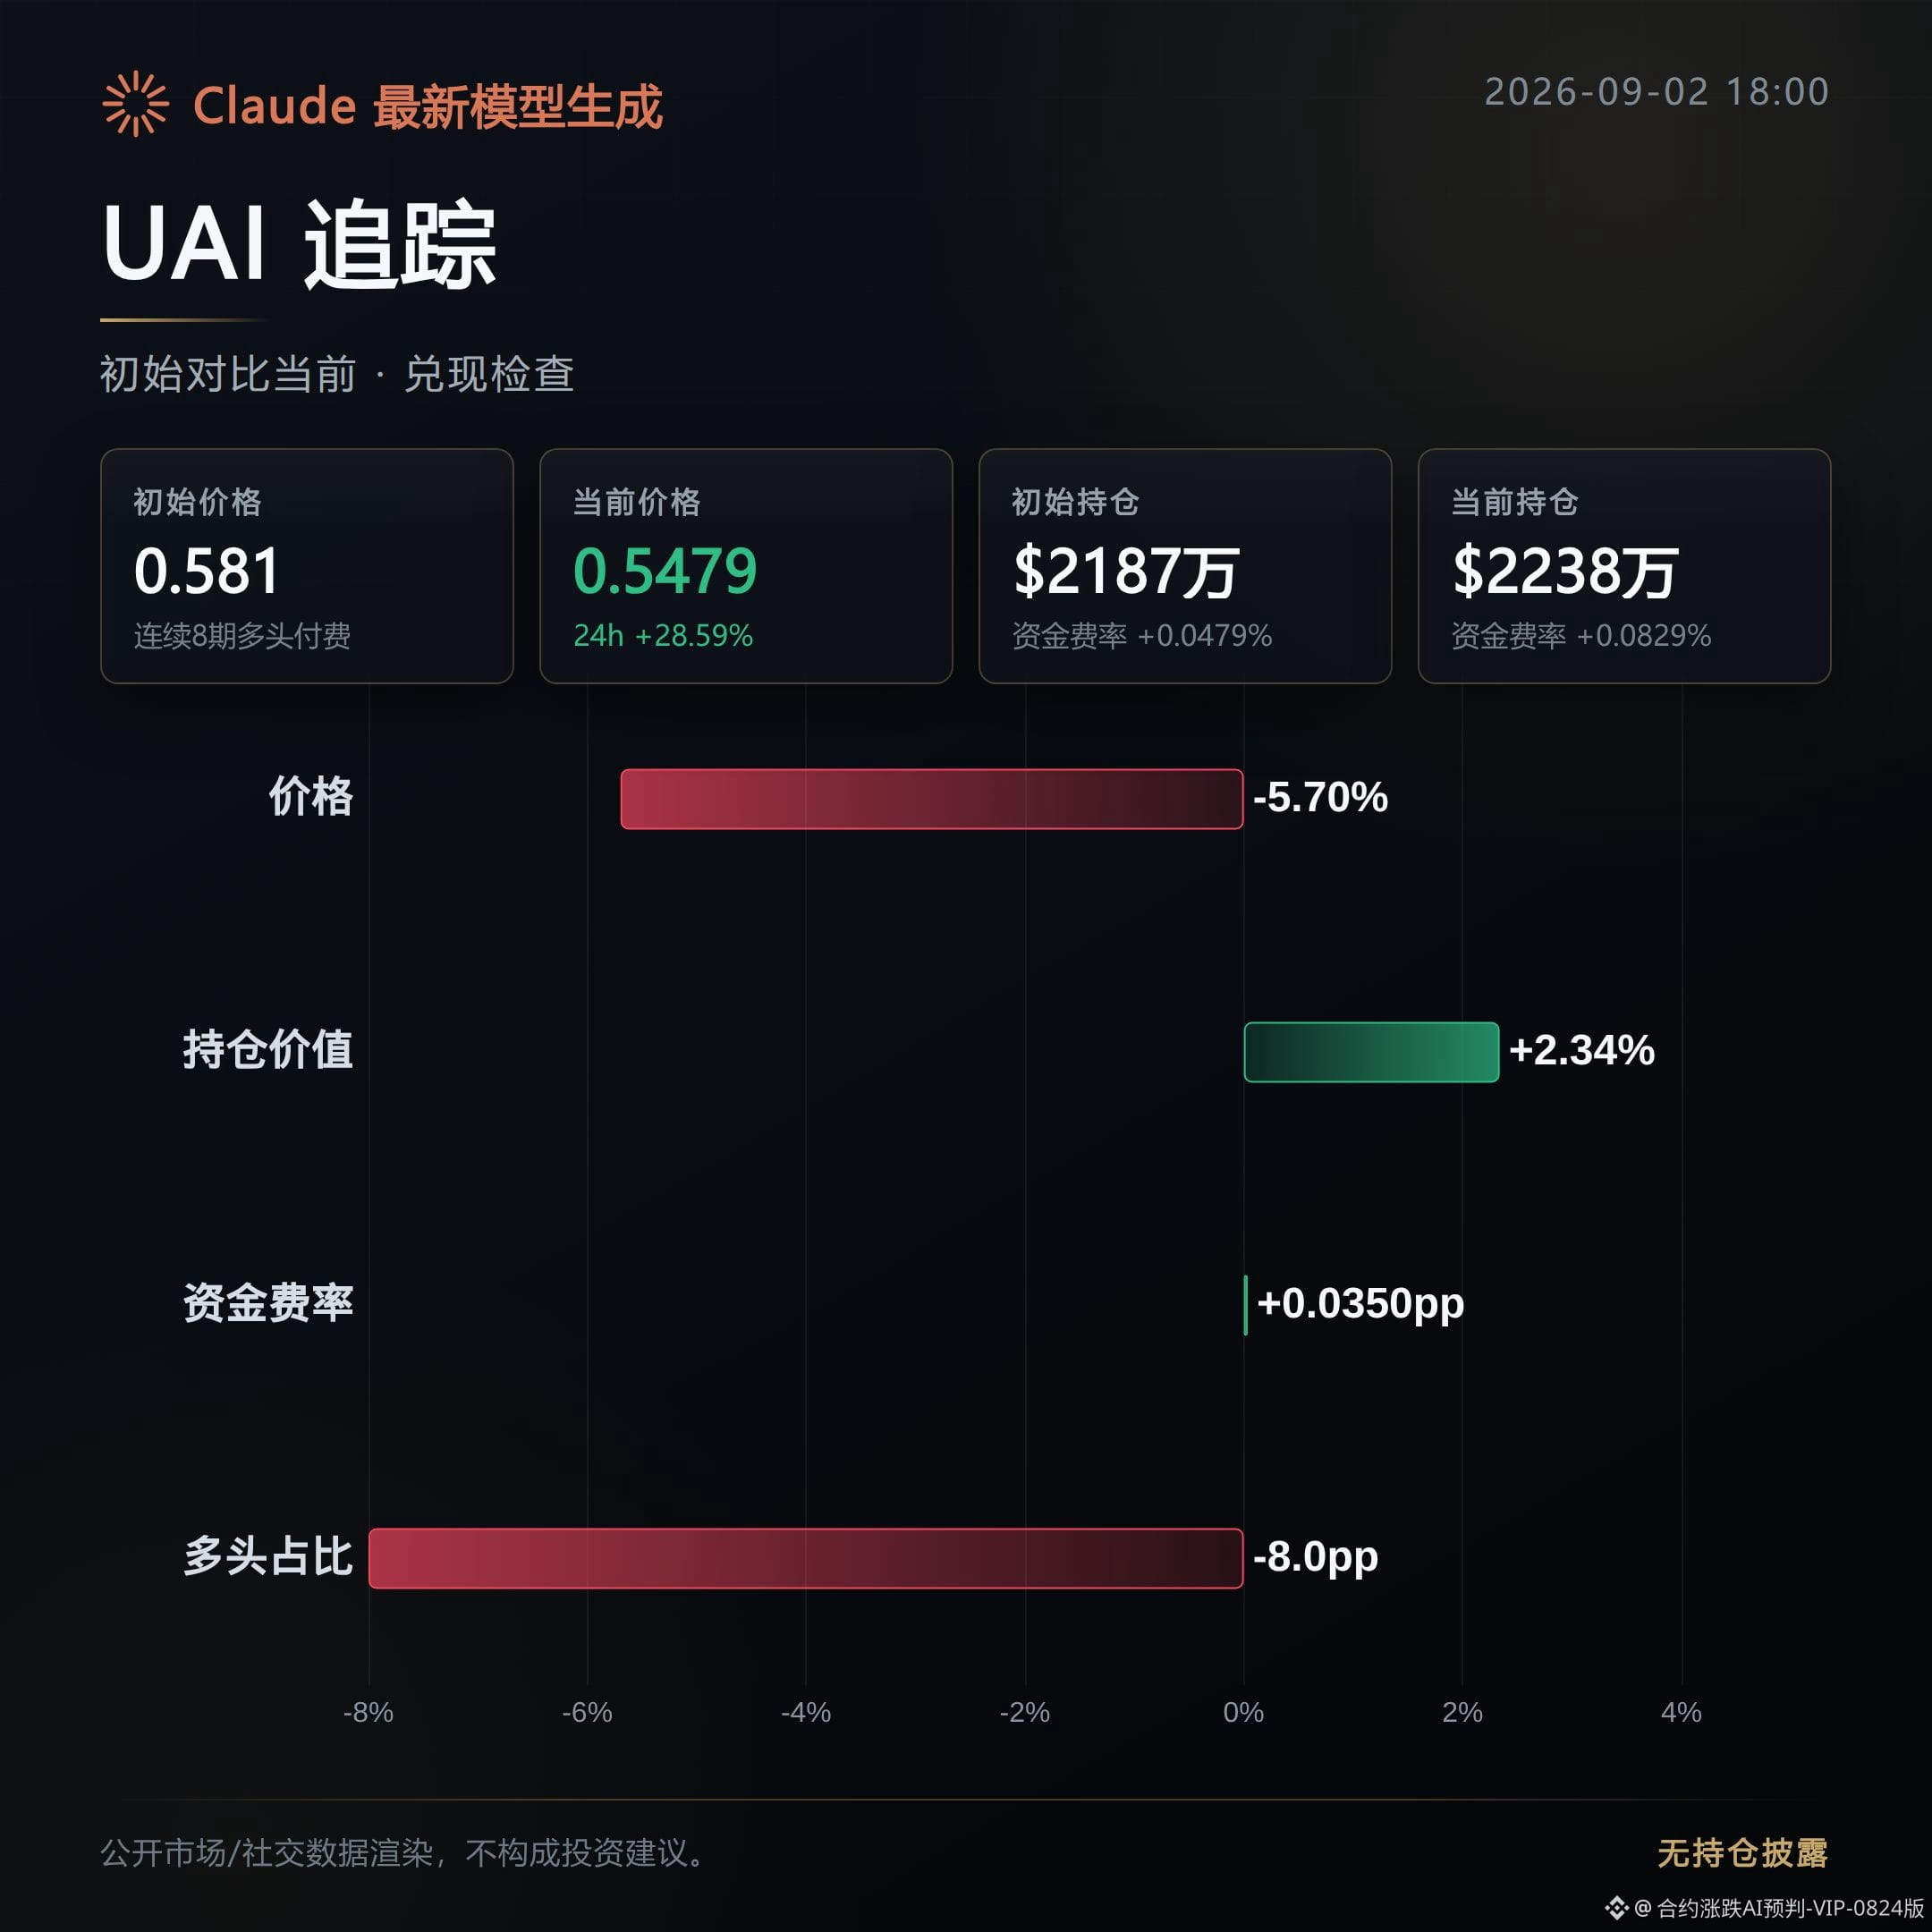
The conclusion for UAI is that the momentum has fizzled out.
At launch, the price jumped 51.86%; now it has fallen back to 28.59%. Compared with the launch, the price is down 5.7%.
Open interest has inched up by 2.34%, and trading volume is up 64.75%, but the funding rate has risen from 0.0479% to 0.0829%, and the long-position ratio is only 37%.
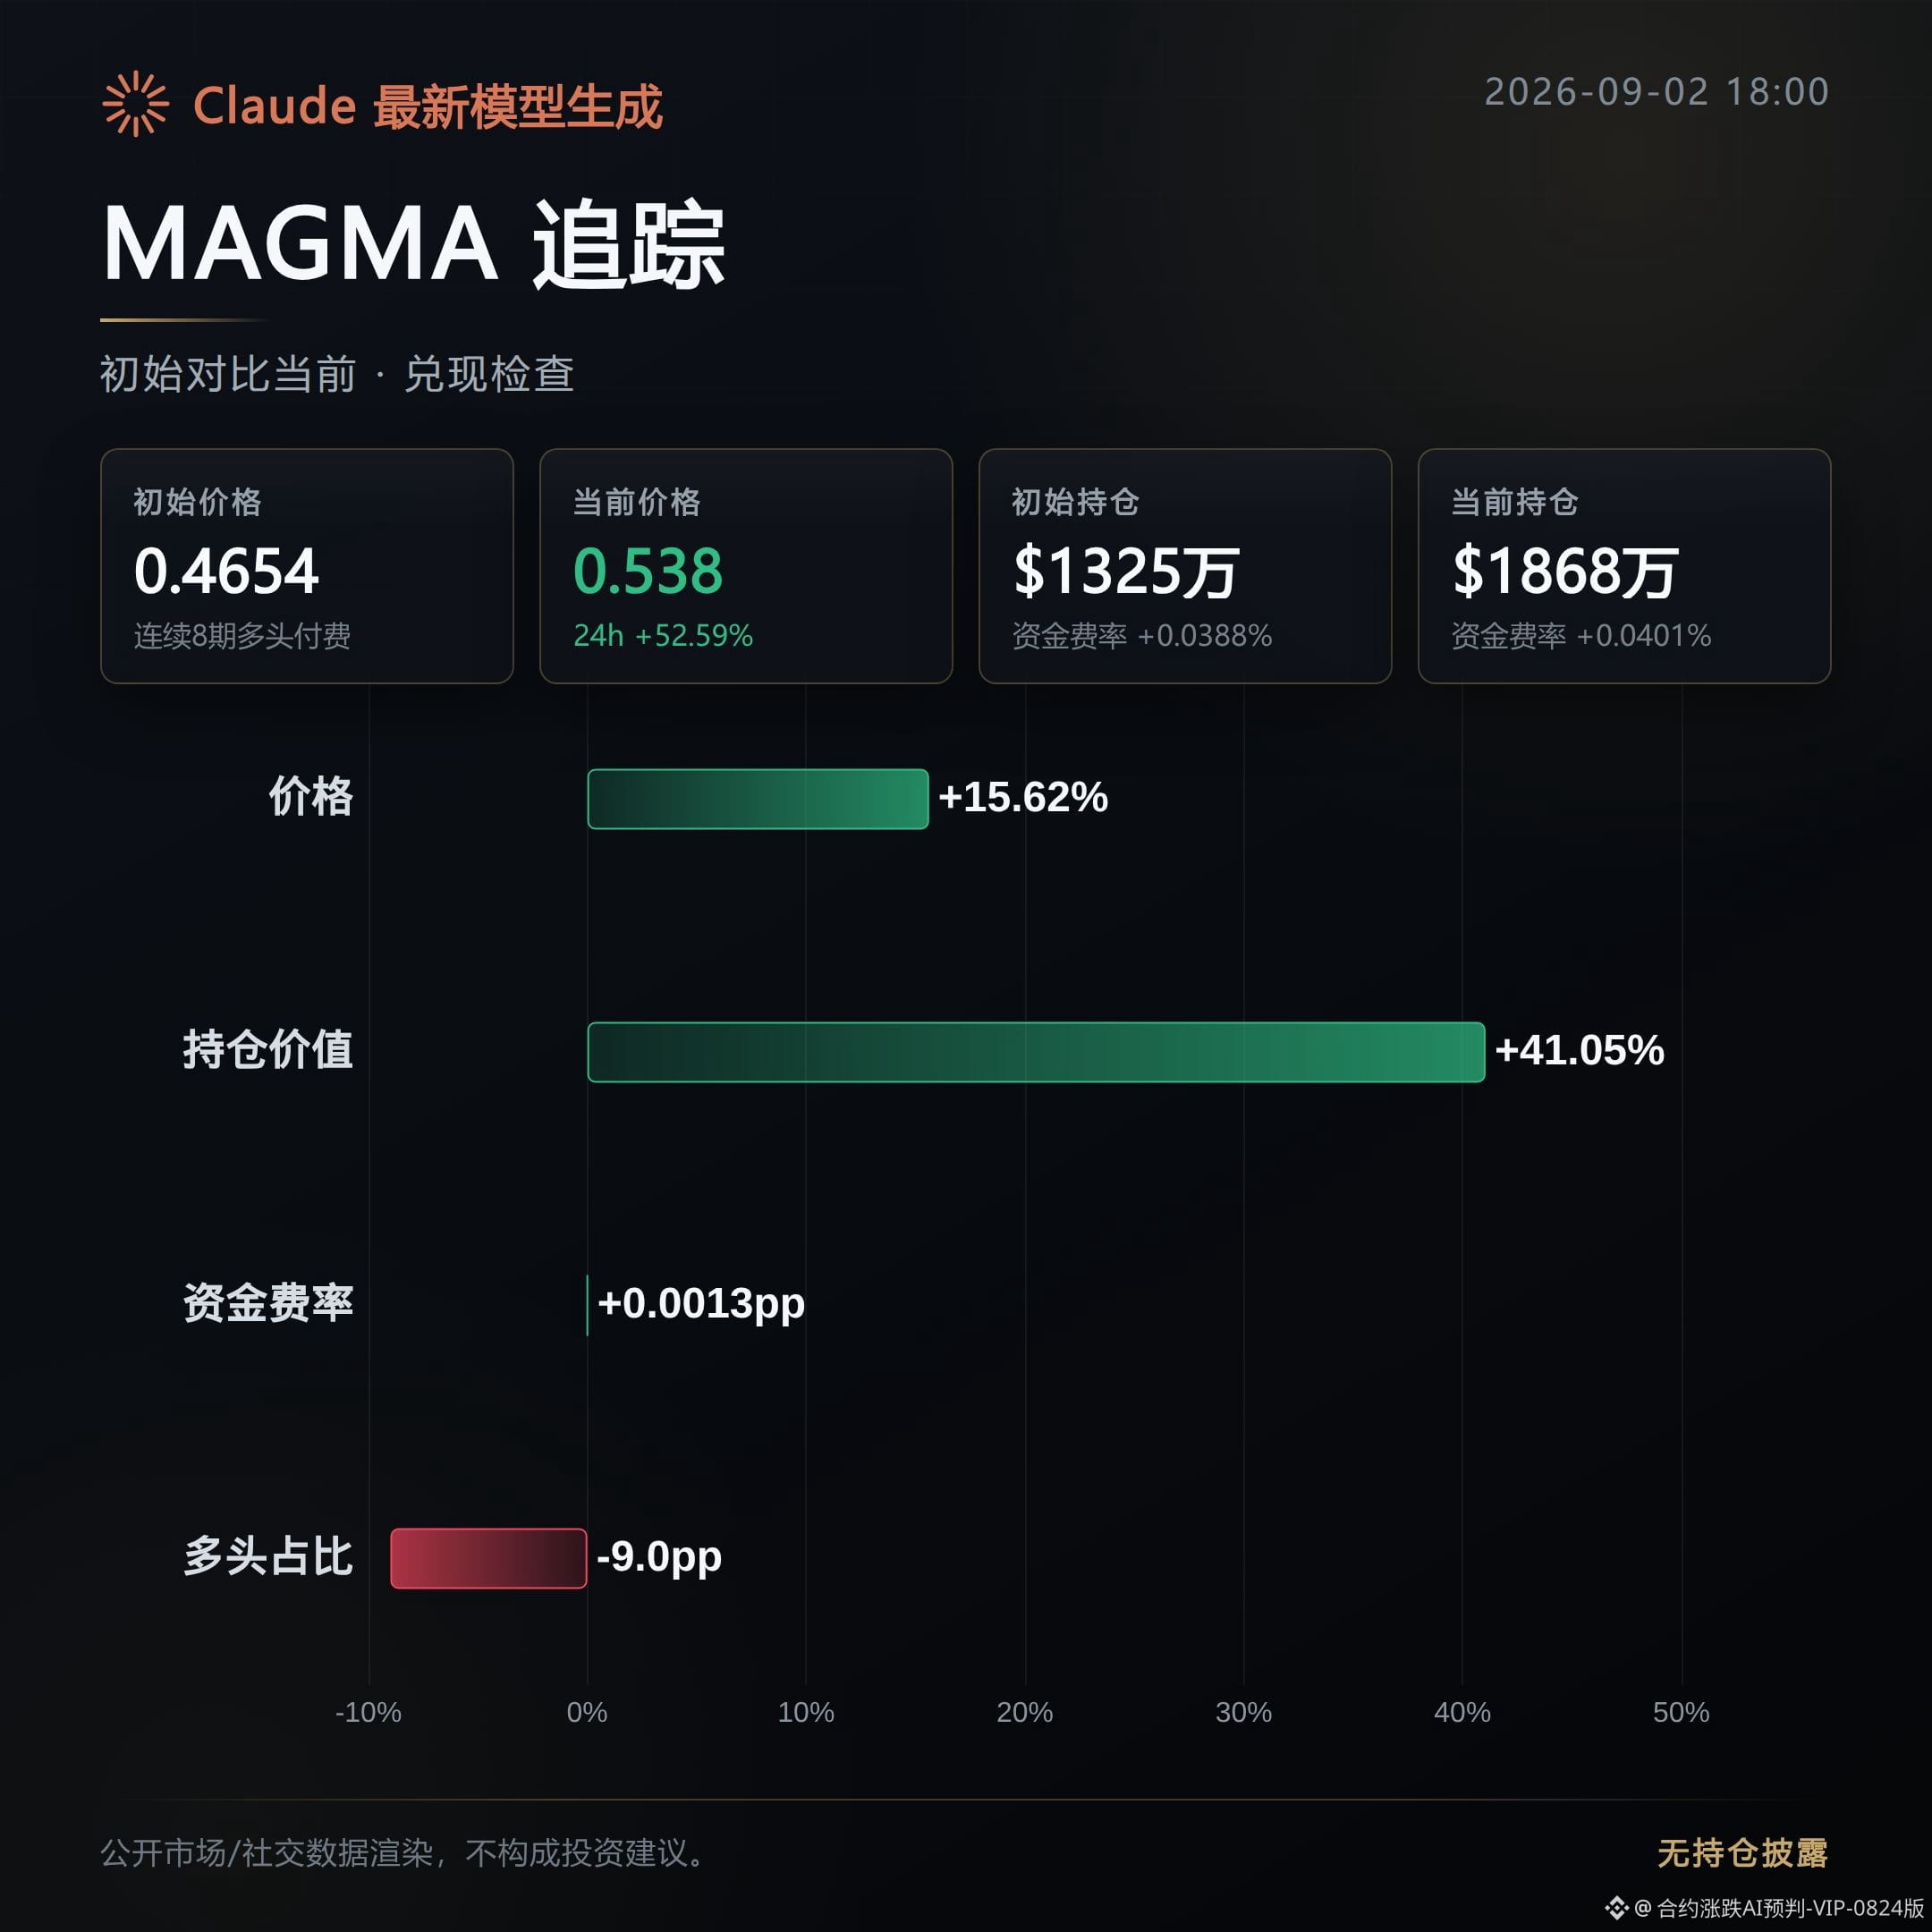
For MAGMA, the conclusion is that it delivered—among the three, it’s the only one that kept going.
After the initial move, the price kept rising by 15.62%, expanding the gain from 30.34% to 52.59%.
Open interest surged by 41.05%, and trading volume jumped 89.66%. The relative strength indicator is already at 77.6, sitting in an overextended zone.
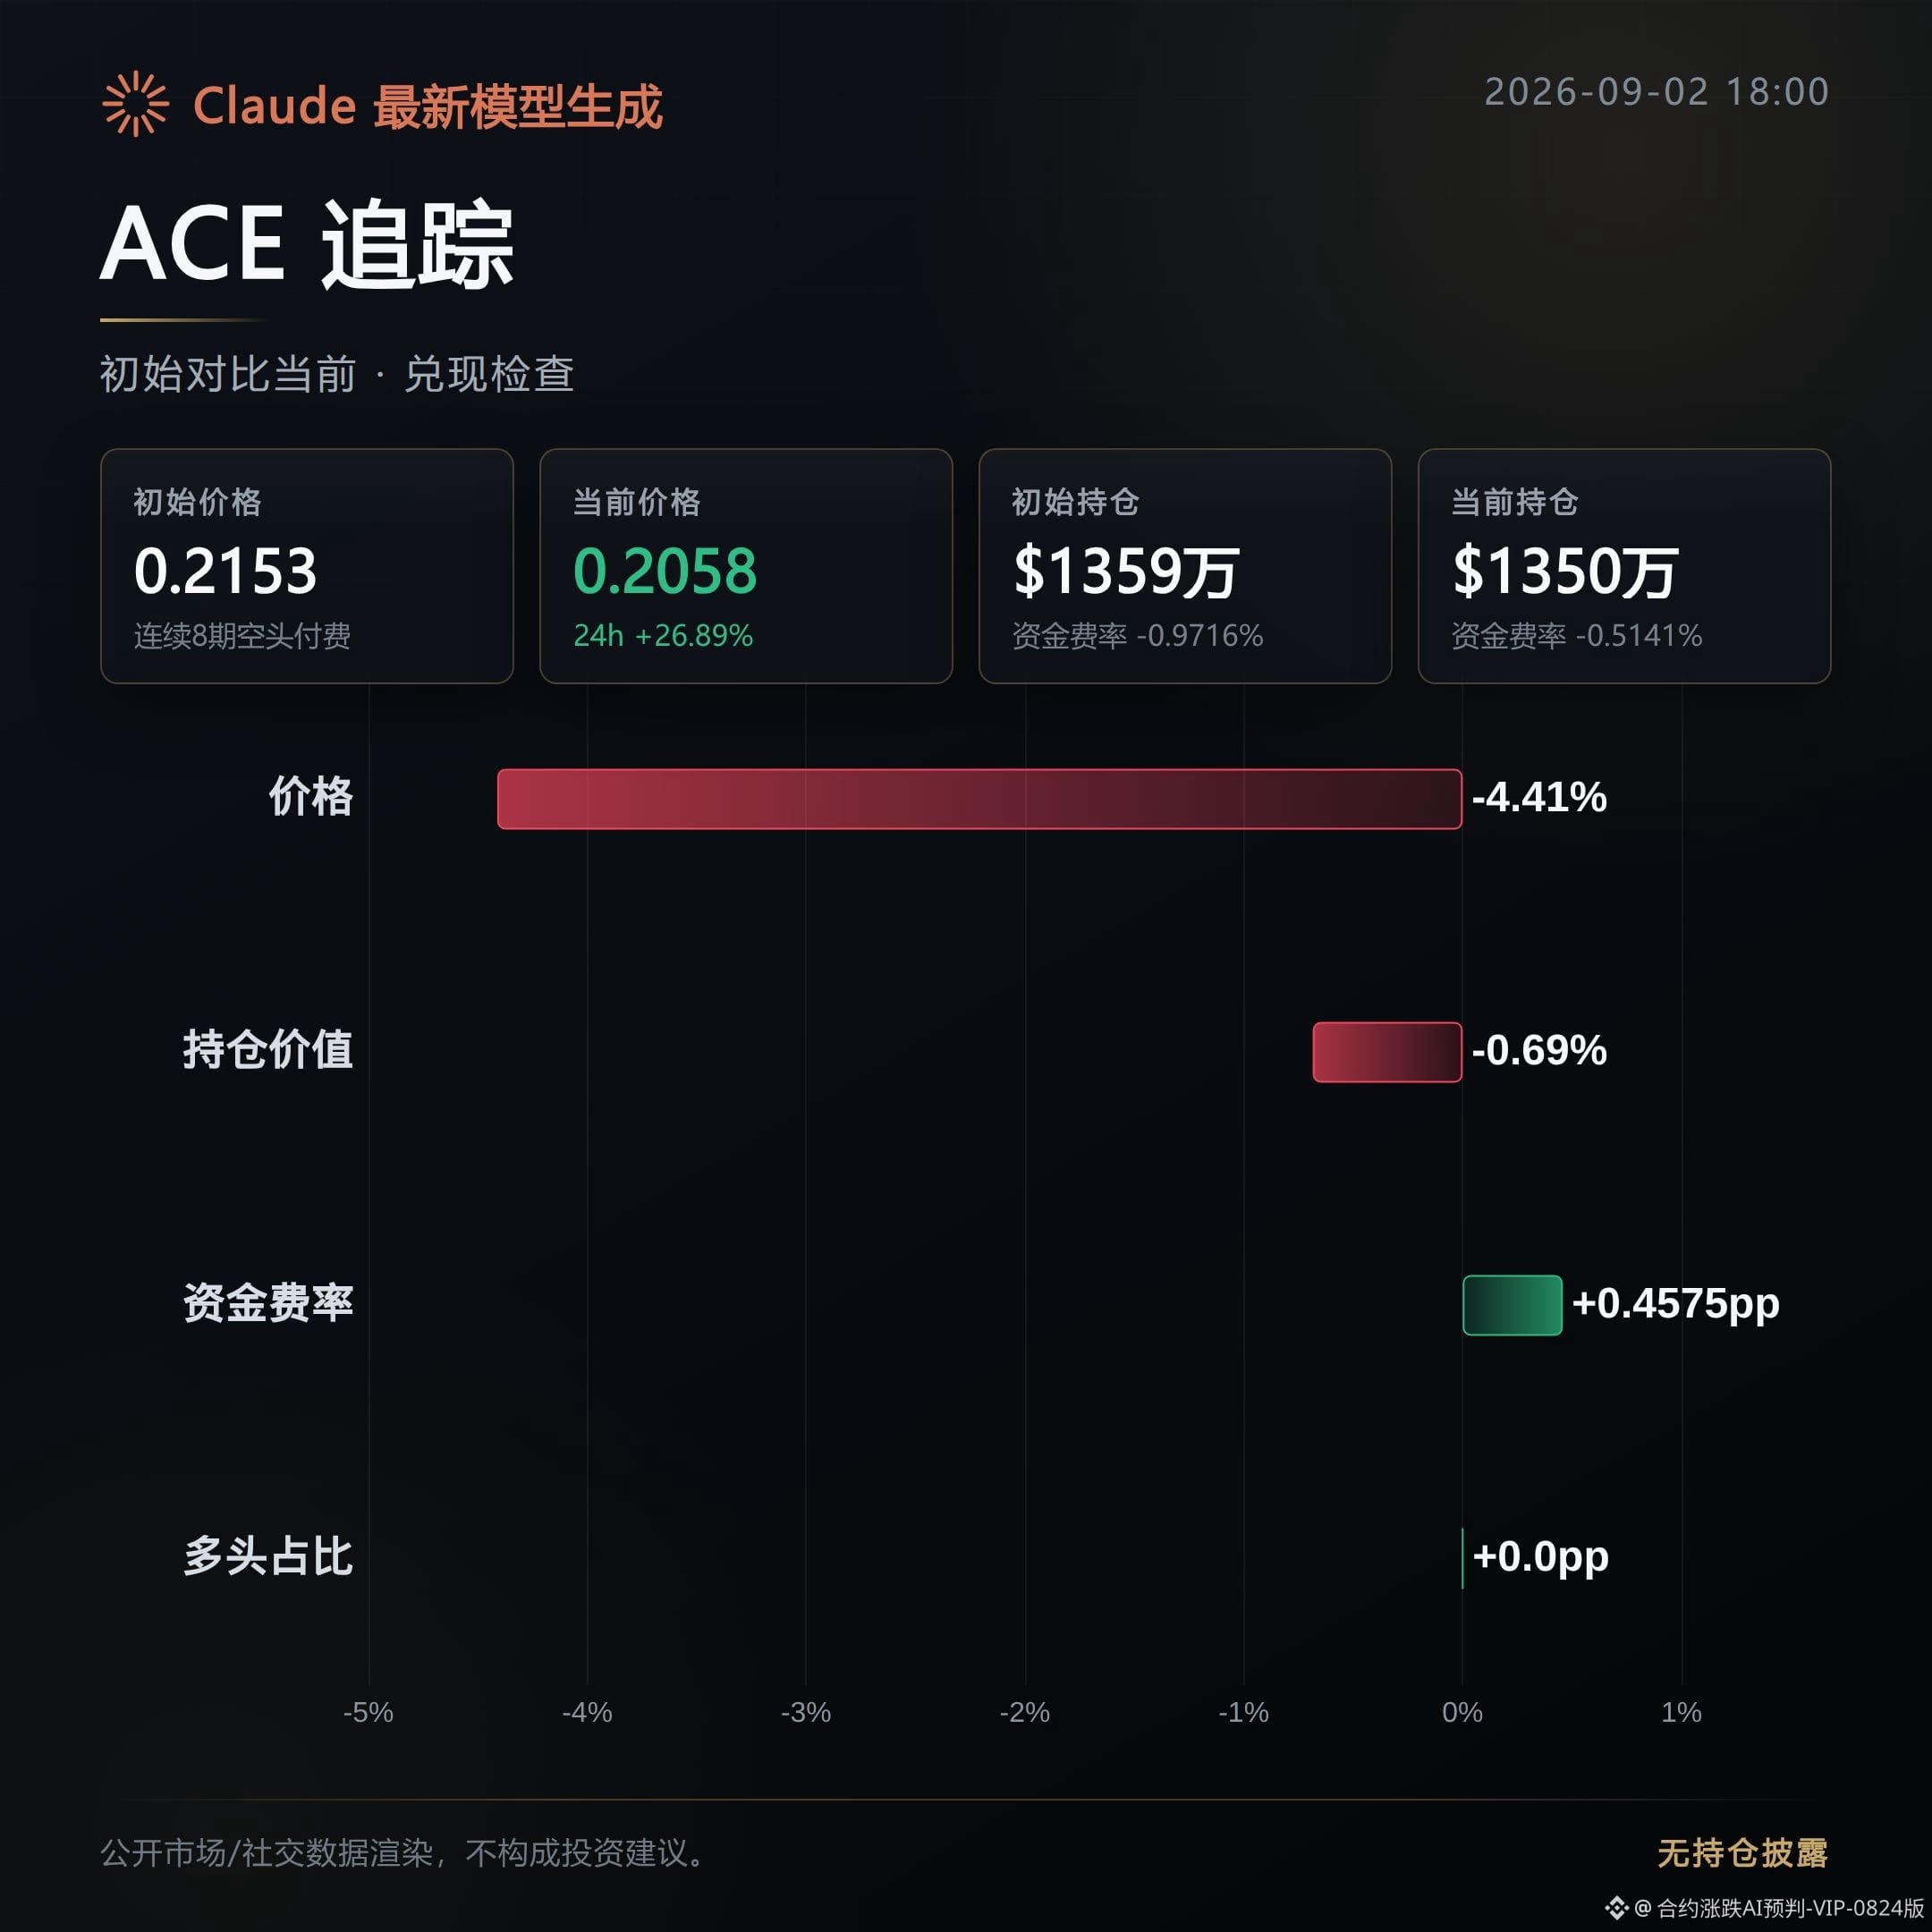
For ACE, the conclusion is again that the momentum has fizzled out.
After the initial move, the price pulled back 4.41%, narrowing the gain from 31.33% to 26.89%, and open interest basically hasn’t moved.
The funding rate is still negative, improving from -0.9716% to -0.5141%, and the active buy-side ratio has weakened slightly.
Among the three, two fizzled out and one delivered—this suggests the signal consistency of this morning’s gainers leaderboard isn’t very stable.
MAGMA’s open interest and trading volume are still rising in sync, and short-term momentum hasn’t clearly weakened. However, the relative strength indicator is on the high side, so if you chase at elevated levels, watch the risk of a peak-and-retrace.
For UAI and ACE, the price has already pulled back from the highs. Going forward, if open interest and trading volume can’t keep up, further drawdowns are possible.
#UAI #MAGMA #ACE # Contract recap
Live trading note: This account currently holds $FOGO long positions; the logic hasn’t changed—will continue holding.
With assistance from Claude Fable 5 to compile the contract data; for reference only—please verify independently.
The conclusion for UAI is that the momentum has fizzled out.
At launch, the price jumped 51.86%; now it has fallen back to 28.59%. Compared with the launch, the price is down 5.7%.
Open interest has inched up by 2.34%, and trading volume is up 64.75%, but the funding rate has risen from 0.0479% to 0.0829%, and the long-position ratio is only 37%.
For MAGMA, the conclusion is that it delivered—among the three, it’s the only one that kept going.
After the initial move, the price kept rising by 15.62%, expanding the gain from 30.34% to 52.59%.
Open interest surged by 41.05%, and trading volume jumped 89.66%. The relative strength indicator is already at 77.6, sitting in an overextended zone.
For ACE, the conclusion is again that the momentum has fizzled out.
After the initial move, the price pulled back 4.41%, narrowing the gain from 31.33% to 26.89%, and open interest basically hasn’t moved.
The funding rate is still negative, improving from -0.9716% to -0.5141%, and the active buy-side ratio has weakened slightly.
Among the three, two fizzled out and one delivered—this suggests the signal consistency of this morning’s gainers leaderboard isn’t very stable.
MAGMA’s open interest and trading volume are still rising in sync, and short-term momentum hasn’t clearly weakened. However, the relative strength indicator is on the high side, so if you chase at elevated levels, watch the risk of a peak-and-retrace.
For UAI and ACE, the price has already pulled back from the highs. Going forward, if open interest and trading volume can’t keep up, further drawdowns are possible.
#UAI #MAGMA #ACE # Contract recap
Live trading note: This account currently holds $FOGO long positions; the logic hasn’t changed—will continue holding.
With assistance from Claude Fable 5 to compile the contract data; for reference only—please verify independently.
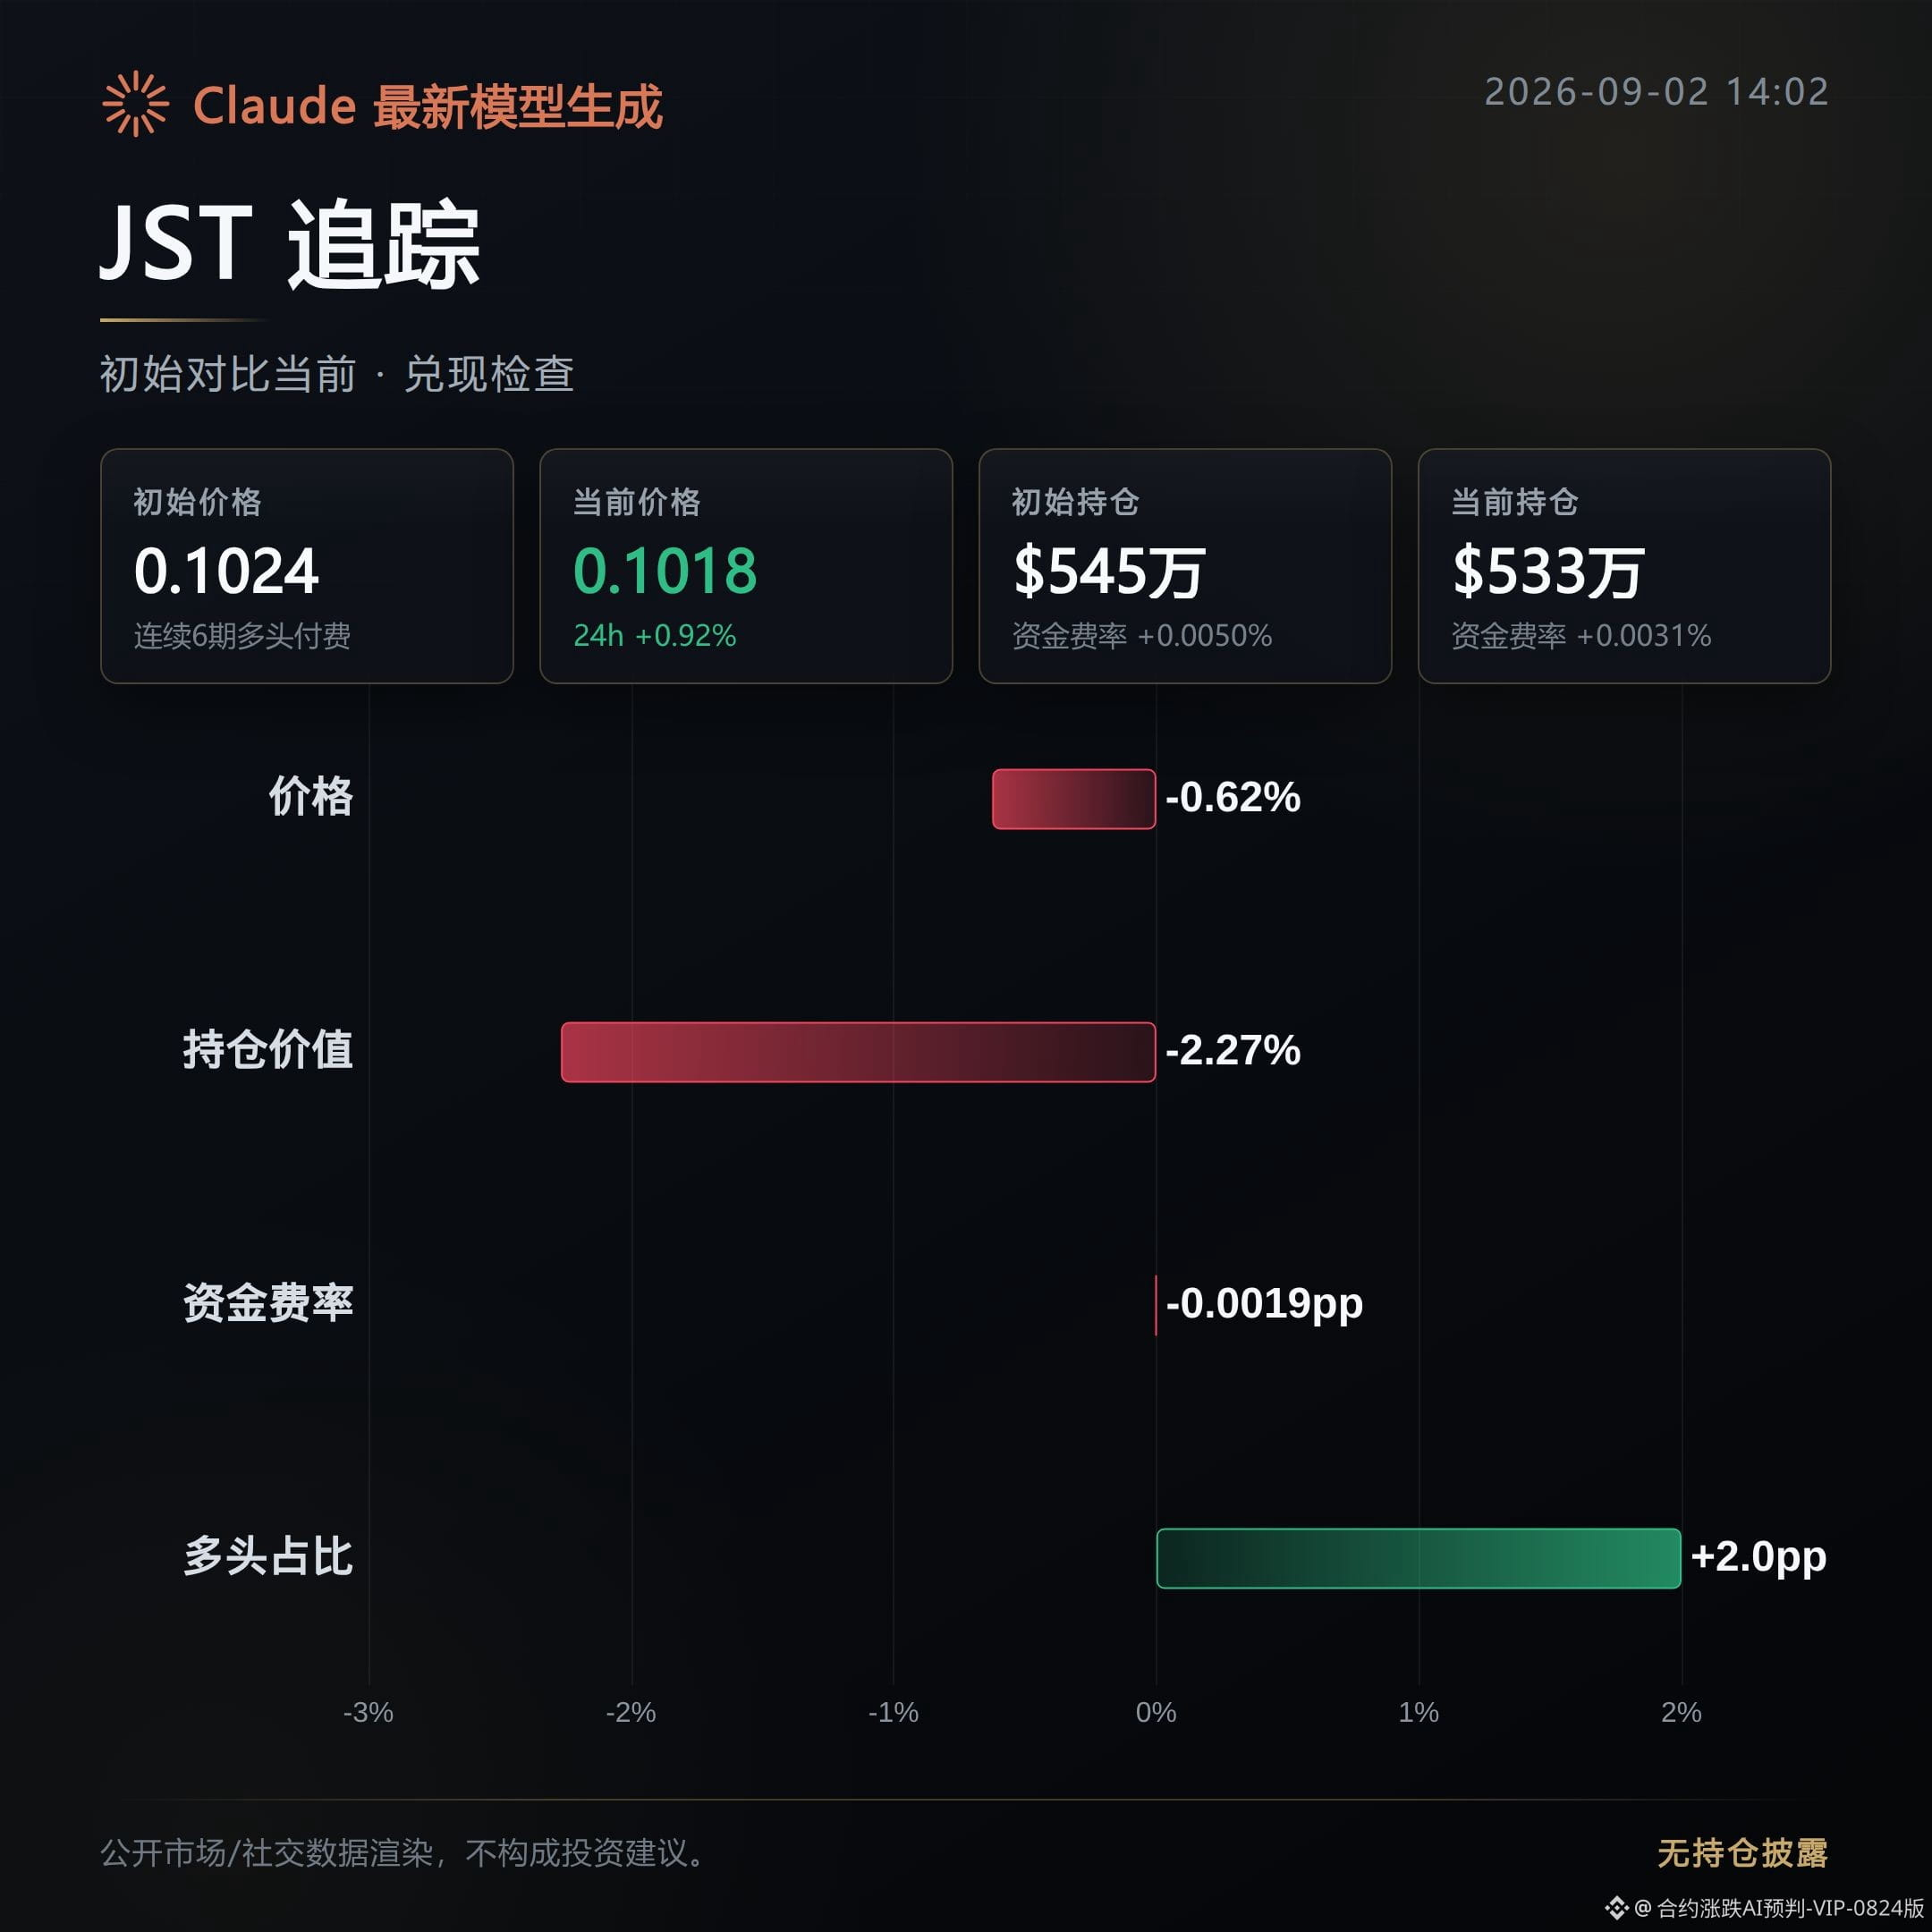
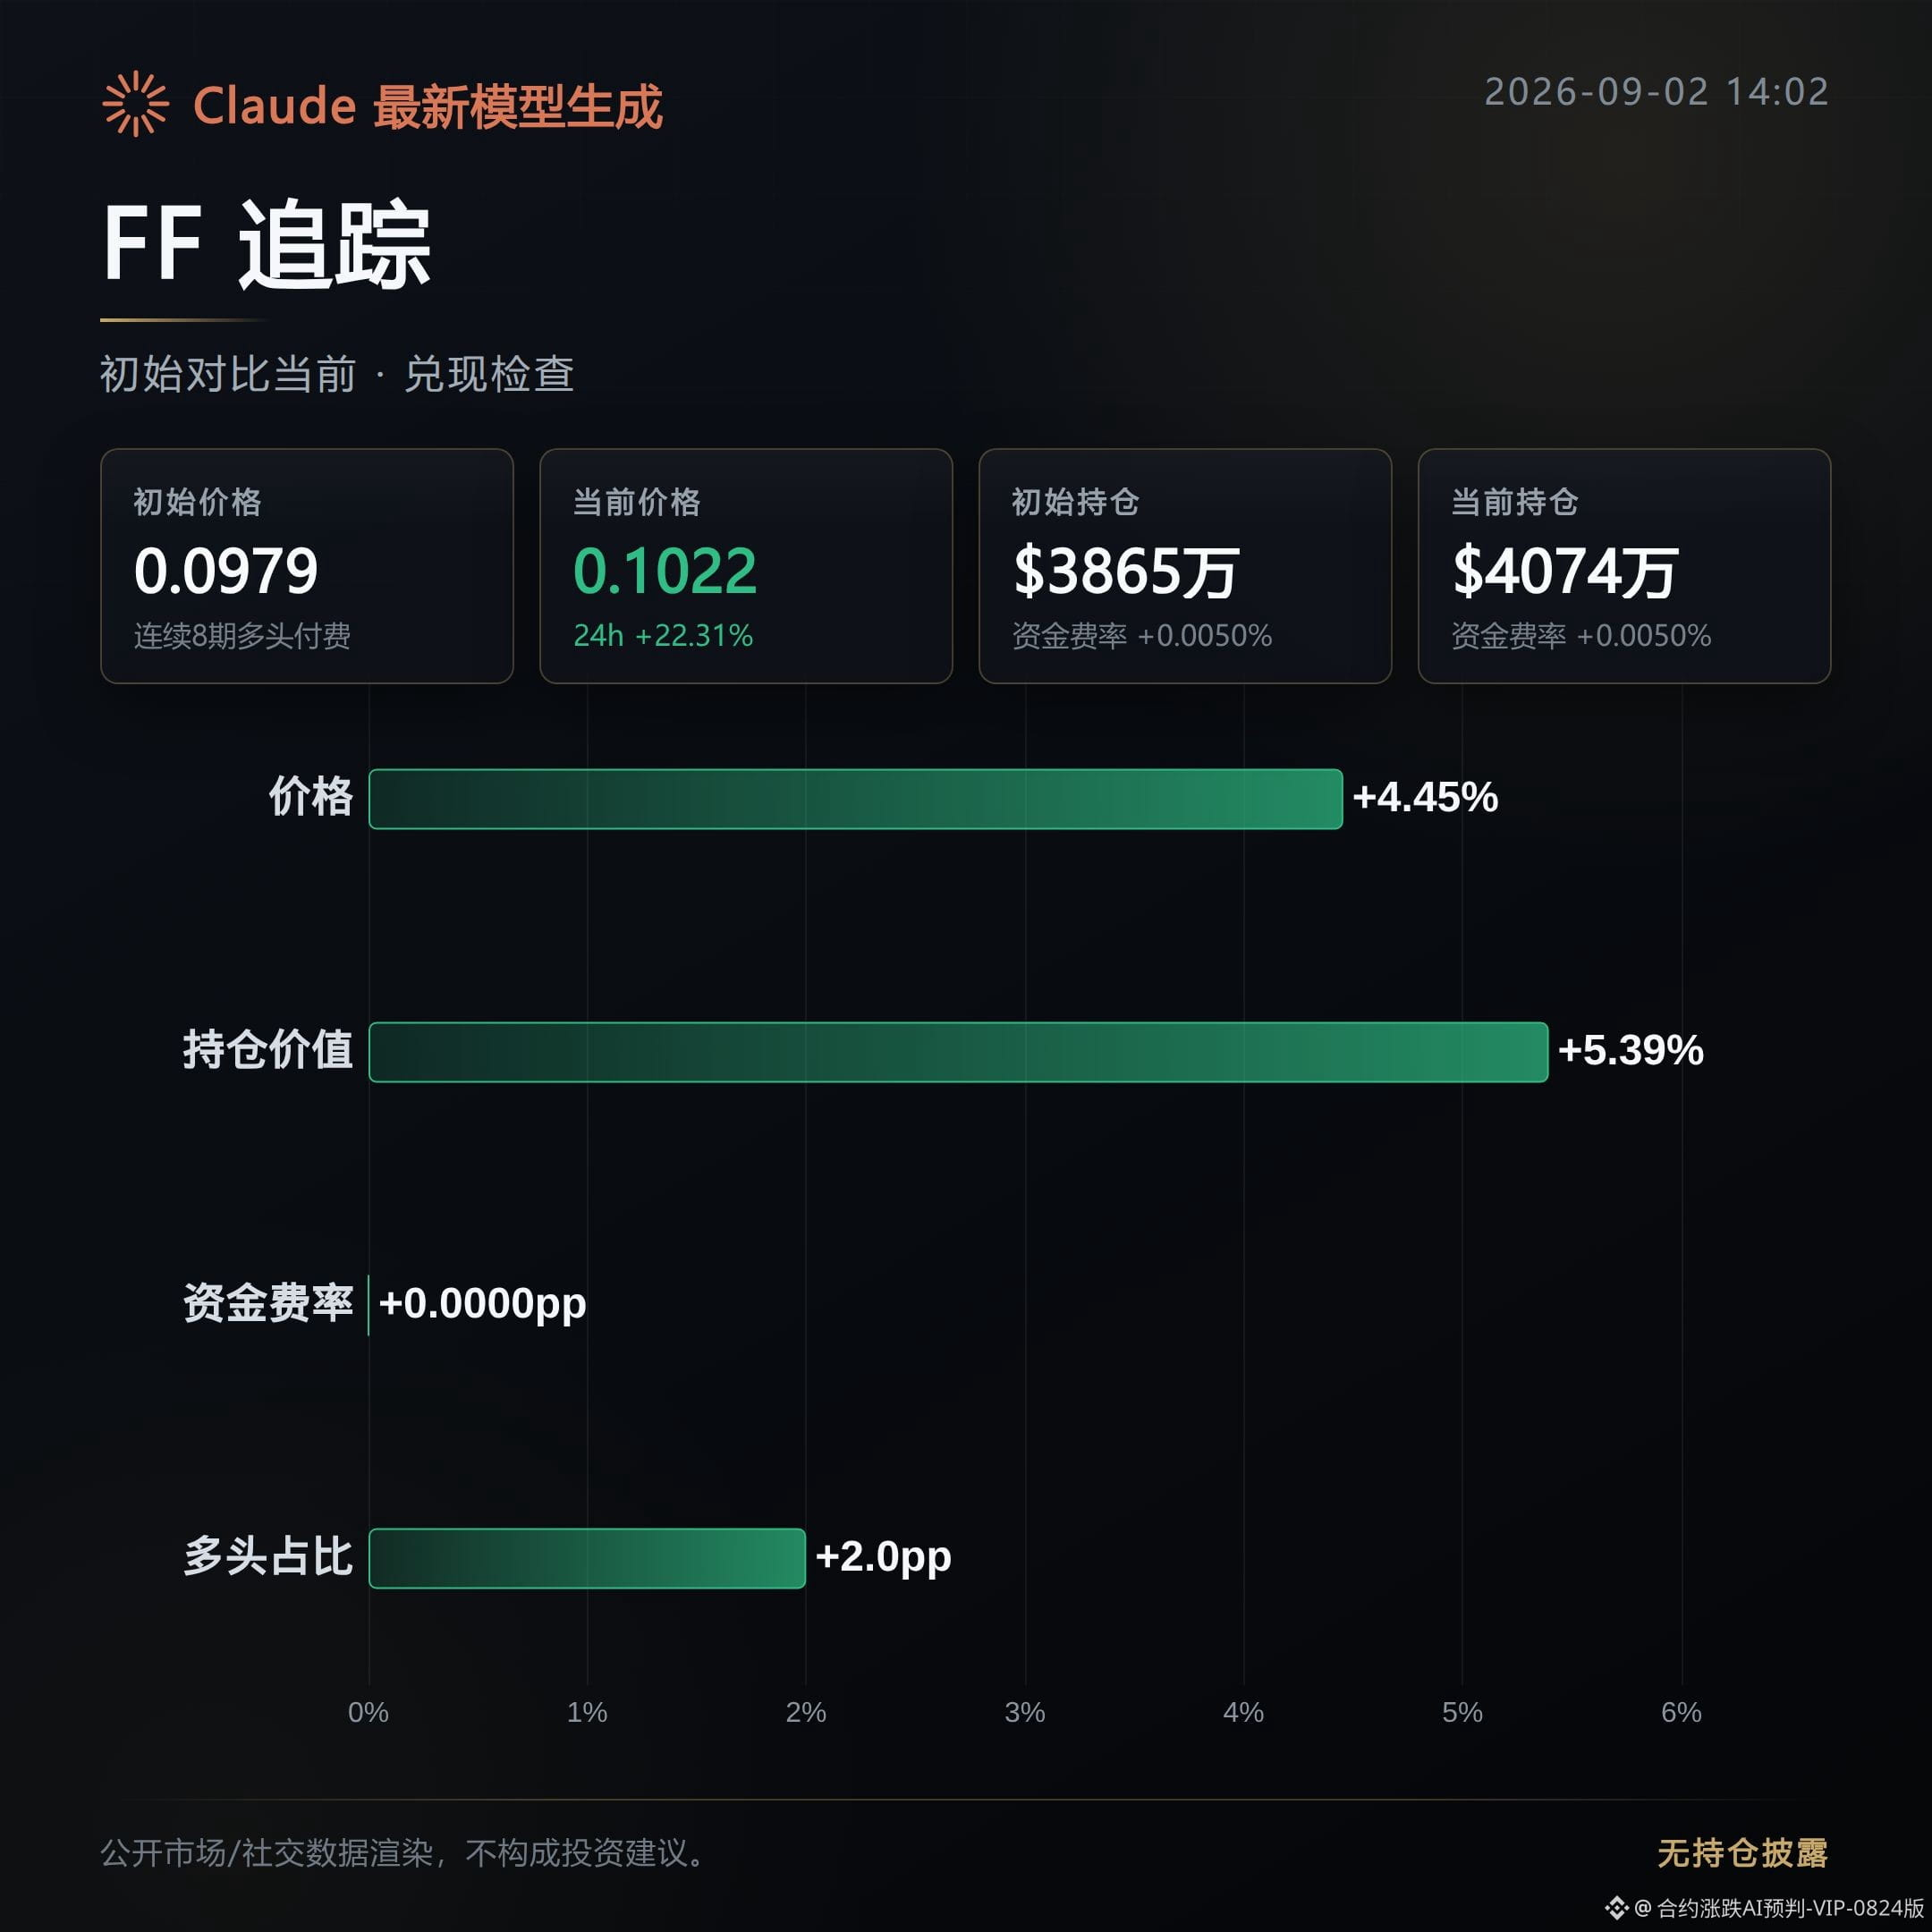
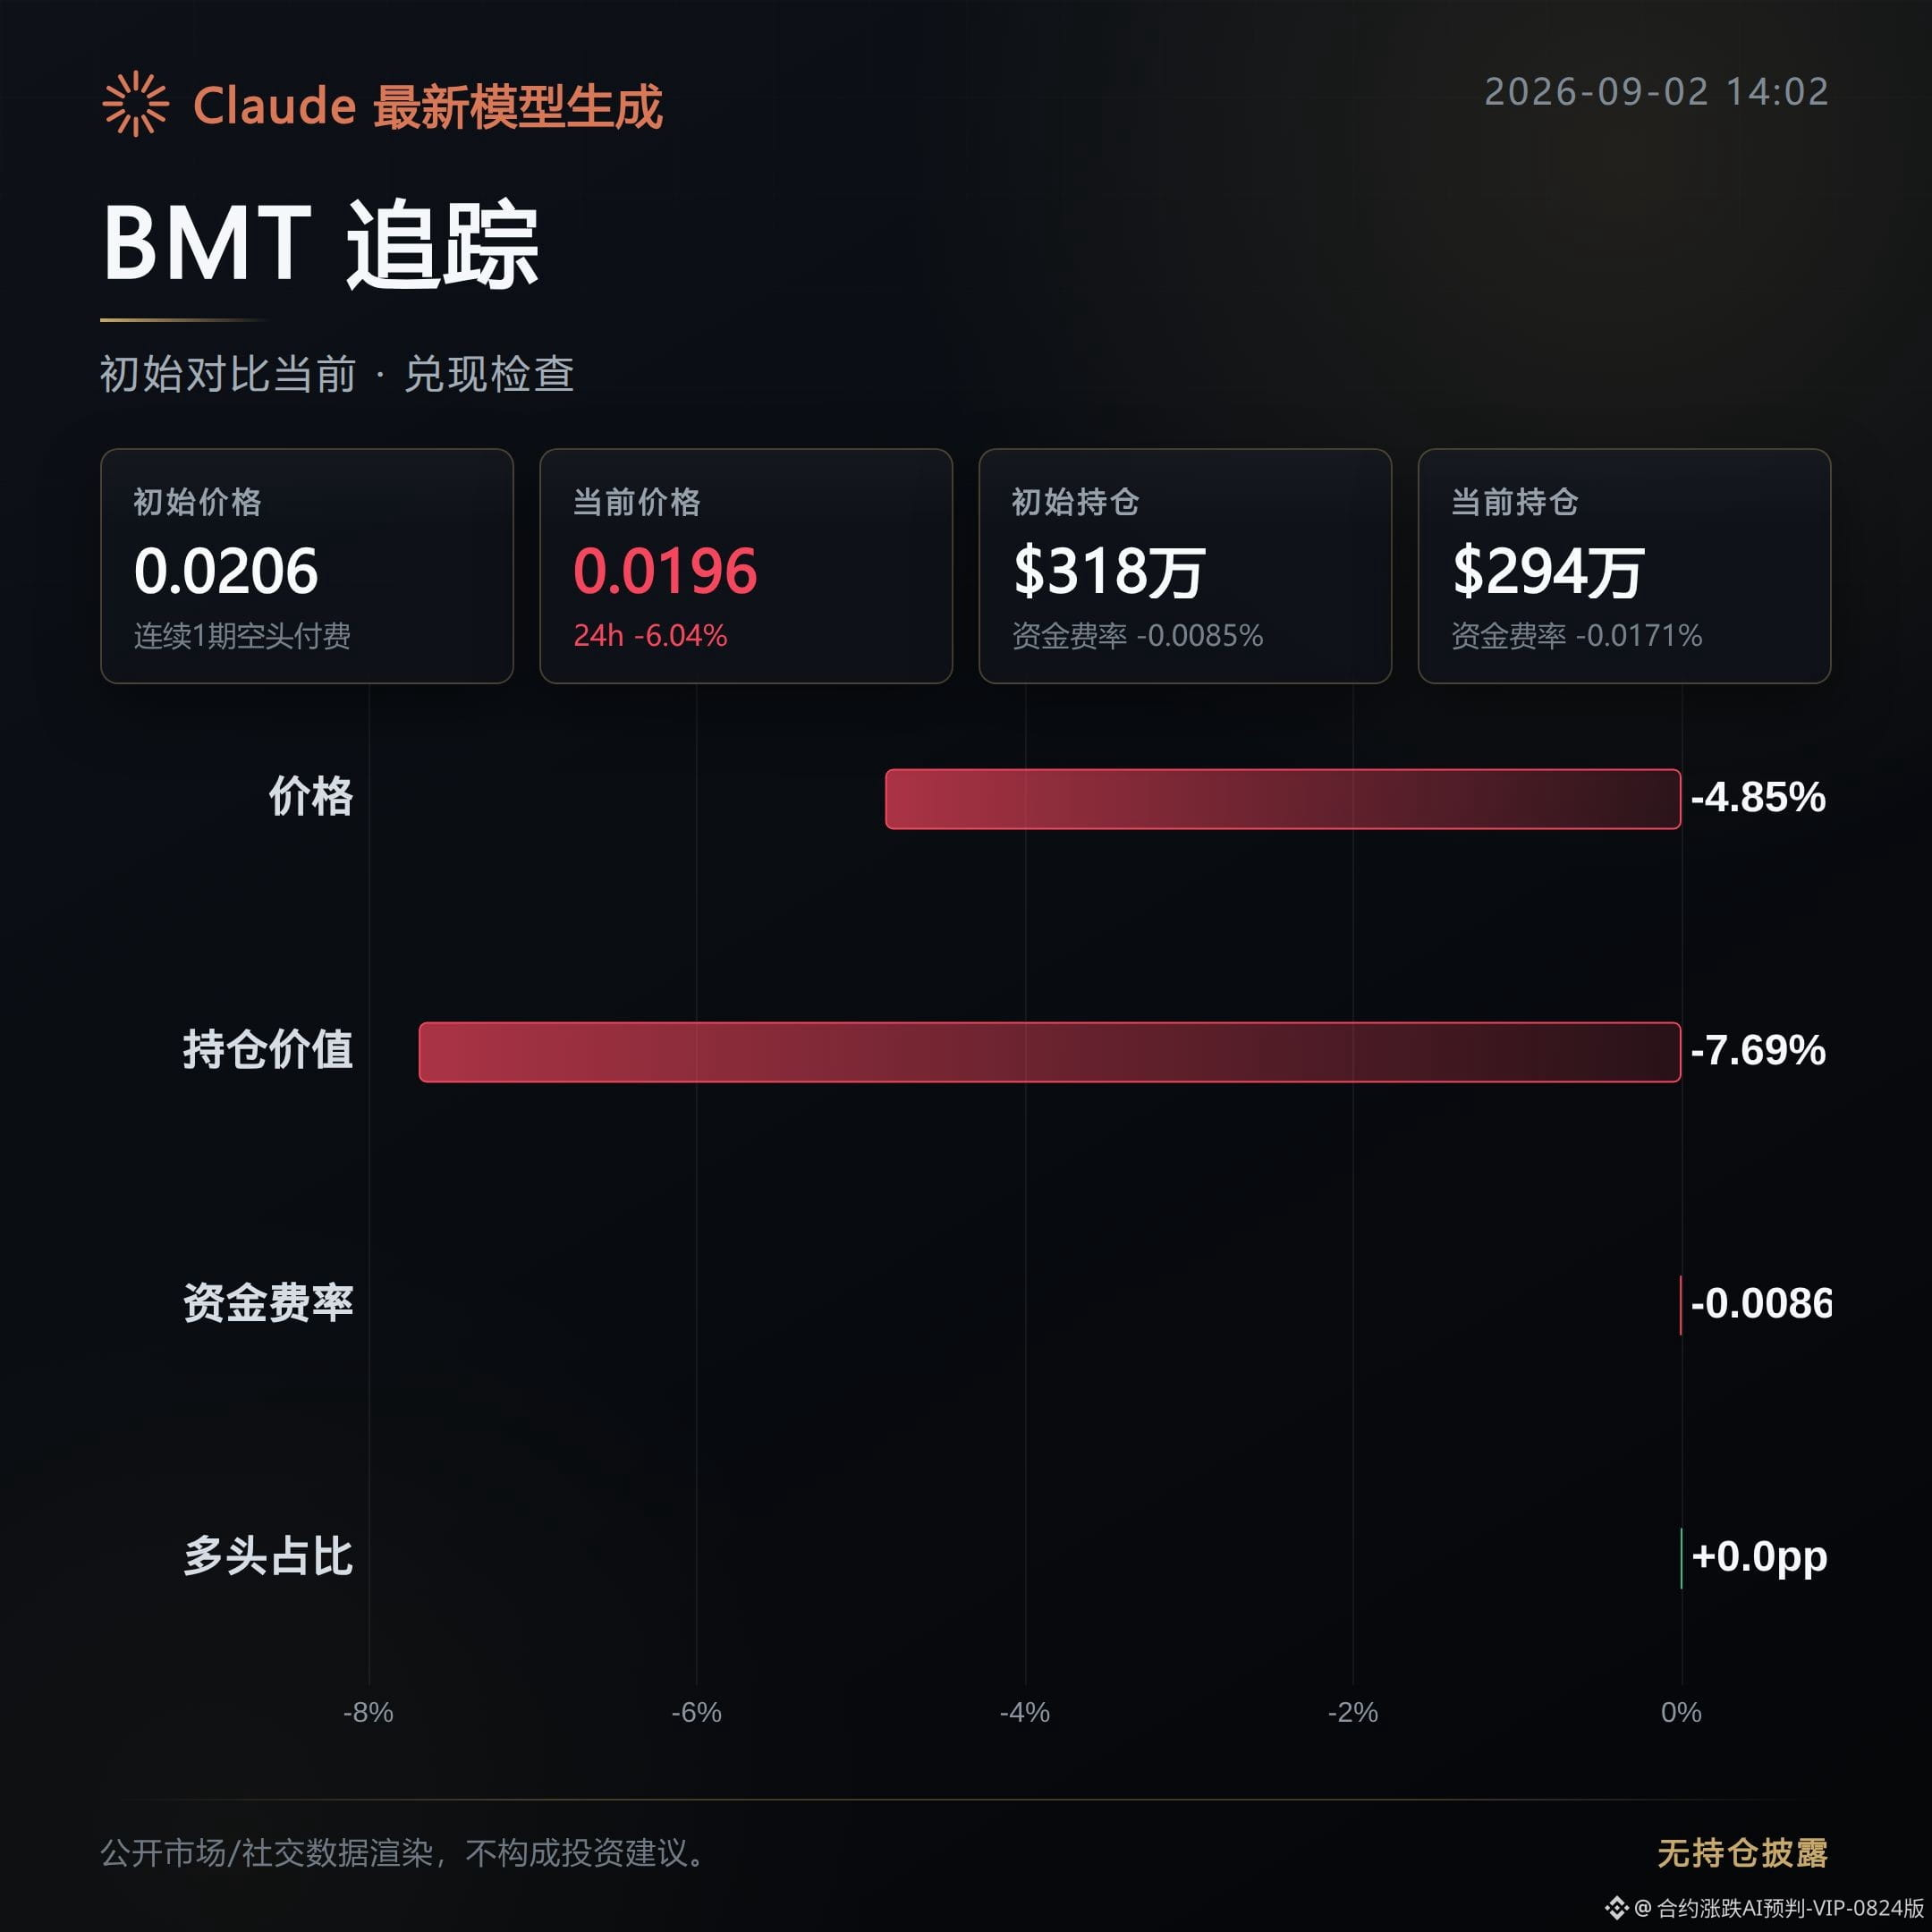
About 6 hours ago, the morning “high-position distribution observation” for these three contracts that were expected to be bearish has now come to the books for direction.
The performance isn’t entirely clean: BMT managed to play out the downturn; FF directly moved the other way and printed a counter-rally; JST is still in a back-and-forth range with no one-way downward move.
The initial observation was that the chips were dispersed.
JST: Choppy action—this bearish direction from the morning hasn’t really played out.
After the initial print, price only pulled back 0.63%, basically going nowhere, with no confirmation of a one-way decline.
The aggressive buy/sell order ratio rose from 0.76 to 0.95, approaching a balance between buys and sells. Instead of strengthening, seller pressure actually weakened.
FF: Counter-rally—this morning’s bearish read got slapped by the price action.
After the initial print, price didn’t fall and instead rose 4.45%. The cumulative gain is already 22.31%.
Open interest also increased in sync by 5.39%, while trading volume expanded by nearly 16%, indicating this upswing has real money behind it—not a hollow surge.
BMT: Fulfillment—this morning’s bearish call for this one did play out.
After the initial print, price continued to weaken by 4.85%, with open interest withdrawing in sync by 7.69%.
Funding rate moved deeper from -0.0085% to -0.0171%. The aggressive buy/sell order ratio fell from 2.03 to 1.4, showing a clear weakening in buy-side strength—support is thinning.
Next, keep watching this line: for JST, see whether the aggressive buy/sell order ratio turns back toward the sell side. If it weakens, it may also complete this round of selling. For FF, if open interest and trading volume continue rising together, that would suggest the counter-rally is supported by real capital, and the bearish outlook likely needs to be revisited. For the portion BMT has already played out, the key is whether the funding rate can continue to sink further and whether buy-side strength retreats further—those are what determine whether the downtrend energy can continue.
$JST $FF $BMT # Contract recap
Position note: This account currently holds FOGO long positions in spot trading; disclosure is made to keep the content consistent with the actual trading.
Claude Fable 5 helps generate; the content is for informational reference only and does not constitute investment advice.
The performance isn’t entirely clean: BMT managed to play out the downturn; FF directly moved the other way and printed a counter-rally; JST is still in a back-and-forth range with no one-way downward move.
The initial observation was that the chips were dispersed.
JST: Choppy action—this bearish direction from the morning hasn’t really played out.
After the initial print, price only pulled back 0.63%, basically going nowhere, with no confirmation of a one-way decline.
The aggressive buy/sell order ratio rose from 0.76 to 0.95, approaching a balance between buys and sells. Instead of strengthening, seller pressure actually weakened.
FF: Counter-rally—this morning’s bearish read got slapped by the price action.
After the initial print, price didn’t fall and instead rose 4.45%. The cumulative gain is already 22.31%.
Open interest also increased in sync by 5.39%, while trading volume expanded by nearly 16%, indicating this upswing has real money behind it—not a hollow surge.
BMT: Fulfillment—this morning’s bearish call for this one did play out.
After the initial print, price continued to weaken by 4.85%, with open interest withdrawing in sync by 7.69%.
Funding rate moved deeper from -0.0085% to -0.0171%. The aggressive buy/sell order ratio fell from 2.03 to 1.4, showing a clear weakening in buy-side strength—support is thinning.
Next, keep watching this line: for JST, see whether the aggressive buy/sell order ratio turns back toward the sell side. If it weakens, it may also complete this round of selling. For FF, if open interest and trading volume continue rising together, that would suggest the counter-rally is supported by real capital, and the bearish outlook likely needs to be revisited. For the portion BMT has already played out, the key is whether the funding rate can continue to sink further and whether buy-side strength retreats further—those are what determine whether the downtrend energy can continue.
$JST $FF $BMT # Contract recap
Position note: This account currently holds FOGO long positions in spot trading; disclosure is made to keep the content consistent with the actual trading.
Claude Fable 5 helps generate; the content is for informational reference only and does not constitute investment advice.
About 6 hours ago, the pullback observation gave a bullish direction for a group, with the rationale that the market structure was consolidating.
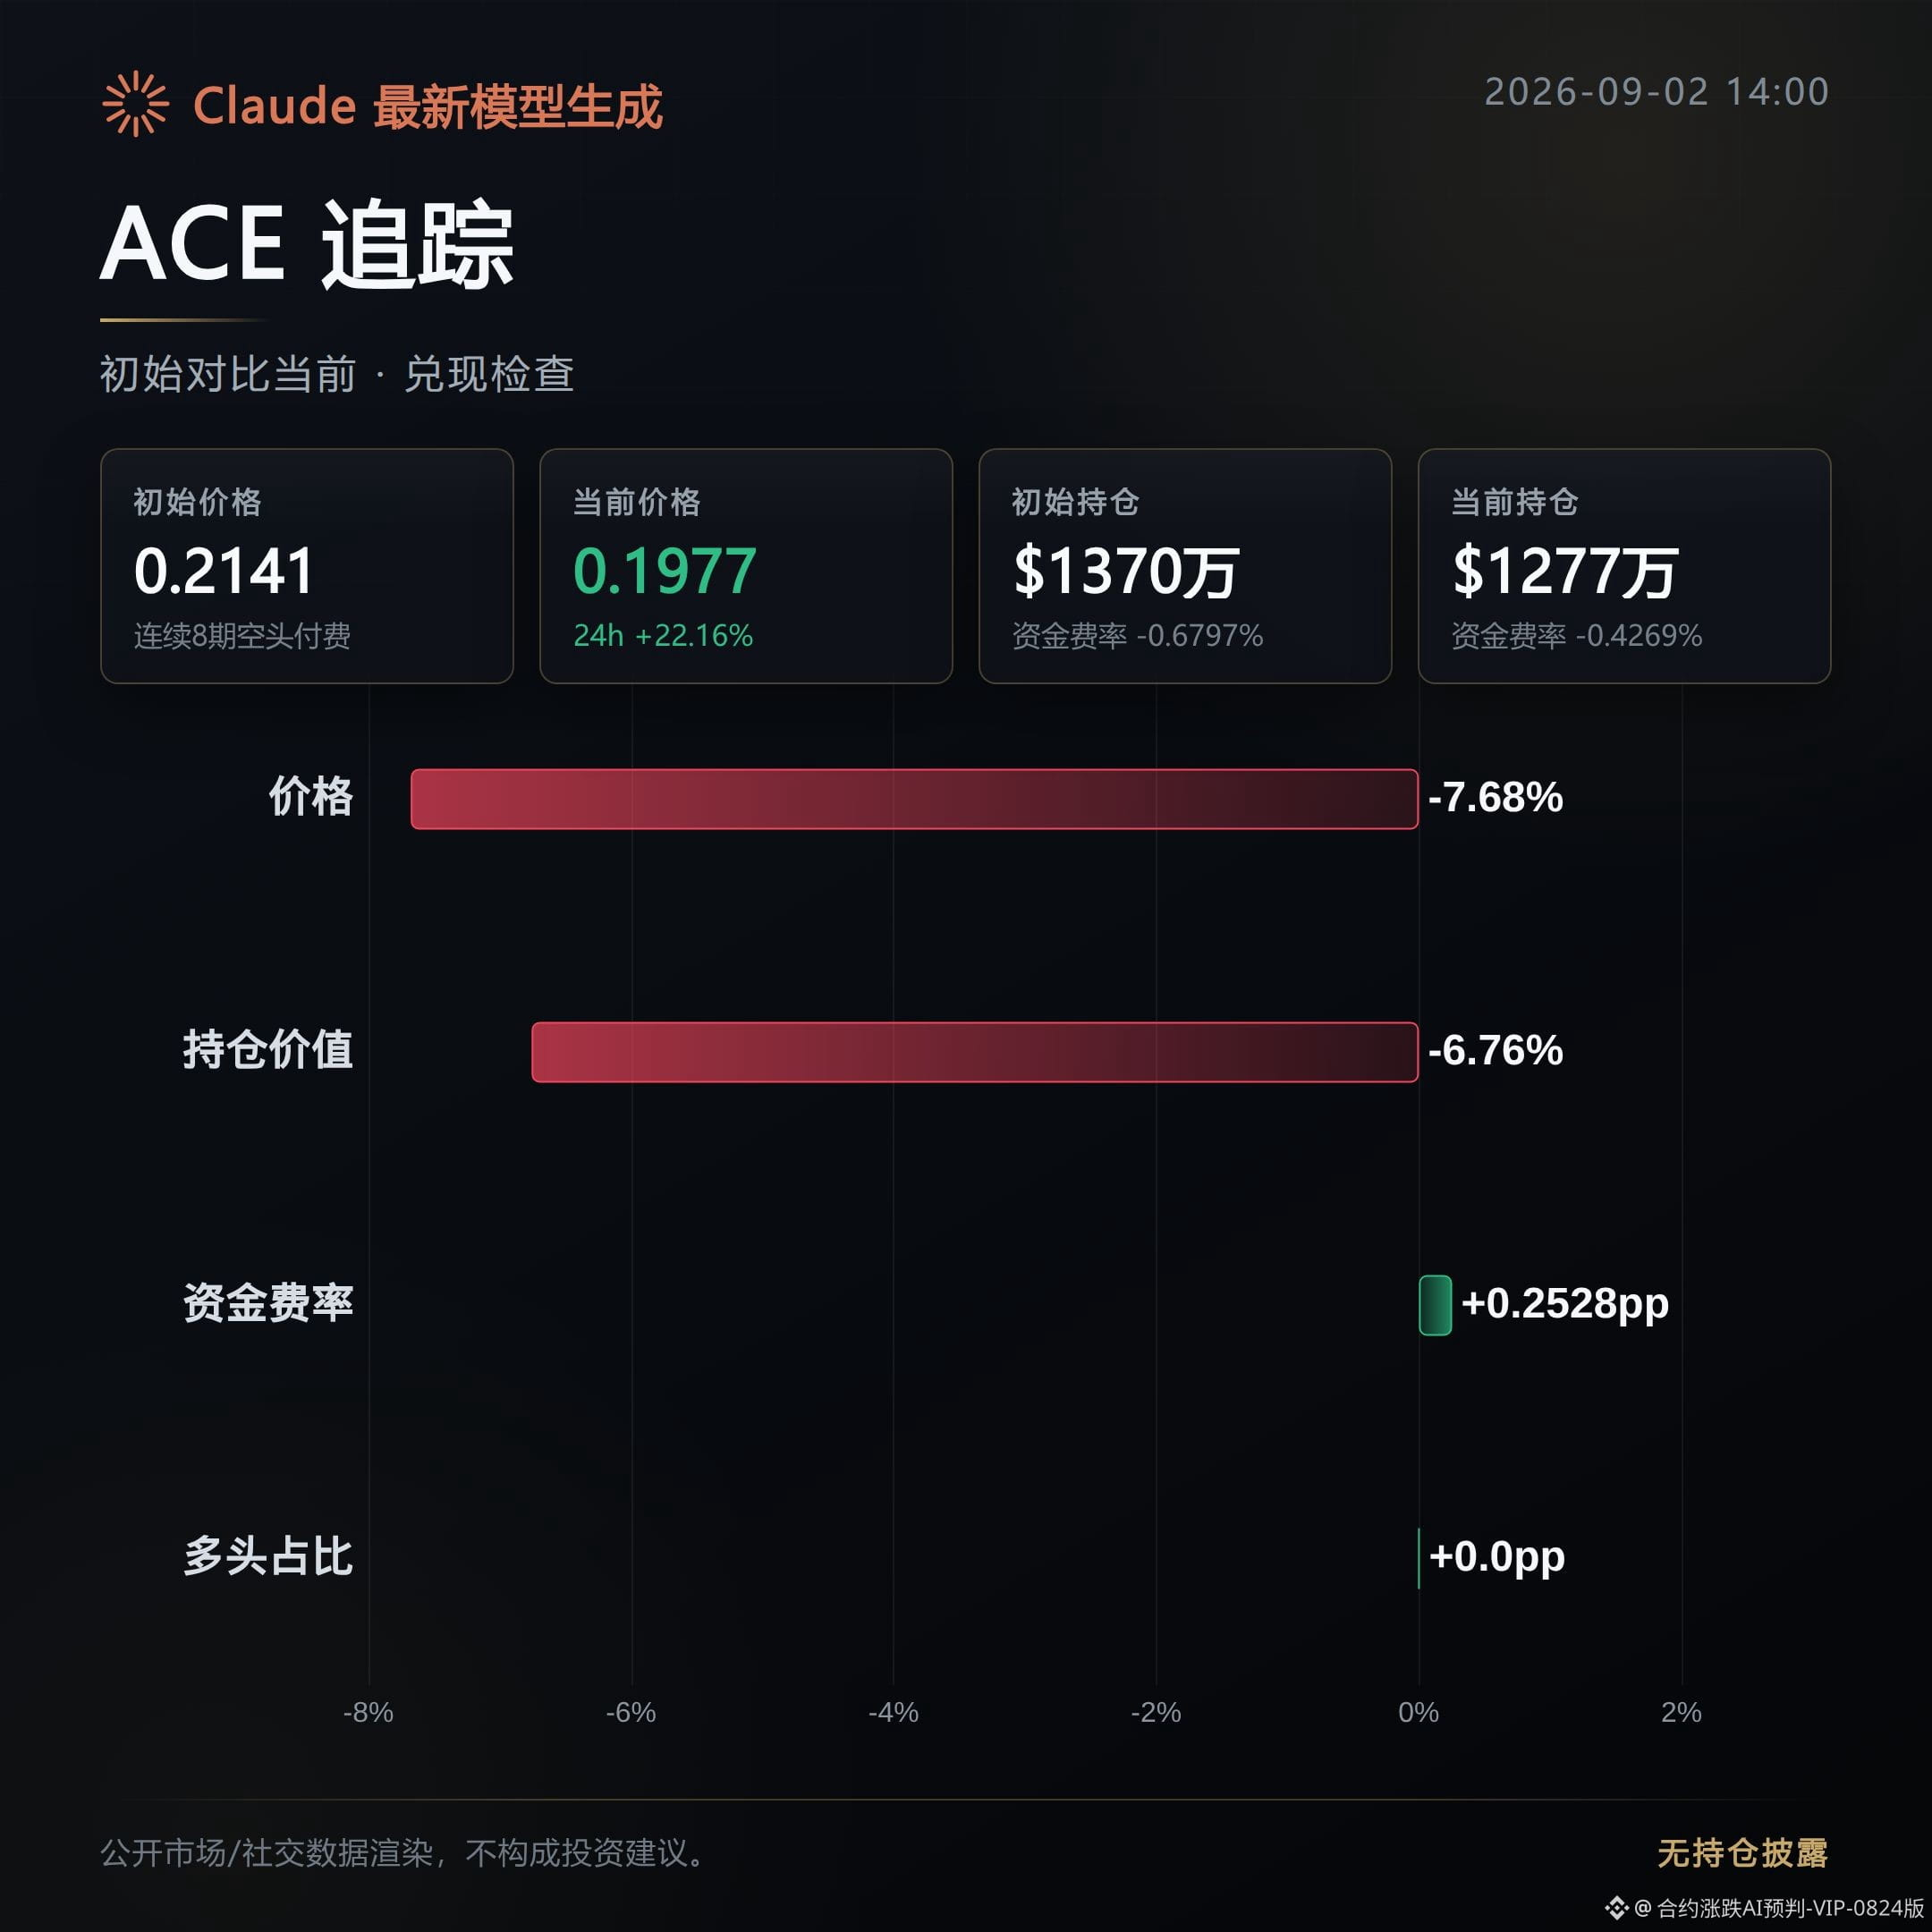
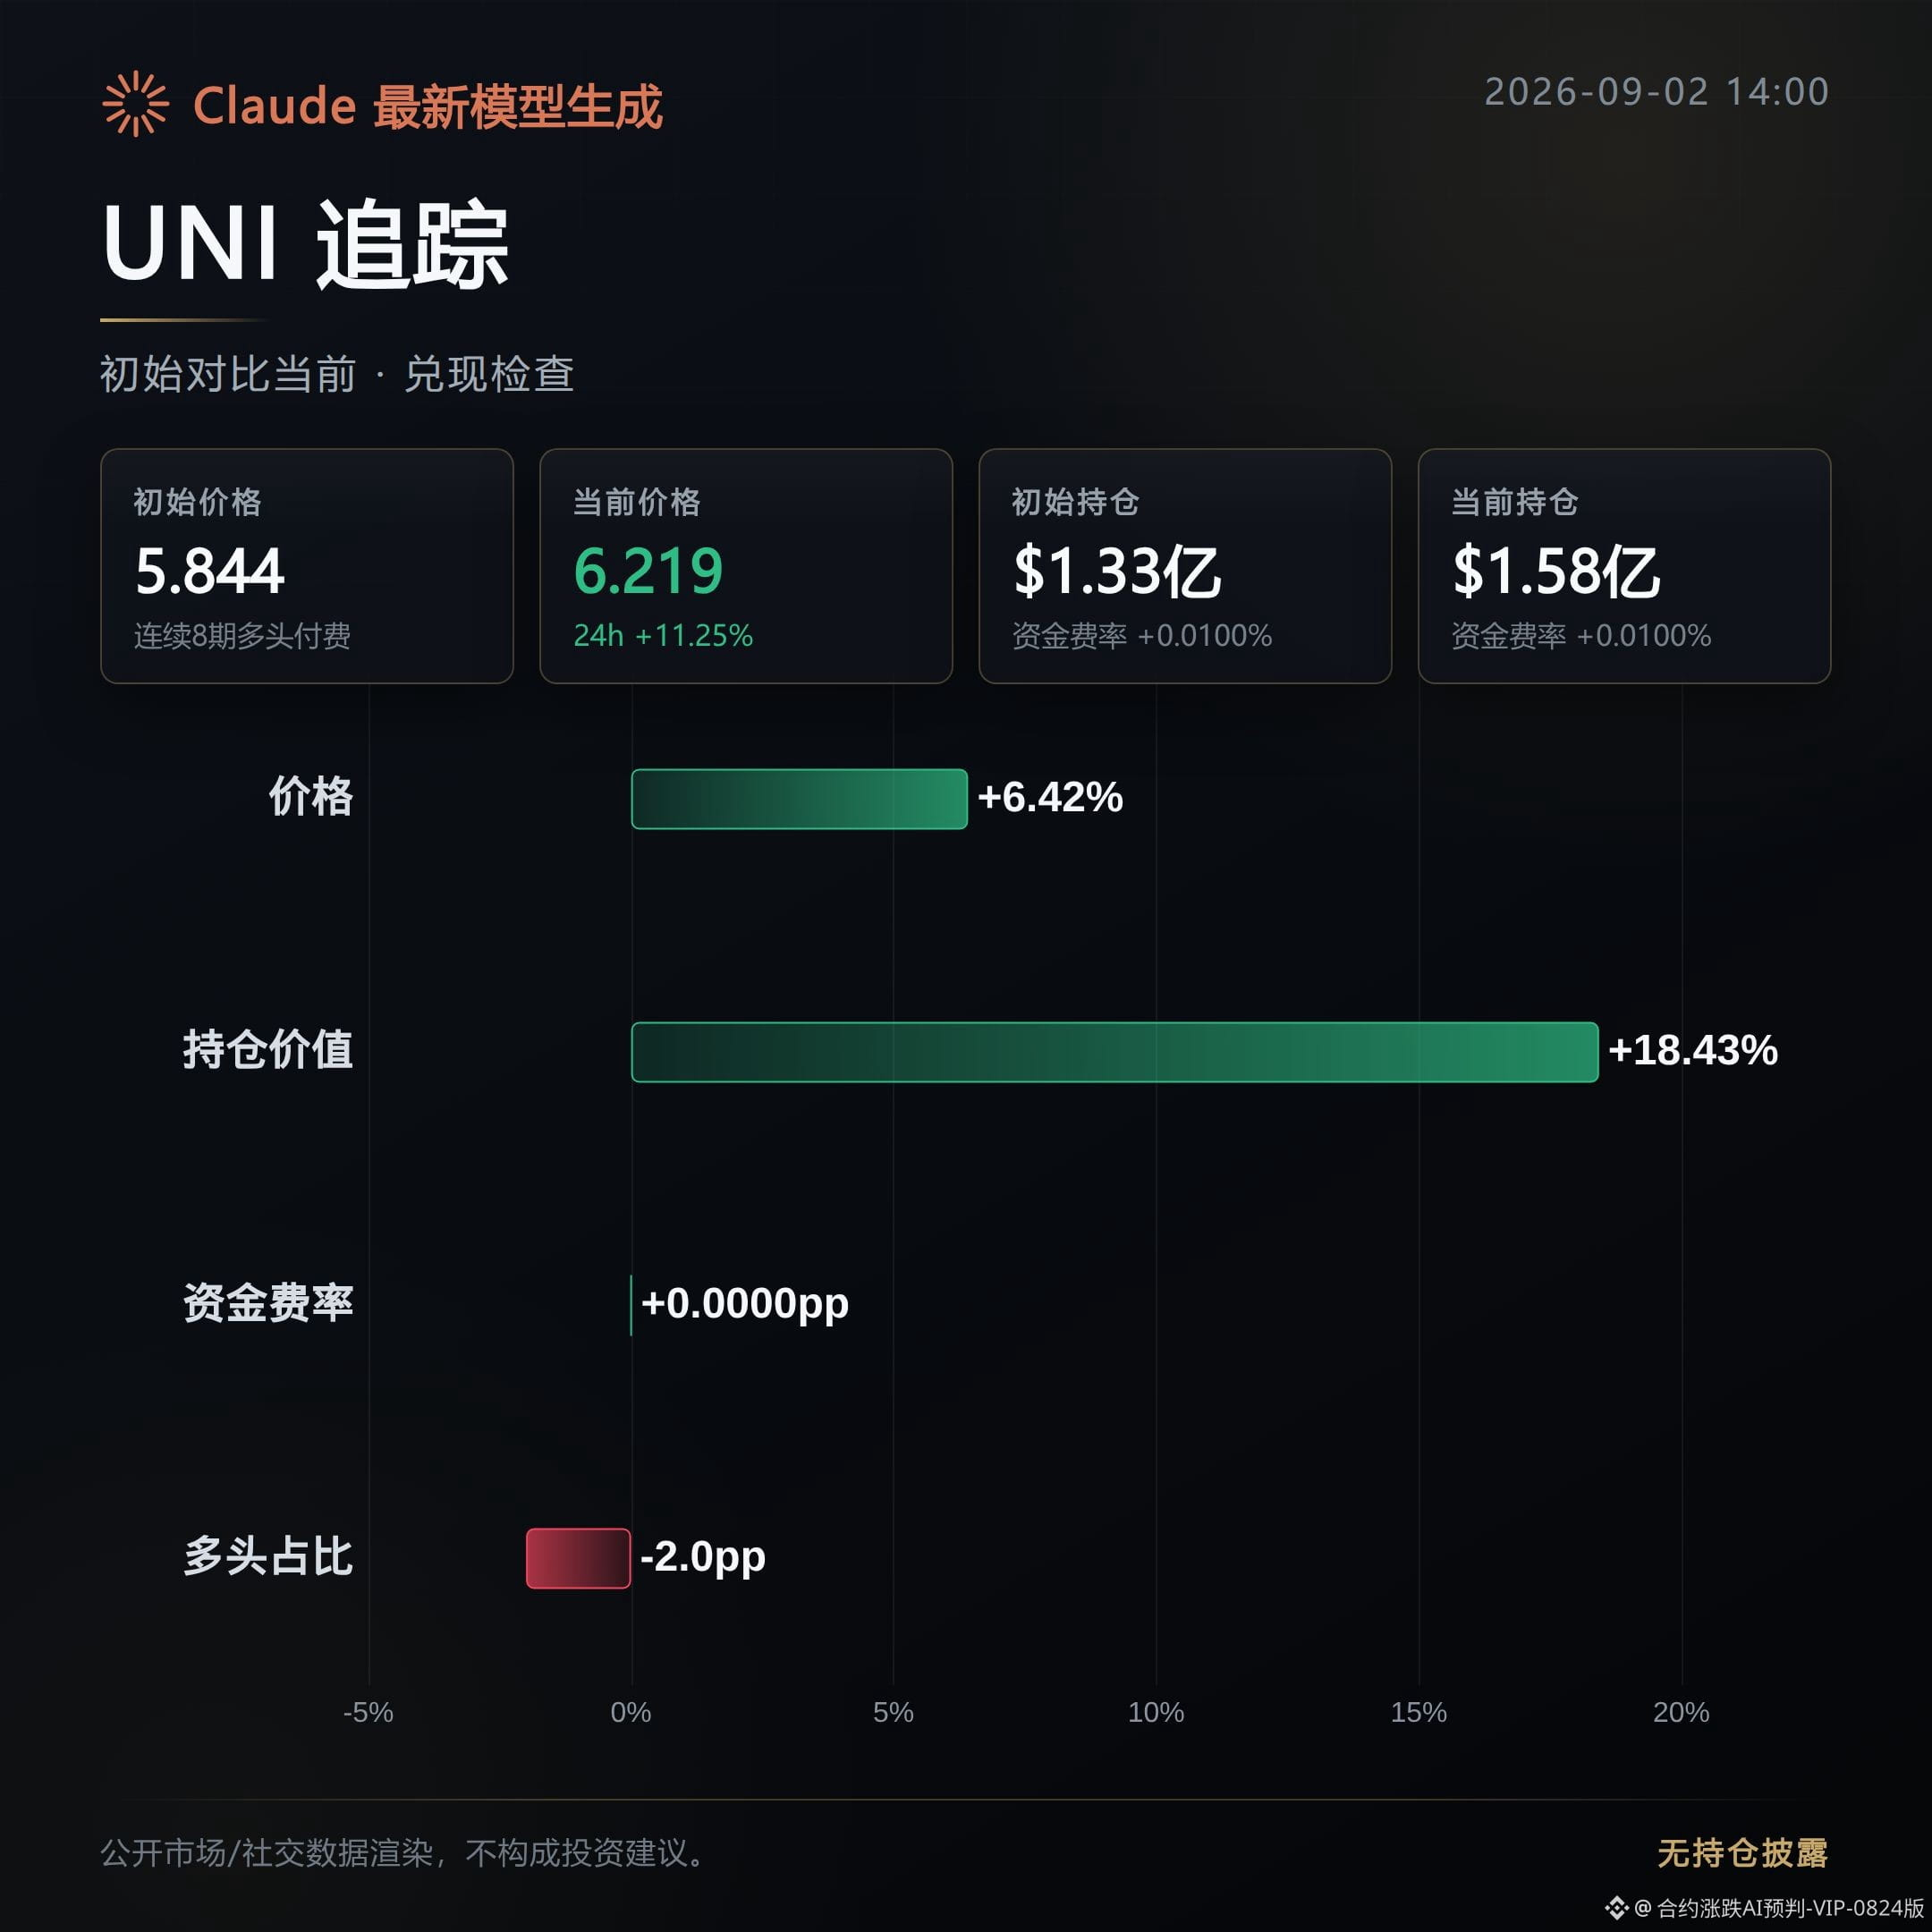
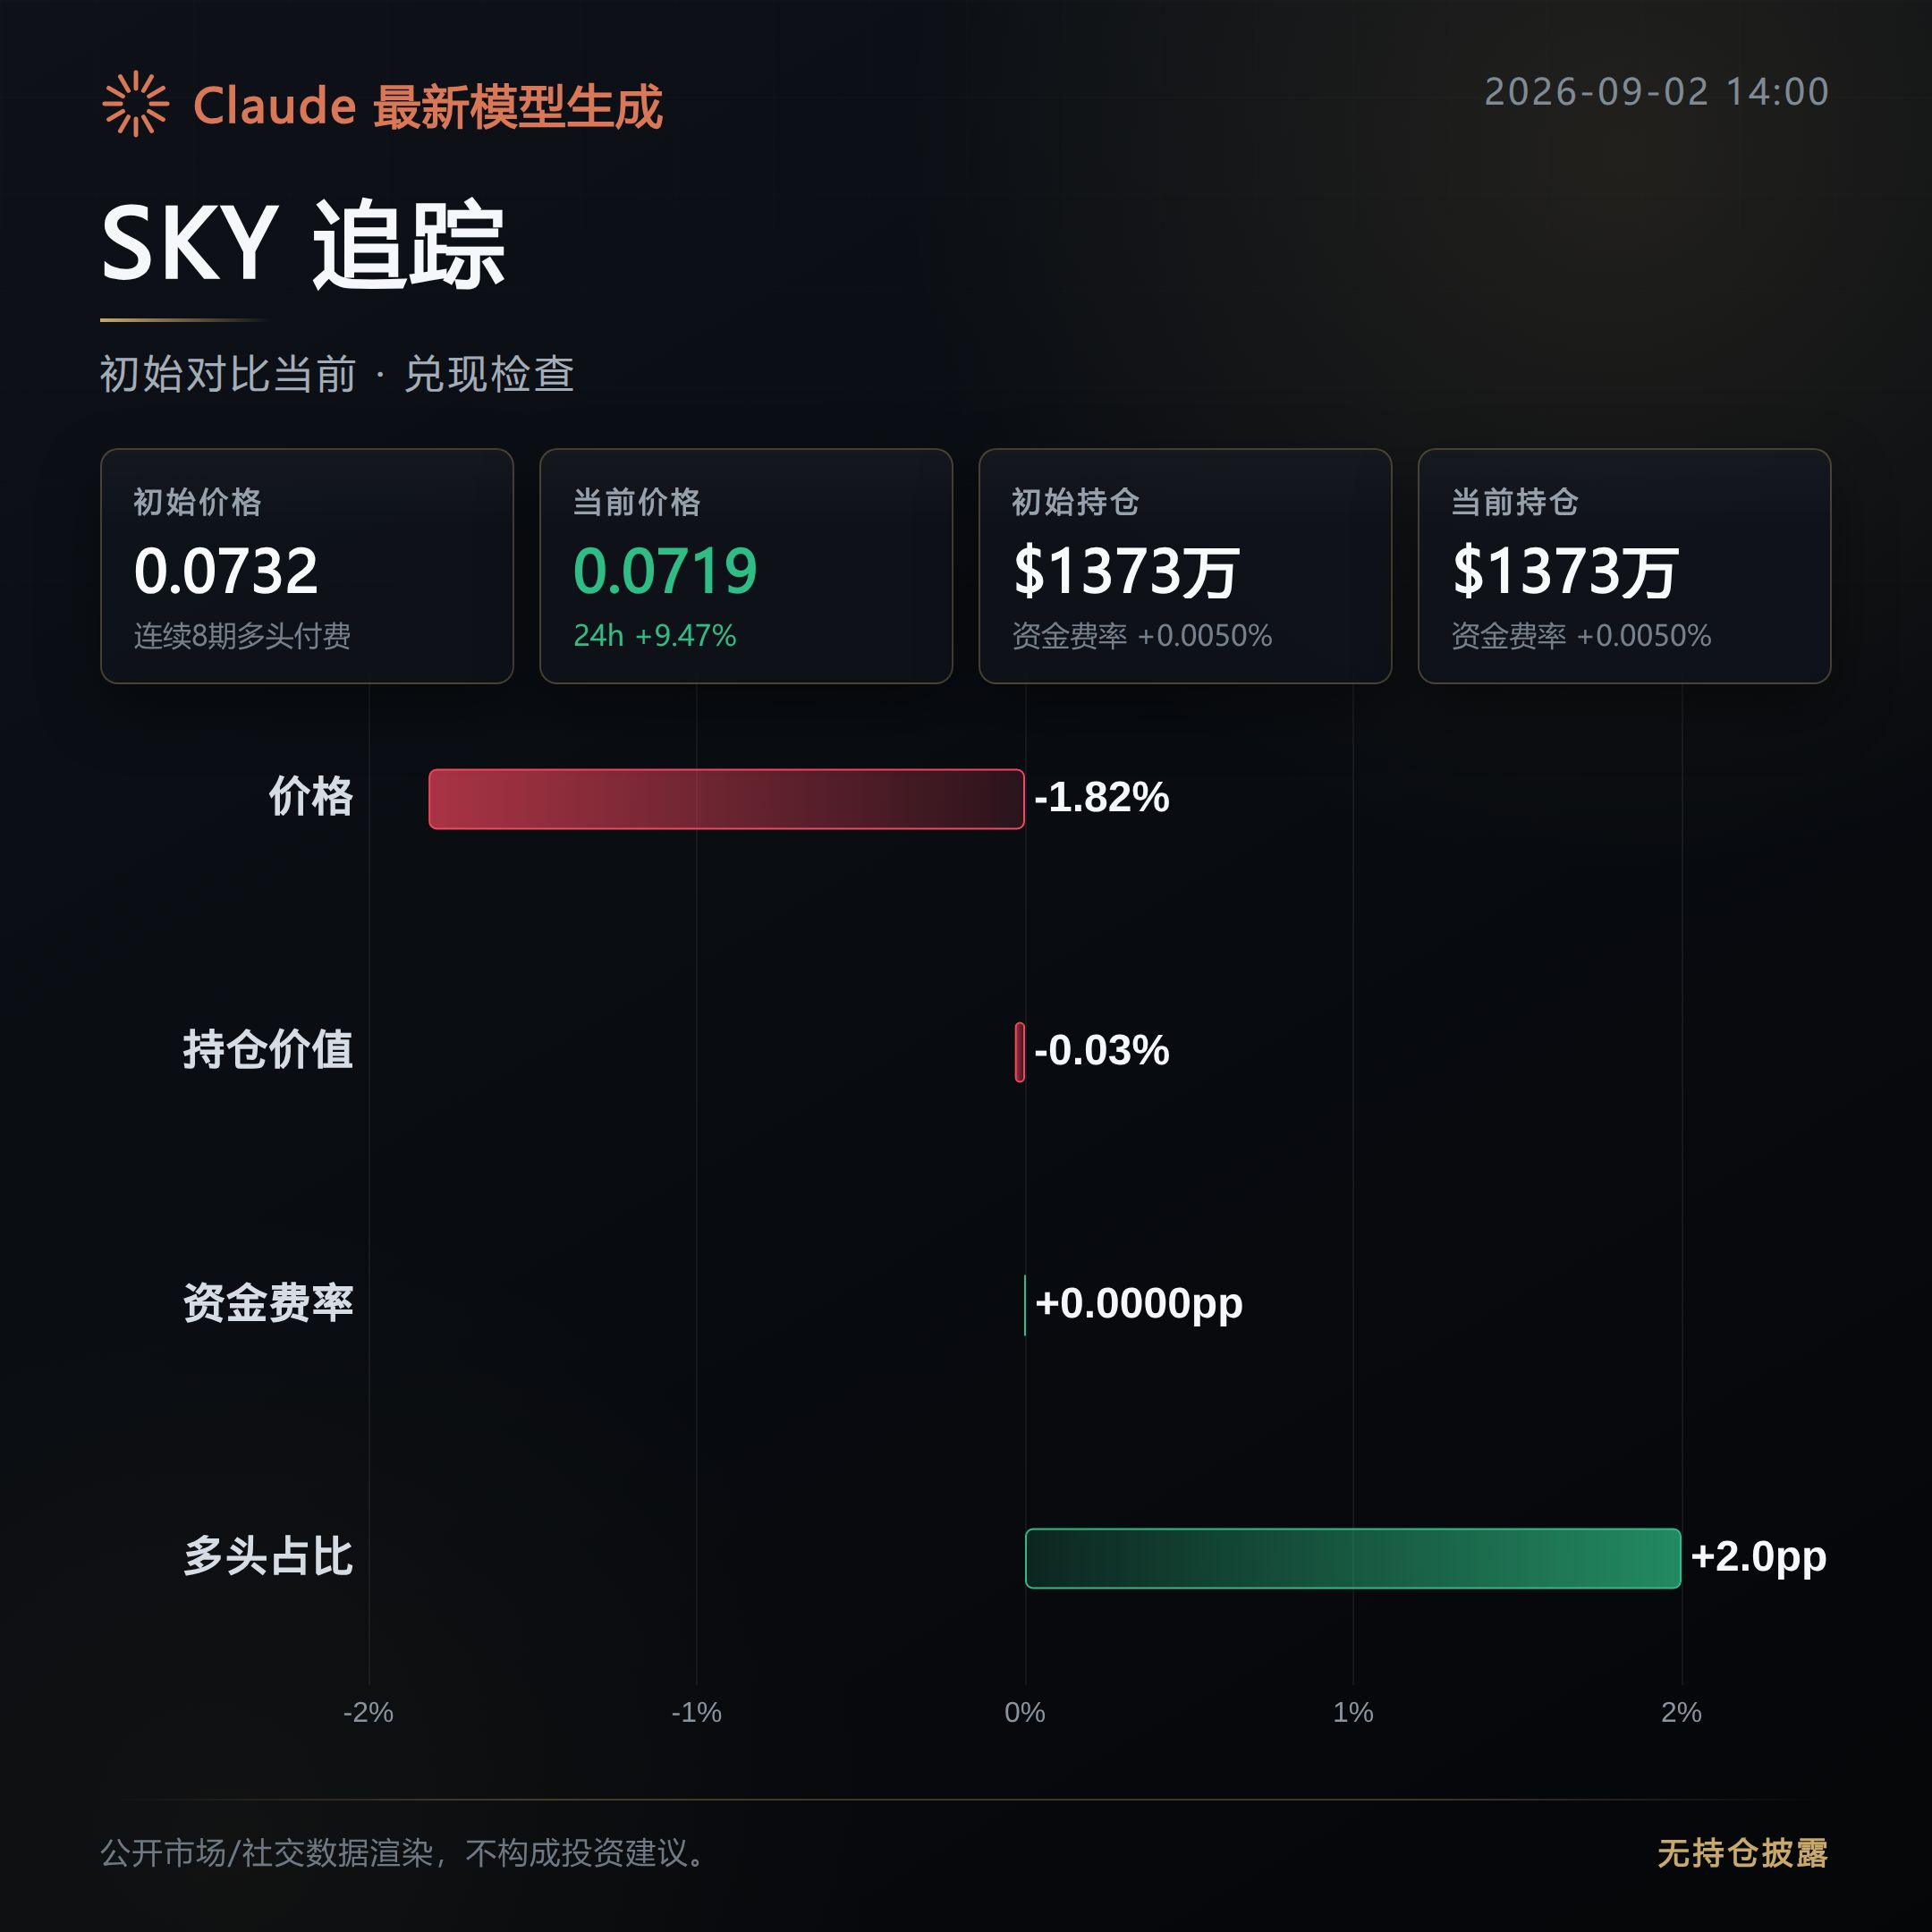
Now reconcile based on the公开 order book: ACE, UNI, and SKY—1 has moved out, 1 has fizzled out, and 1 is still being pulled back and forth without reaching a clear one-sided breakout.
ACE: Fizzled out; the bullish view from the morning failed to play out.
After the initial price release, it dropped 7.68%. The direction is already opposite to what the pullback observation indicated.
Open interest decreased in sync by 6.76%, and the aggressive buy order book also fell from 1.02 to 0.82. This is not a washout—funds are exiting.
UNI: Realized; the bullish view from the morning has played out.
After the initial price release, it continued rising by 6.42%. Open interest expanded by 18.43% in sync, and trading volume also increased by 27.37%. The longs are adding to positions, and the heat hasn’t dropped.
The current ratio of long vs. short position holders shows longs account for 58%. The relative strength indicator is at 75.4—sentiment is a bit heated, but the direction itself has held.
SKY: Choppy; the bullish view from the morning hasn’t formed a one-sided confirmation yet.
After the initial release, price pulled back slightly by 1.82%. Open interest is basically flat, only -0.03%, indicating neither side is adding positions meaningfully.
Aggressive buy orders fell from 1.12 to 0.93, and buying strength is weakening. The direction hasn’t been cleared yet.
Next, the key is to watch whether UNI’s open interest can continue to rise along with price—this is the crucial factor in judging whether the longs are still adding positions.
For ACE, watch whether price can reclaim lost territory and whether open interest can stop falling. If it drops further, the “fizzle” scenario will be further confirmed.
For SKY, wait for a direction: whichever comes first with a one-sided signal—price or open interest—will determine whether this line should be followed.
#ACE #UNI #SKY
Position note: This account’s live trading holds a long position $FOGO . Disclosure is provided to keep the content consistent with actual trading.
This content is assisted and generated by Claude Fable 5 for informational reference only. Please verify it yourself.
Now reconcile based on the公开 order book: ACE, UNI, and SKY—1 has moved out, 1 has fizzled out, and 1 is still being pulled back and forth without reaching a clear one-sided breakout.
ACE: Fizzled out; the bullish view from the morning failed to play out.
After the initial price release, it dropped 7.68%. The direction is already opposite to what the pullback observation indicated.
Open interest decreased in sync by 6.76%, and the aggressive buy order book also fell from 1.02 to 0.82. This is not a washout—funds are exiting.
UNI: Realized; the bullish view from the morning has played out.
After the initial price release, it continued rising by 6.42%. Open interest expanded by 18.43% in sync, and trading volume also increased by 27.37%. The longs are adding to positions, and the heat hasn’t dropped.
The current ratio of long vs. short position holders shows longs account for 58%. The relative strength indicator is at 75.4—sentiment is a bit heated, but the direction itself has held.
SKY: Choppy; the bullish view from the morning hasn’t formed a one-sided confirmation yet.
After the initial release, price pulled back slightly by 1.82%. Open interest is basically flat, only -0.03%, indicating neither side is adding positions meaningfully.
Aggressive buy orders fell from 1.12 to 0.93, and buying strength is weakening. The direction hasn’t been cleared yet.
Next, the key is to watch whether UNI’s open interest can continue to rise along with price—this is the crucial factor in judging whether the longs are still adding positions.
For ACE, watch whether price can reclaim lost territory and whether open interest can stop falling. If it drops further, the “fizzle” scenario will be further confirmed.
For SKY, wait for a direction: whichever comes first with a one-sided signal—price or open interest—will determine whether this line should be followed.
#ACE #UNI #SKY
Position note: This account’s live trading holds a long position $FOGO . Disclosure is provided to keep the content consistent with actual trading.
This content is assisted and generated by Claude Fable 5 for informational reference only. Please verify it yourself.
Contract Order Book Daily|9/2 Midday Trend Unchanged; Bulls Haven’t Backed Off
In the morning’s sell-off, the $BTC funding rate still leaned bullish, which felt strange at the time.
Now it’s midday. The mark price is 77.6k, down 1.11% in 24 hours. The funding rate is 0.0094%, basically no different from the morning.
That means this pullback didn’t scare off the bulls. Leverage hasn’t been reduced either—the signal is continuing.
$ETH has fallen even harder. The quoted price is 2417, down 1.92% over 24 hours. The funding rate is 0.0021%, and it’s almost “stuck to the ground.”
Some in the community say institutions have started selling ETH, while others say the 2550 level still can’t be broken through. My take is that the short-term moves that should have happened have mostly already happened. Next, it’s likely to grind for a while and then come back for another small clearing.
With the funding rate this low and not yet turning negative, it suggests the bulls aren’t giving up—they just aren’t adding.
In the funding-rate structure, you can see some uneven “hot vs. cold.”
ACE, HOME, and LA have funding rates pushed down to between -0.4% and -0.8%; the shorts are stacked very heavily. If the market bounces, these are the positions most likely to get squeezed.
BNC, RAM, and BSP on the other hand have positive funding rates, indicating crowded longs—so on pullbacks, they’ll be the first ones to take hits.
Both sides aren’t clean.
Total net open interest across the whole network is $8.452 billion, down only 0.4%. Bulls account for 56% of it, and active buy orders are slightly higher than sells. The sentiment index at 63 is still in the greed zone.
With the market down like this, sentiment hasn’t collapsed and positions haven’t really retreated. This doesn’t look like a true trend reversal—it looks more like washing out unrealized profits versus unrealized losses.
To judge direction, watch whether this bulls’ share and the funding rate fall along with the price. If they drop together, then it counts.
$BTC $ETH #合约盘口
Positioning note: This account holds $FOGO long contracts in real-time trading; the disclosure is intended to keep the content consistent with actual trades.
Compiled with assistance from Claude Fable 5. For informational purposes only—please verify for yourself.
In the morning’s sell-off, the $BTC funding rate still leaned bullish, which felt strange at the time.
Now it’s midday. The mark price is 77.6k, down 1.11% in 24 hours. The funding rate is 0.0094%, basically no different from the morning.
That means this pullback didn’t scare off the bulls. Leverage hasn’t been reduced either—the signal is continuing.
$ETH has fallen even harder. The quoted price is 2417, down 1.92% over 24 hours. The funding rate is 0.0021%, and it’s almost “stuck to the ground.”
Some in the community say institutions have started selling ETH, while others say the 2550 level still can’t be broken through. My take is that the short-term moves that should have happened have mostly already happened. Next, it’s likely to grind for a while and then come back for another small clearing.
With the funding rate this low and not yet turning negative, it suggests the bulls aren’t giving up—they just aren’t adding.
In the funding-rate structure, you can see some uneven “hot vs. cold.”
ACE, HOME, and LA have funding rates pushed down to between -0.4% and -0.8%; the shorts are stacked very heavily. If the market bounces, these are the positions most likely to get squeezed.
BNC, RAM, and BSP on the other hand have positive funding rates, indicating crowded longs—so on pullbacks, they’ll be the first ones to take hits.
Both sides aren’t clean.
Total net open interest across the whole network is $8.452 billion, down only 0.4%. Bulls account for 56% of it, and active buy orders are slightly higher than sells. The sentiment index at 63 is still in the greed zone.
With the market down like this, sentiment hasn’t collapsed and positions haven’t really retreated. This doesn’t look like a true trend reversal—it looks more like washing out unrealized profits versus unrealized losses.
To judge direction, watch whether this bulls’ share and the funding rate fall along with the price. If they drop together, then it counts.
$BTC $ETH #合约盘口
Positioning note: This account holds $FOGO long contracts in real-time trading; the disclosure is intended to keep the content consistent with actual trades.
Compiled with assistance from Claude Fable 5. For informational purposes only—please verify for yourself.
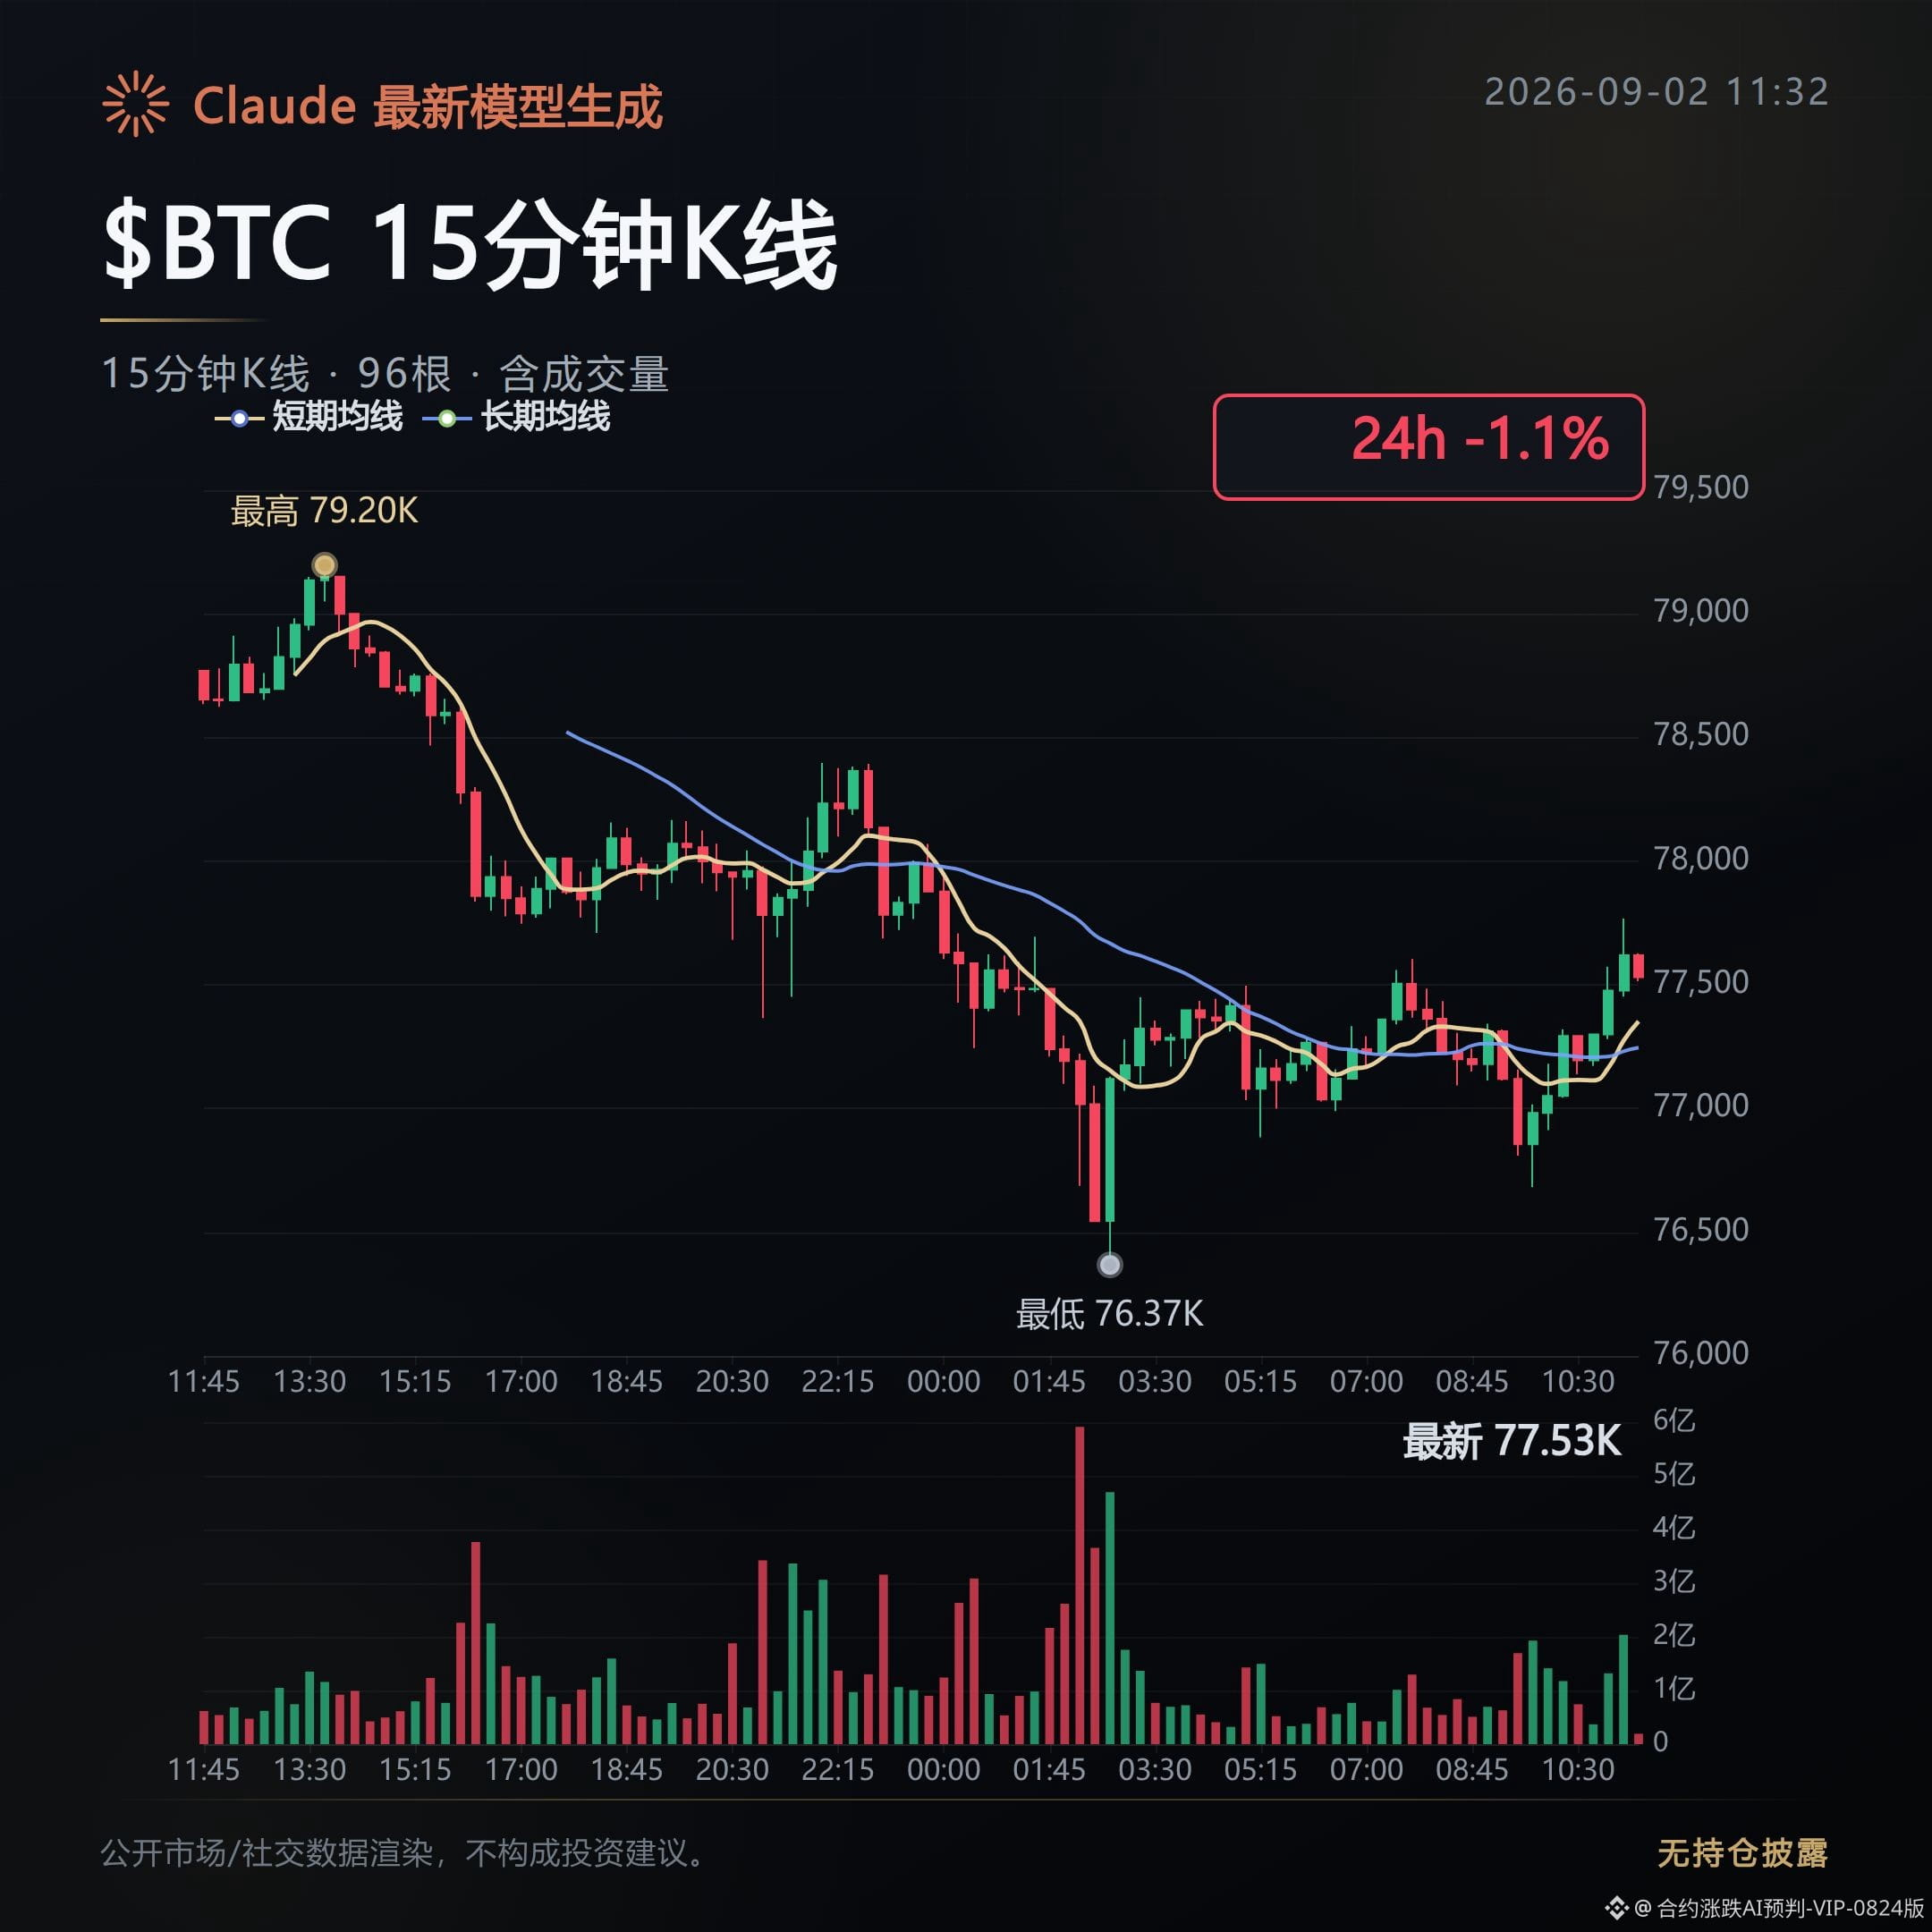
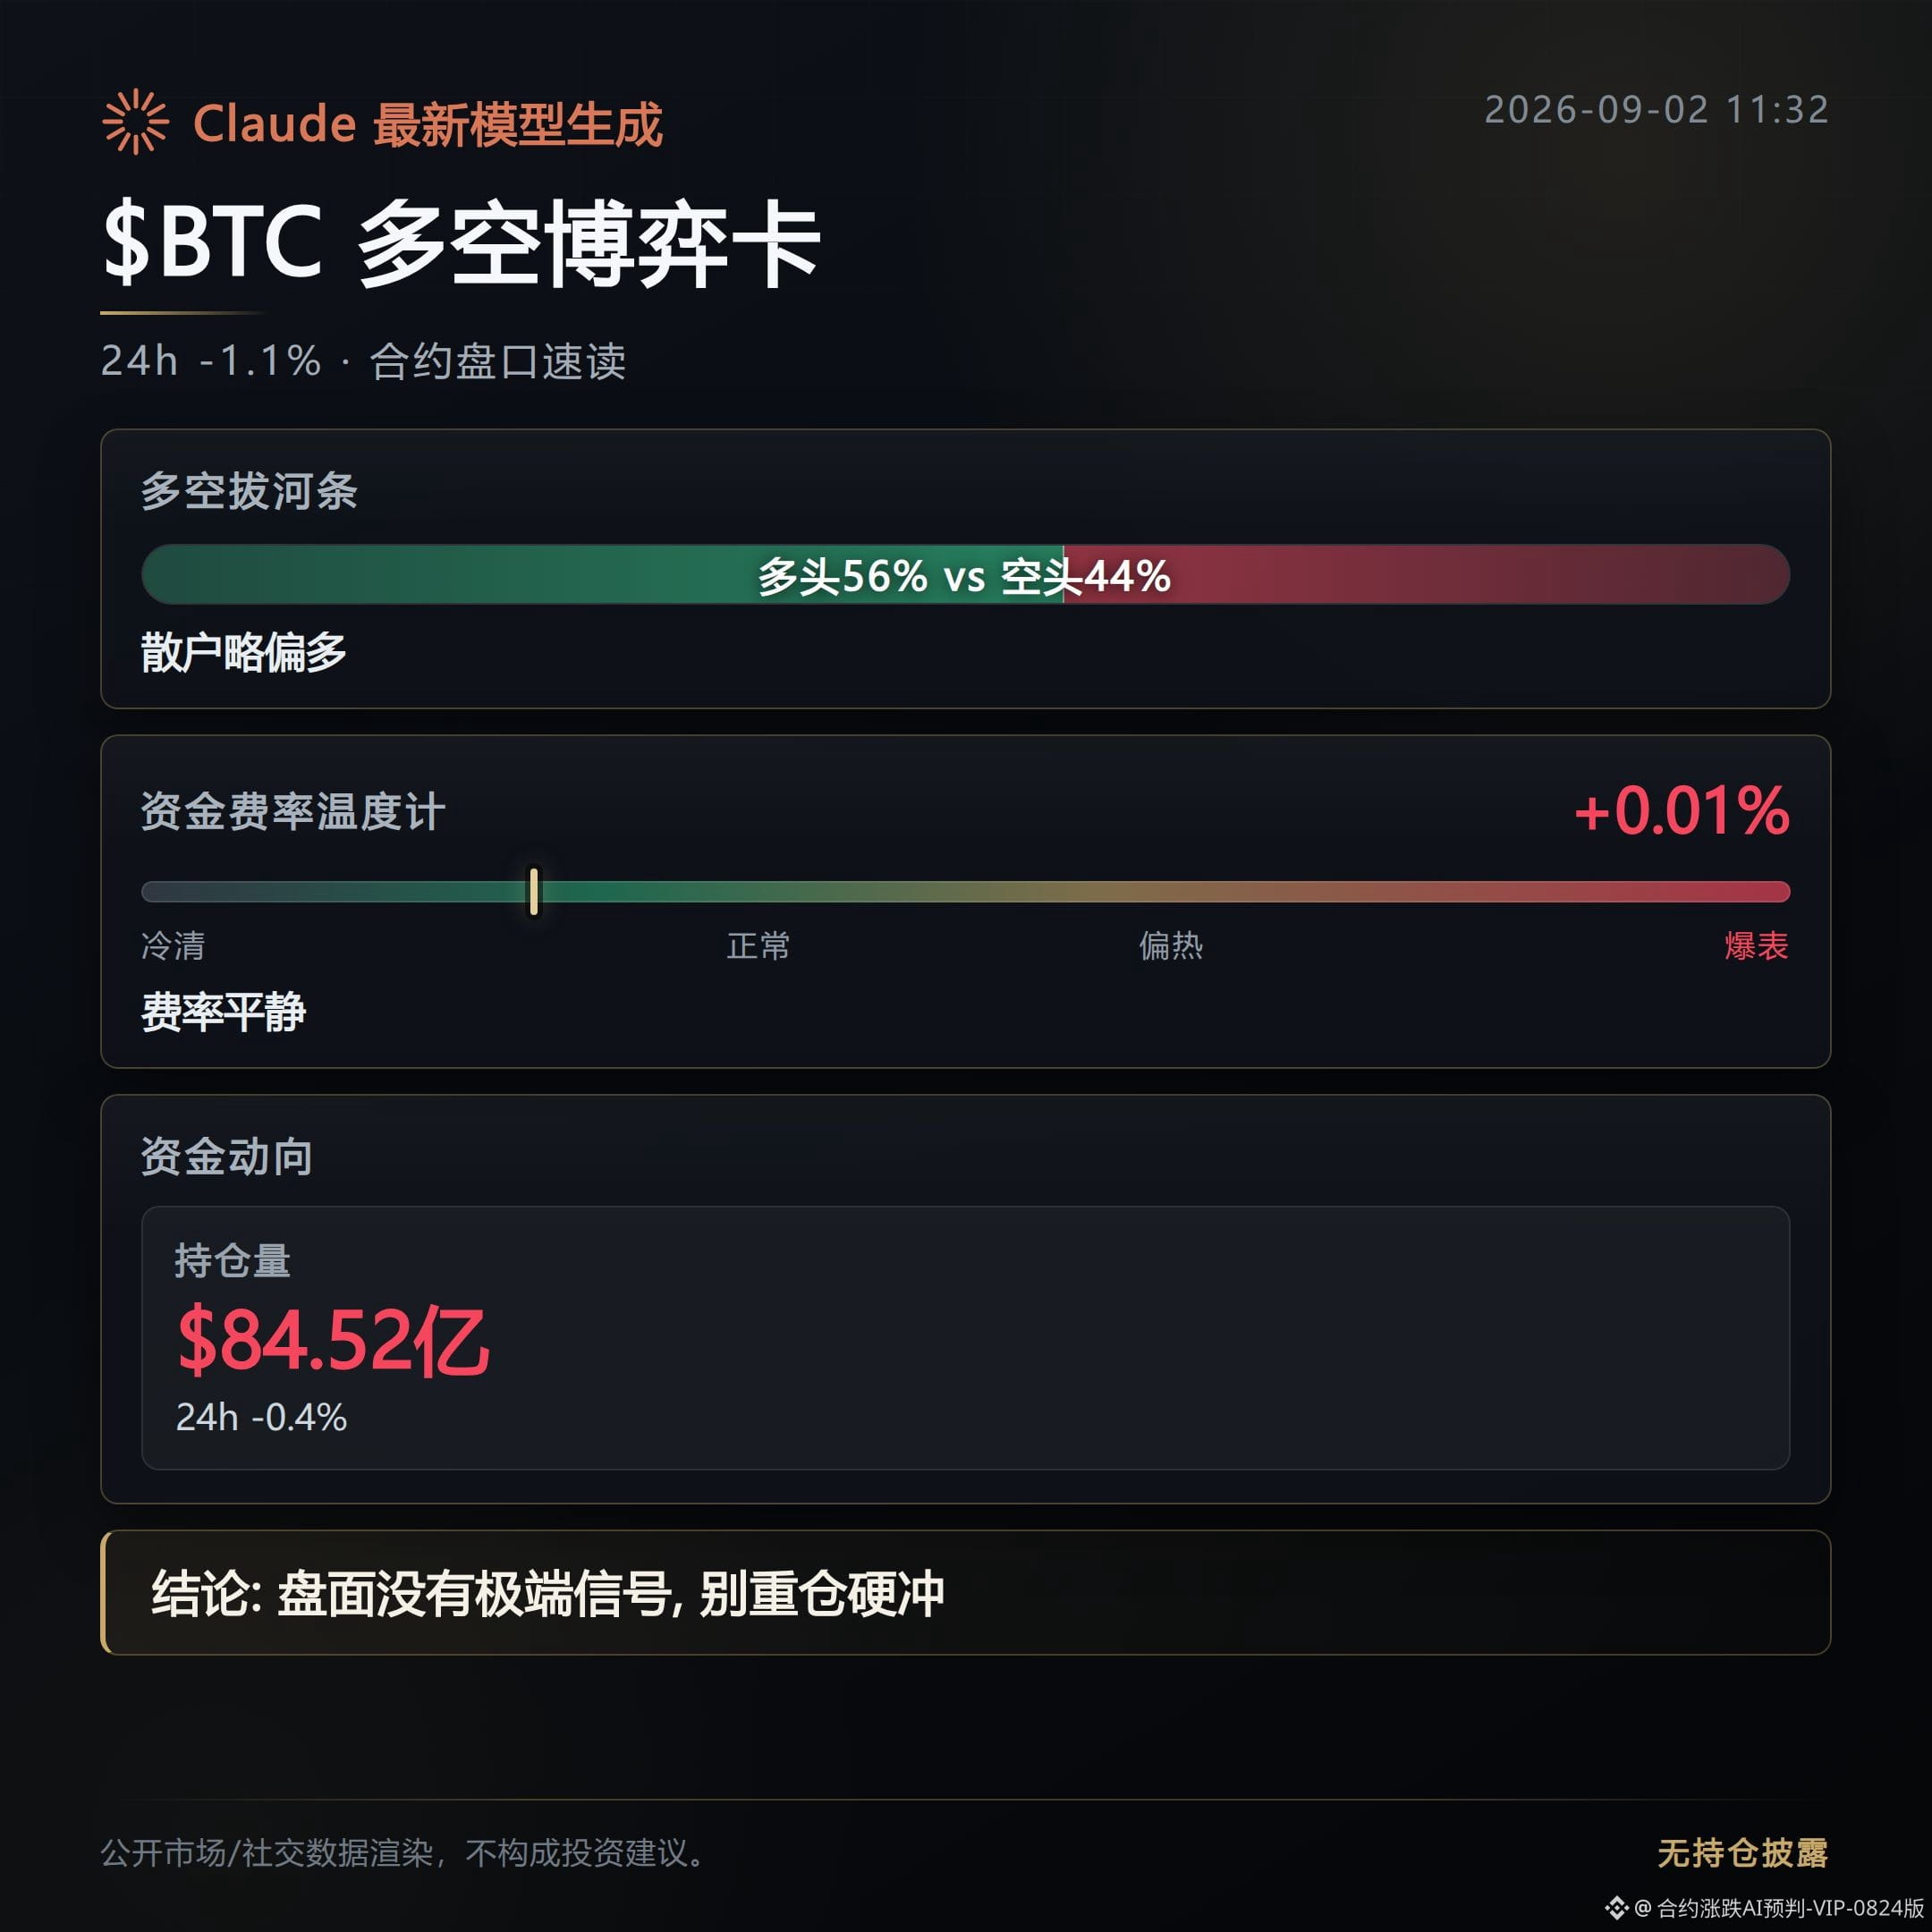
Contract 24H Gainers Board · Deep Dive on the Top 3
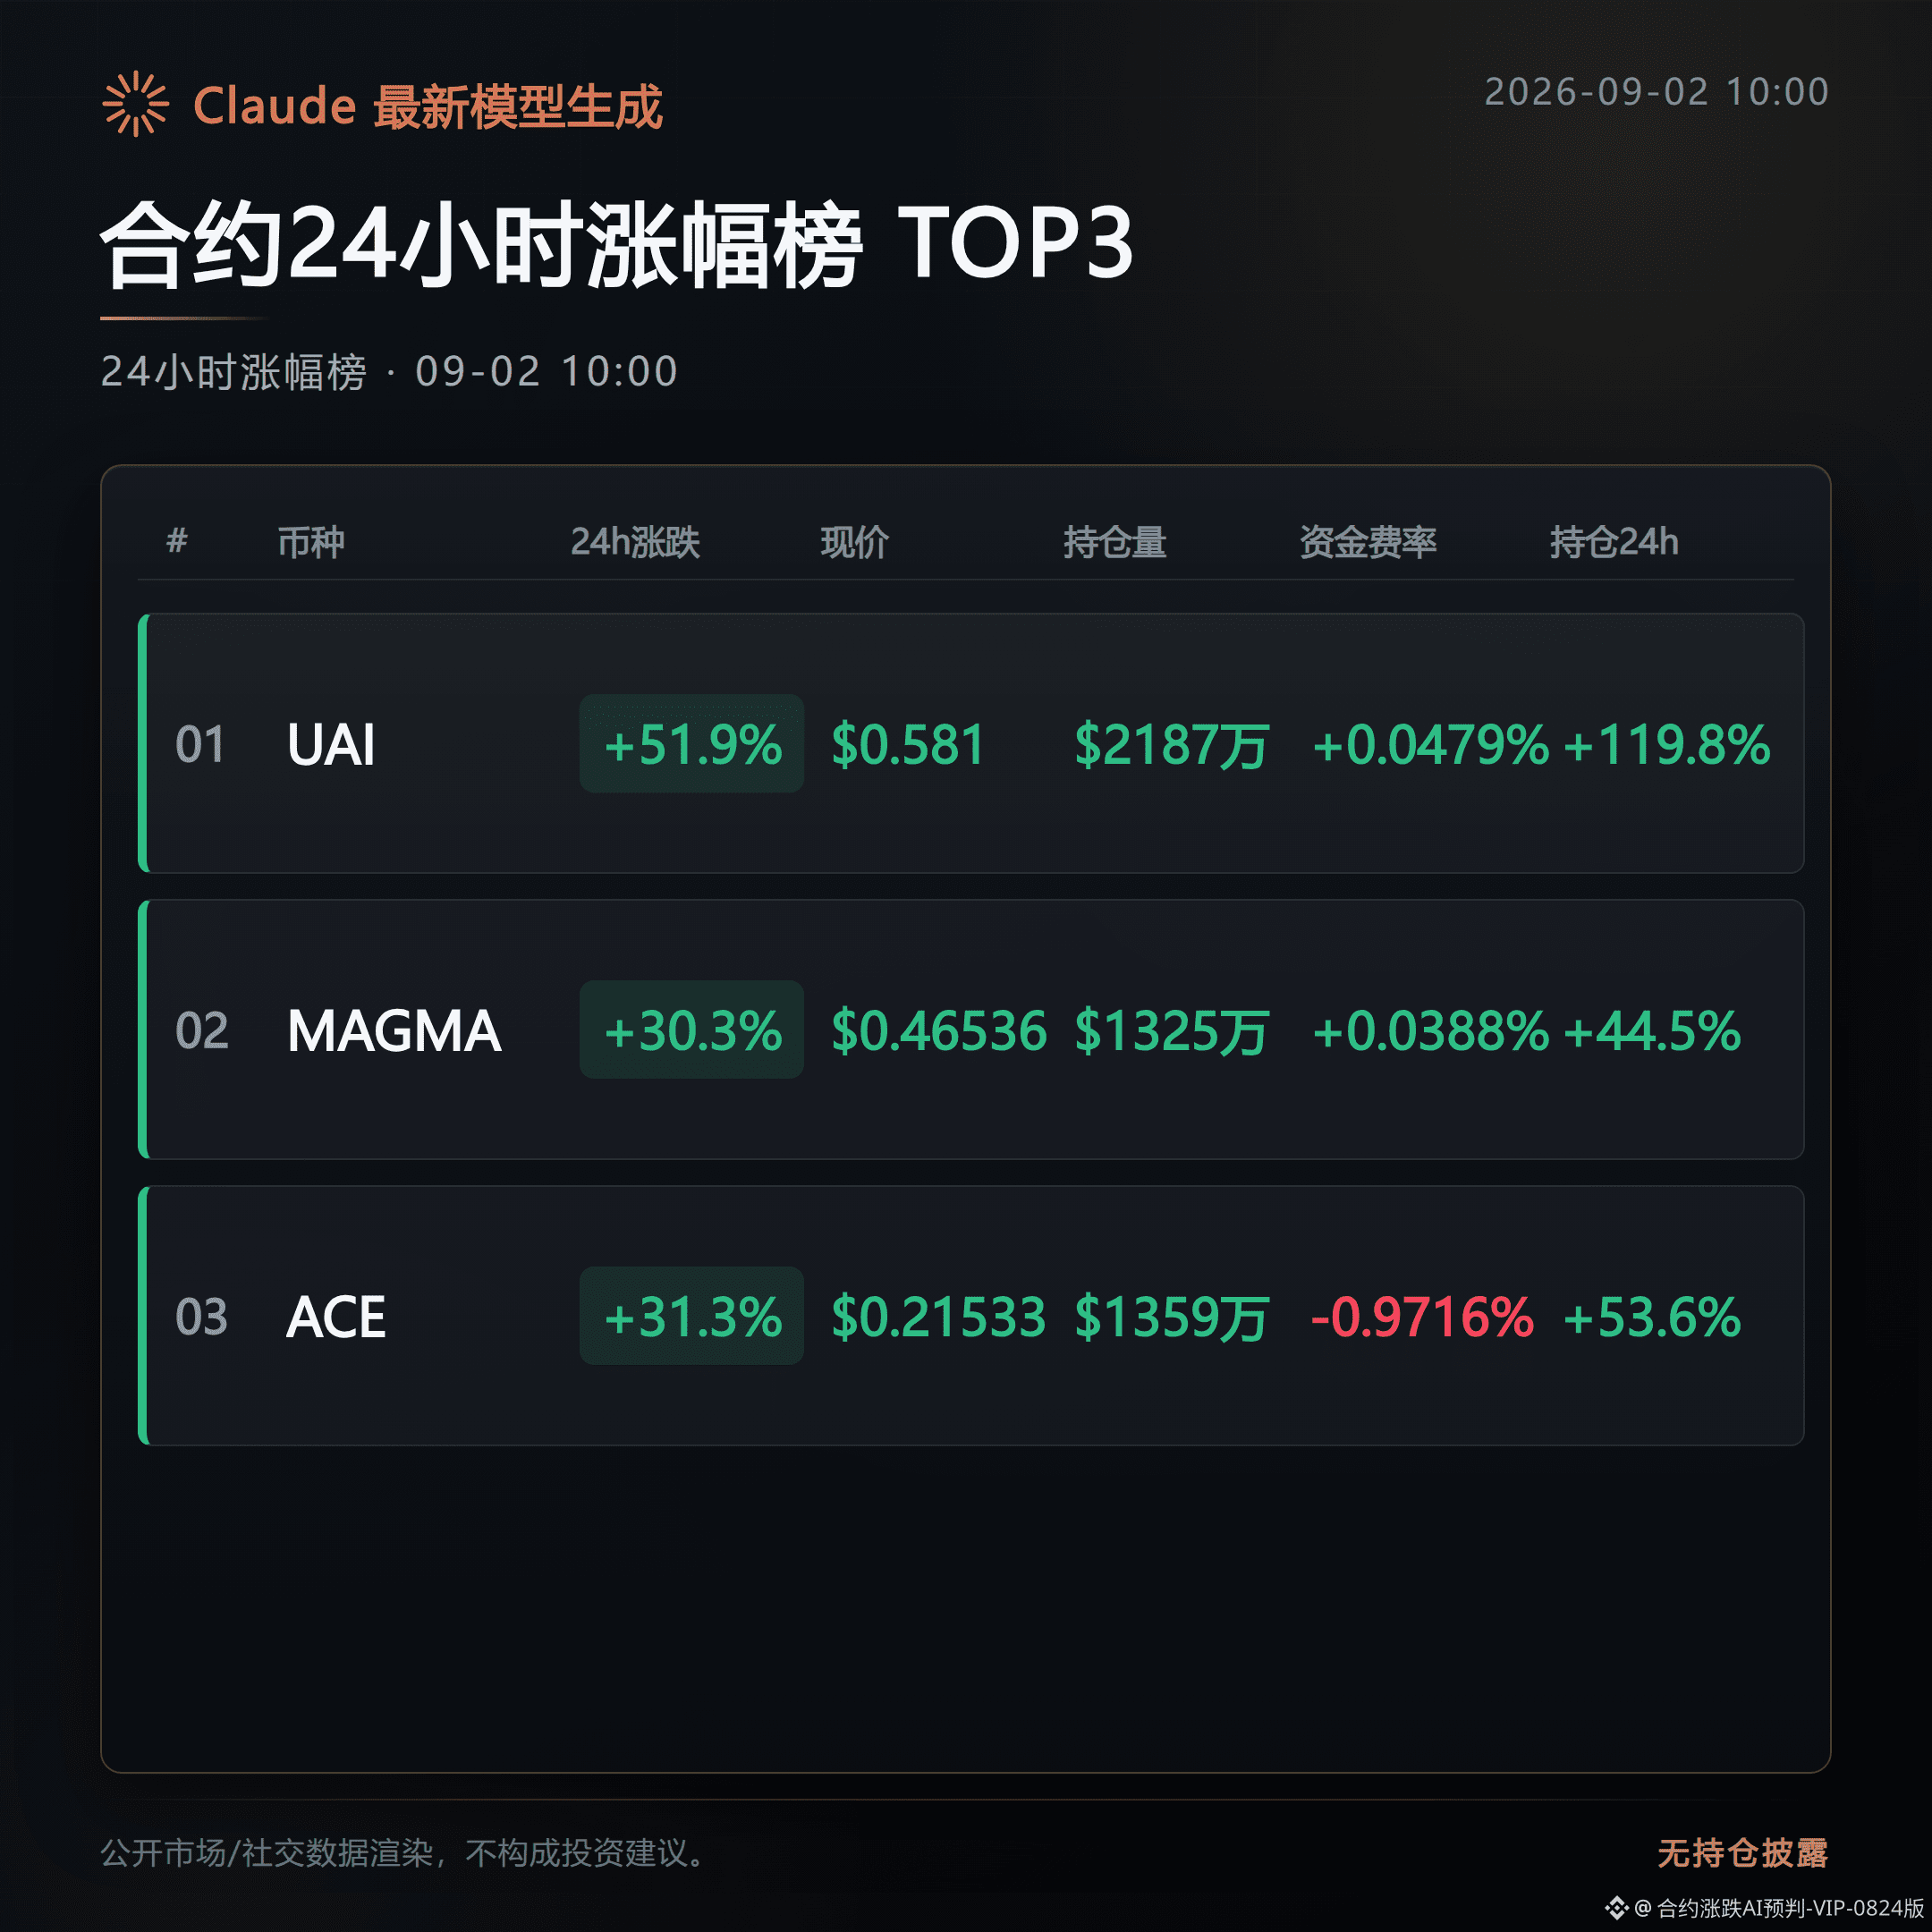
On Binance’s Contract 24-hour Gainers Board, the top 3 coins in the morning session are UAI, MAGMA, and ACE.
All three coins are currently in an uptrend, but their open interest and funding-rate structures differ greatly.
Let’s break down each one’s public order book step by step, so people monitoring the market can get up to speed quickly.
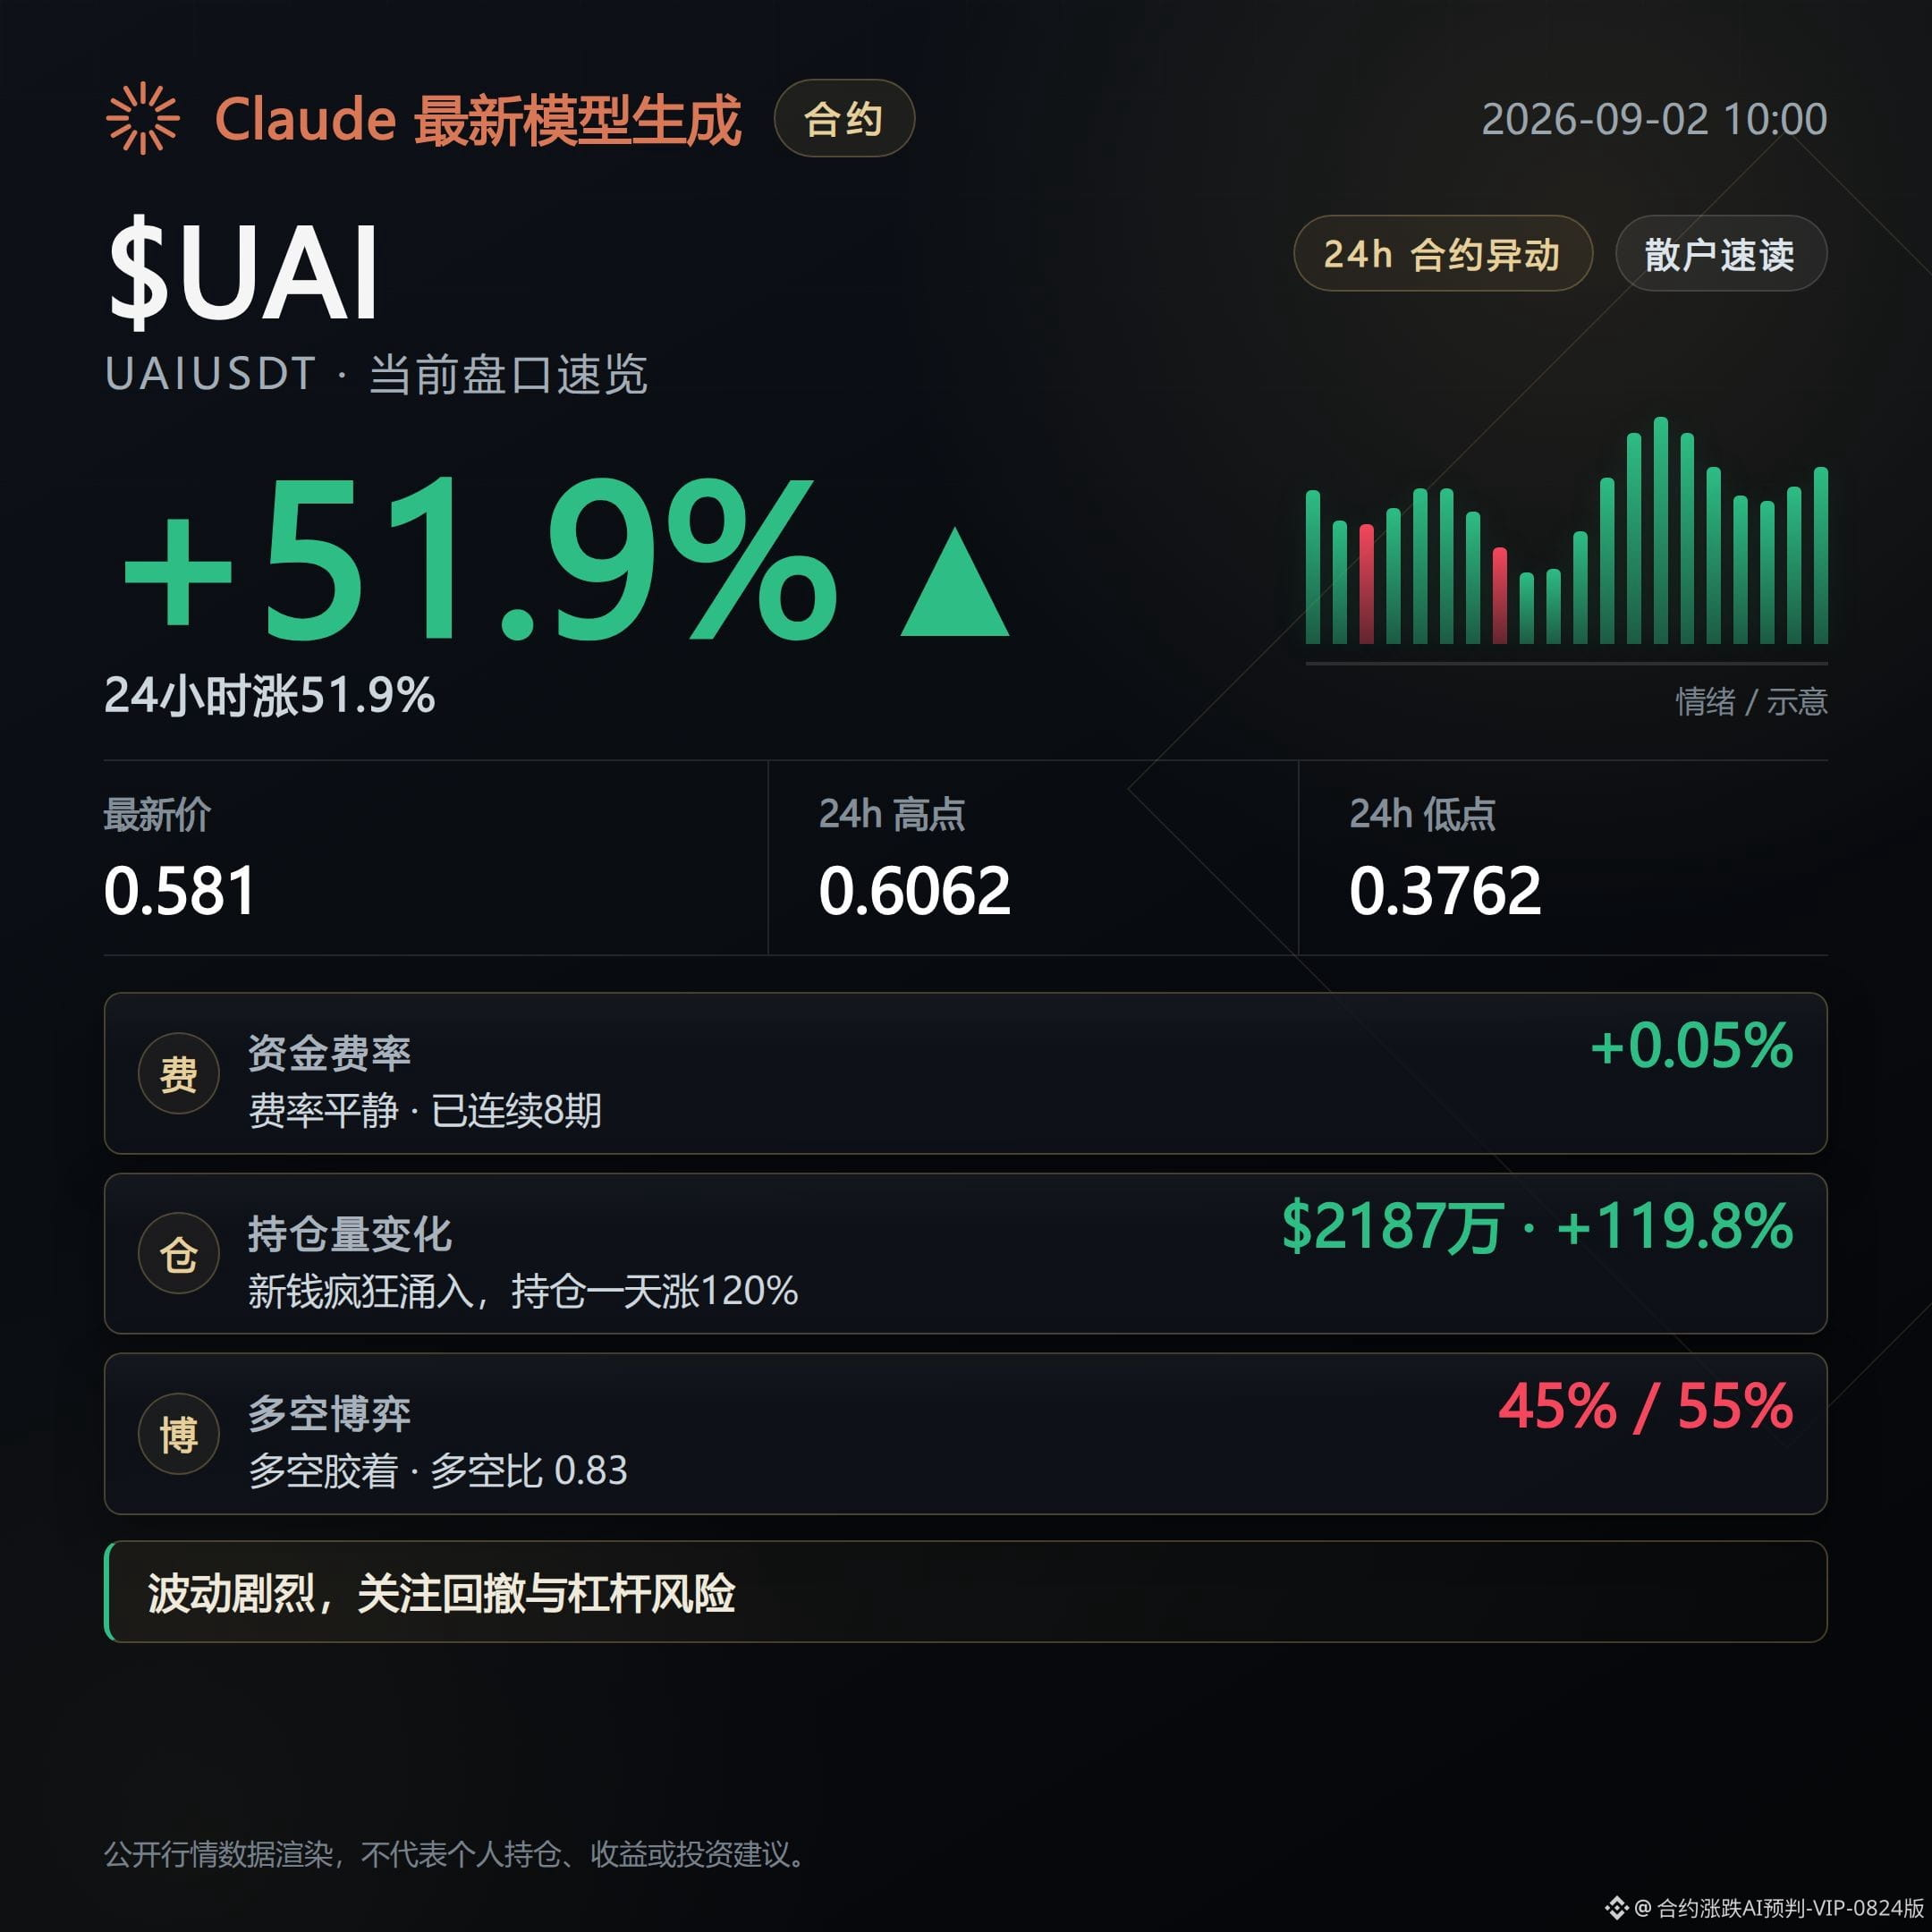
UAI’s 24-hour gain is 51.86%, the highest among the three.
Its 24-hour trading volume reached $173 million, while open interest is only $21.87 million—yet it surged 119.8% within 24 hours.
This suggests the rally was accompanied by a large inflow of newly opened contract positions, with leverage stacking up clearly.
The funding rate is 0.0479%; it has been paid by longs for 8 consecutive funding intervals. The strength/weakness indicator is 85.3, placing it in an overbought zone.
A verifiable signal is: if the 1-hour open-interest growth rate turns from positive to negative, and at the same time the funding rate turns negative, it means the incremental long-side momentum has already started to fade.
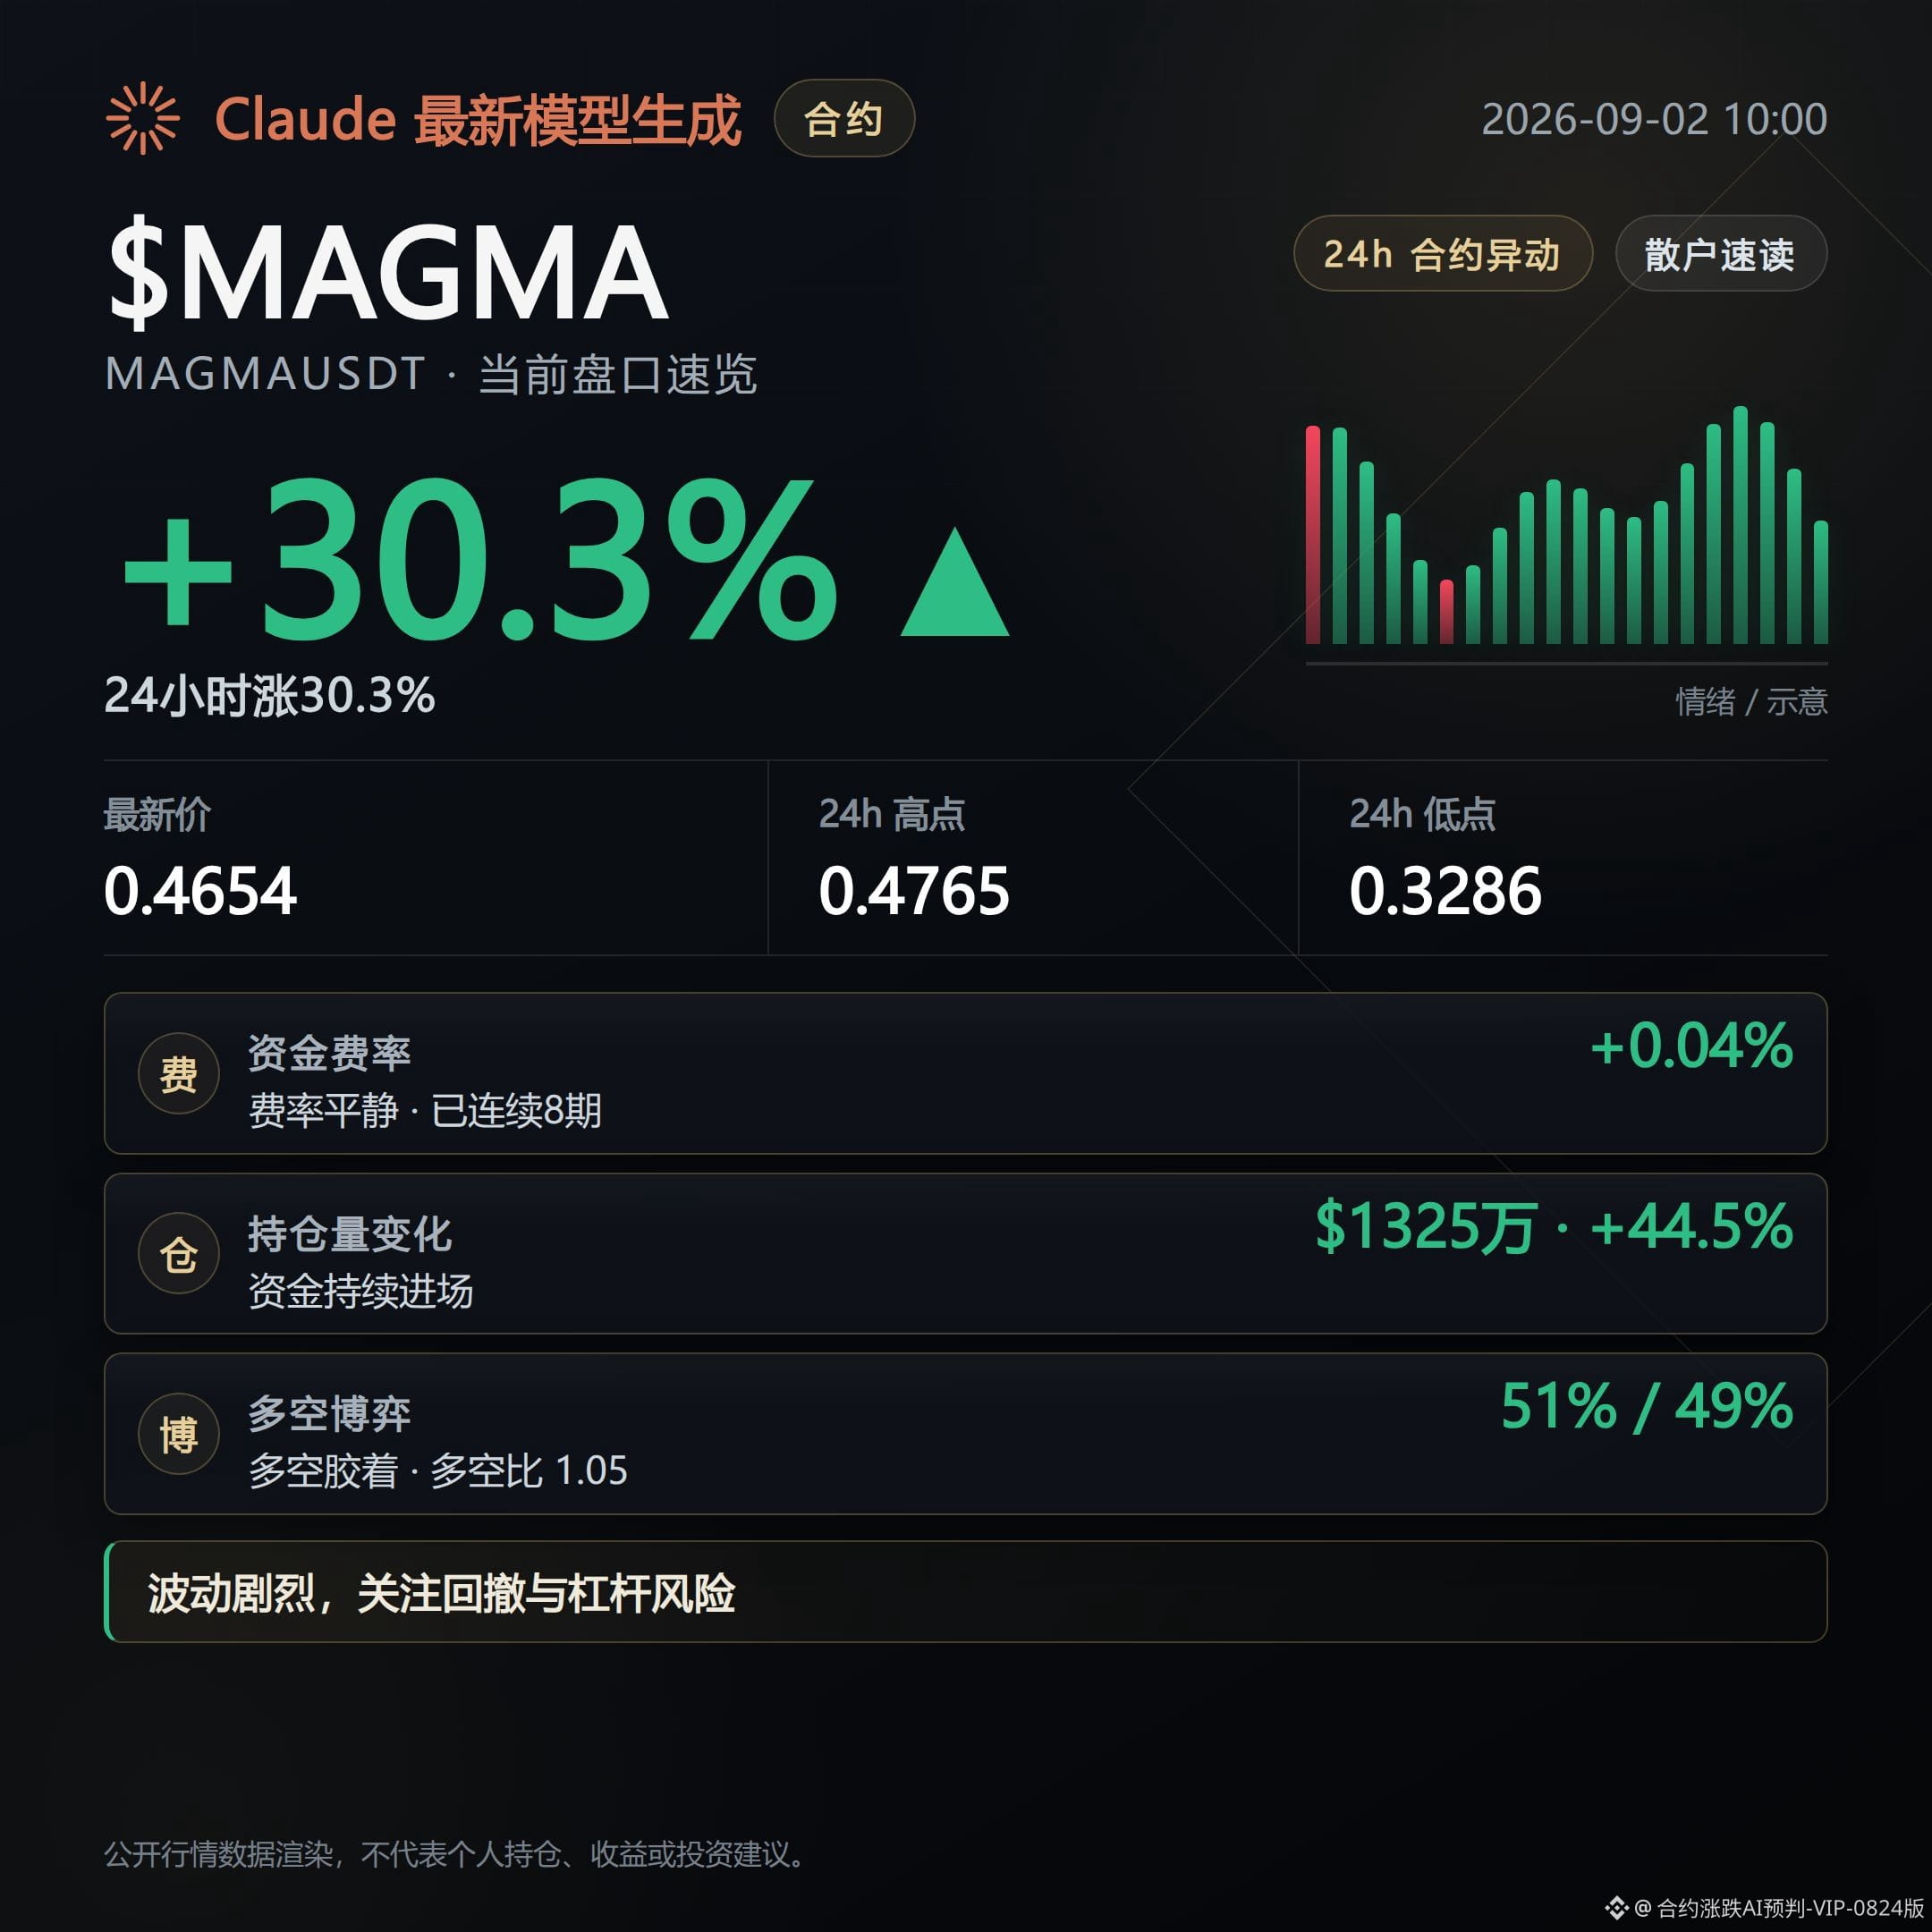
MAGMA’s 24-hour gain is 30.34%. Trading volume is $76.03 million, the smallest among the three.
Open interest is $13.24 million, up 44.5% over 24 hours; in the last hour it increased only 5.8%, so its growth rate is steadier than the other two.
Funding rate is 0.0388%; similarly, it has been paid by longs for 8 straight intervals, but the strength/weakness indicator is only 69.8, still in a neutral range.
A verifiable signal is: as long as the strength/weakness indicator does not break above 80, and the 1-hour open-interest growth rate stays in single digits, this rally is still in a phase of relatively gentle net adding.
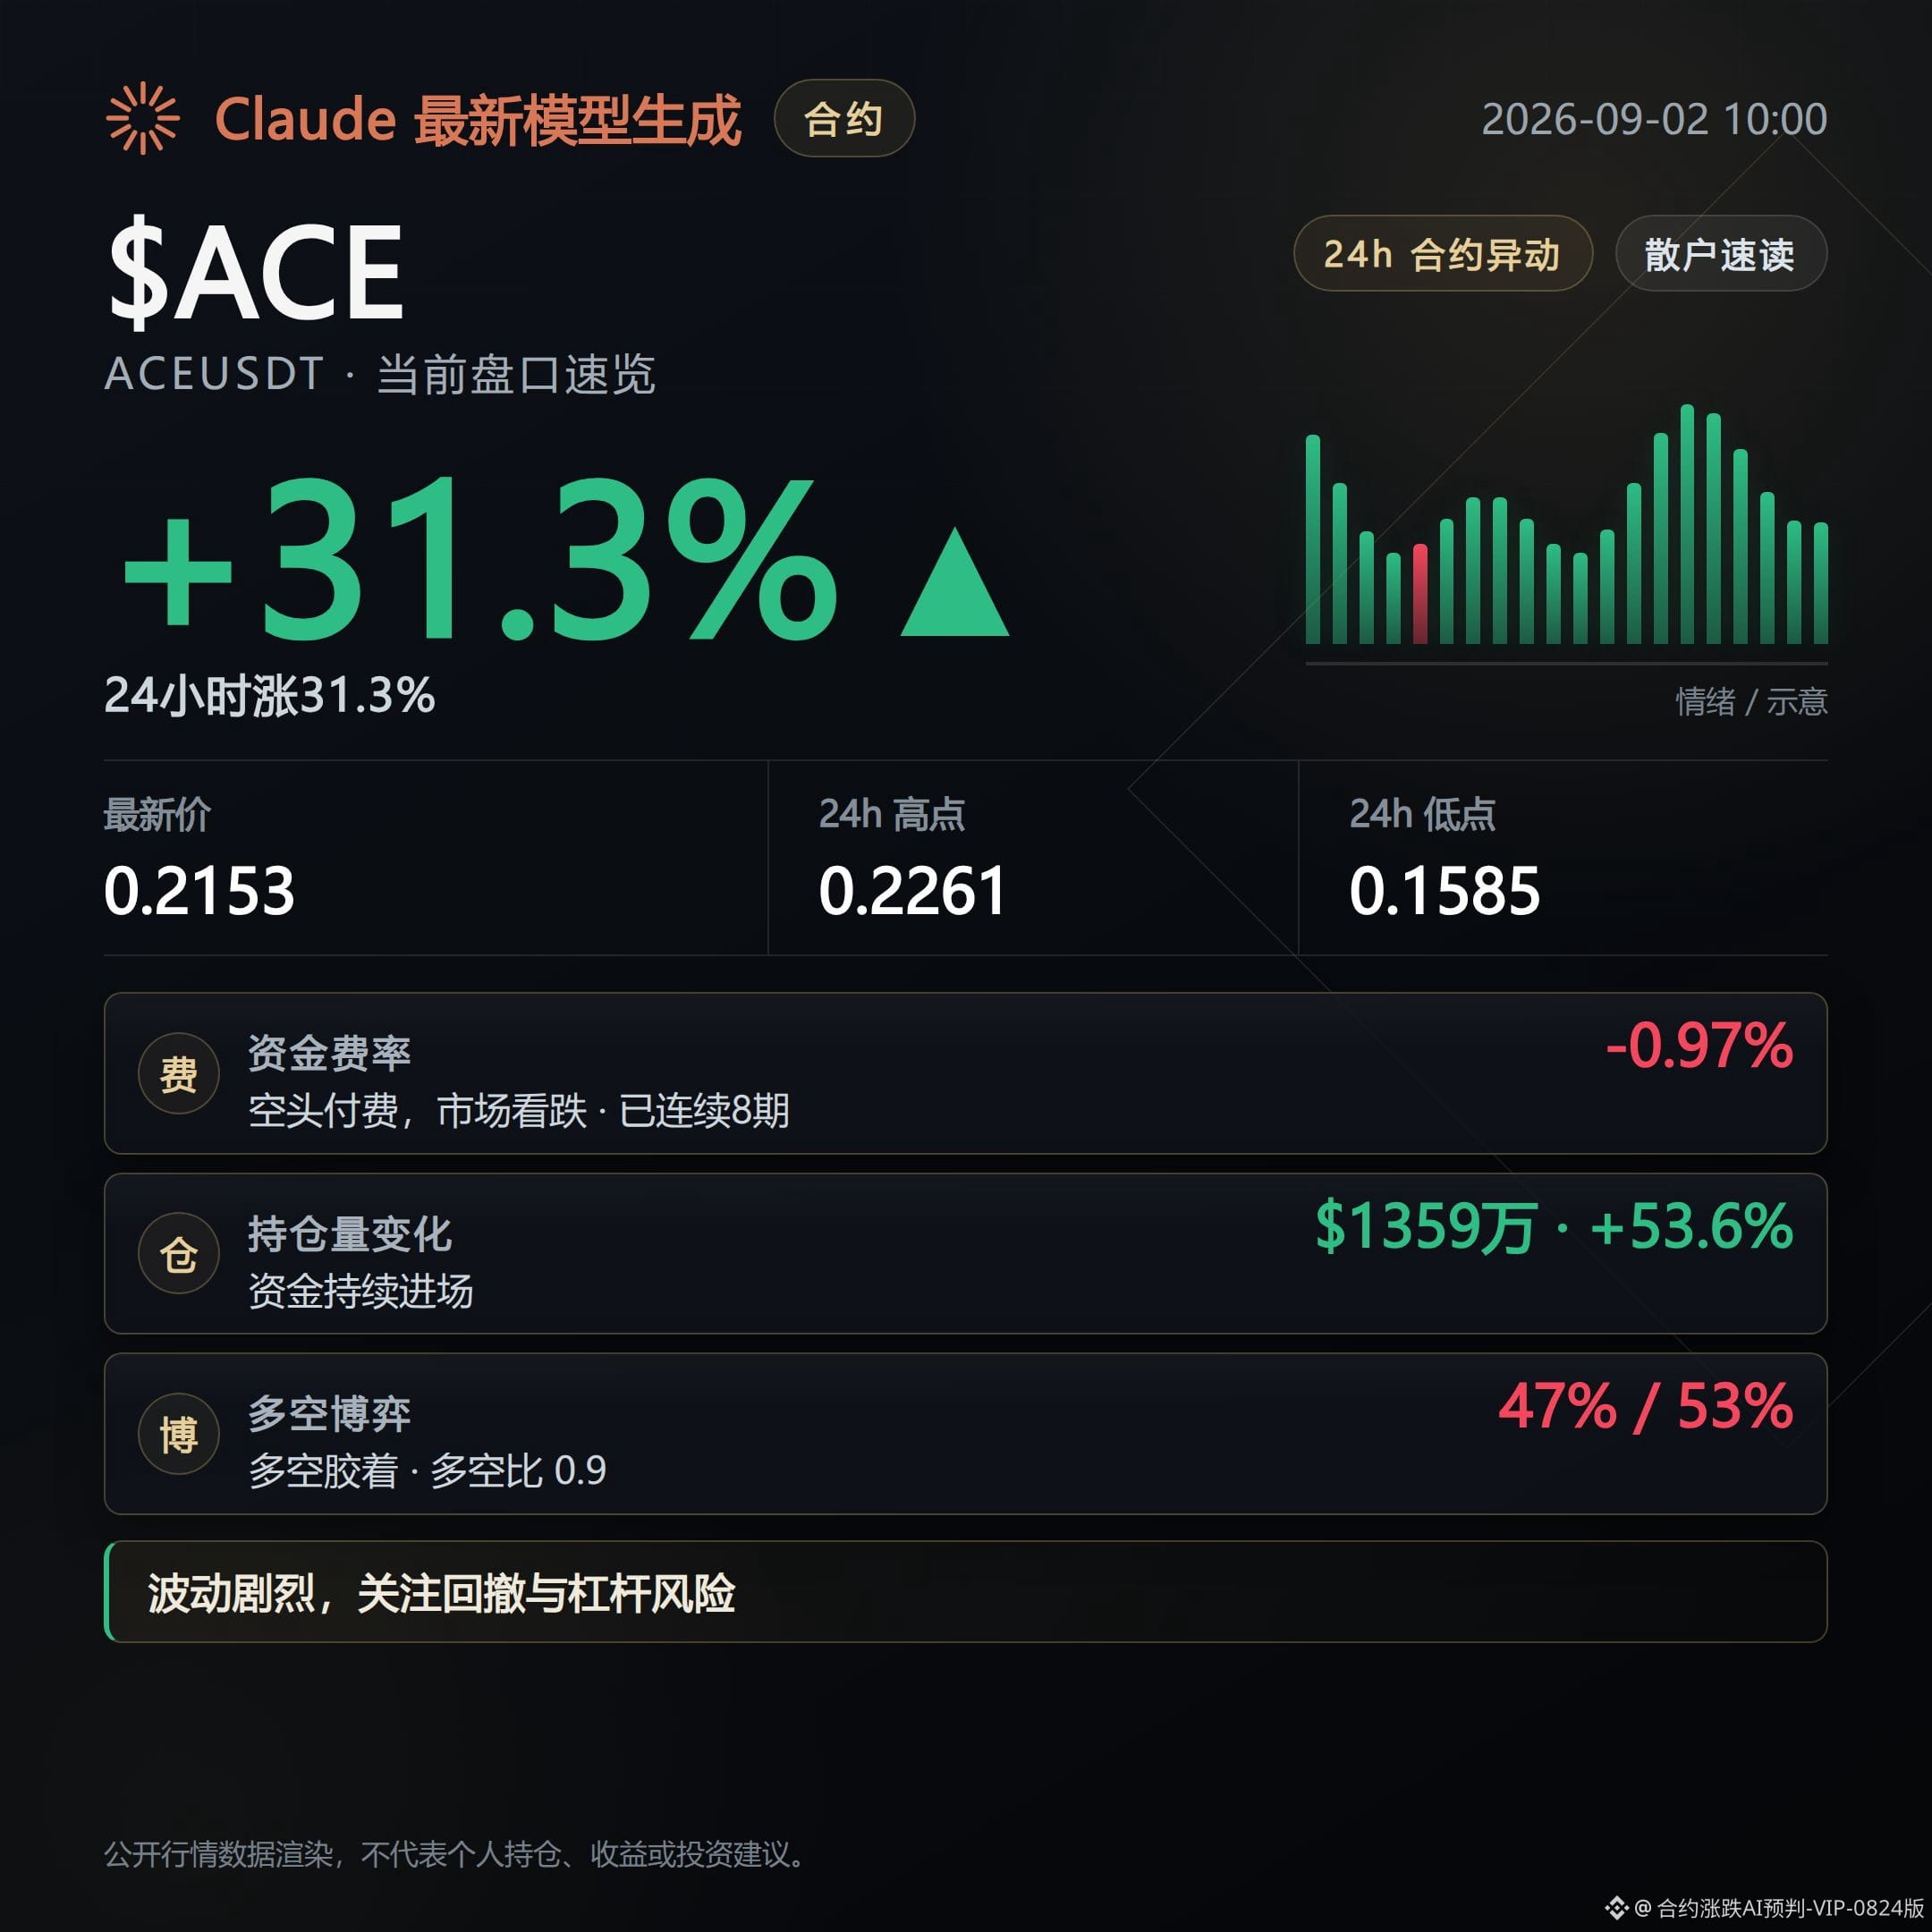
ACE’s 24-hour gain is 31.33%. Trading volume is $153 million, close to UAI.
Open interest is $13.59 million, up 53.6% over 24 hours.
But ACE’s funding rate is -0.9716%—it has been paid by shorts for 8 consecutive intervals. Its direction is completely opposite from the other two coins.
The premium rate is also negative; it’s the only negative value among the three at -2.852%. The strength/weakness indicator is 75.4, which is in an overbought zone.
A verifiable signal is: if the funding rate shifts from negative to positive, it means the resistance from short-side positions that are paying out is weakening—this is a key threshold for judging whether the long-vs-short confrontation is still ongoing.
All three coins have 24-hour gains exceeding 30%, and their 24-hour open-interest growth also exceeds 40%. This is a common high-leverage accumulation characteristic seen on gainers boards.
Under this structure, the shared risk is that once price pulls back, the contract positions that were piled in within a short time will be closed in a concentrated way, amplifying volatility. Chasing the rally can easily leave you trapped at elevated levels.
No buy or sell advice is intended here—this is simply laying out the current public order-book structure.
#UAI #MAGMA #ACE
#Contract Market
Live Disclosure: This account currently holds $FOGO long positions; the related viewpoints align with the actual position size.
Claude Fable 5 helped generate; content is for market information reference only and does not constitute investment advice.
On Binance’s Contract 24-hour Gainers Board, the top 3 coins in the morning session are UAI, MAGMA, and ACE.
All three coins are currently in an uptrend, but their open interest and funding-rate structures differ greatly.
Let’s break down each one’s public order book step by step, so people monitoring the market can get up to speed quickly.
UAI’s 24-hour gain is 51.86%, the highest among the three.
Its 24-hour trading volume reached $173 million, while open interest is only $21.87 million—yet it surged 119.8% within 24 hours.
This suggests the rally was accompanied by a large inflow of newly opened contract positions, with leverage stacking up clearly.
The funding rate is 0.0479%; it has been paid by longs for 8 consecutive funding intervals. The strength/weakness indicator is 85.3, placing it in an overbought zone.
A verifiable signal is: if the 1-hour open-interest growth rate turns from positive to negative, and at the same time the funding rate turns negative, it means the incremental long-side momentum has already started to fade.
MAGMA’s 24-hour gain is 30.34%. Trading volume is $76.03 million, the smallest among the three.
Open interest is $13.24 million, up 44.5% over 24 hours; in the last hour it increased only 5.8%, so its growth rate is steadier than the other two.
Funding rate is 0.0388%; similarly, it has been paid by longs for 8 straight intervals, but the strength/weakness indicator is only 69.8, still in a neutral range.
A verifiable signal is: as long as the strength/weakness indicator does not break above 80, and the 1-hour open-interest growth rate stays in single digits, this rally is still in a phase of relatively gentle net adding.
ACE’s 24-hour gain is 31.33%. Trading volume is $153 million, close to UAI.
Open interest is $13.59 million, up 53.6% over 24 hours.
But ACE’s funding rate is -0.9716%—it has been paid by shorts for 8 consecutive intervals. Its direction is completely opposite from the other two coins.
The premium rate is also negative; it’s the only negative value among the three at -2.852%. The strength/weakness indicator is 75.4, which is in an overbought zone.
A verifiable signal is: if the funding rate shifts from negative to positive, it means the resistance from short-side positions that are paying out is weakening—this is a key threshold for judging whether the long-vs-short confrontation is still ongoing.
All three coins have 24-hour gains exceeding 30%, and their 24-hour open-interest growth also exceeds 40%. This is a common high-leverage accumulation characteristic seen on gainers boards.
Under this structure, the shared risk is that once price pulls back, the contract positions that were piled in within a short time will be closed in a concentrated way, amplifying volatility. Chasing the rally can easily leave you trapped at elevated levels.
No buy or sell advice is intended here—this is simply laying out the current public order-book structure.
#UAI #MAGMA #ACE
#Contract Market
Live Disclosure: This account currently holds $FOGO long positions; the related viewpoints align with the actual position size.
Claude Fable 5 helped generate; content is for market information reference only and does not constitute investment advice.
Contracts that could see sideways drift downward and sell-wall pressure today
Bearish signals are building up. These three contracts today look more like a high-level distribution warning than a broad “uptrend across the board” move.
The price line is still trending upward, but the structure has already loosened a step ahead. Don’t only watch the green/red of the percentage change.
What’s truly worrying isn’t that it’s not going up—it’s that as it rises, the order book support starts to thin. The next thing to watch is whether this line will actually turn and head downward.
JST current price 0.1024, up 2.67% in 24 hours; trading volume $6.4702 million.
Open interest $5.4549 million, up 1.3% in 24 hours, but in the most recent 1 hour it has already turned down 0.4%. Funding rate 0.005% has been paying longs for 6 consecutive periods—longs are still hard-absorbing their costs.
Active sell pressure is stronger than buy pressure; the buy/sell ratio is only 0.76. Only 34% of retail is long. The large-holder long/short ratio is 0.82 as well, which is also leaning bearish. Price is rising, but the buying/selling power is clearly tangled.
Chips are dispersed.
Funding rate is still long-paying for 6 consecutive periods, and the super trend is still in an upward channel—however, the long structure hasn’t been genuinely broken through.
FF current price 0.09788, up a whopping 14.36% in 24 hours; trading volume $46.2750 million—the most aggressive gain among the three contracts.
Open interest $38.6520 million, up 22.0% in 24 hours; positions have concentrated inflows. But in the most recent 1 hour, the rise has narrowed to 4.3%—the inflow speed is already slowing.
Funding rate 0.005% has been paying longs for 8 consecutive periods, yet the premium rate is only 0.0049%, almost zero. There’s hardly any premium space left for futures to push higher relative to spot.
Retail is only 38% long, yet the upside is the largest among the three. That mismatch is worth a closer look.
Chips are dispersed.
Active buy order ratio is 1.52, with buys still dominant. Total open interest is still increasing, and bullish momentum hasn’t been disproven.
BMT current price 0.02061, up 2.69% in 24 hours; trading volume $6.2523 million. Its gain is the smallest among the three.
The super trend has already turned downward. Funding rate has flipped to -0.0085% with 1 consecutive period of shorts receiving payments. The premium rate is -0.1201%, trading at a discount; contract sentiment is more cautious than spot.
Open interest $3.1824 million, down 3.1% in 24 hours—while price is rising, positions are moving outward.
Chips are dispersed.
Active buy order ratio is 2.03, buys still leading. There is still capital picking up on the short term; any pullback hasn’t been fully confirmed yet.
All three contracts are showing the same “feel” right now: price is still rising, but the structure is loosening first.
If the support continues to thin, the pullback line is already forming.
If volume returns and the price holds above again, then this assessment will need to be revisited.
#JST #FF #BMT #Contract order book details
Position disclosure: This account’s live holdings include $FOGO long positions; the disclosure is to keep the content consistent with actual trading.
Claude Fable 5 used as assistance for generation; content is for market information reference only and does not constitute investment advice.
Bearish signals are building up. These three contracts today look more like a high-level distribution warning than a broad “uptrend across the board” move.
The price line is still trending upward, but the structure has already loosened a step ahead. Don’t only watch the green/red of the percentage change.
What’s truly worrying isn’t that it’s not going up—it’s that as it rises, the order book support starts to thin. The next thing to watch is whether this line will actually turn and head downward.
JST current price 0.1024, up 2.67% in 24 hours; trading volume $6.4702 million.
Open interest $5.4549 million, up 1.3% in 24 hours, but in the most recent 1 hour it has already turned down 0.4%. Funding rate 0.005% has been paying longs for 6 consecutive periods—longs are still hard-absorbing their costs.
Active sell pressure is stronger than buy pressure; the buy/sell ratio is only 0.76. Only 34% of retail is long. The large-holder long/short ratio is 0.82 as well, which is also leaning bearish. Price is rising, but the buying/selling power is clearly tangled.
Chips are dispersed.
Funding rate is still long-paying for 6 consecutive periods, and the super trend is still in an upward channel—however, the long structure hasn’t been genuinely broken through.
FF current price 0.09788, up a whopping 14.36% in 24 hours; trading volume $46.2750 million—the most aggressive gain among the three contracts.
Open interest $38.6520 million, up 22.0% in 24 hours; positions have concentrated inflows. But in the most recent 1 hour, the rise has narrowed to 4.3%—the inflow speed is already slowing.
Funding rate 0.005% has been paying longs for 8 consecutive periods, yet the premium rate is only 0.0049%, almost zero. There’s hardly any premium space left for futures to push higher relative to spot.
Retail is only 38% long, yet the upside is the largest among the three. That mismatch is worth a closer look.
Chips are dispersed.
Active buy order ratio is 1.52, with buys still dominant. Total open interest is still increasing, and bullish momentum hasn’t been disproven.
BMT current price 0.02061, up 2.69% in 24 hours; trading volume $6.2523 million. Its gain is the smallest among the three.
The super trend has already turned downward. Funding rate has flipped to -0.0085% with 1 consecutive period of shorts receiving payments. The premium rate is -0.1201%, trading at a discount; contract sentiment is more cautious than spot.
Open interest $3.1824 million, down 3.1% in 24 hours—while price is rising, positions are moving outward.
Chips are dispersed.
Active buy order ratio is 2.03, buys still leading. There is still capital picking up on the short term; any pullback hasn’t been fully confirmed yet.
All three contracts are showing the same “feel” right now: price is still rising, but the structure is loosening first.
If the support continues to thin, the pullback line is already forming.
If volume returns and the price holds above again, then this assessment will need to be revisited.
#JST #FF #BMT #Contract order book details
Position disclosure: This account’s live holdings include $FOGO long positions; the disclosure is to keep the content consistent with actual trading.
Claude Fable 5 used as assistance for generation; content is for market information reference only and does not constitute investment advice.
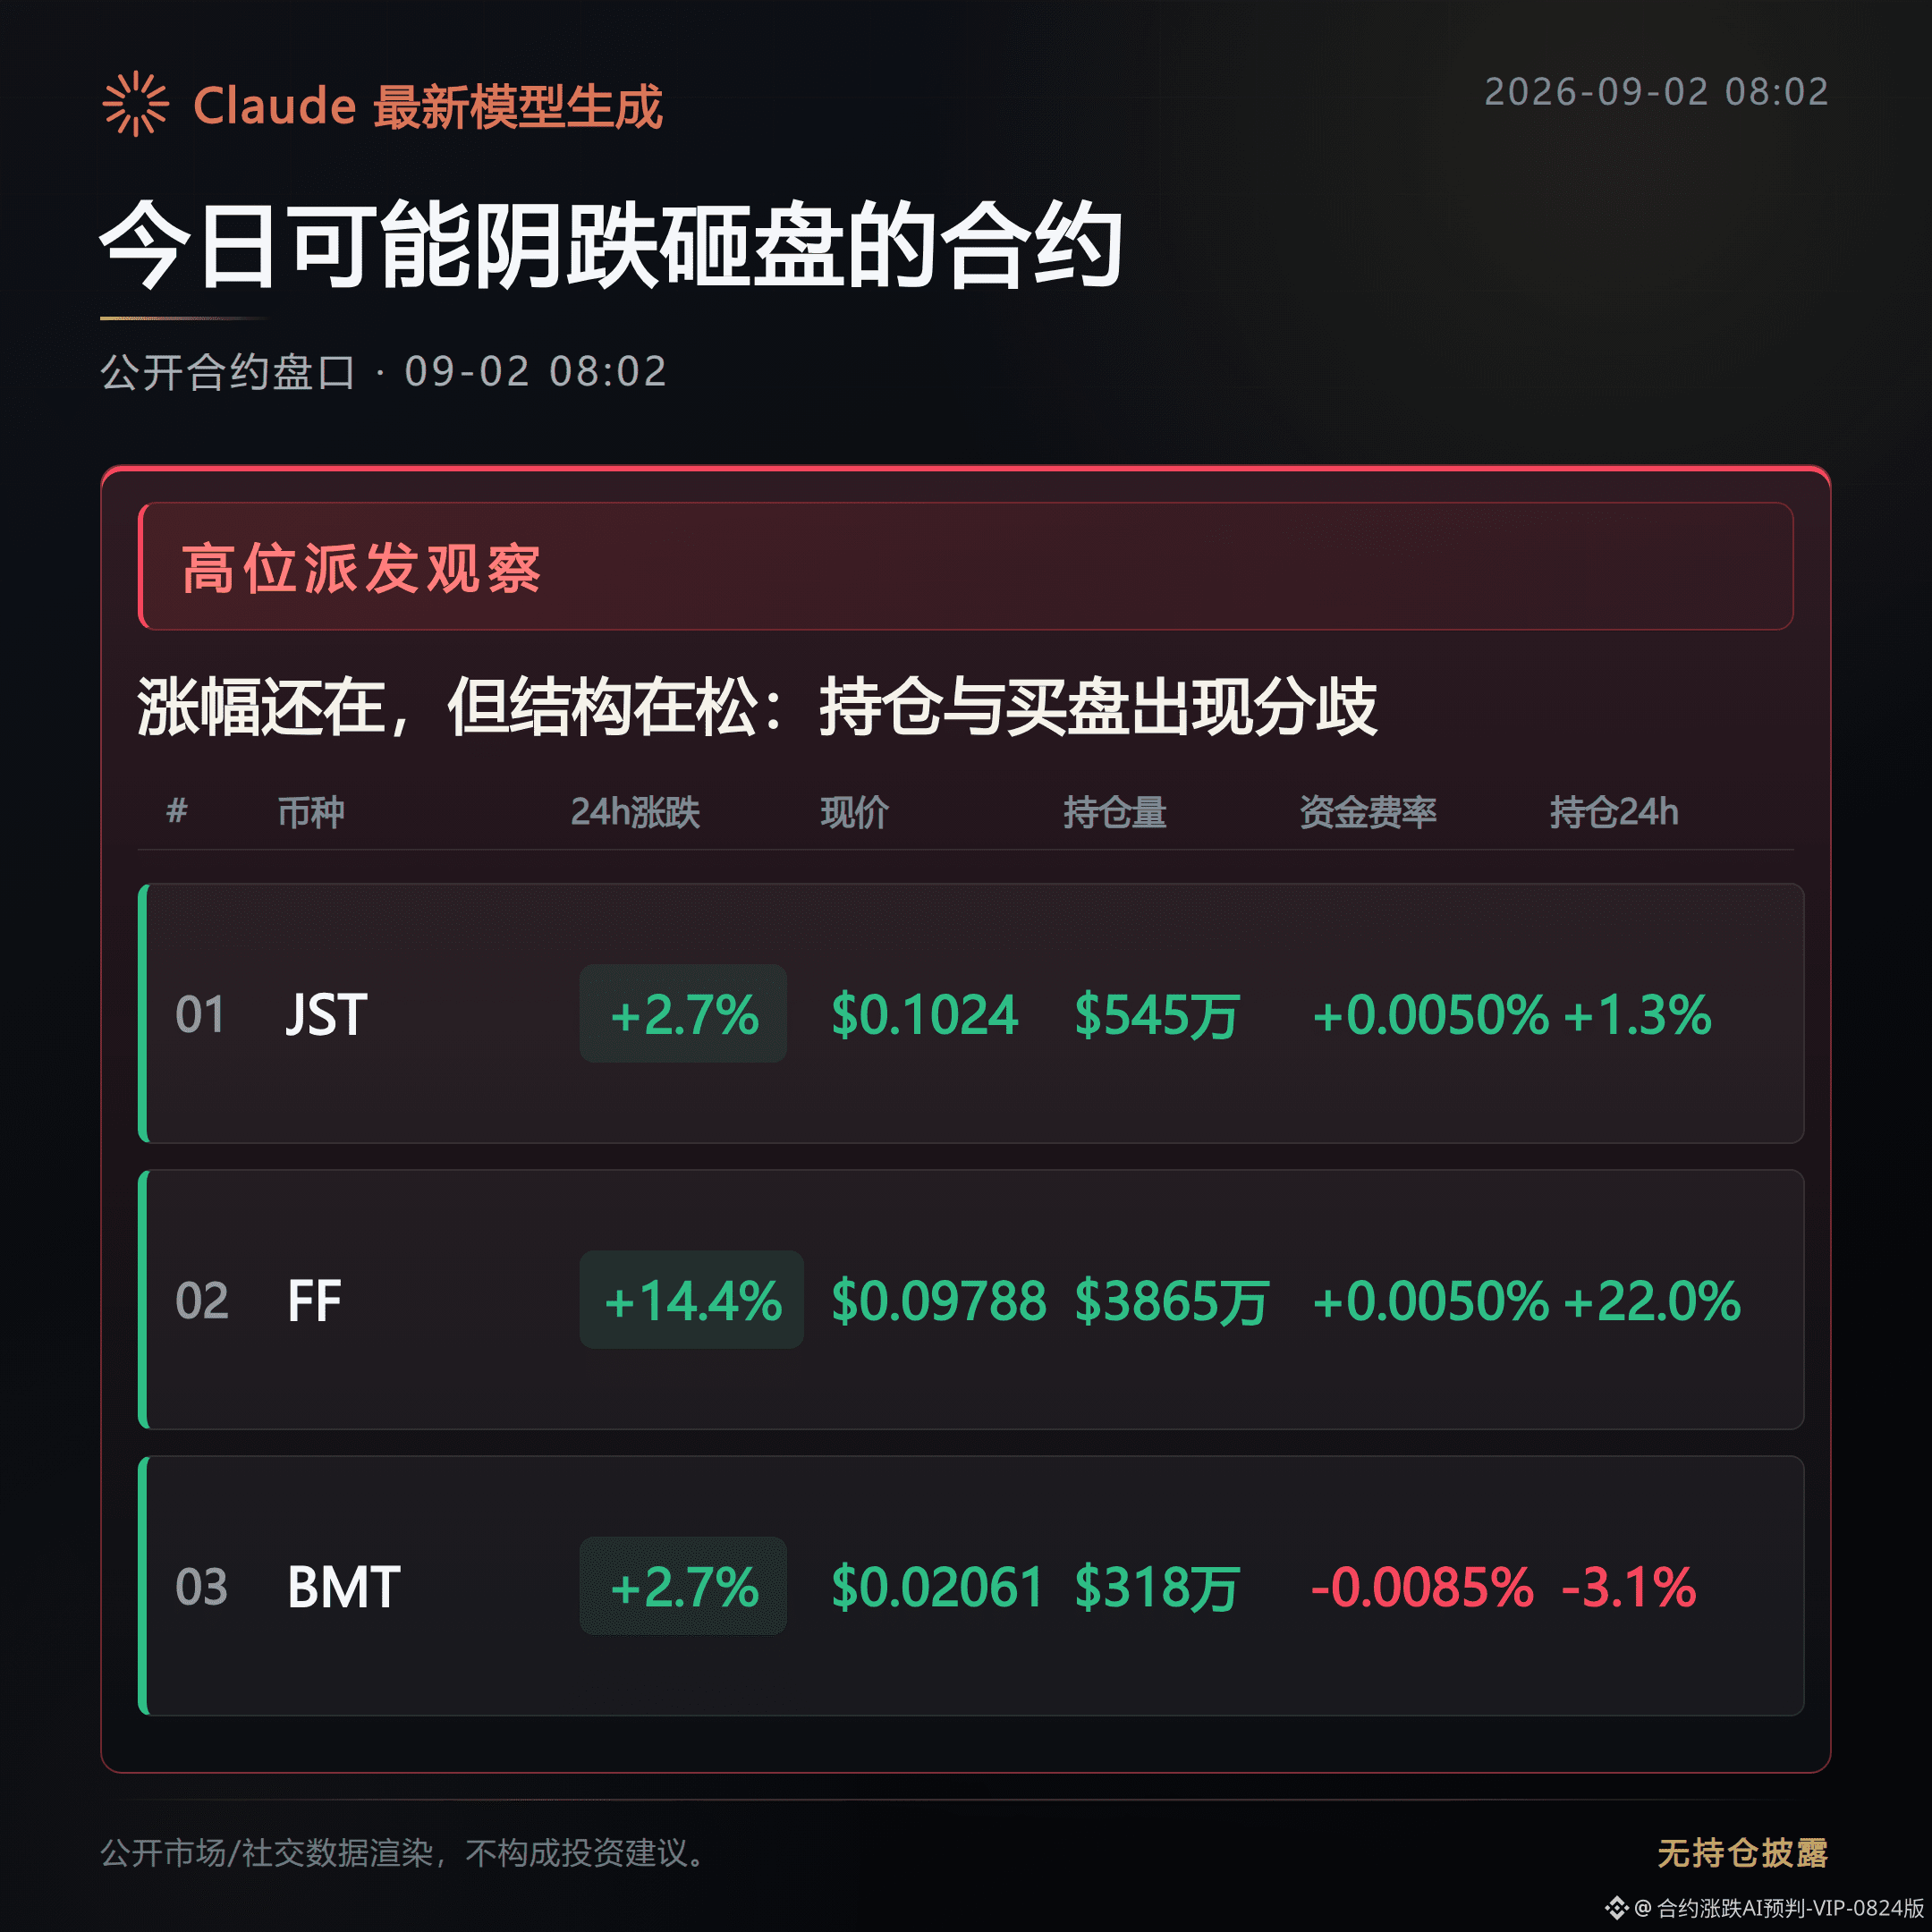
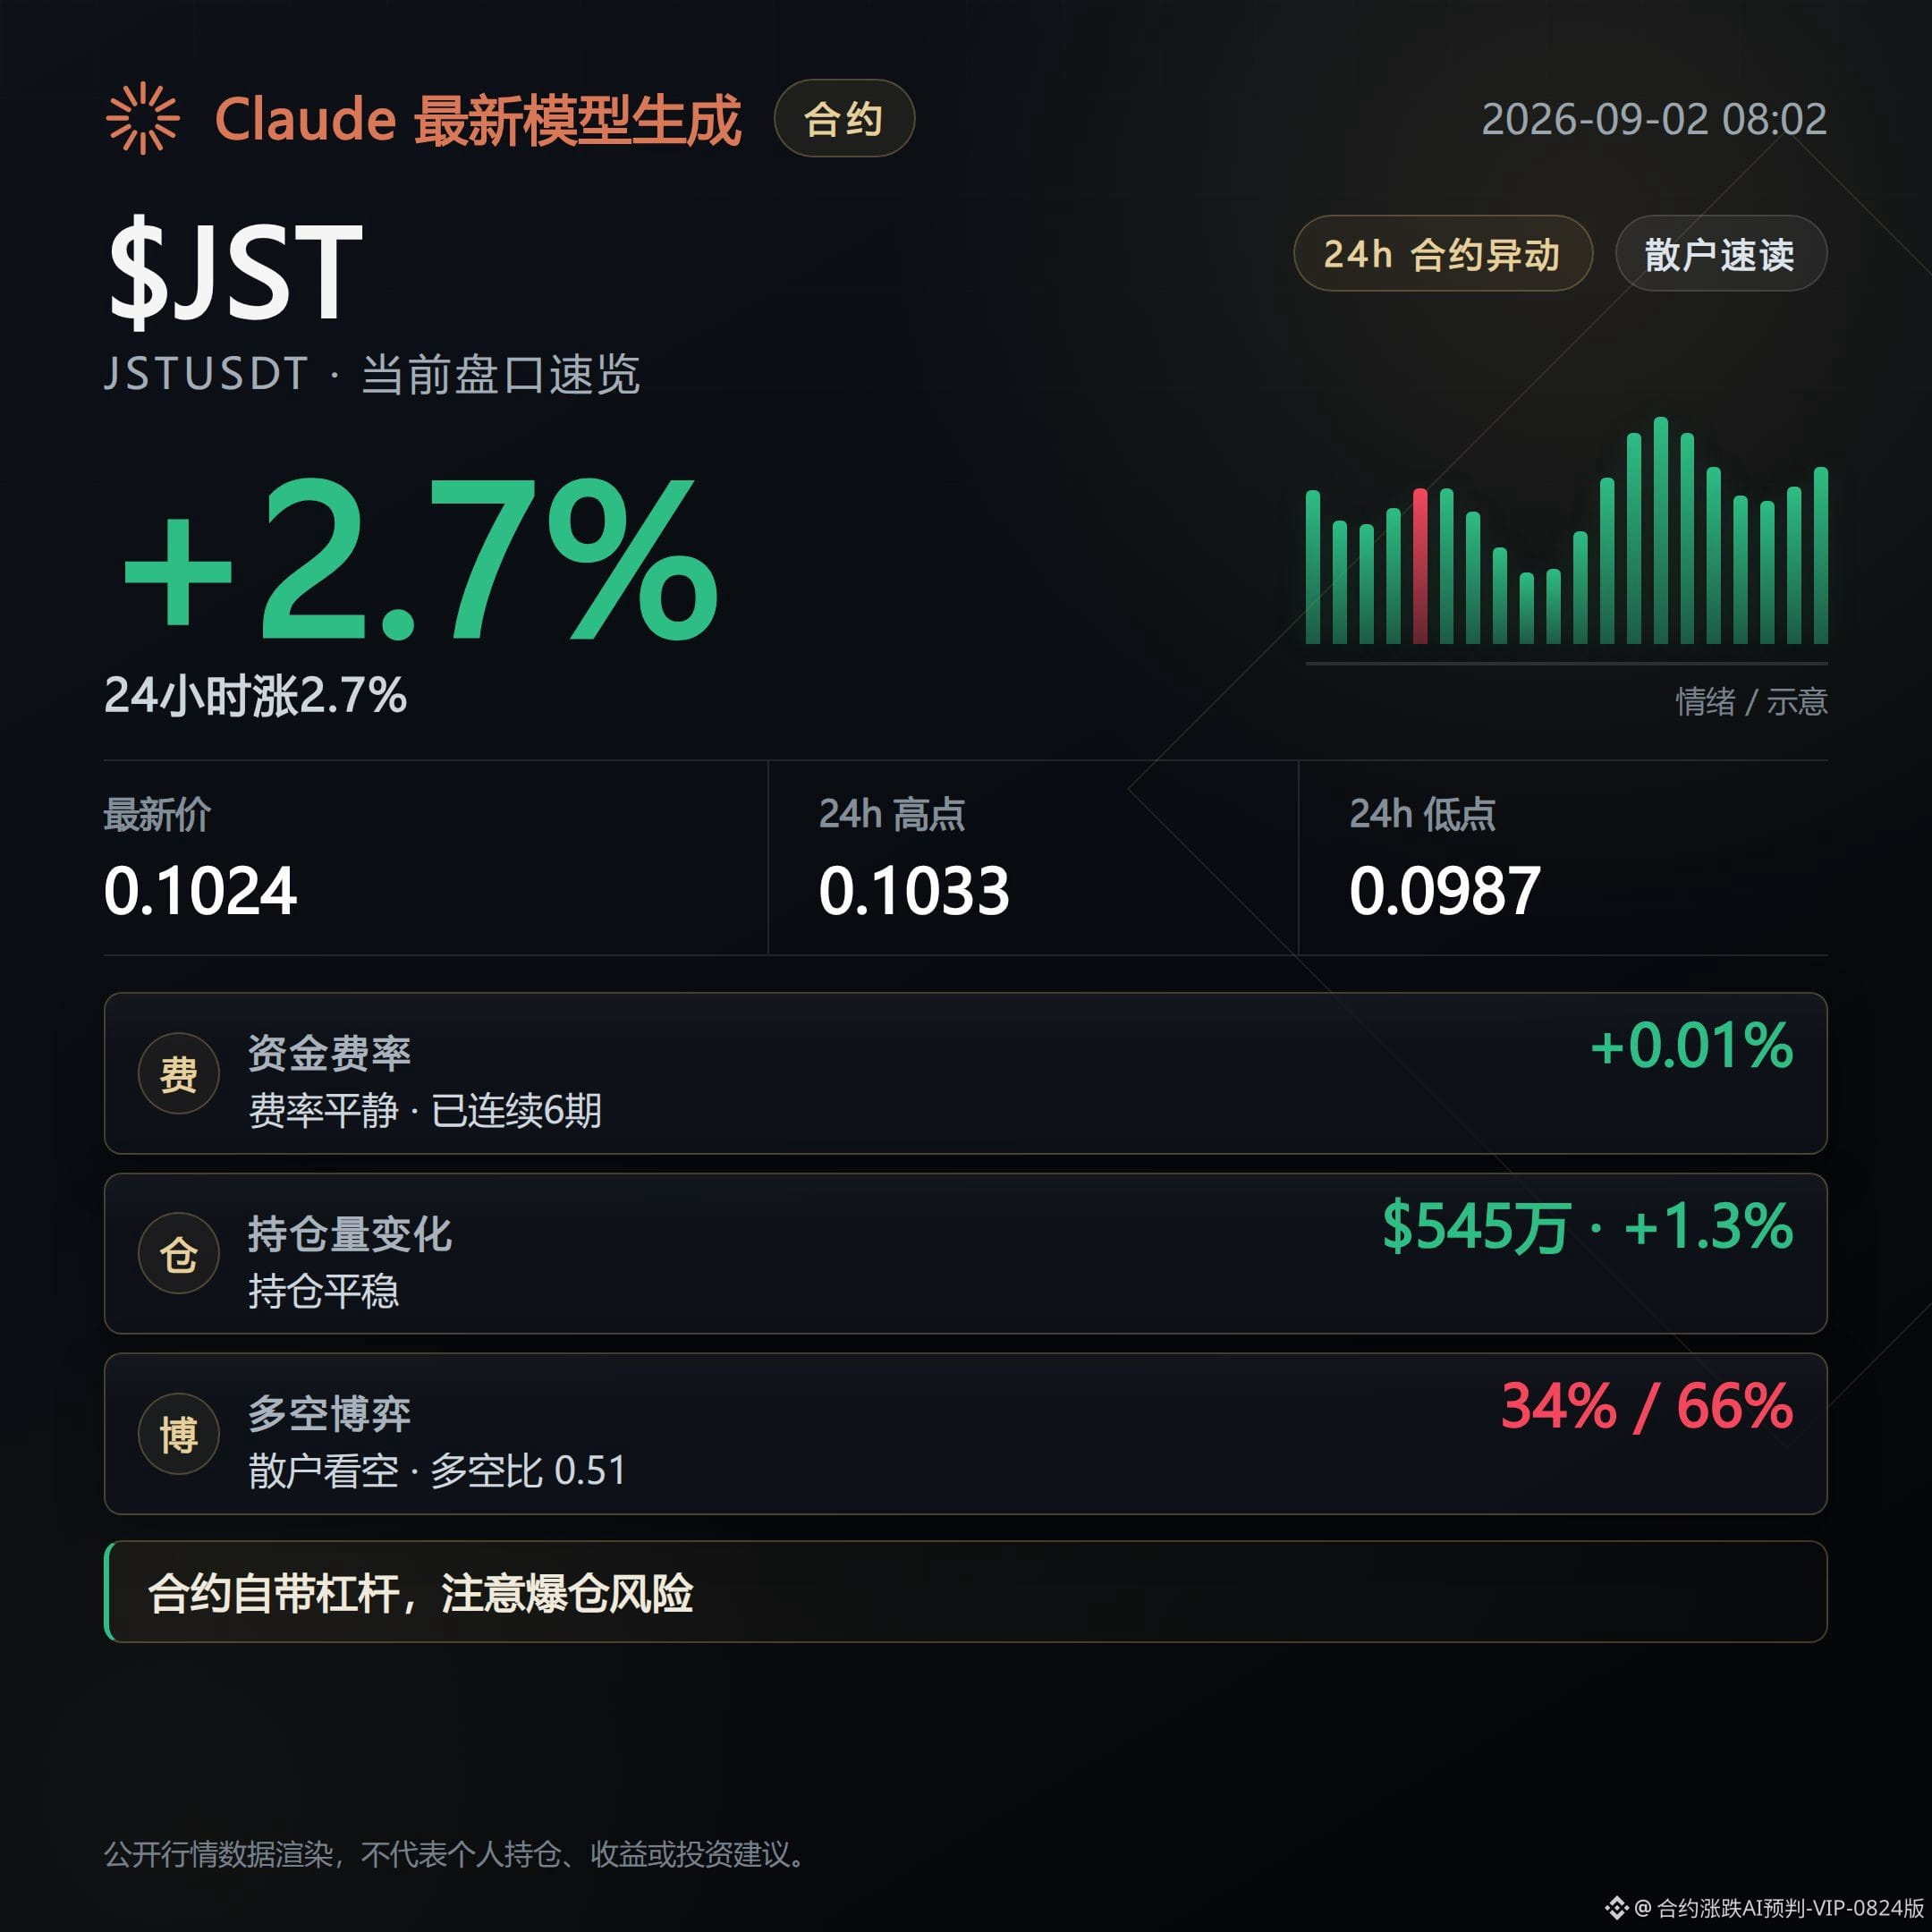
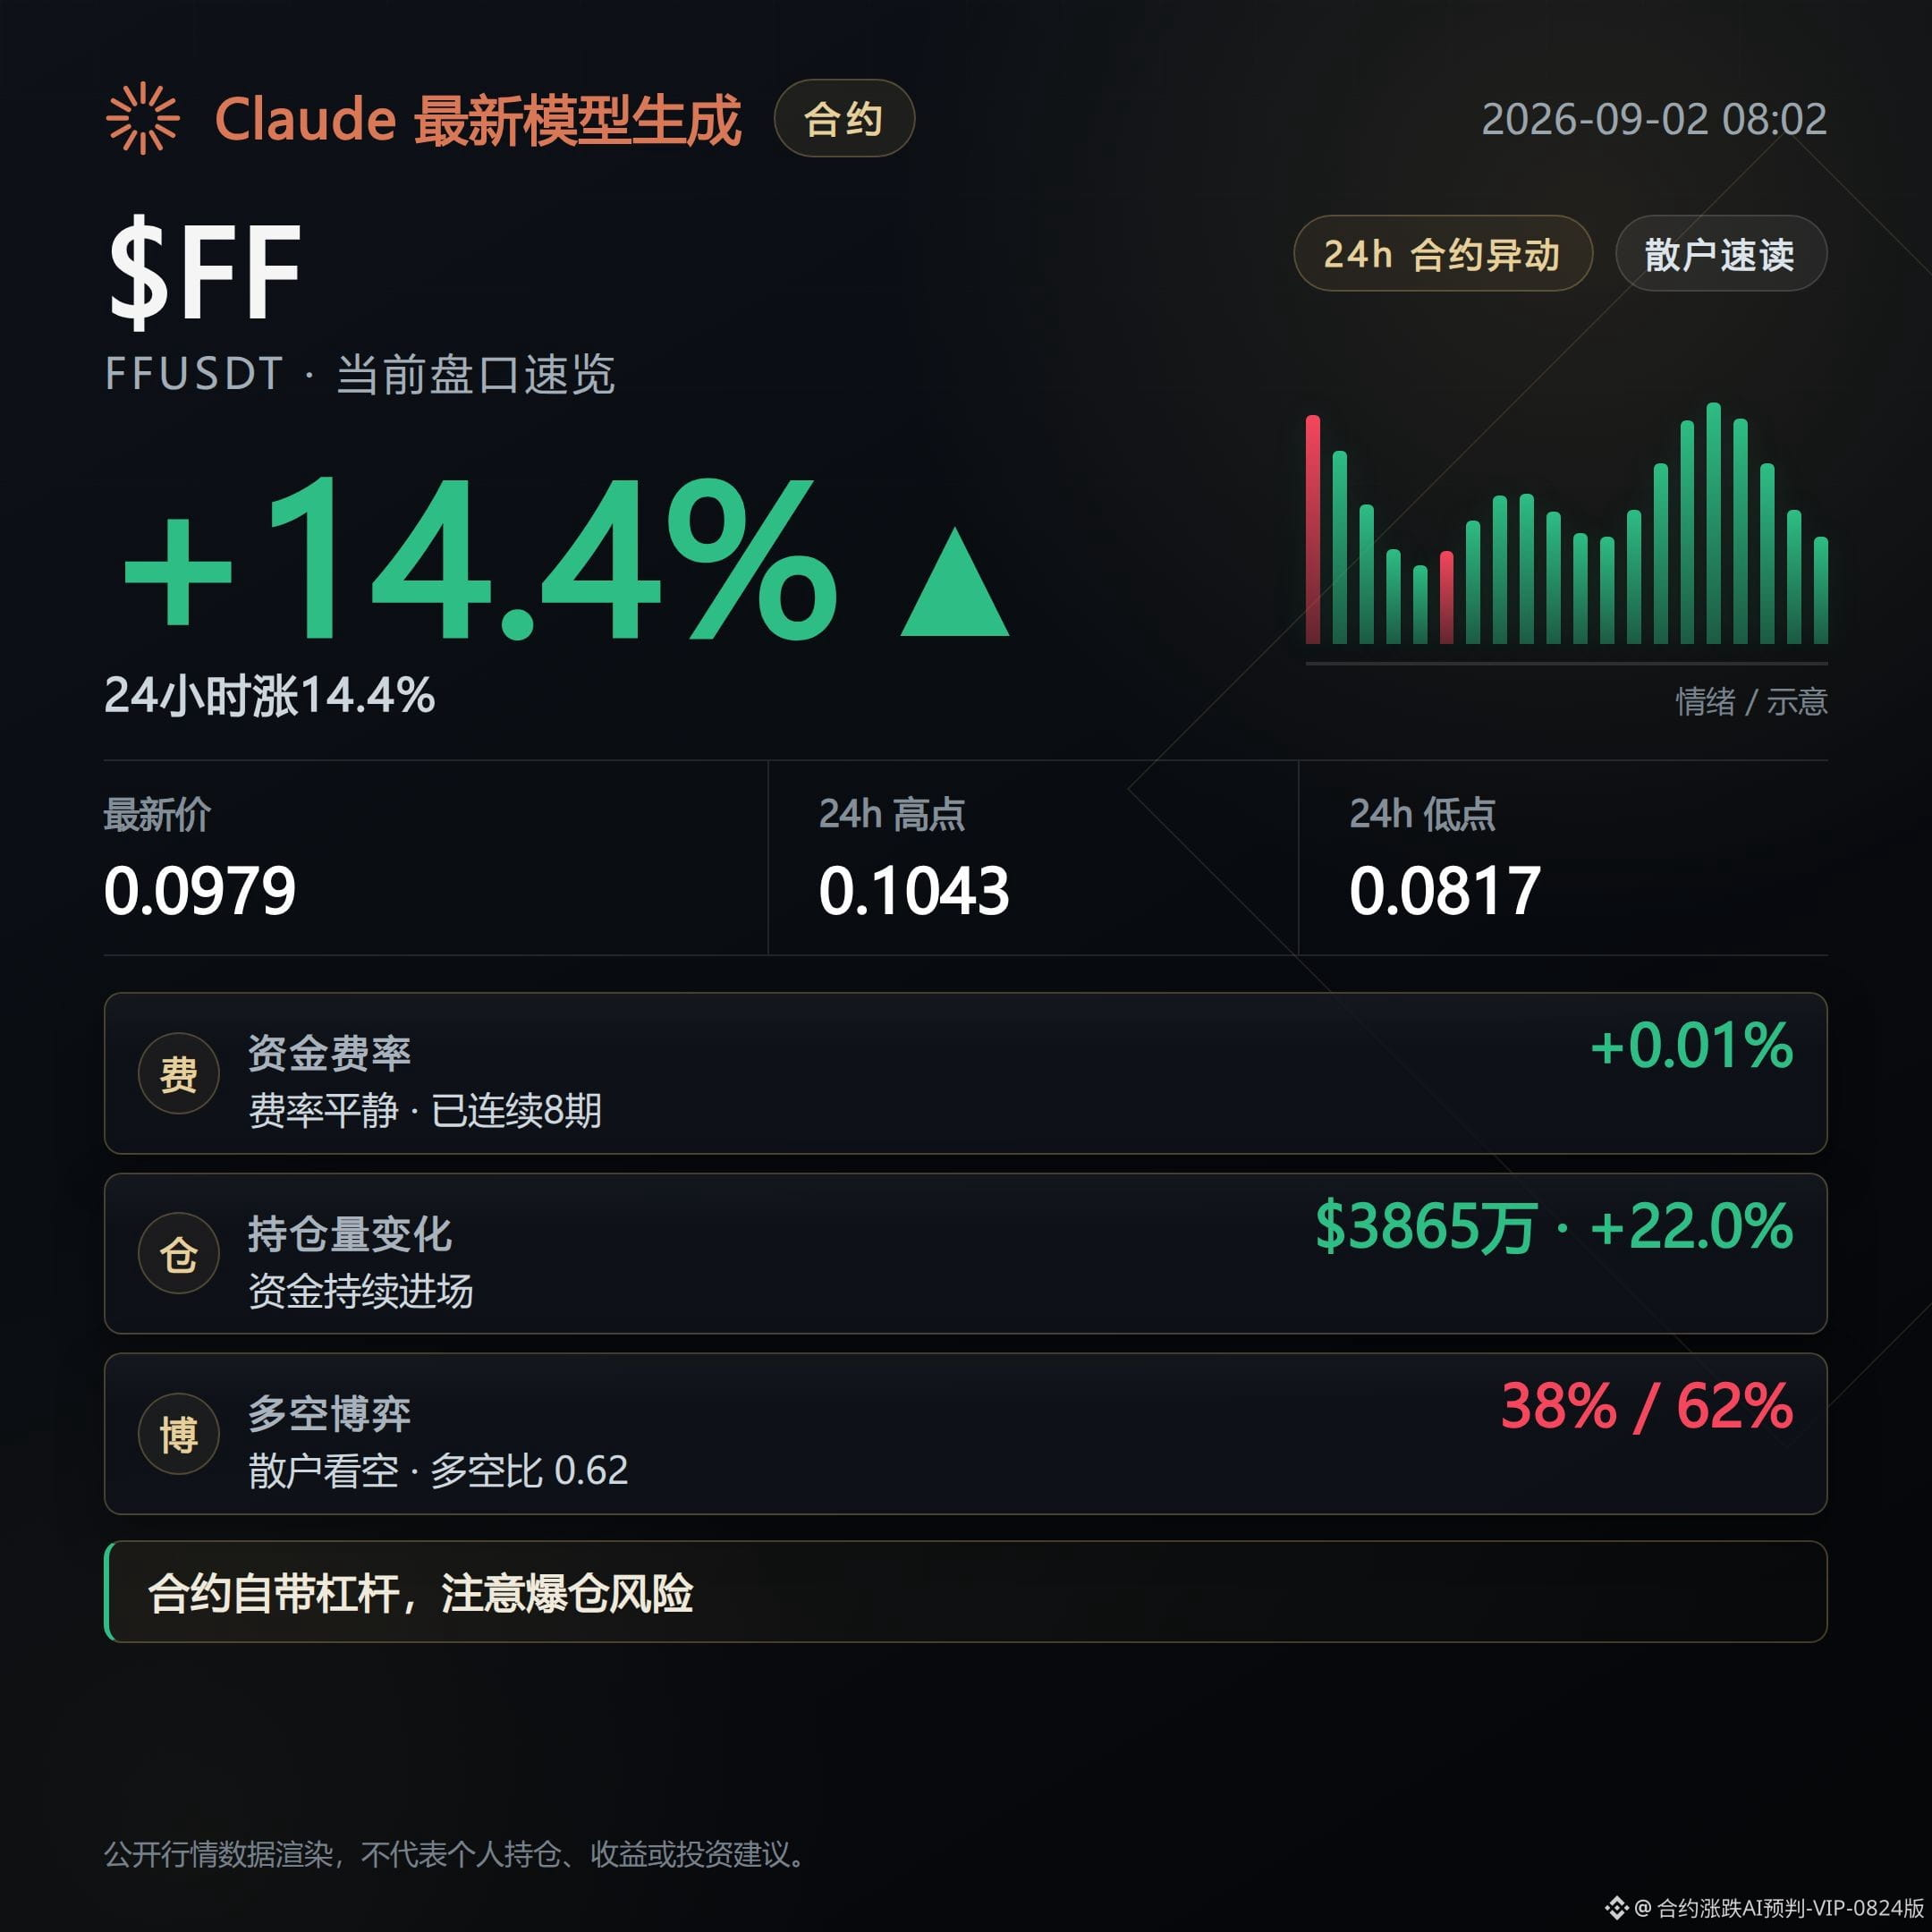
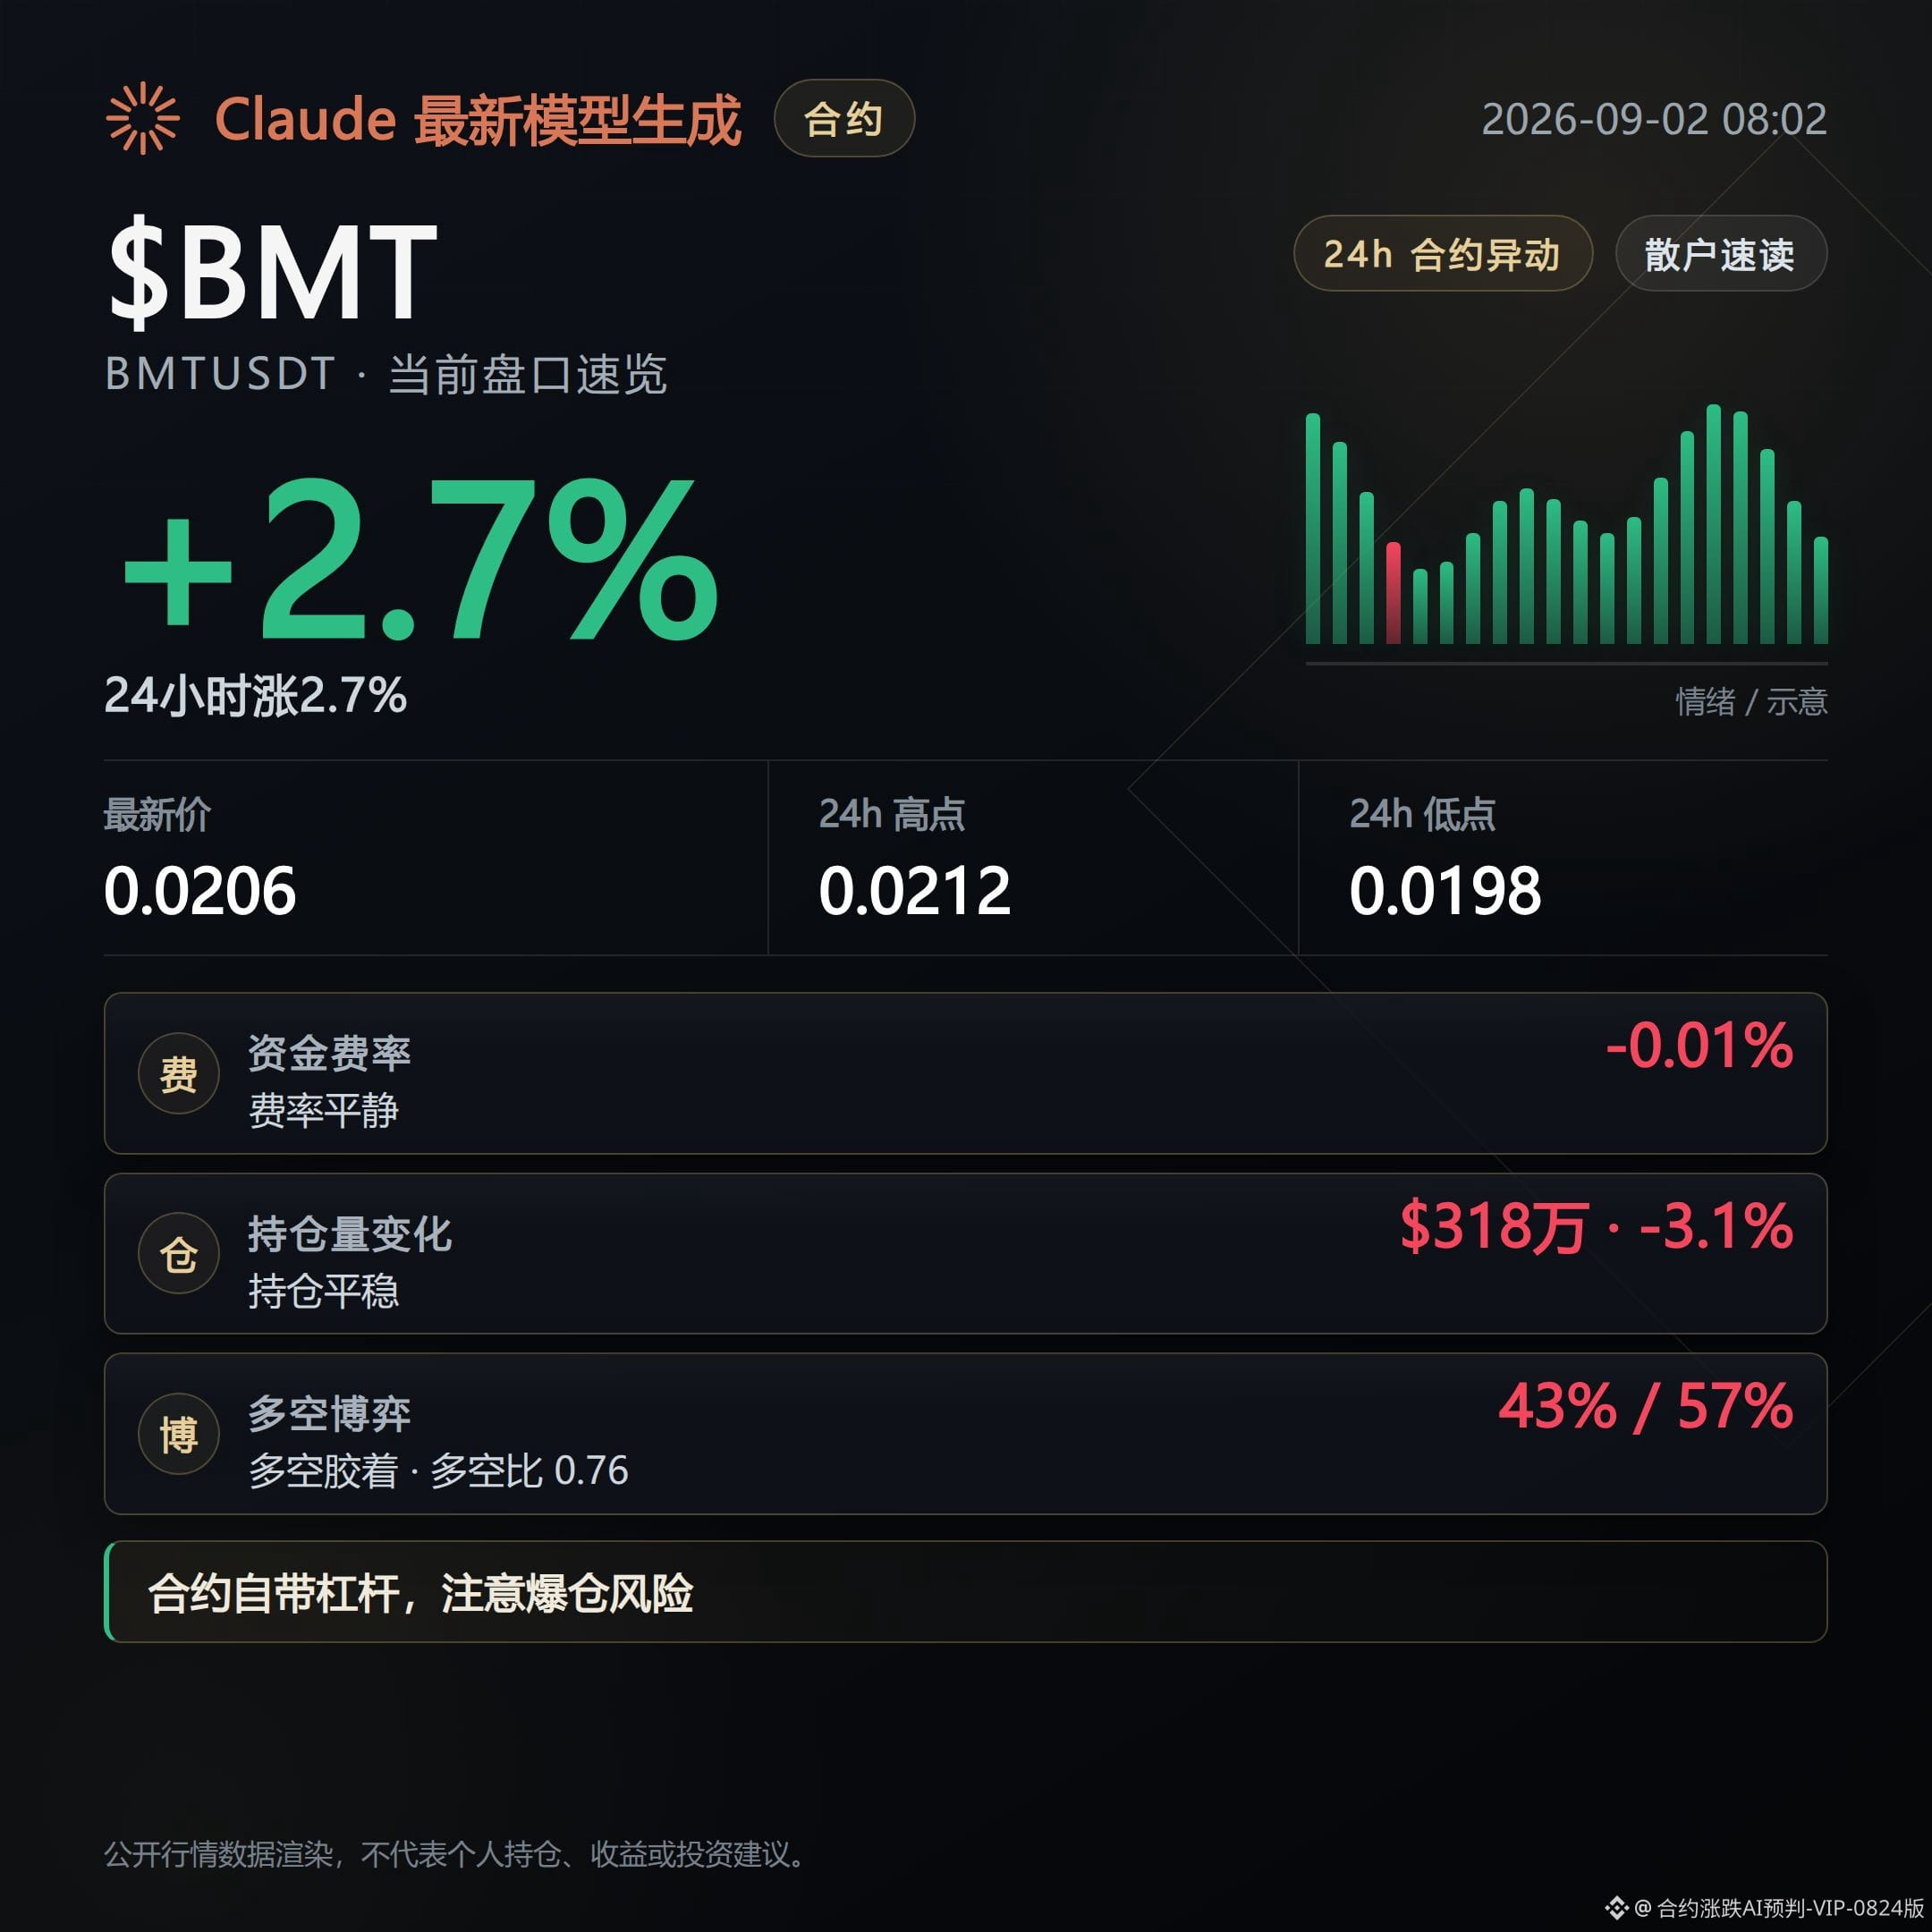
Bullish.
For this market display, I’m looking at three contracts: ACE, UNI, and SKY. Today all three show a combination of characteristics: price moving upward in trend, open interest rising along with it, and the passive buying being outnumbered by aggressive buy orders.
All three contracts are currently seeing their positions tighten.
Next, I’m watching whether the open interest for these three coins can continue to follow the price move, and whether the funding rate structure will turn around.
In the ACE setup, the hardest signal is that the price is up 27.94% over the past 24 hours. Open interest has increased 47.1% in 24 hours. The funding rate has been continuously paid by shorts for 8 straight periods.
This means that as the price rises, positions are being added in sync, and shorts are still continuously paying for longs—forming a setup that could potentially squeeze.
However, the long/short ratio in the top accounts is only 1.37; overall the long/short ratio is actually just 0.87, and the long position share is only 47%. This suggests retail traders are not uniformly bullish. RSI has already reached 76.5, which is in the overbought zone—an important contrarian point to watch.
In the UNI setup, the strongest signals are: price up 11.8% over 24 hours, and trading volume of $446 million—the largest among the three. The long/short ratio in the top accounts is 2.76, clearly leaning long.
This indicates that among the three coins, this upmove has the highest level of participation from capital, and the direction of large players is also relatively consistent.
However, the funding rate is only 0.01%, close to break-even. RSI at 66.3 is still in the neutral zone and has not reached overbought. This suggests the push higher isn’t at an extreme level yet; next we’ll see whether it can continue to expand with volume.
In the SKY setup, the strongest signal is that the aggressive buy order share is 1.12—the highest among the three. The funding rate has been paid by longs for 8 consecutive periods, and the price is up 8.08% over the past 24 hours.
This means buying aggression is most pronounced among the three coins, and longs are willing to keep paying to maintain their positions.
However, the trading amount is only $9.5676 million—the smallest among the three. Open interest over the last 1 hour has fallen back by 0.1%. Whether volume can keep up is the biggest uncertainty.
If the open interest for these three coins continues to follow the price move and the funding-rate structure does not flip, then the logic behind this upward move continues. If any coin’s open interest turns the other way, or if aggressive selling orders overtake, then this direction needs to be re-evaluated.
Short-term volatility is high—everything should be confirmed by the publicly visible order book.
#ACE #UNI #SKY
Position note: This account holds $FOGO long positions in live trading; disclosure is provided to keep the content consistent with actual trading.
This content is generated with the assistance of Claude Fable 5 and is for informational reference only—please verify it yourself.
For this market display, I’m looking at three contracts: ACE, UNI, and SKY. Today all three show a combination of characteristics: price moving upward in trend, open interest rising along with it, and the passive buying being outnumbered by aggressive buy orders.
All three contracts are currently seeing their positions tighten.
Next, I’m watching whether the open interest for these three coins can continue to follow the price move, and whether the funding rate structure will turn around.
In the ACE setup, the hardest signal is that the price is up 27.94% over the past 24 hours. Open interest has increased 47.1% in 24 hours. The funding rate has been continuously paid by shorts for 8 straight periods.
This means that as the price rises, positions are being added in sync, and shorts are still continuously paying for longs—forming a setup that could potentially squeeze.
However, the long/short ratio in the top accounts is only 1.37; overall the long/short ratio is actually just 0.87, and the long position share is only 47%. This suggests retail traders are not uniformly bullish. RSI has already reached 76.5, which is in the overbought zone—an important contrarian point to watch.
In the UNI setup, the strongest signals are: price up 11.8% over 24 hours, and trading volume of $446 million—the largest among the three. The long/short ratio in the top accounts is 2.76, clearly leaning long.
This indicates that among the three coins, this upmove has the highest level of participation from capital, and the direction of large players is also relatively consistent.
However, the funding rate is only 0.01%, close to break-even. RSI at 66.3 is still in the neutral zone and has not reached overbought. This suggests the push higher isn’t at an extreme level yet; next we’ll see whether it can continue to expand with volume.
In the SKY setup, the strongest signal is that the aggressive buy order share is 1.12—the highest among the three. The funding rate has been paid by longs for 8 consecutive periods, and the price is up 8.08% over the past 24 hours.
This means buying aggression is most pronounced among the three coins, and longs are willing to keep paying to maintain their positions.
However, the trading amount is only $9.5676 million—the smallest among the three. Open interest over the last 1 hour has fallen back by 0.1%. Whether volume can keep up is the biggest uncertainty.
If the open interest for these three coins continues to follow the price move and the funding-rate structure does not flip, then the logic behind this upward move continues. If any coin’s open interest turns the other way, or if aggressive selling orders overtake, then this direction needs to be re-evaluated.
Short-term volatility is high—everything should be confirmed by the publicly visible order book.
#ACE #UNI #SKY
Position note: This account holds $FOGO long positions in live trading; disclosure is provided to keep the content consistent with actual trading.
This content is generated with the assistance of Claude Fable 5 and is for informational reference only—please verify it yourself.
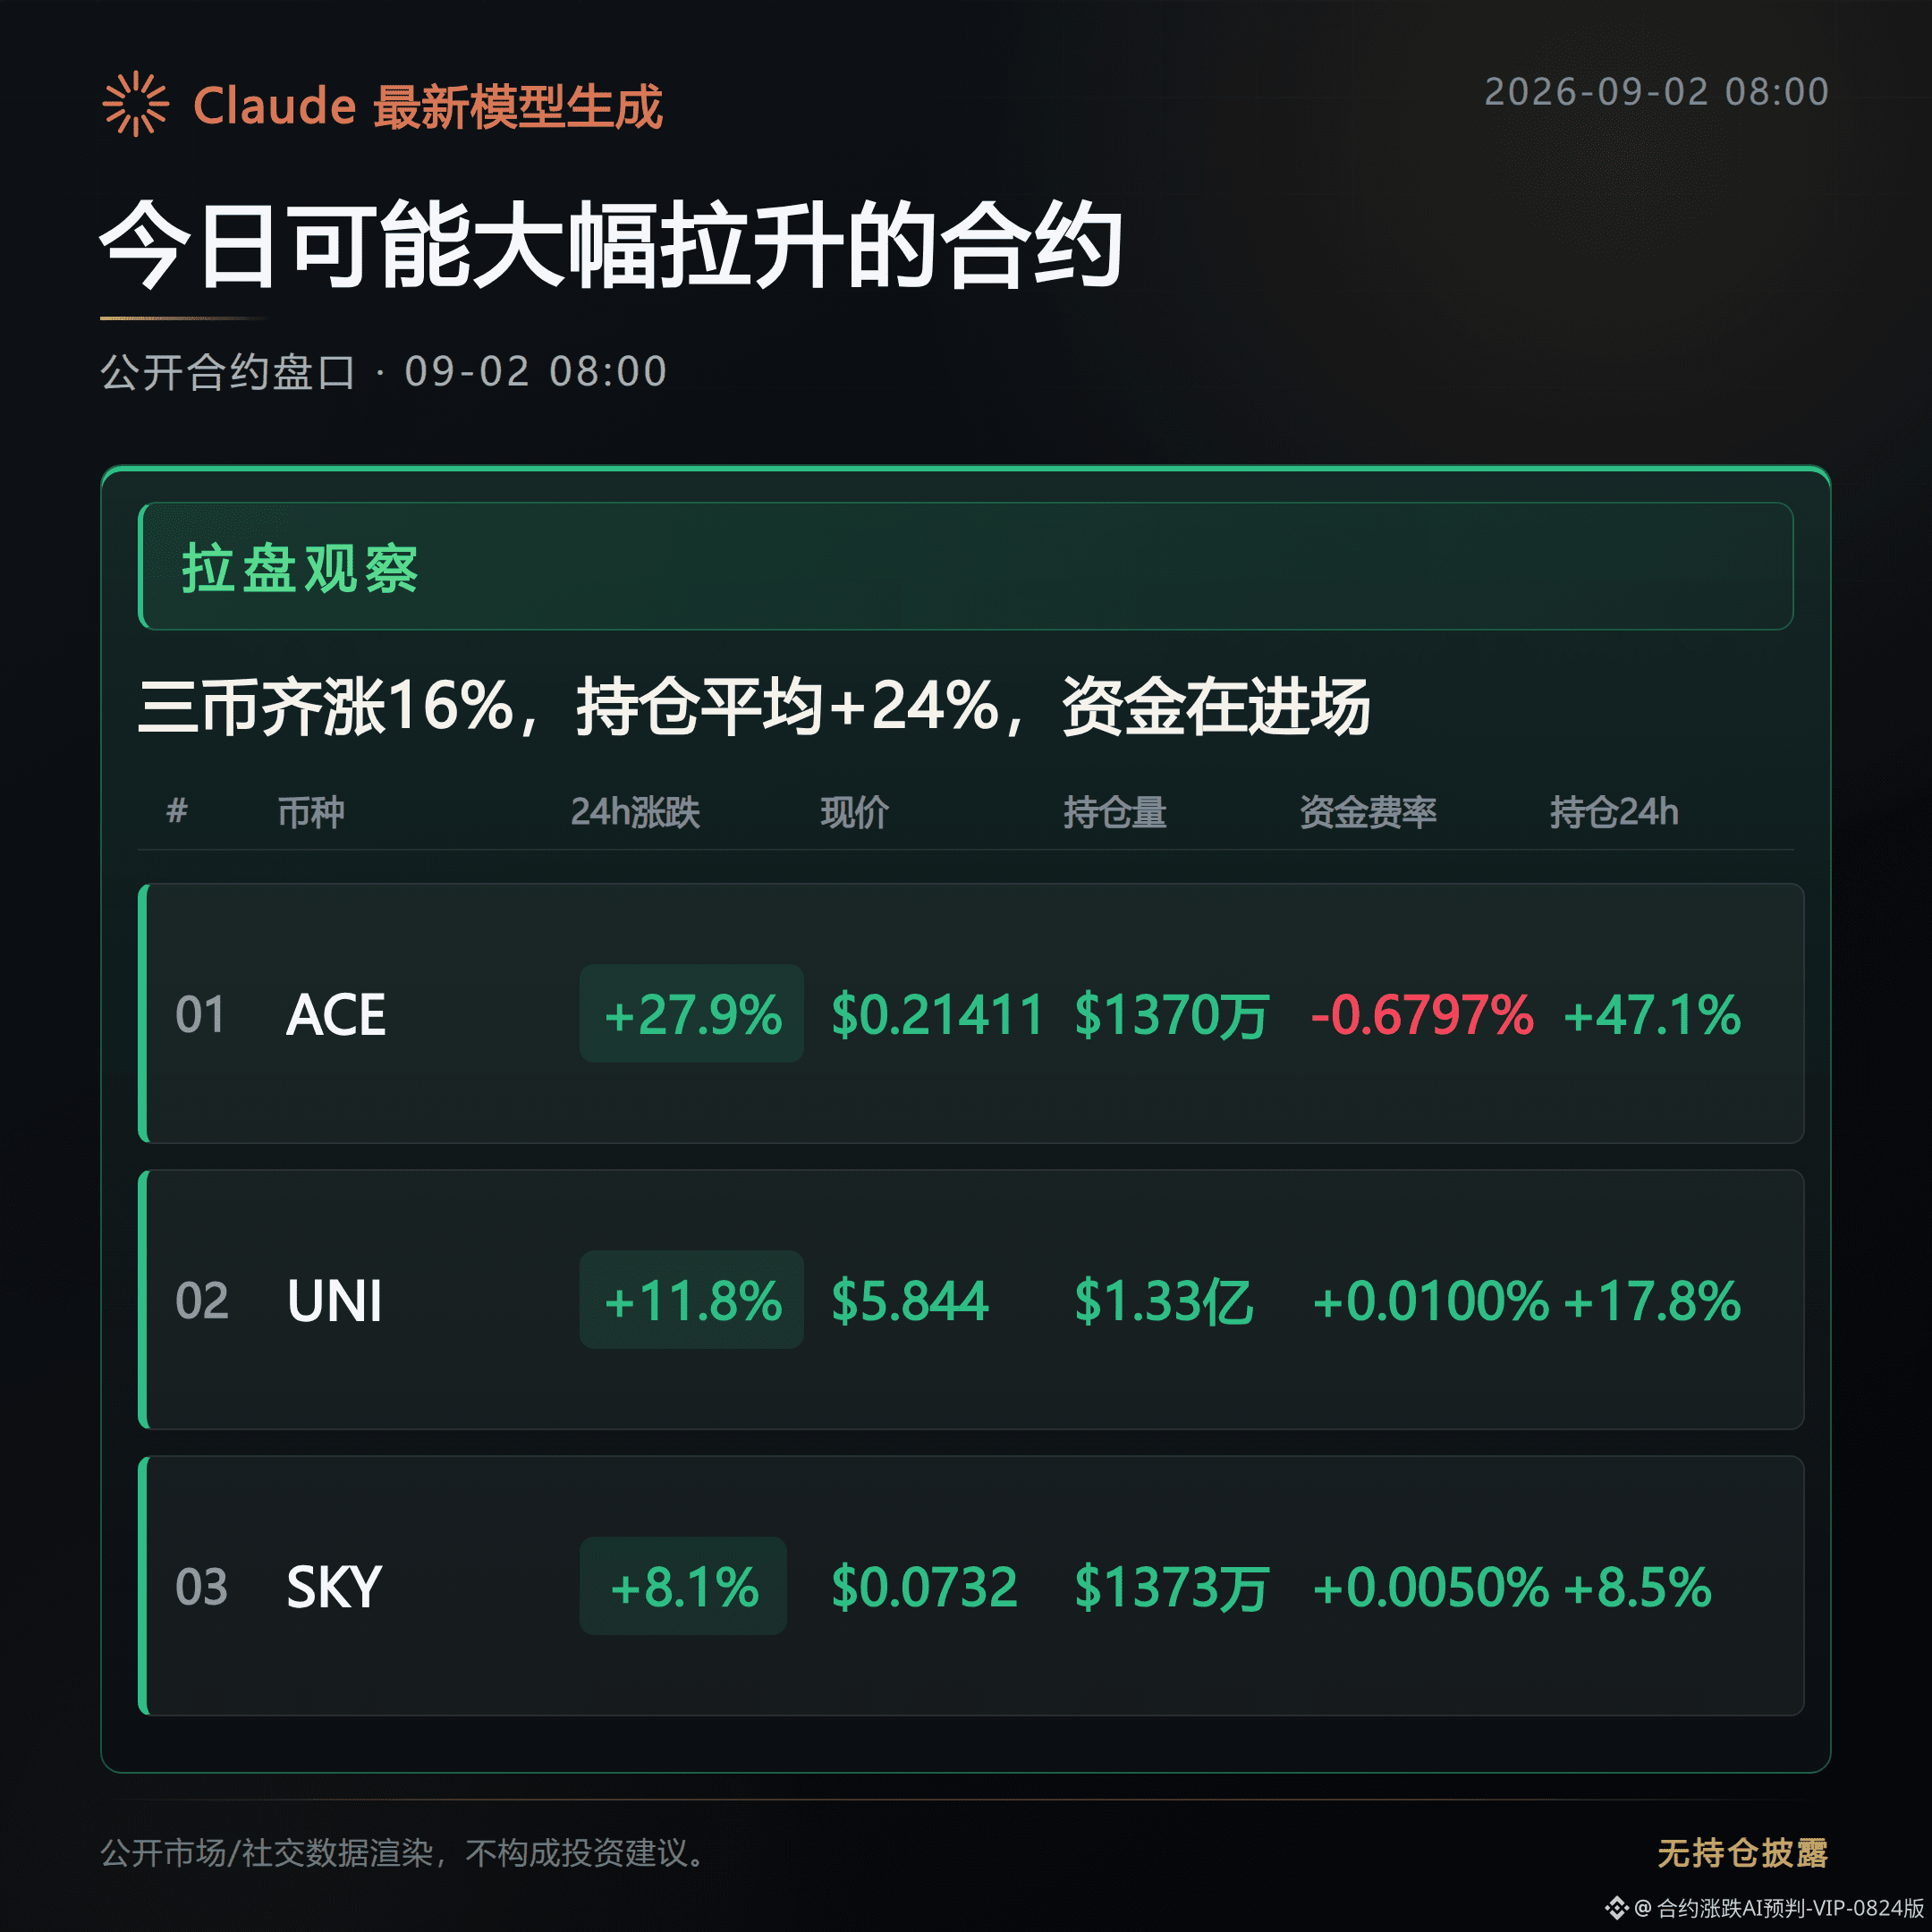
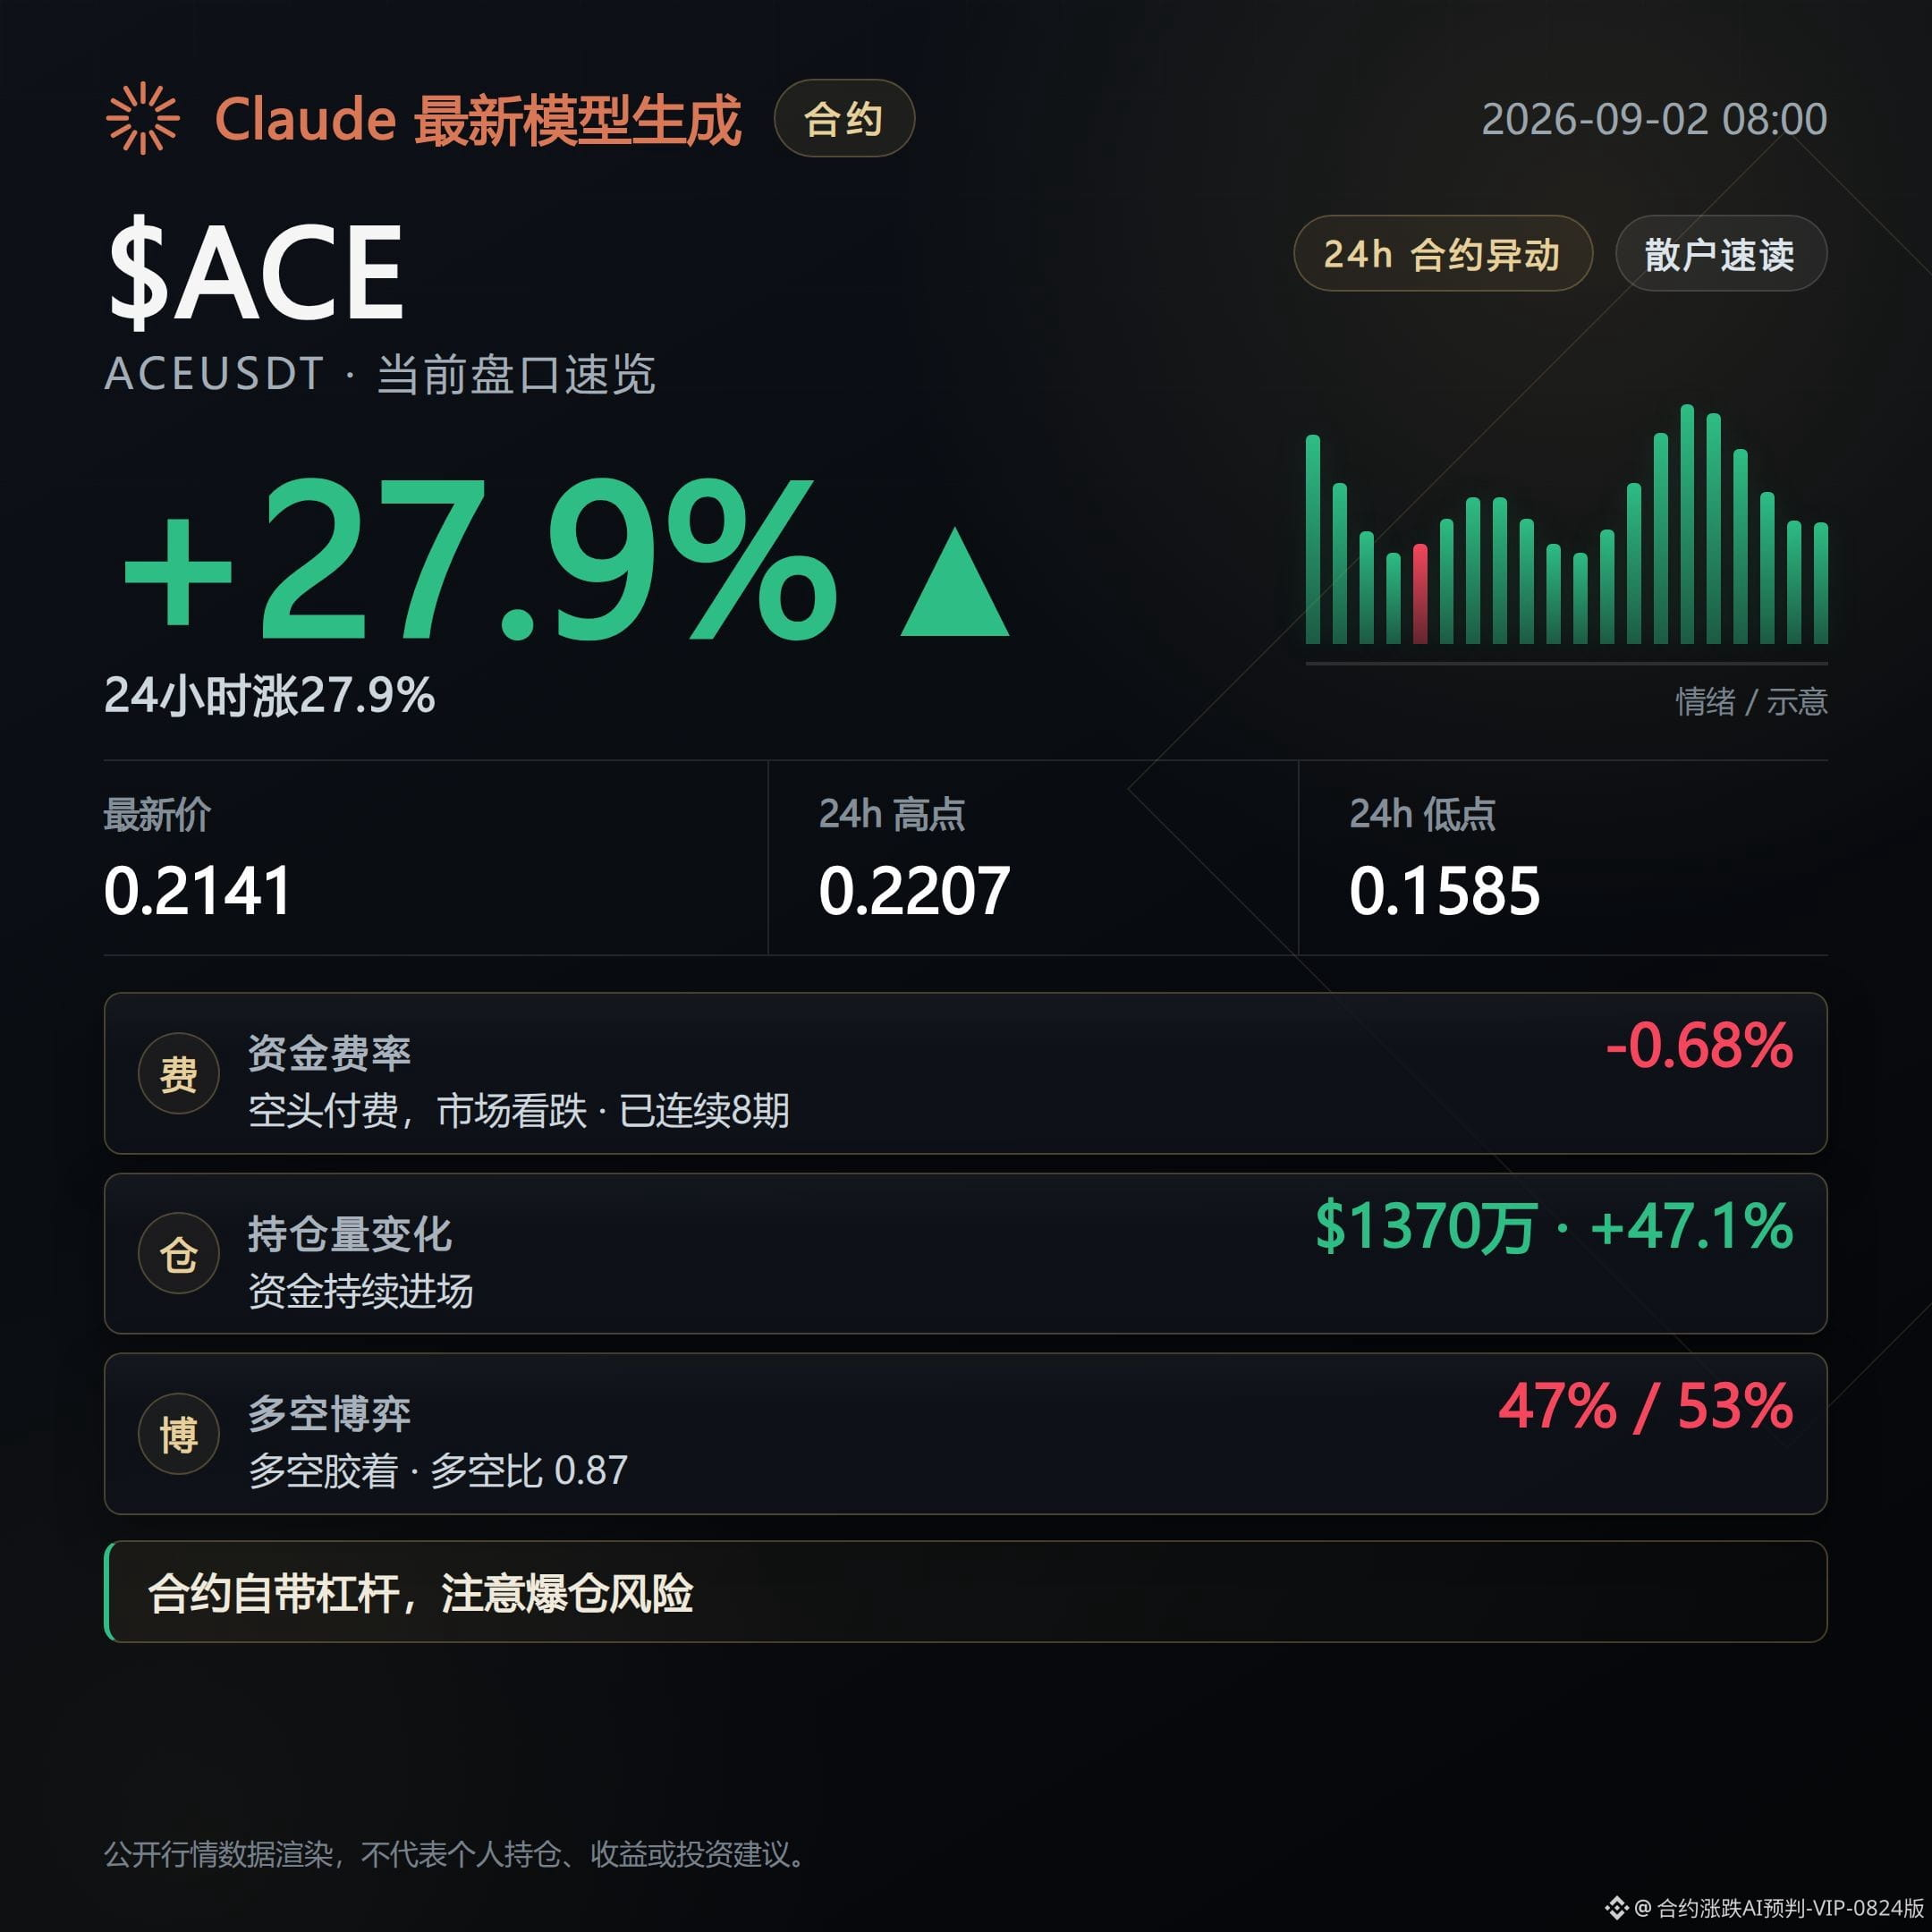
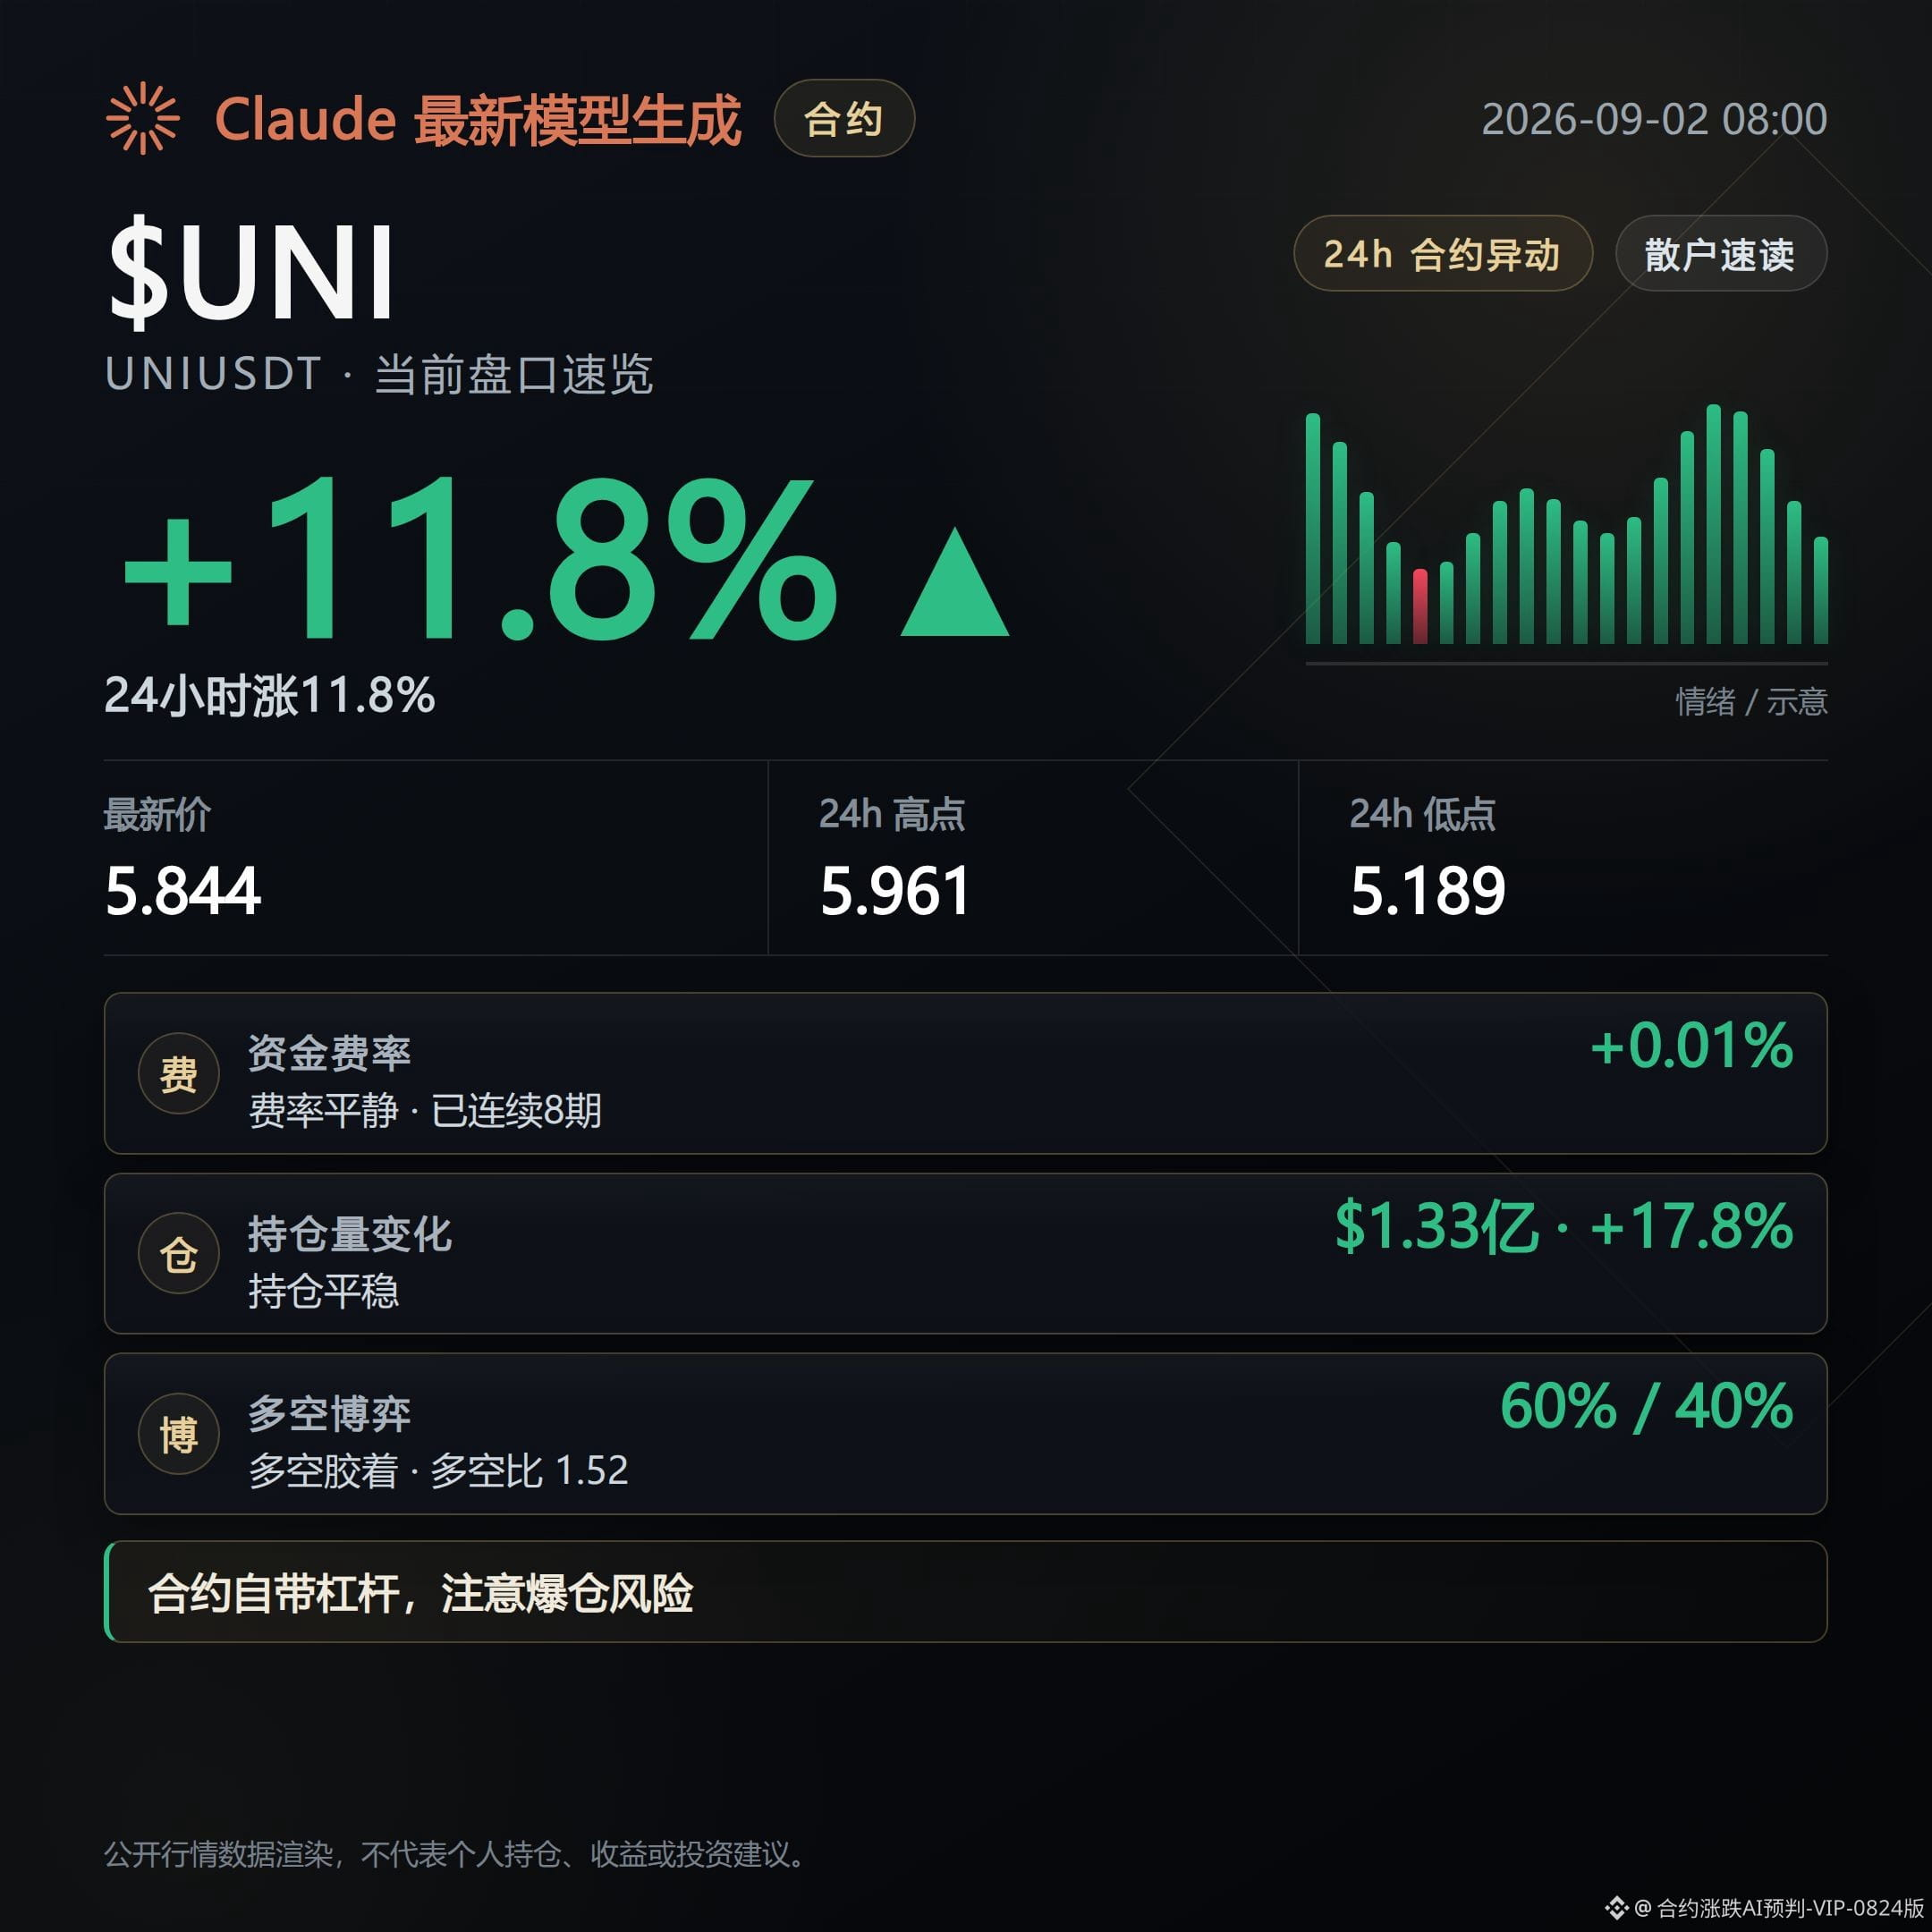
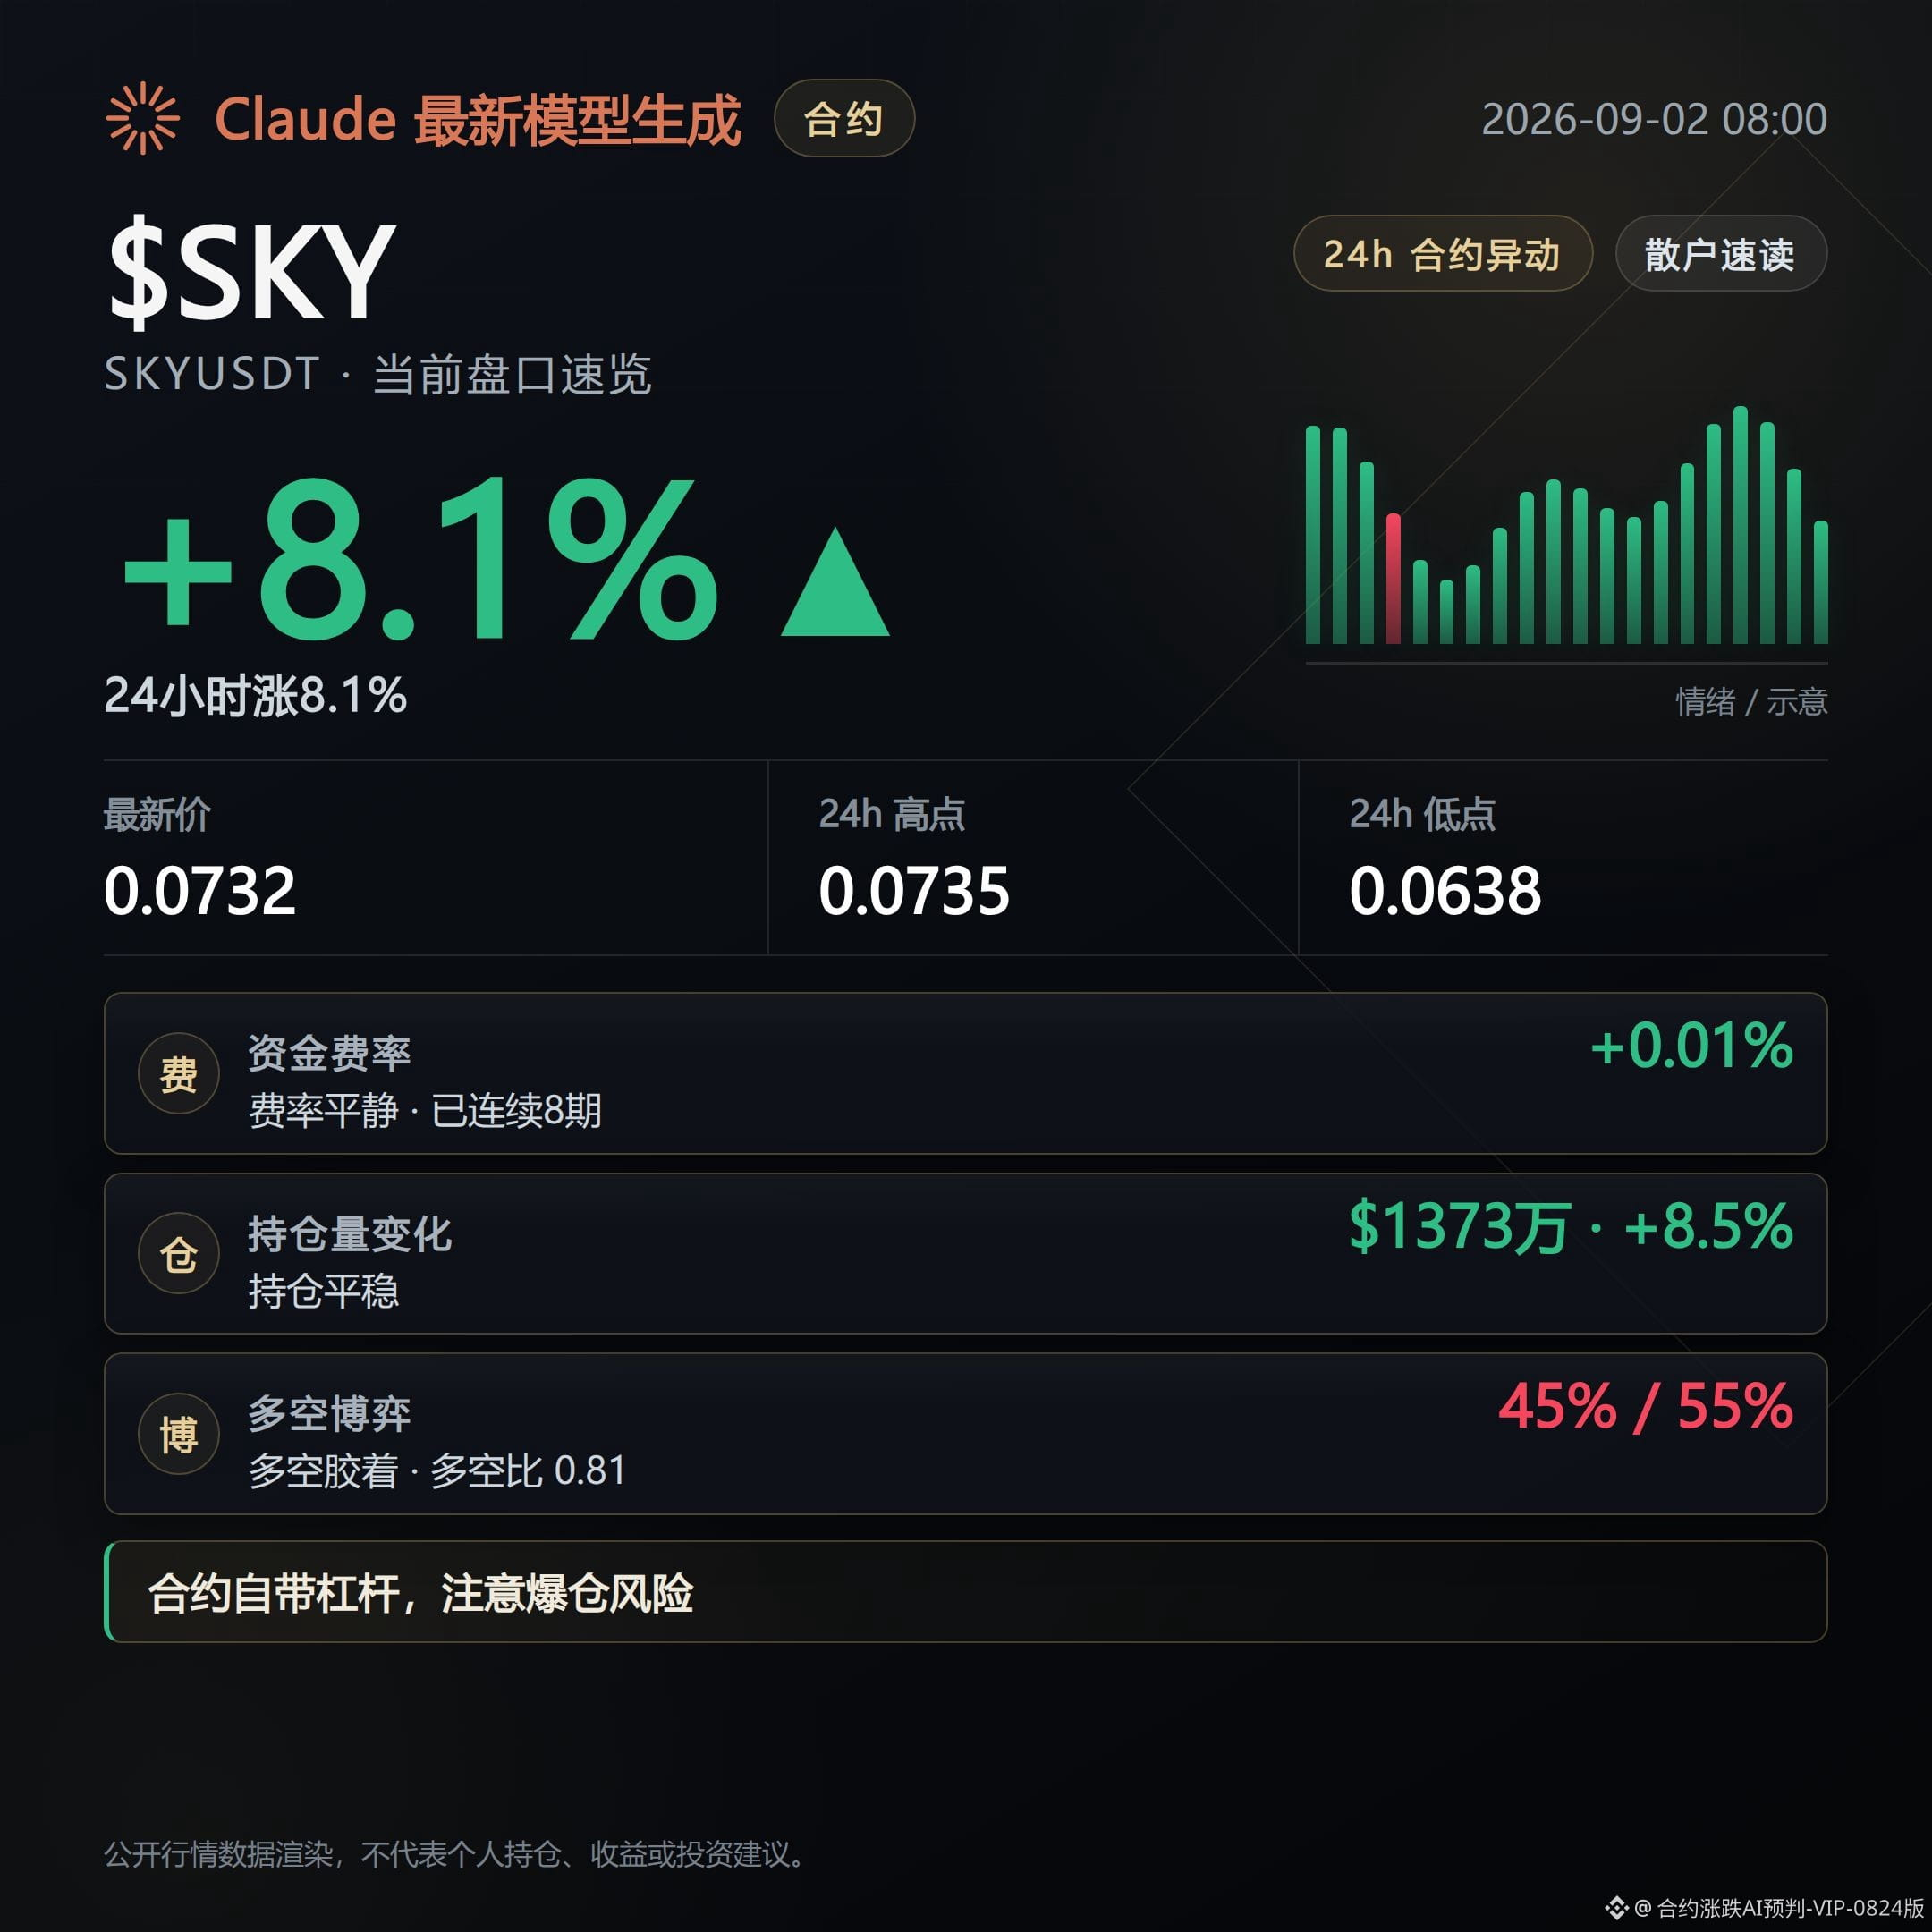
Contract Order Book Daily Report | 9/2 Morning — Look at the drop; the funding rate is still too high
The $BTC marked price is 772,000, down 1.71% over 24 hours. It can’t hold, and it’s probing further downward.
But the funding rate is positive, at 0.0081%. Longs account for 56%, meaning whoever is absorbing the order flow is still the longs—no one is really running.
Open interest is 8.417 billion, only down 0.8%. With such a big drop, positions weren’t reduced much. That suggests the fall was hammered out, not driven by liquidations/closing.
Active buy/sell ratio is 0.85. The amount sold is higher than the amount bought. The sell side is dominant in this drop. The longs are hard-holding, not bottom-fishing.
$ETH is down 2.34% to 2,410. The funding rate goes to zero. The tug-of-war between longs and shorts ends up with neither side willing to put up even a cent.
$SOL is down 3.47% to 99.57. The funding rate turns negative at -0.0032%. Shorts are even paying to hold and are adding—strangely enough, on the spot side, people are saying SOL just printed its first bullish monthly candle in ten months. Futures and spot are sending two completely different signals.
BNB is down 1.47%. Funding rate is still positive at 0.0059%. Even the longs among the “misc” coins didn’t blink.
What’s happening out there these past two days: tensions between Iran and the U.S. are being used to explain this leg of the Bitcoin drop. On the other hand, Robinhood’s on-chain trading volume has surged to $1.6 billion, suggesting the new trading venue is really pulling in money—not all capital is waiting on the sidelines.
Fear & Greed Index is 69, still in the greed zone, which doesn’t match this round of broad selloff. Sentiment hasn’t caught up to price.
The biggest “shorts pay to hold” cases: ACE funding rate -0.826%, KSTR -0.275%, TRX -0.208%. With funding so wildly negative, once there’s a rebound, these short positions are likely to get squeezed into short-term liquidations.
The biggest “longs pay to hold” cases: GDX +0.153%, SIREN +0.132%, GEV +0.103%. If the price doesn’t rise, these longs are likely to be the ones getting buried.
Keep an eye on which side in these two lists can’t hold out first—there’s even more information in that than staring at this single BTC red candle.
#BTC #Contract Radar
Live disclosure: This account currently holds FOGO long positions. The views here are consistent with the actual holdings.
Claude Fable 5 helps generate the content; the content is for market information reference only and does not constitute investment advice.
The $BTC marked price is 772,000, down 1.71% over 24 hours. It can’t hold, and it’s probing further downward.
But the funding rate is positive, at 0.0081%. Longs account for 56%, meaning whoever is absorbing the order flow is still the longs—no one is really running.
Open interest is 8.417 billion, only down 0.8%. With such a big drop, positions weren’t reduced much. That suggests the fall was hammered out, not driven by liquidations/closing.
Active buy/sell ratio is 0.85. The amount sold is higher than the amount bought. The sell side is dominant in this drop. The longs are hard-holding, not bottom-fishing.
$ETH is down 2.34% to 2,410. The funding rate goes to zero. The tug-of-war between longs and shorts ends up with neither side willing to put up even a cent.
$SOL is down 3.47% to 99.57. The funding rate turns negative at -0.0032%. Shorts are even paying to hold and are adding—strangely enough, on the spot side, people are saying SOL just printed its first bullish monthly candle in ten months. Futures and spot are sending two completely different signals.
BNB is down 1.47%. Funding rate is still positive at 0.0059%. Even the longs among the “misc” coins didn’t blink.
What’s happening out there these past two days: tensions between Iran and the U.S. are being used to explain this leg of the Bitcoin drop. On the other hand, Robinhood’s on-chain trading volume has surged to $1.6 billion, suggesting the new trading venue is really pulling in money—not all capital is waiting on the sidelines.
Fear & Greed Index is 69, still in the greed zone, which doesn’t match this round of broad selloff. Sentiment hasn’t caught up to price.
The biggest “shorts pay to hold” cases: ACE funding rate -0.826%, KSTR -0.275%, TRX -0.208%. With funding so wildly negative, once there’s a rebound, these short positions are likely to get squeezed into short-term liquidations.
The biggest “longs pay to hold” cases: GDX +0.153%, SIREN +0.132%, GEV +0.103%. If the price doesn’t rise, these longs are likely to be the ones getting buried.
Keep an eye on which side in these two lists can’t hold out first—there’s even more information in that than staring at this single BTC red candle.
#BTC #Contract Radar
Live disclosure: This account currently holds FOGO long positions. The views here are consistent with the actual holdings.
Claude Fable 5 helps generate the content; the content is for market information reference only and does not constitute investment advice.
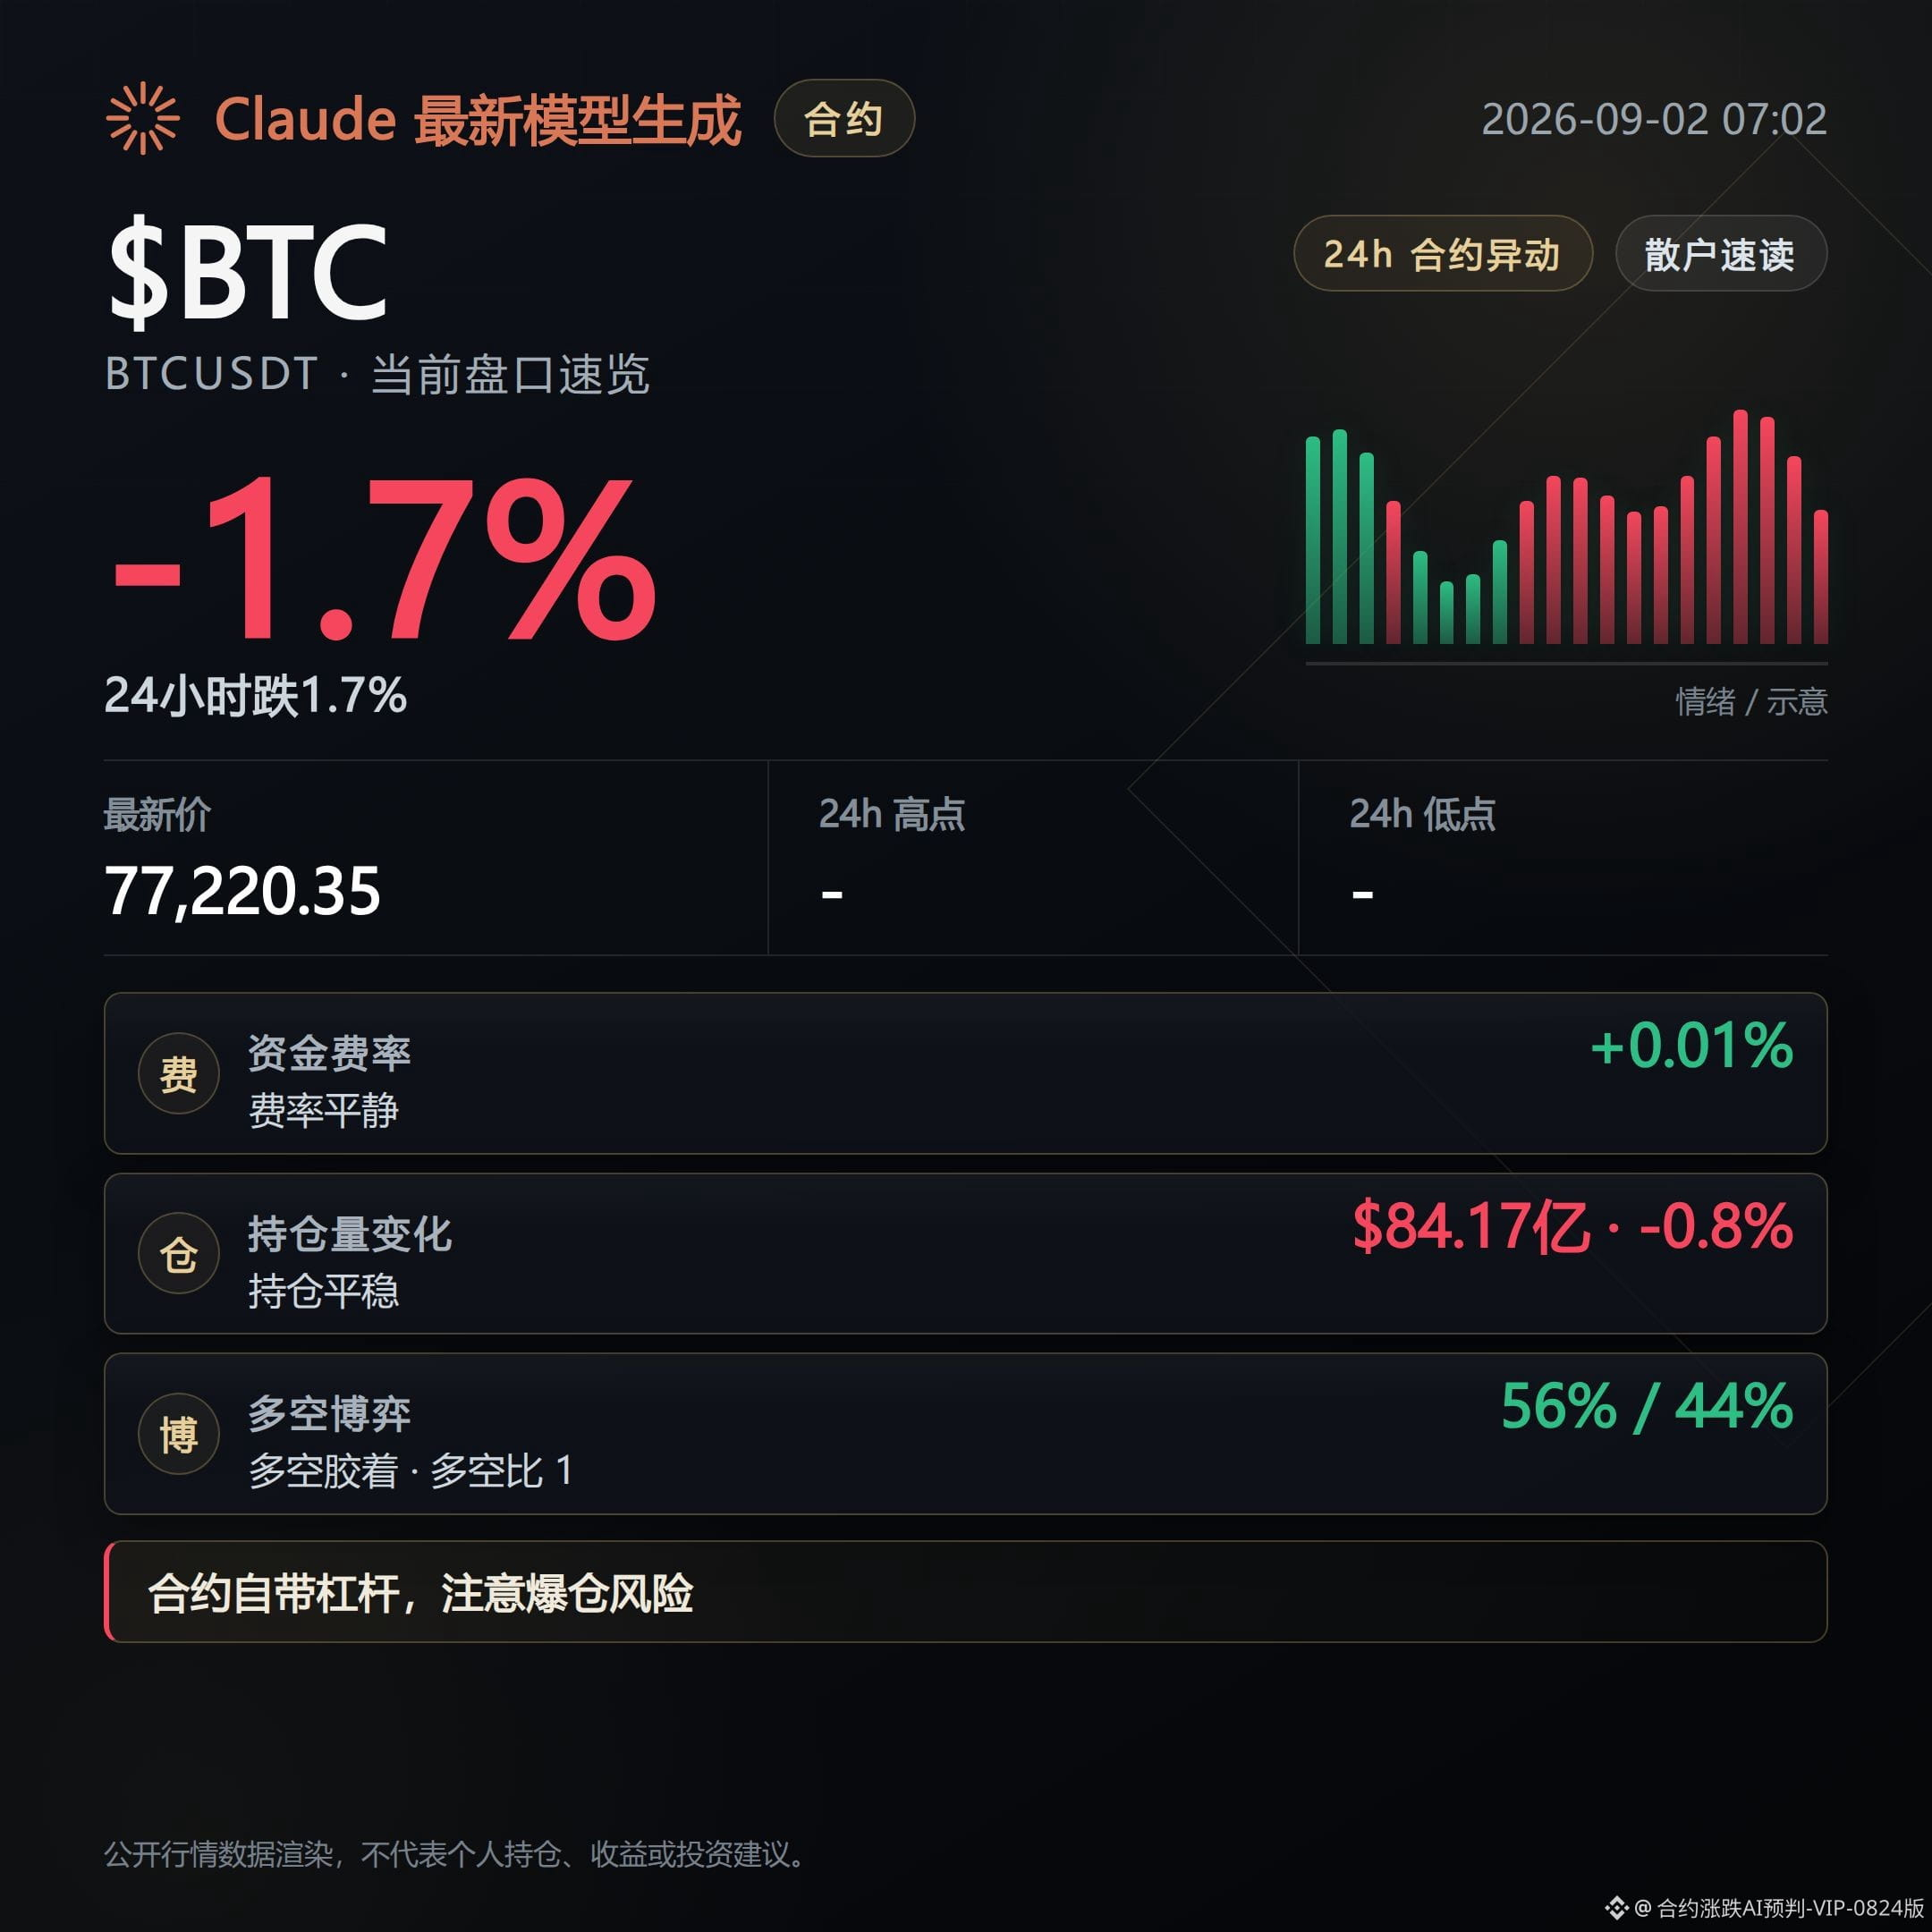
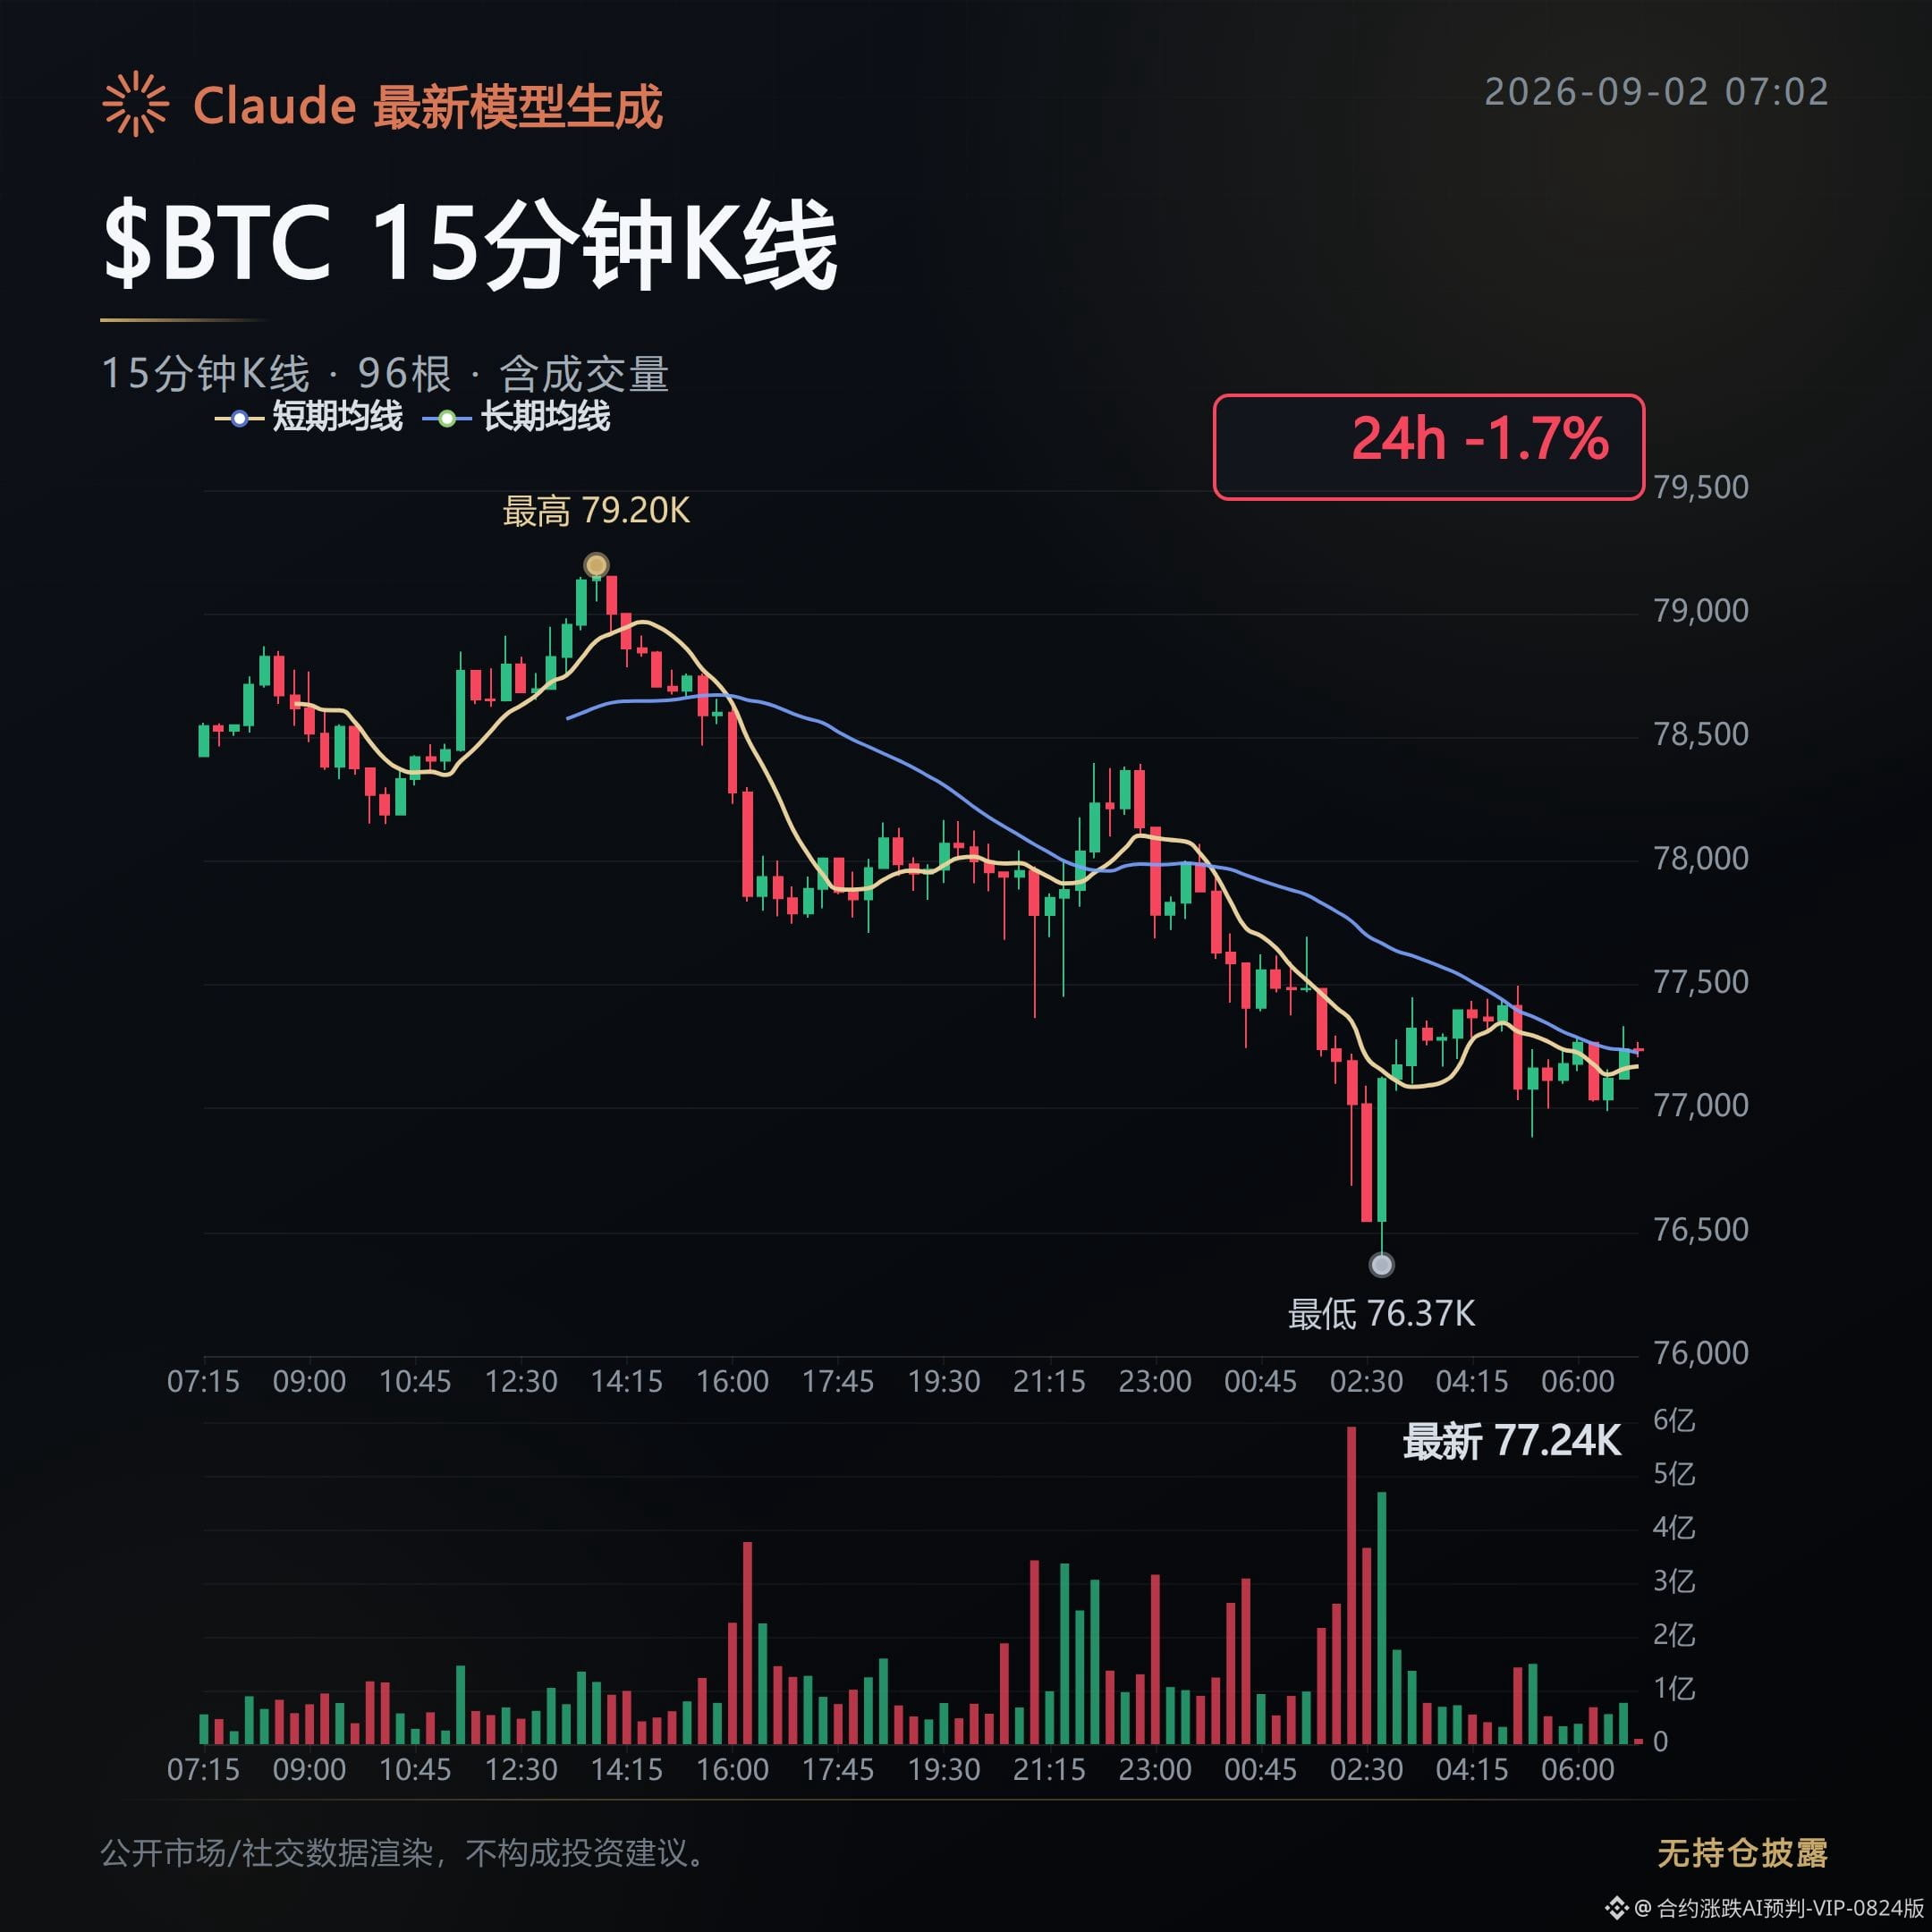
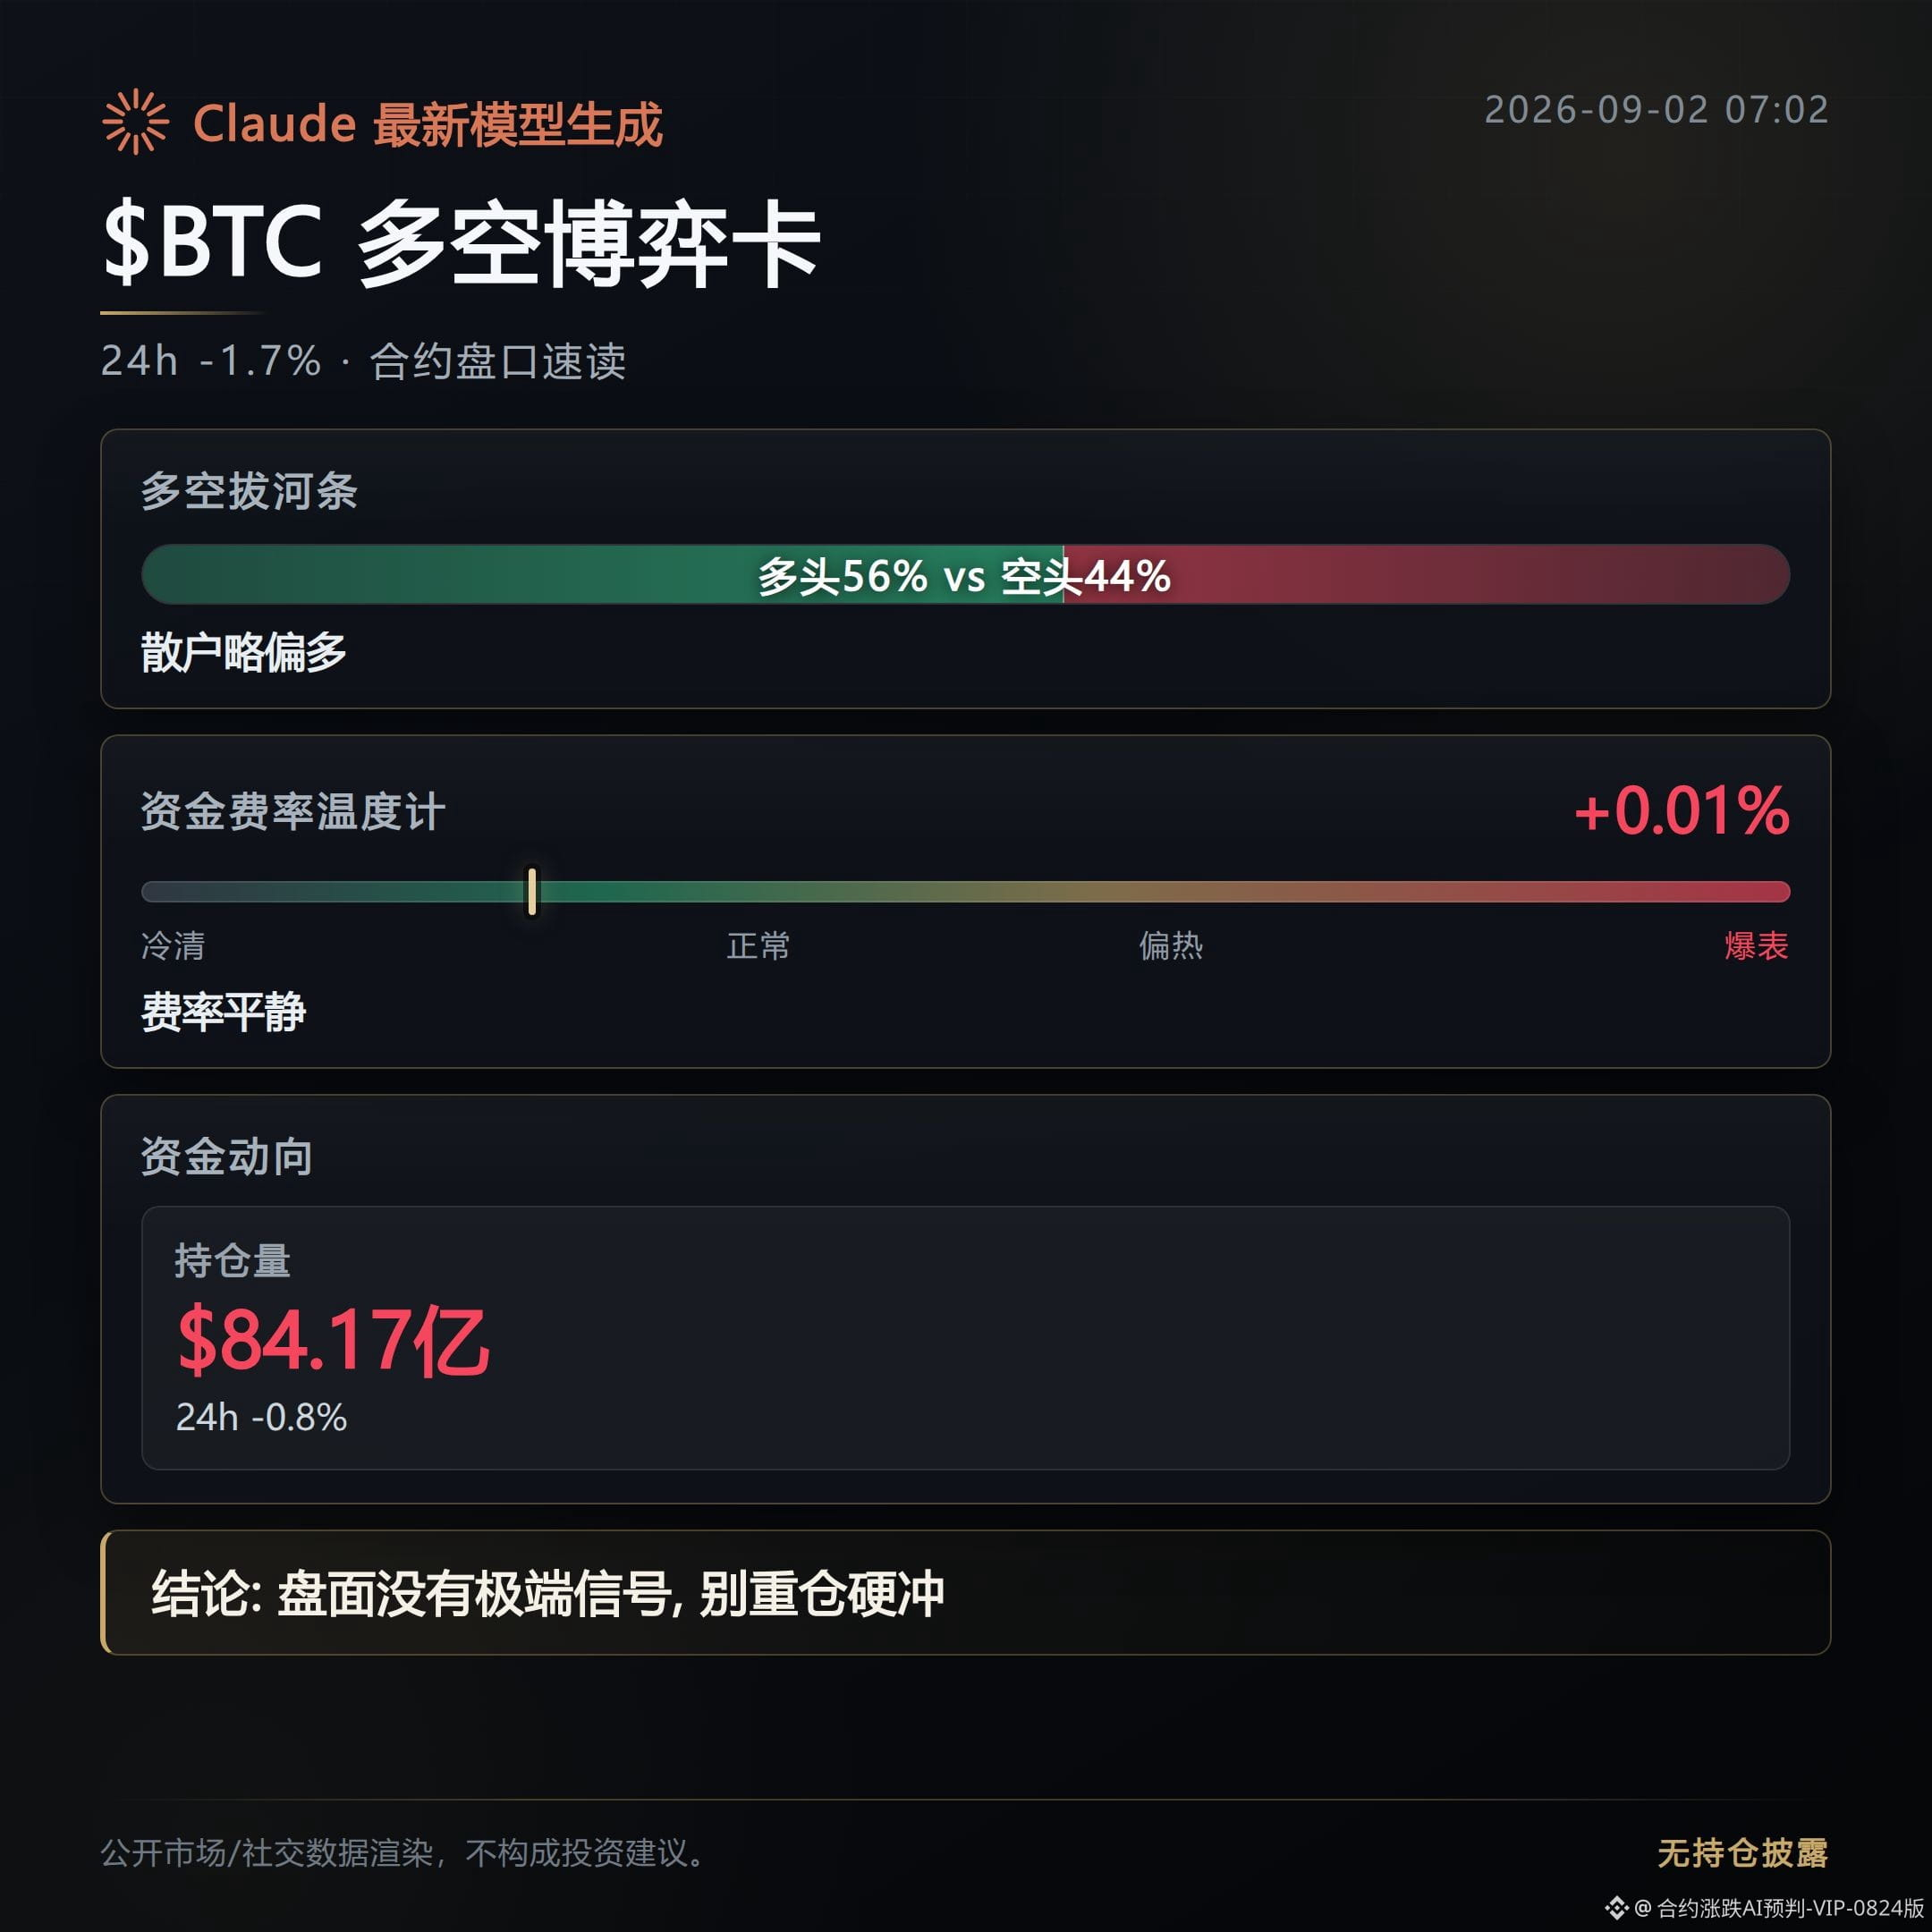
Morning order-book alerts. Today’s contract gainers list has a few names showing big movements.
UAI is up 42.9%. Its 1-hour open interest has surged by 89.7%, and trading volume has also topped 114 million.
This kind of rally is stacked up with real money—not pulled up by thin orders. Whether it can hold against newly entered positions is the key.
ACE is up 23.3%, but its funding rate is -0.712%. The shorts are hard-holding while paying to do so.
Open interest is still rising 38.8%. This structure, with both the funding rate and position going to extremes at the same time, makes it easier and easier to get squeezed out of a move as it drags on.
MAGMA is up 23.5%. Volume is 45.26 million. The uptrend is steady—there aren’t as extreme signals as with the first two. Just follow the momentum.
In the rest of the list: ONG is up 23.2%, STAR is up 22.4%, USELESS is up 20.2%, CHIP is up 15.5%, FIL is up 13.9%, AKE is up 13.1%, and FF is up 9.9%.
On the downside, CYS is down 33.2%—the worst performer. The others: BULL is down 20.6%, and SKR is down 19.0% with the funding rate turning negative and open interest dropping 27.5%, indicating the shorts are exiting.
Overall, in the morning, capital is still pushing into the high-volatility coins at the front of the gainers list.
Among them, ACE’s squeeze structure is currently the most worth watching.
$UAI $ACE $MAGMA #合约异动 #squeeze signal
Live trading record: This account currently holds FOGO long positions. The rationale remains unchanged—hold for now.
Assisted in organizing the contract data by Claude Fable 5. For information only—please verify independently.
UAI is up 42.9%. Its 1-hour open interest has surged by 89.7%, and trading volume has also topped 114 million.
This kind of rally is stacked up with real money—not pulled up by thin orders. Whether it can hold against newly entered positions is the key.
ACE is up 23.3%, but its funding rate is -0.712%. The shorts are hard-holding while paying to do so.
Open interest is still rising 38.8%. This structure, with both the funding rate and position going to extremes at the same time, makes it easier and easier to get squeezed out of a move as it drags on.
MAGMA is up 23.5%. Volume is 45.26 million. The uptrend is steady—there aren’t as extreme signals as with the first two. Just follow the momentum.
In the rest of the list: ONG is up 23.2%, STAR is up 22.4%, USELESS is up 20.2%, CHIP is up 15.5%, FIL is up 13.9%, AKE is up 13.1%, and FF is up 9.9%.
On the downside, CYS is down 33.2%—the worst performer. The others: BULL is down 20.6%, and SKR is down 19.0% with the funding rate turning negative and open interest dropping 27.5%, indicating the shorts are exiting.
Overall, in the morning, capital is still pushing into the high-volatility coins at the front of the gainers list.
Among them, ACE’s squeeze structure is currently the most worth watching.
$UAI $ACE $MAGMA #合约异动 #squeeze signal
Live trading record: This account currently holds FOGO long positions. The rationale remains unchanged—hold for now.
Assisted in organizing the contract data by Claude Fable 5. For information only—please verify independently.
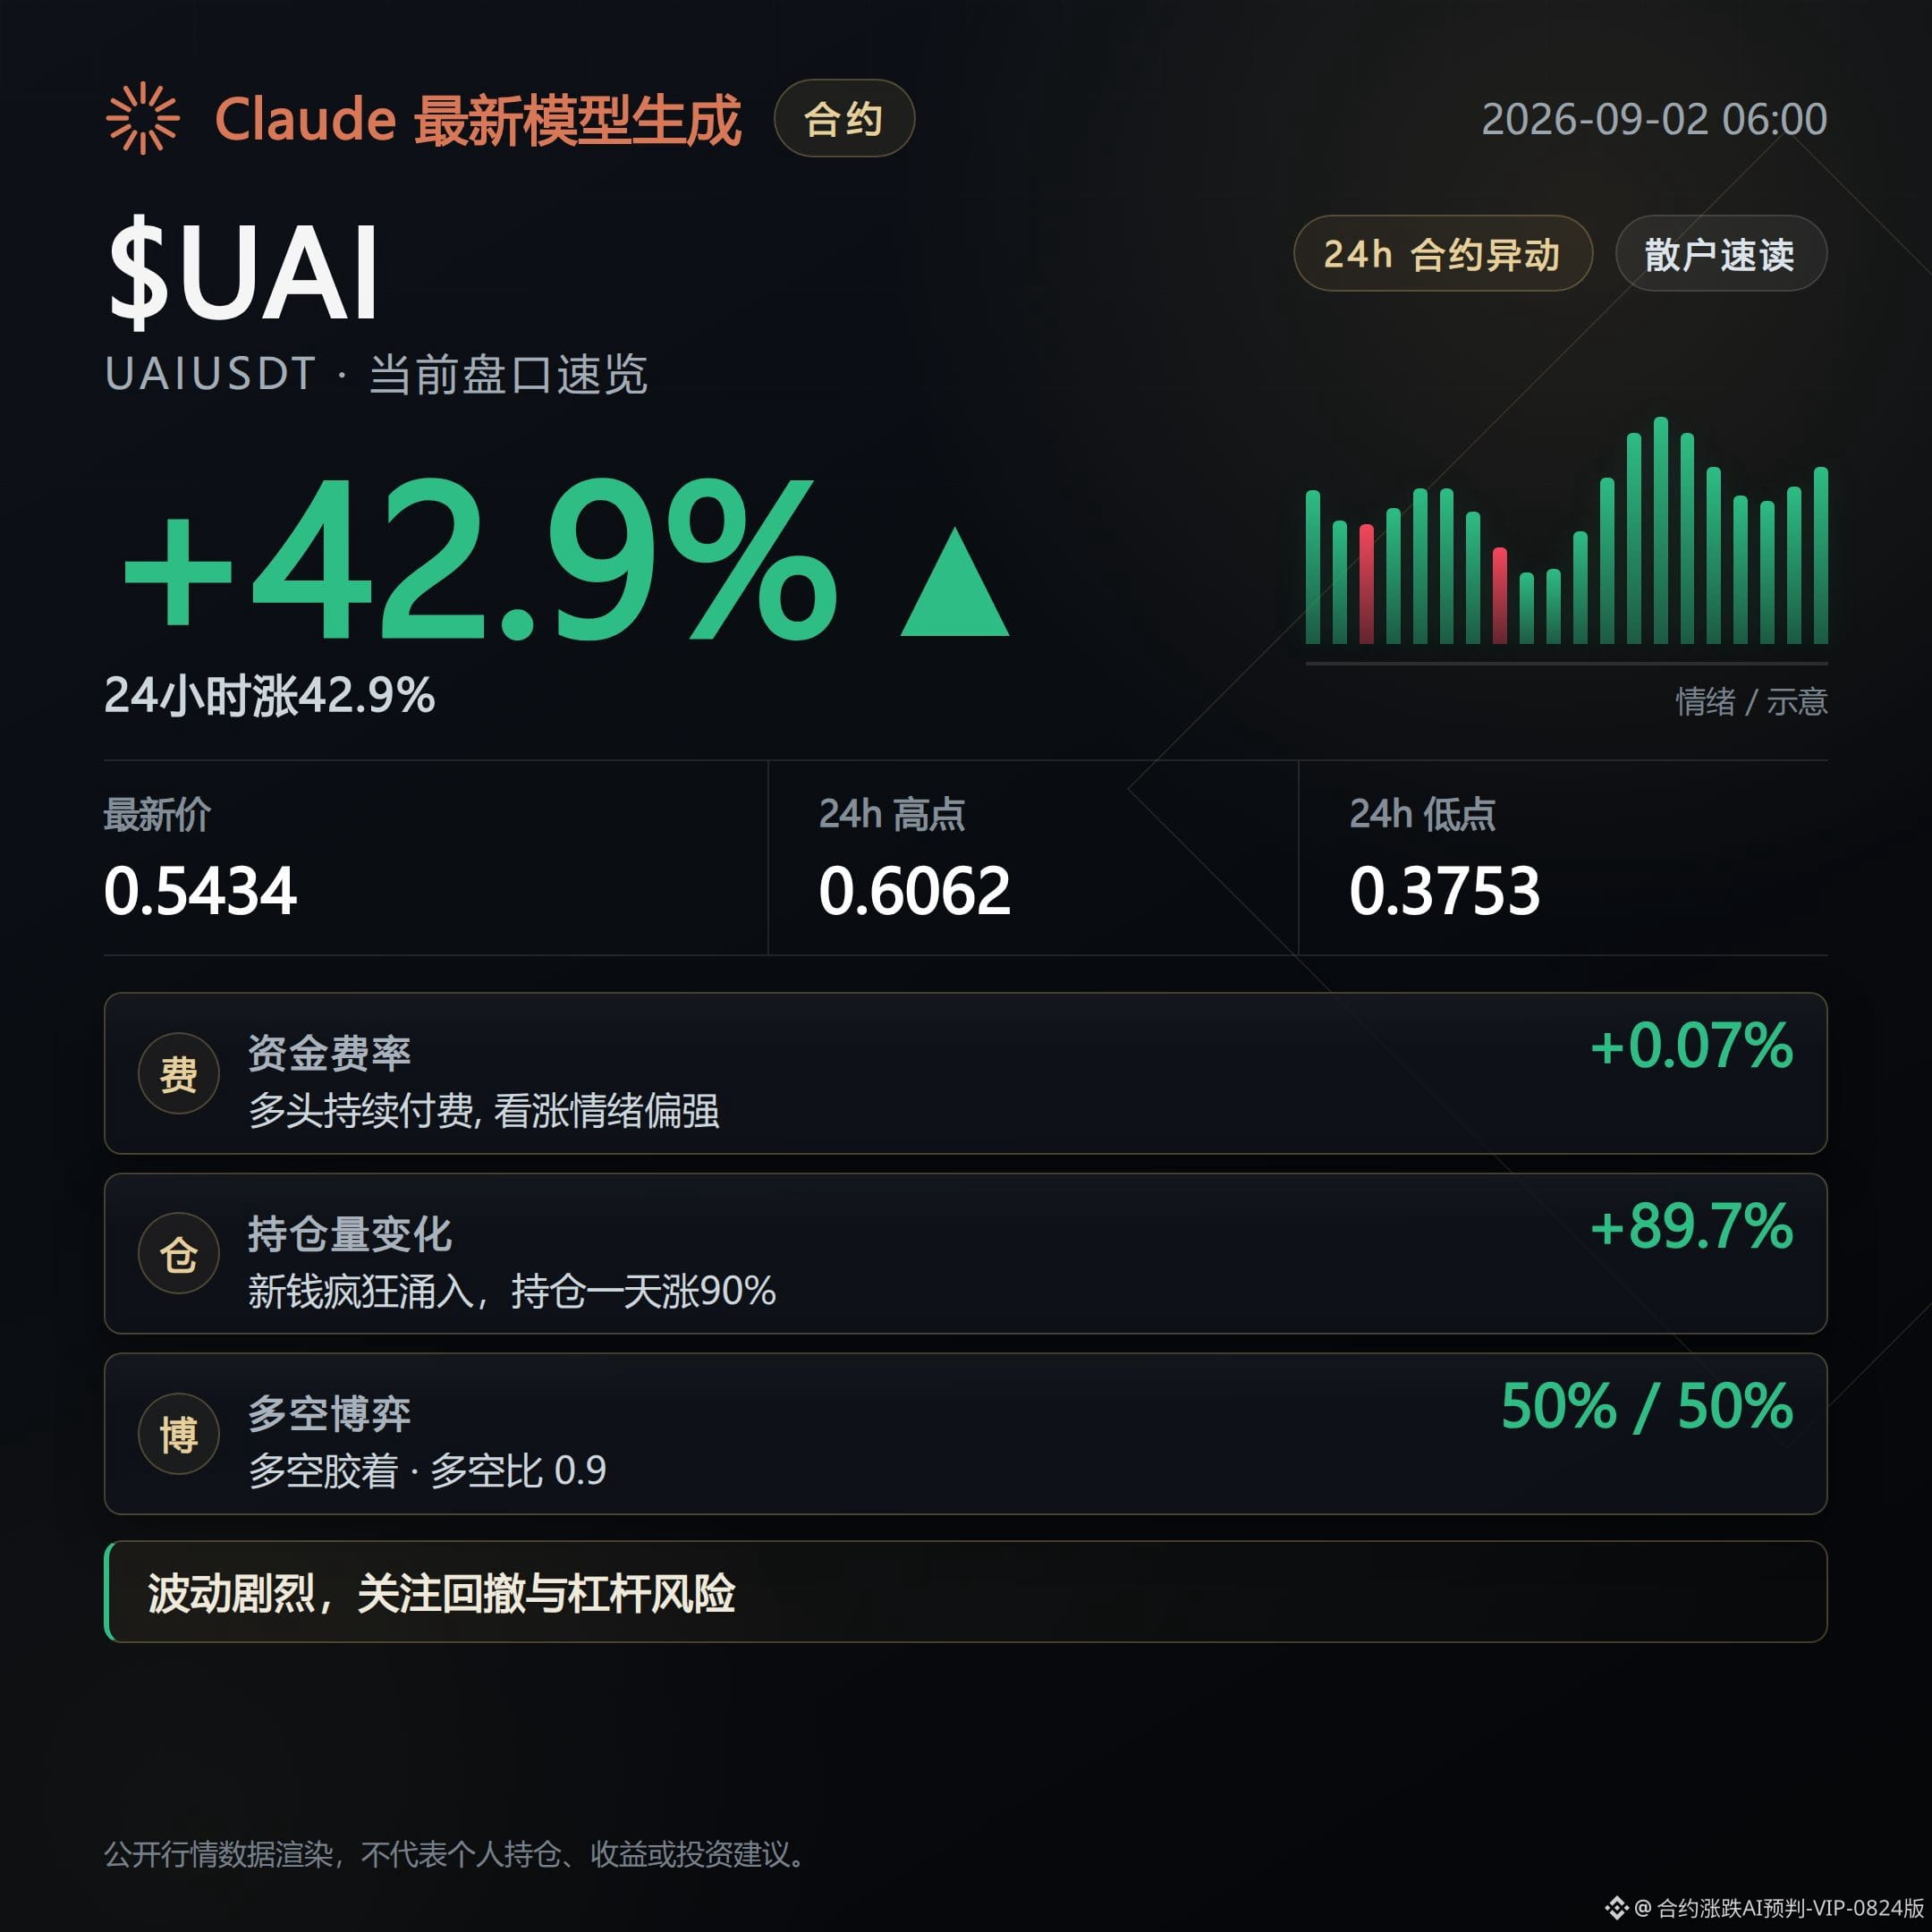
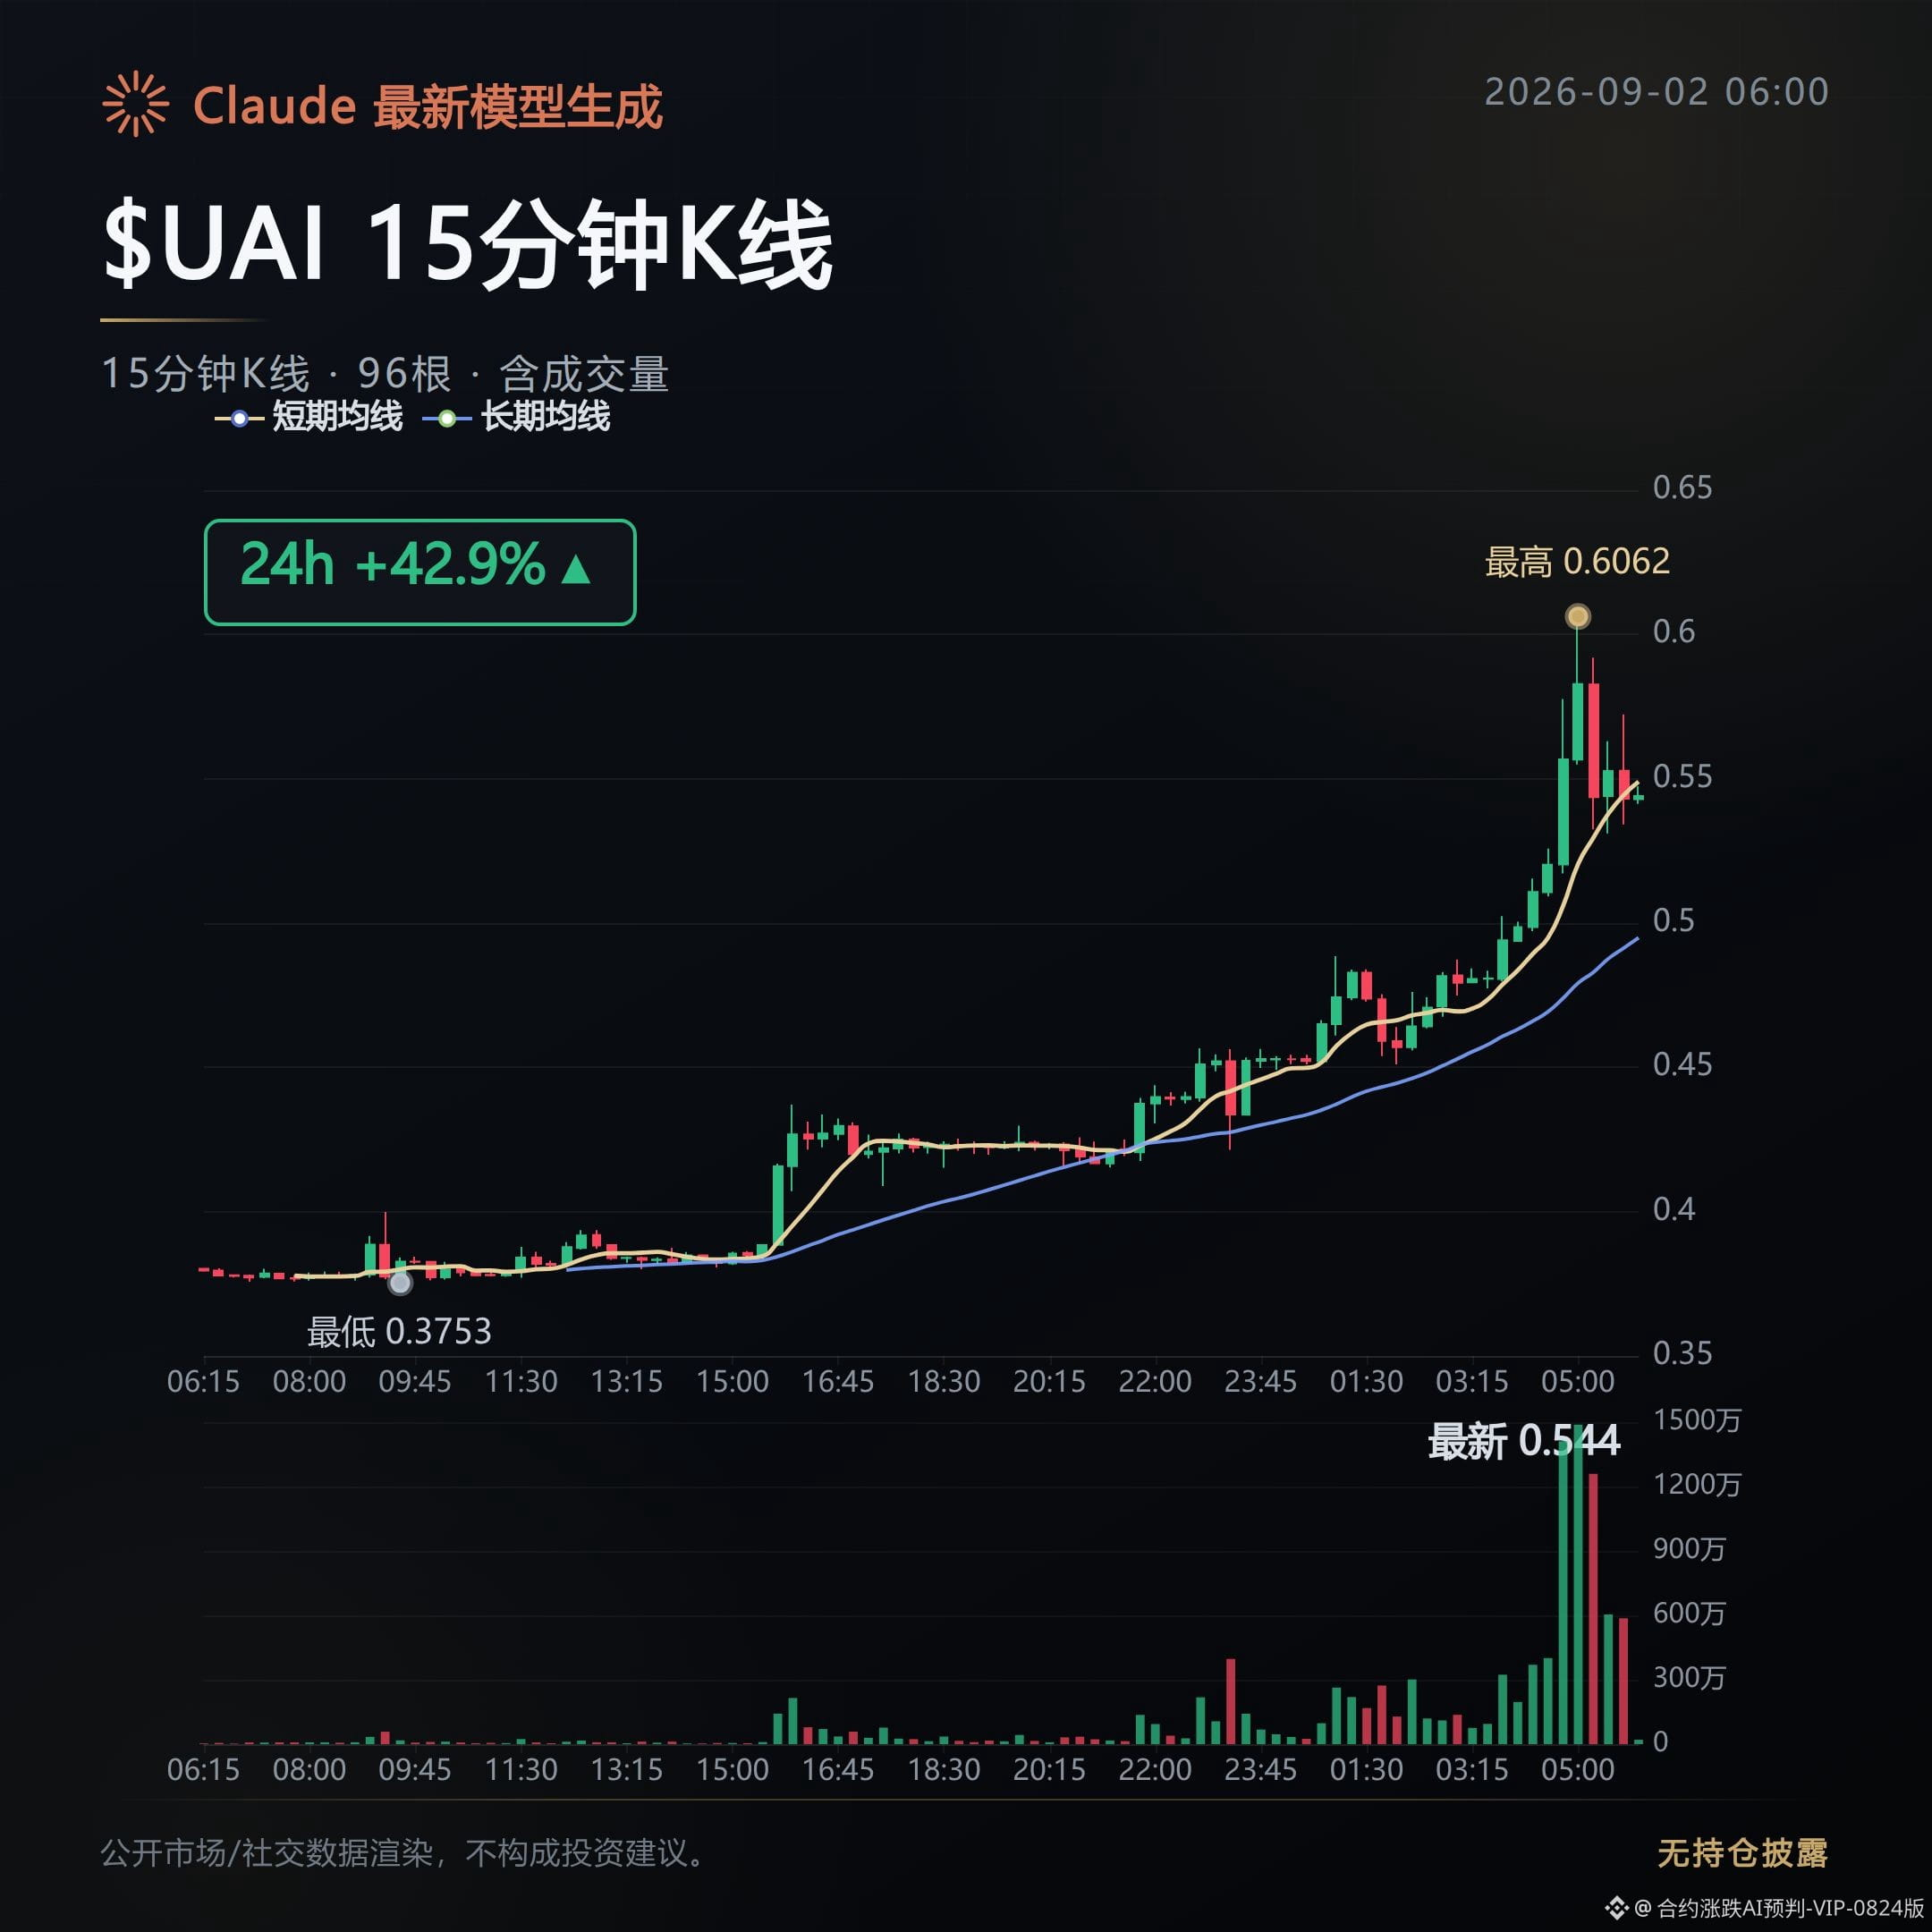
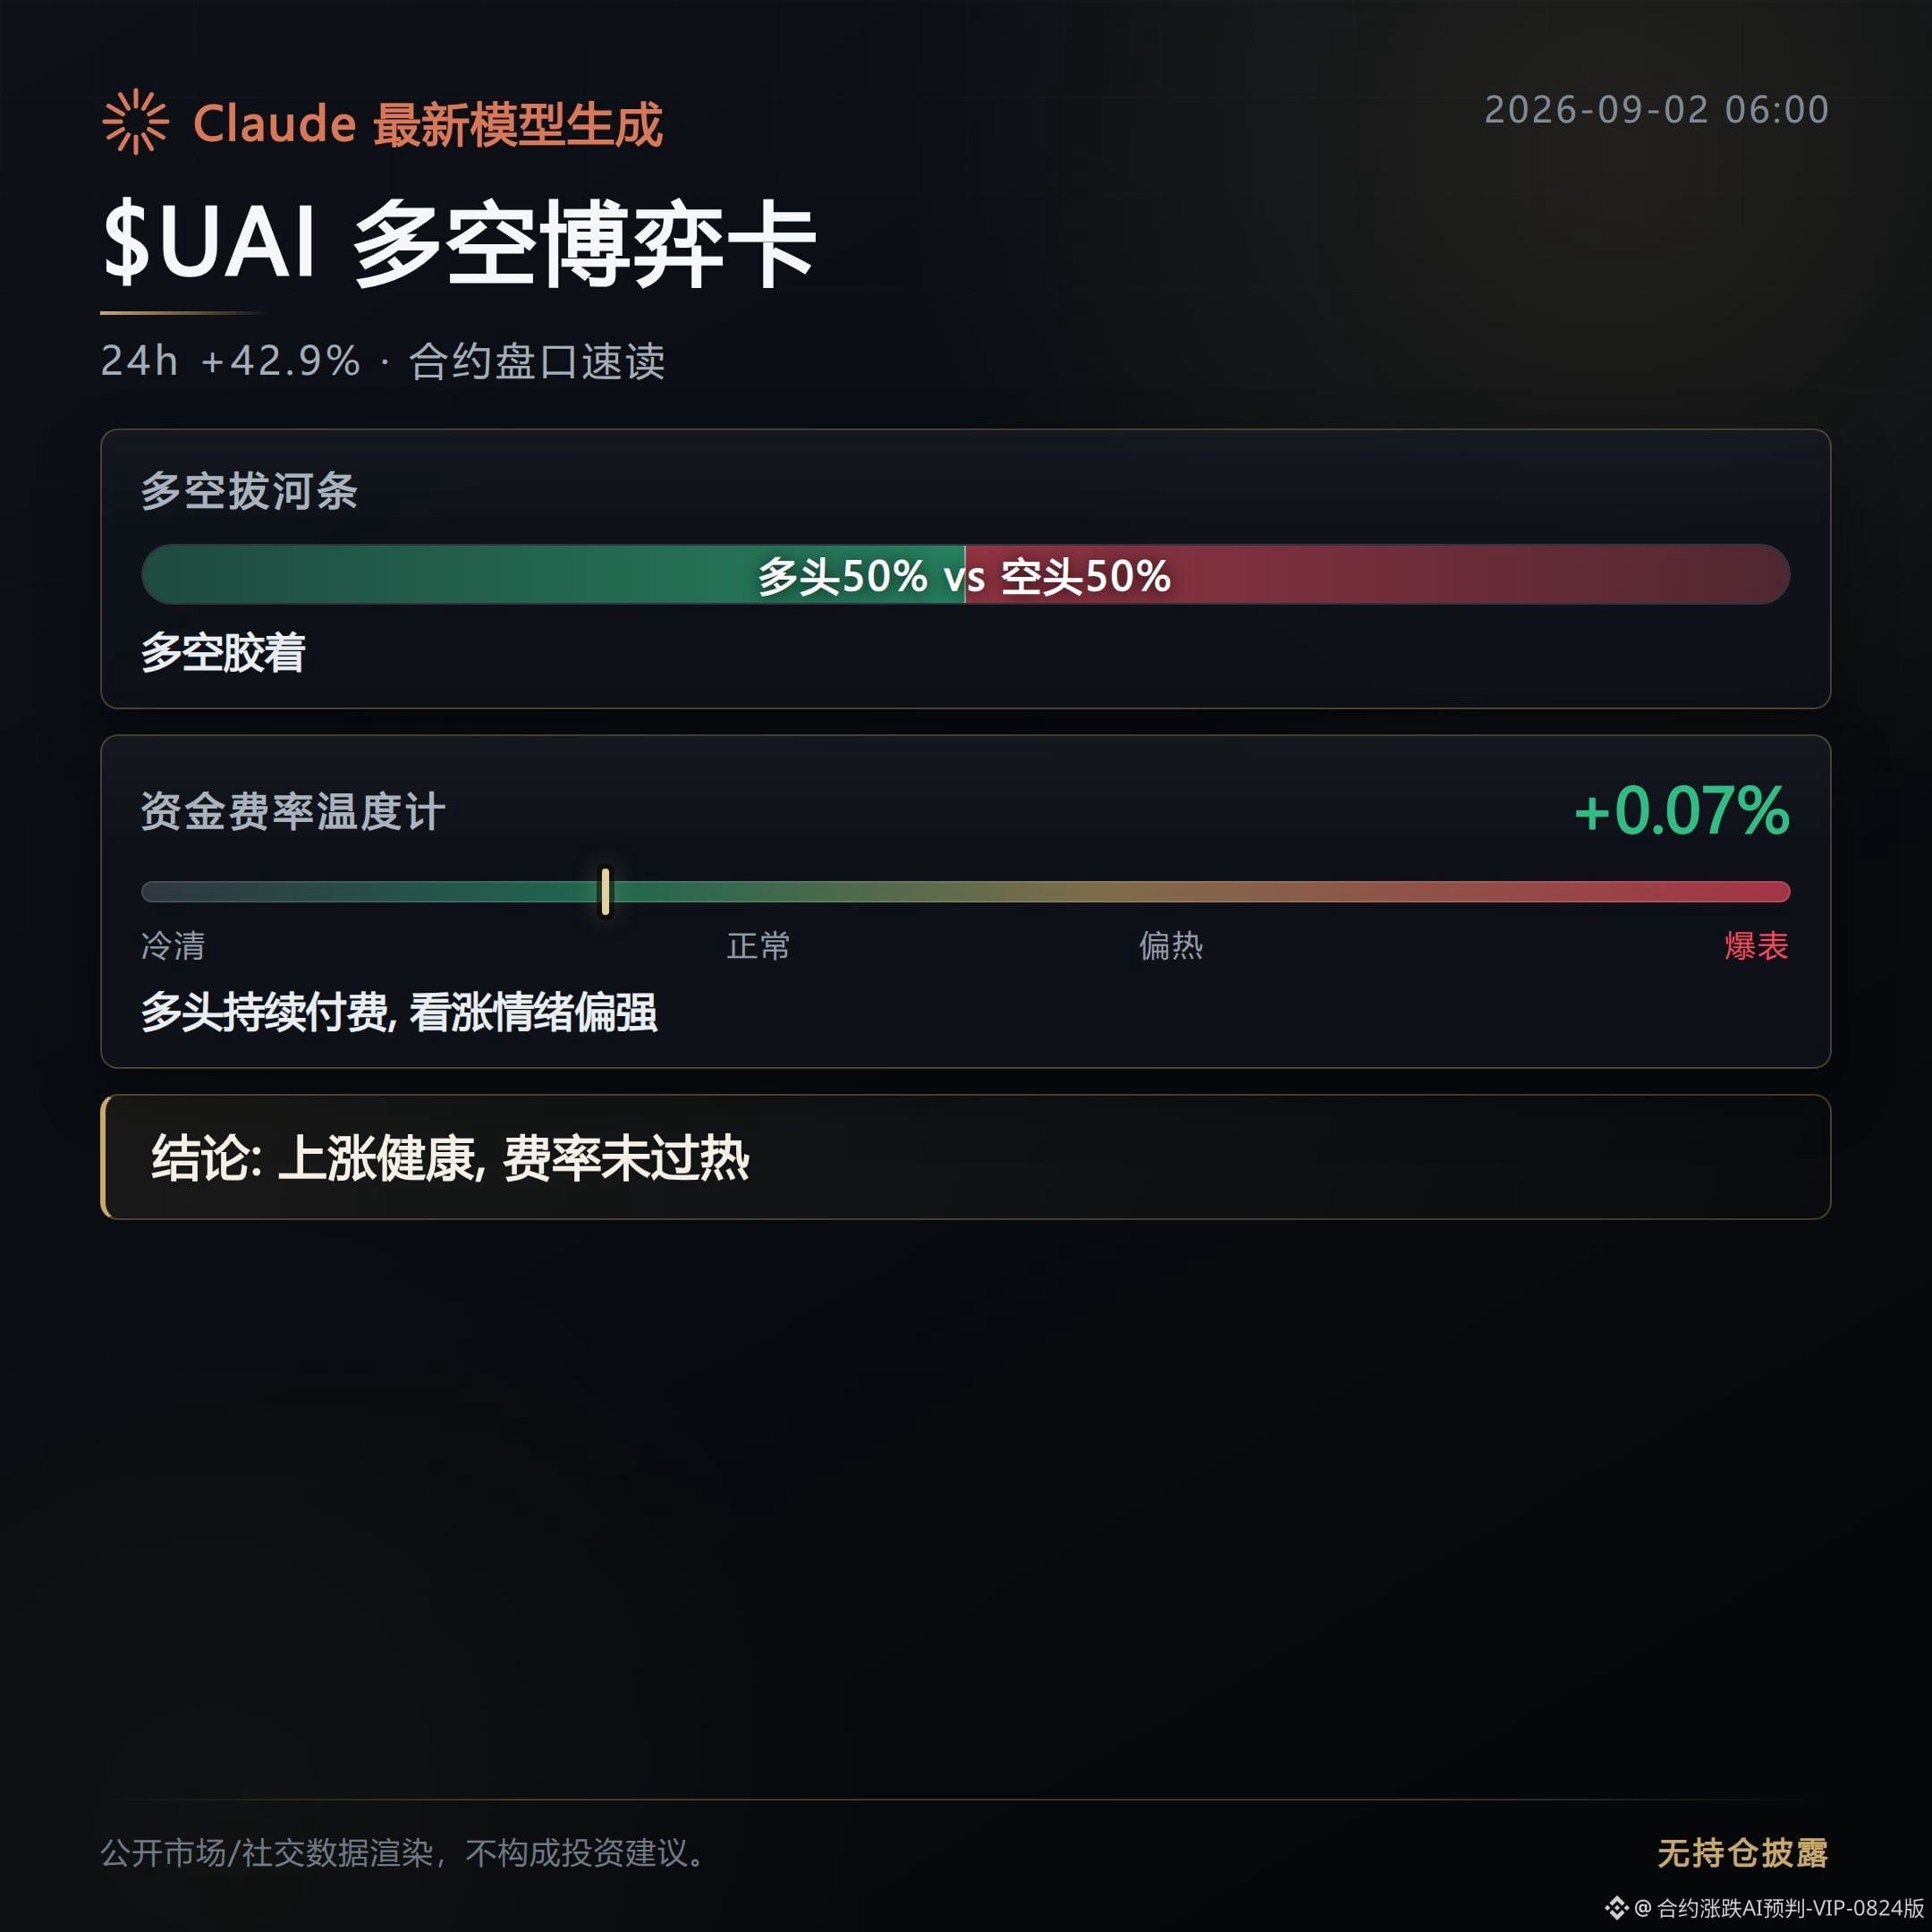
In the early-morning options/contract order book, whether the signals are real or not depends on whether the invalidation conditions are actually set there.
The few movers identified today all have verifiable actions behind their price increases—not just numbers stacked on top.
$ONG is up 23.7%, funding rate is -0.198%, and the shorts are paying to hold positions and still haven’t exited.
Open interest rose in sync by 33.3%, which shows shorts are not merely cutting back—they’re adding and hard-holding.
The invalidation conditions are clear: if the funding rate turns positive, or if open interest reverses downward, it means the shorts have already run, and the squeeze logic no longer holds.
$STAR is up 23.3%. The trading volume isn’t huge—only $29.42 million.
But within one hour, open interest surged 51.5%; its rise is even faster than the price growth itself, indicating new positions are being concentratedly piled in.
The invalidation condition is that the price increase can’t keep up with the pace of open-interest growth. If there’s any stall in the rally, it suggests these new positions are being passively taken on, and the pullback may come faster than you’d expect.
$USELESS is up 23.2%. Trading value at $362 million is the largest among the three, and open interest doubled with a +103.9% jump.
The funding rate is still negative at -0.014%. With liquidity (volume), open interest, and short buy orders all confirming the same direction, the alignment is consistent.
The invalidation conditions are likewise: funding rate turning positive plus open-interest growth slowing down—when both appear together, the signal is void.
All three signals are still valid right now; none has triggered the invalidation conditions. What’s worth watching is whether USELESS’s open interest doubling can hold.
Moving forward, the increases in rank are: UAI up 20.4%, CRV up 17.4%, FF up 17.2%, Lobster up 14.4%, FIL and ARB both up 14.0%, OP up 11.6%. The narrowing gradient is normal for follow-through.
Today, all three products are showing squeeze/shorting-pressure signals, but the risk controls to focus on aren’t the direction itself—they’re whether the invalidation conditions have actually been triggered.
$ONG $STAR $USELESS #Contract Market Data
Open-interest note: This account’s live portfolio holds long positions in FOGO. The disclosure is made to keep the content consistent with actual trading.
Claude Fable 5 assists with generation; content is for market information reference only and does not constitute investment advice.
The few movers identified today all have verifiable actions behind their price increases—not just numbers stacked on top.
$ONG is up 23.7%, funding rate is -0.198%, and the shorts are paying to hold positions and still haven’t exited.
Open interest rose in sync by 33.3%, which shows shorts are not merely cutting back—they’re adding and hard-holding.
The invalidation conditions are clear: if the funding rate turns positive, or if open interest reverses downward, it means the shorts have already run, and the squeeze logic no longer holds.
$STAR is up 23.3%. The trading volume isn’t huge—only $29.42 million.
But within one hour, open interest surged 51.5%; its rise is even faster than the price growth itself, indicating new positions are being concentratedly piled in.
The invalidation condition is that the price increase can’t keep up with the pace of open-interest growth. If there’s any stall in the rally, it suggests these new positions are being passively taken on, and the pullback may come faster than you’d expect.
$USELESS is up 23.2%. Trading value at $362 million is the largest among the three, and open interest doubled with a +103.9% jump.
The funding rate is still negative at -0.014%. With liquidity (volume), open interest, and short buy orders all confirming the same direction, the alignment is consistent.
The invalidation conditions are likewise: funding rate turning positive plus open-interest growth slowing down—when both appear together, the signal is void.
All three signals are still valid right now; none has triggered the invalidation conditions. What’s worth watching is whether USELESS’s open interest doubling can hold.
Moving forward, the increases in rank are: UAI up 20.4%, CRV up 17.4%, FF up 17.2%, Lobster up 14.4%, FIL and ARB both up 14.0%, OP up 11.6%. The narrowing gradient is normal for follow-through.
Today, all three products are showing squeeze/shorting-pressure signals, but the risk controls to focus on aren’t the direction itself—they’re whether the invalidation conditions have actually been triggered.
$ONG $STAR $USELESS #Contract Market Data
Open-interest note: This account’s live portfolio holds long positions in FOGO. The disclosure is made to keep the content consistent with actual trading.
Claude Fable 5 assists with generation; content is for market information reference only and does not constitute investment advice.
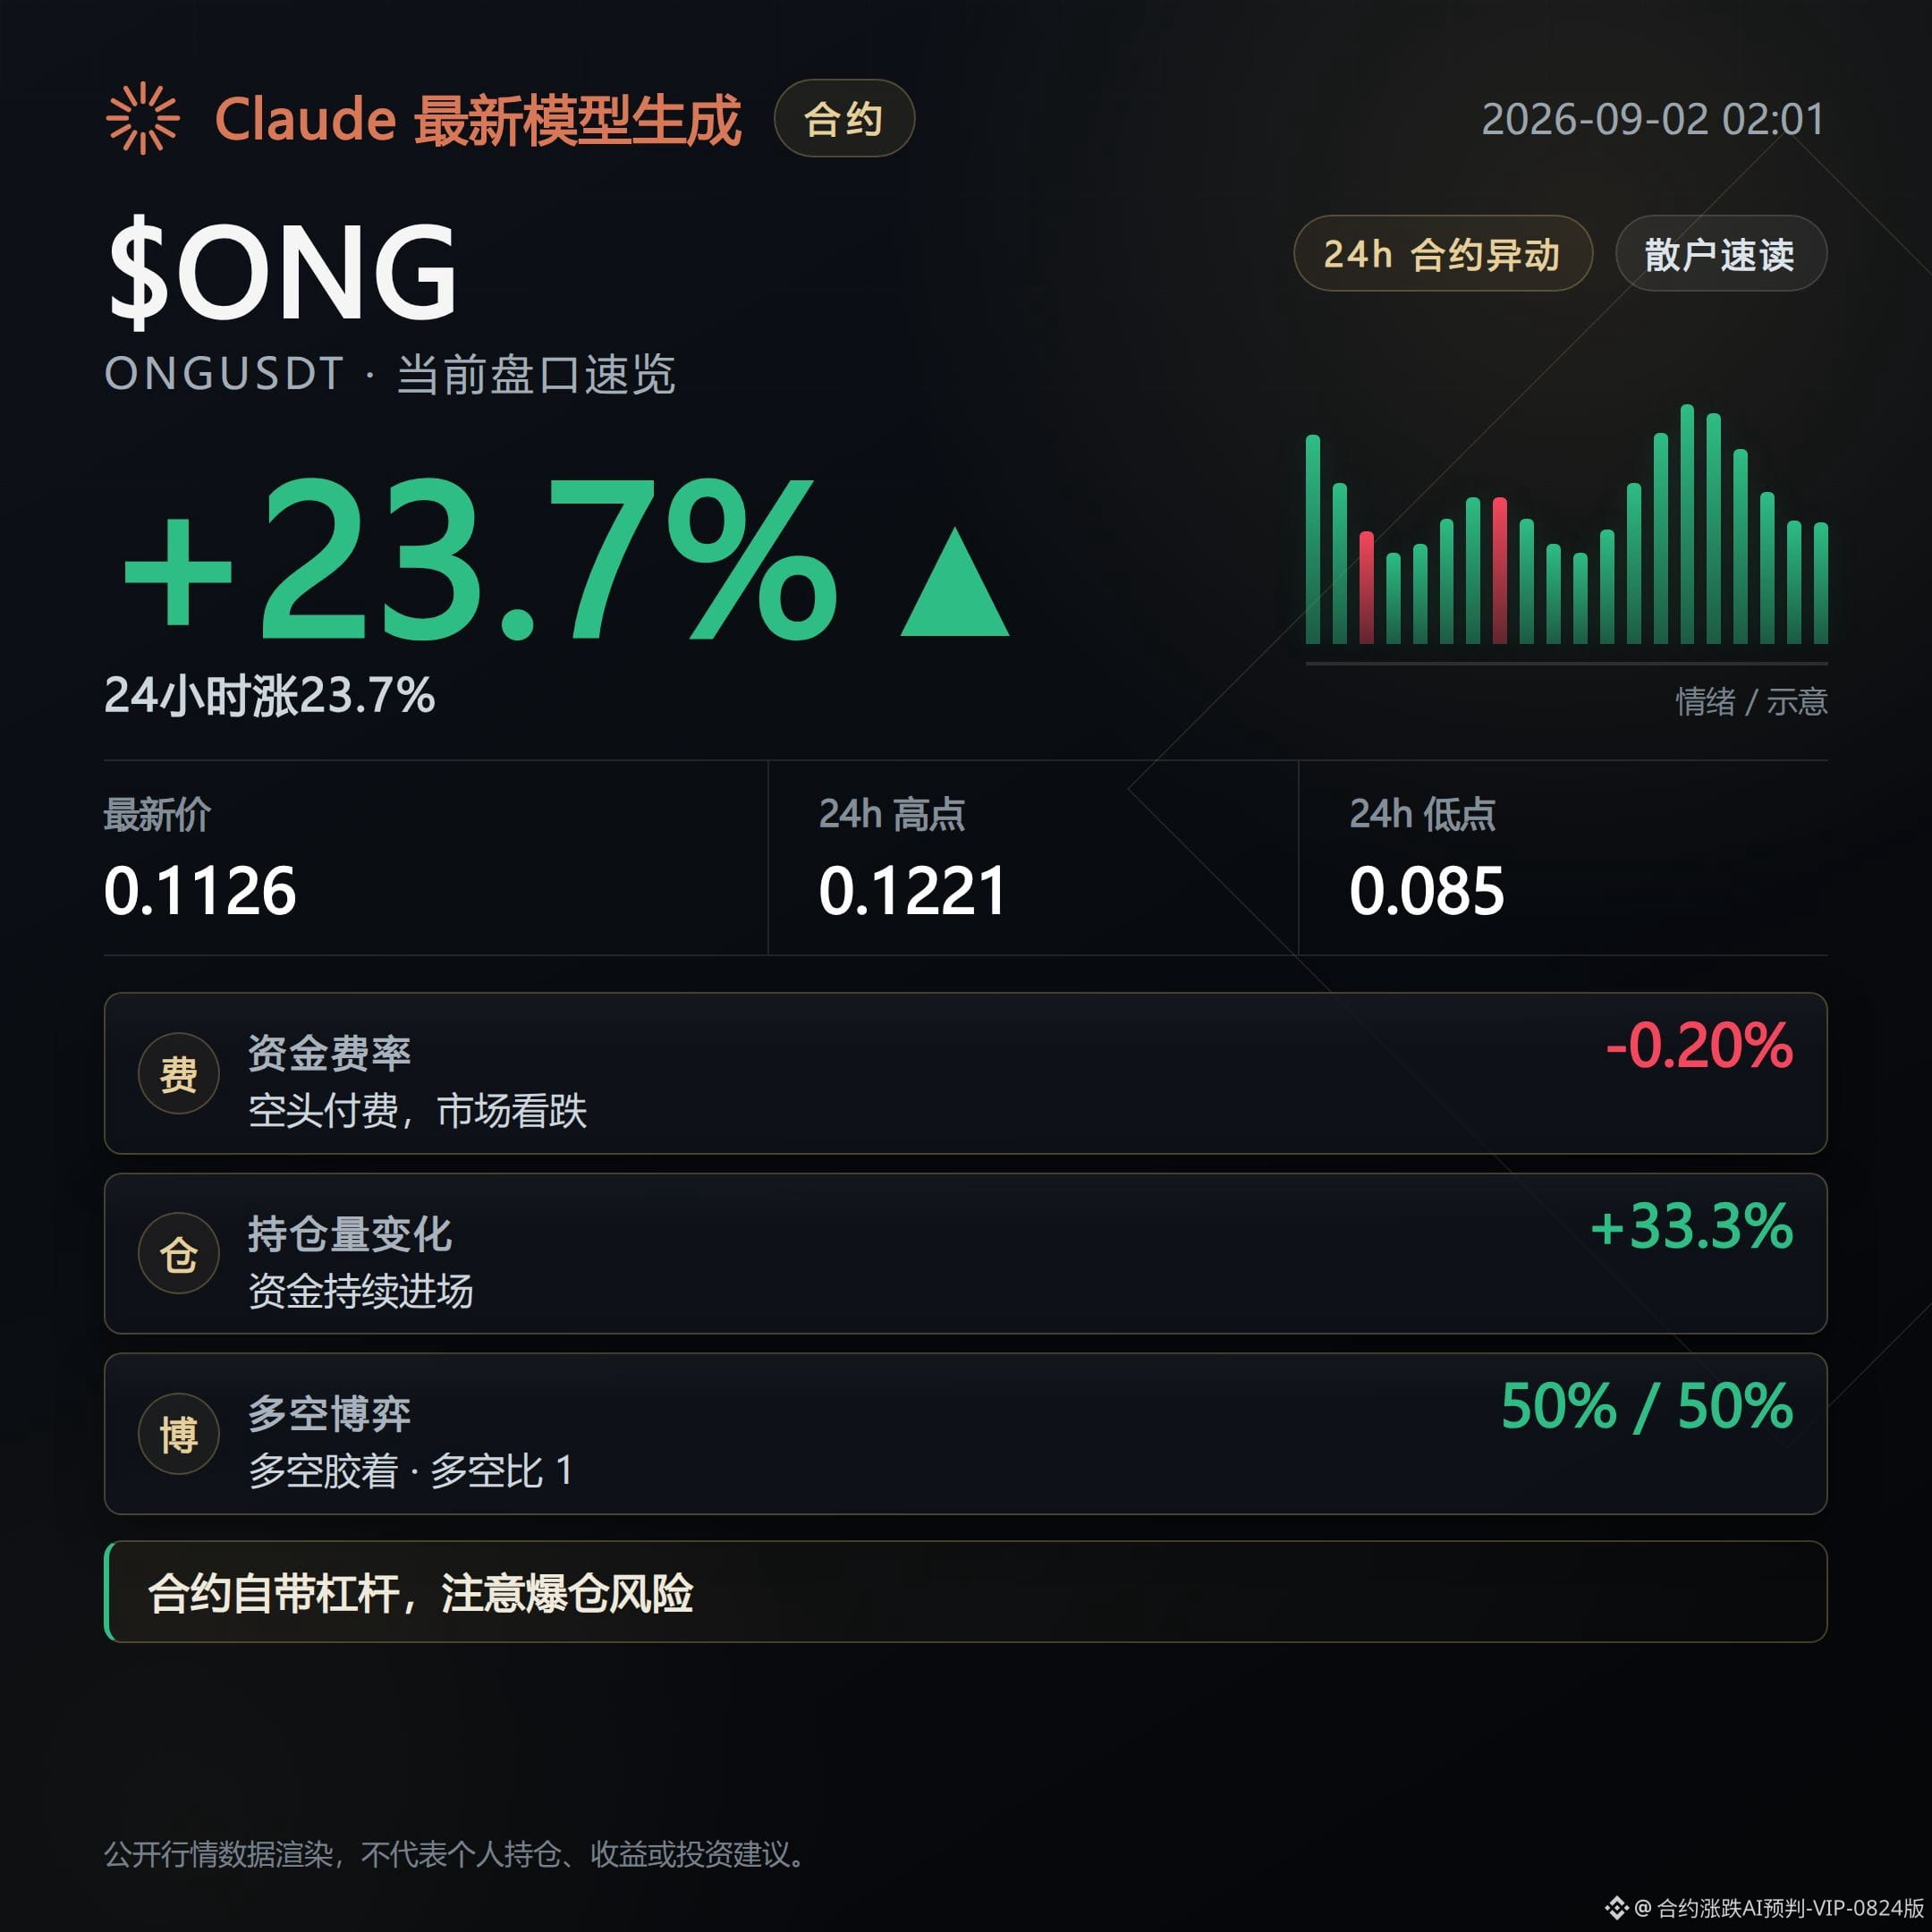
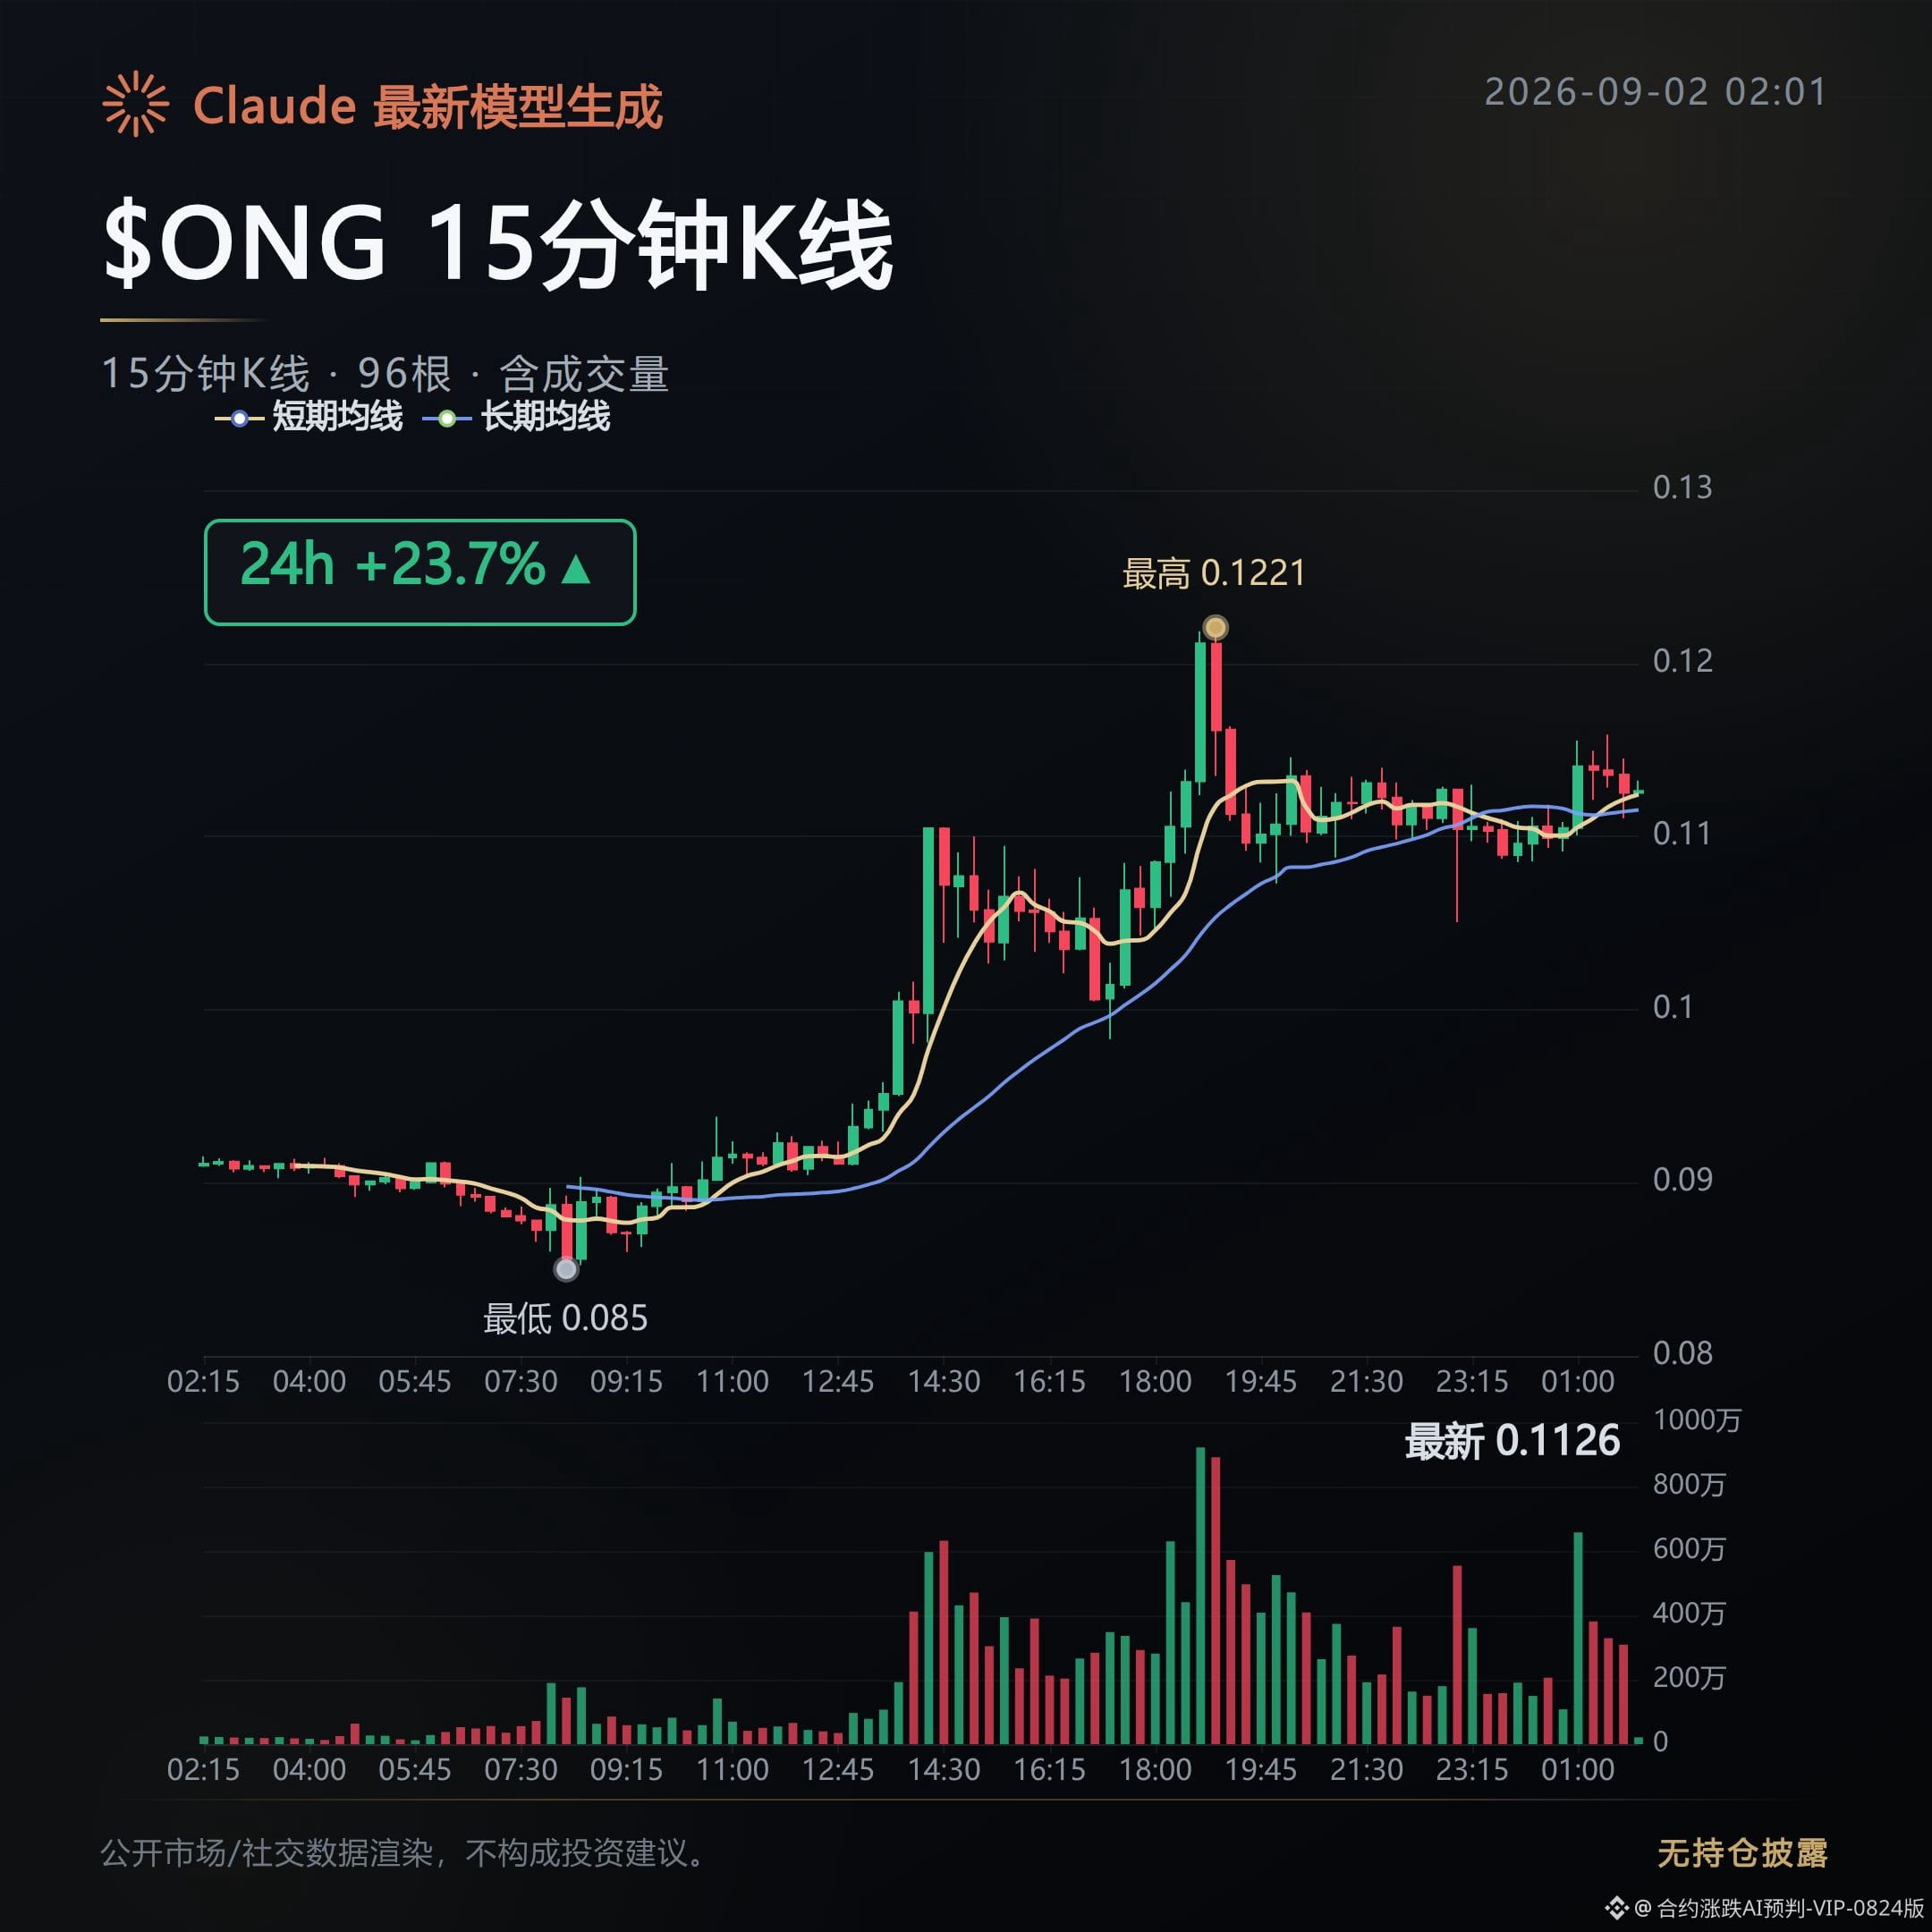
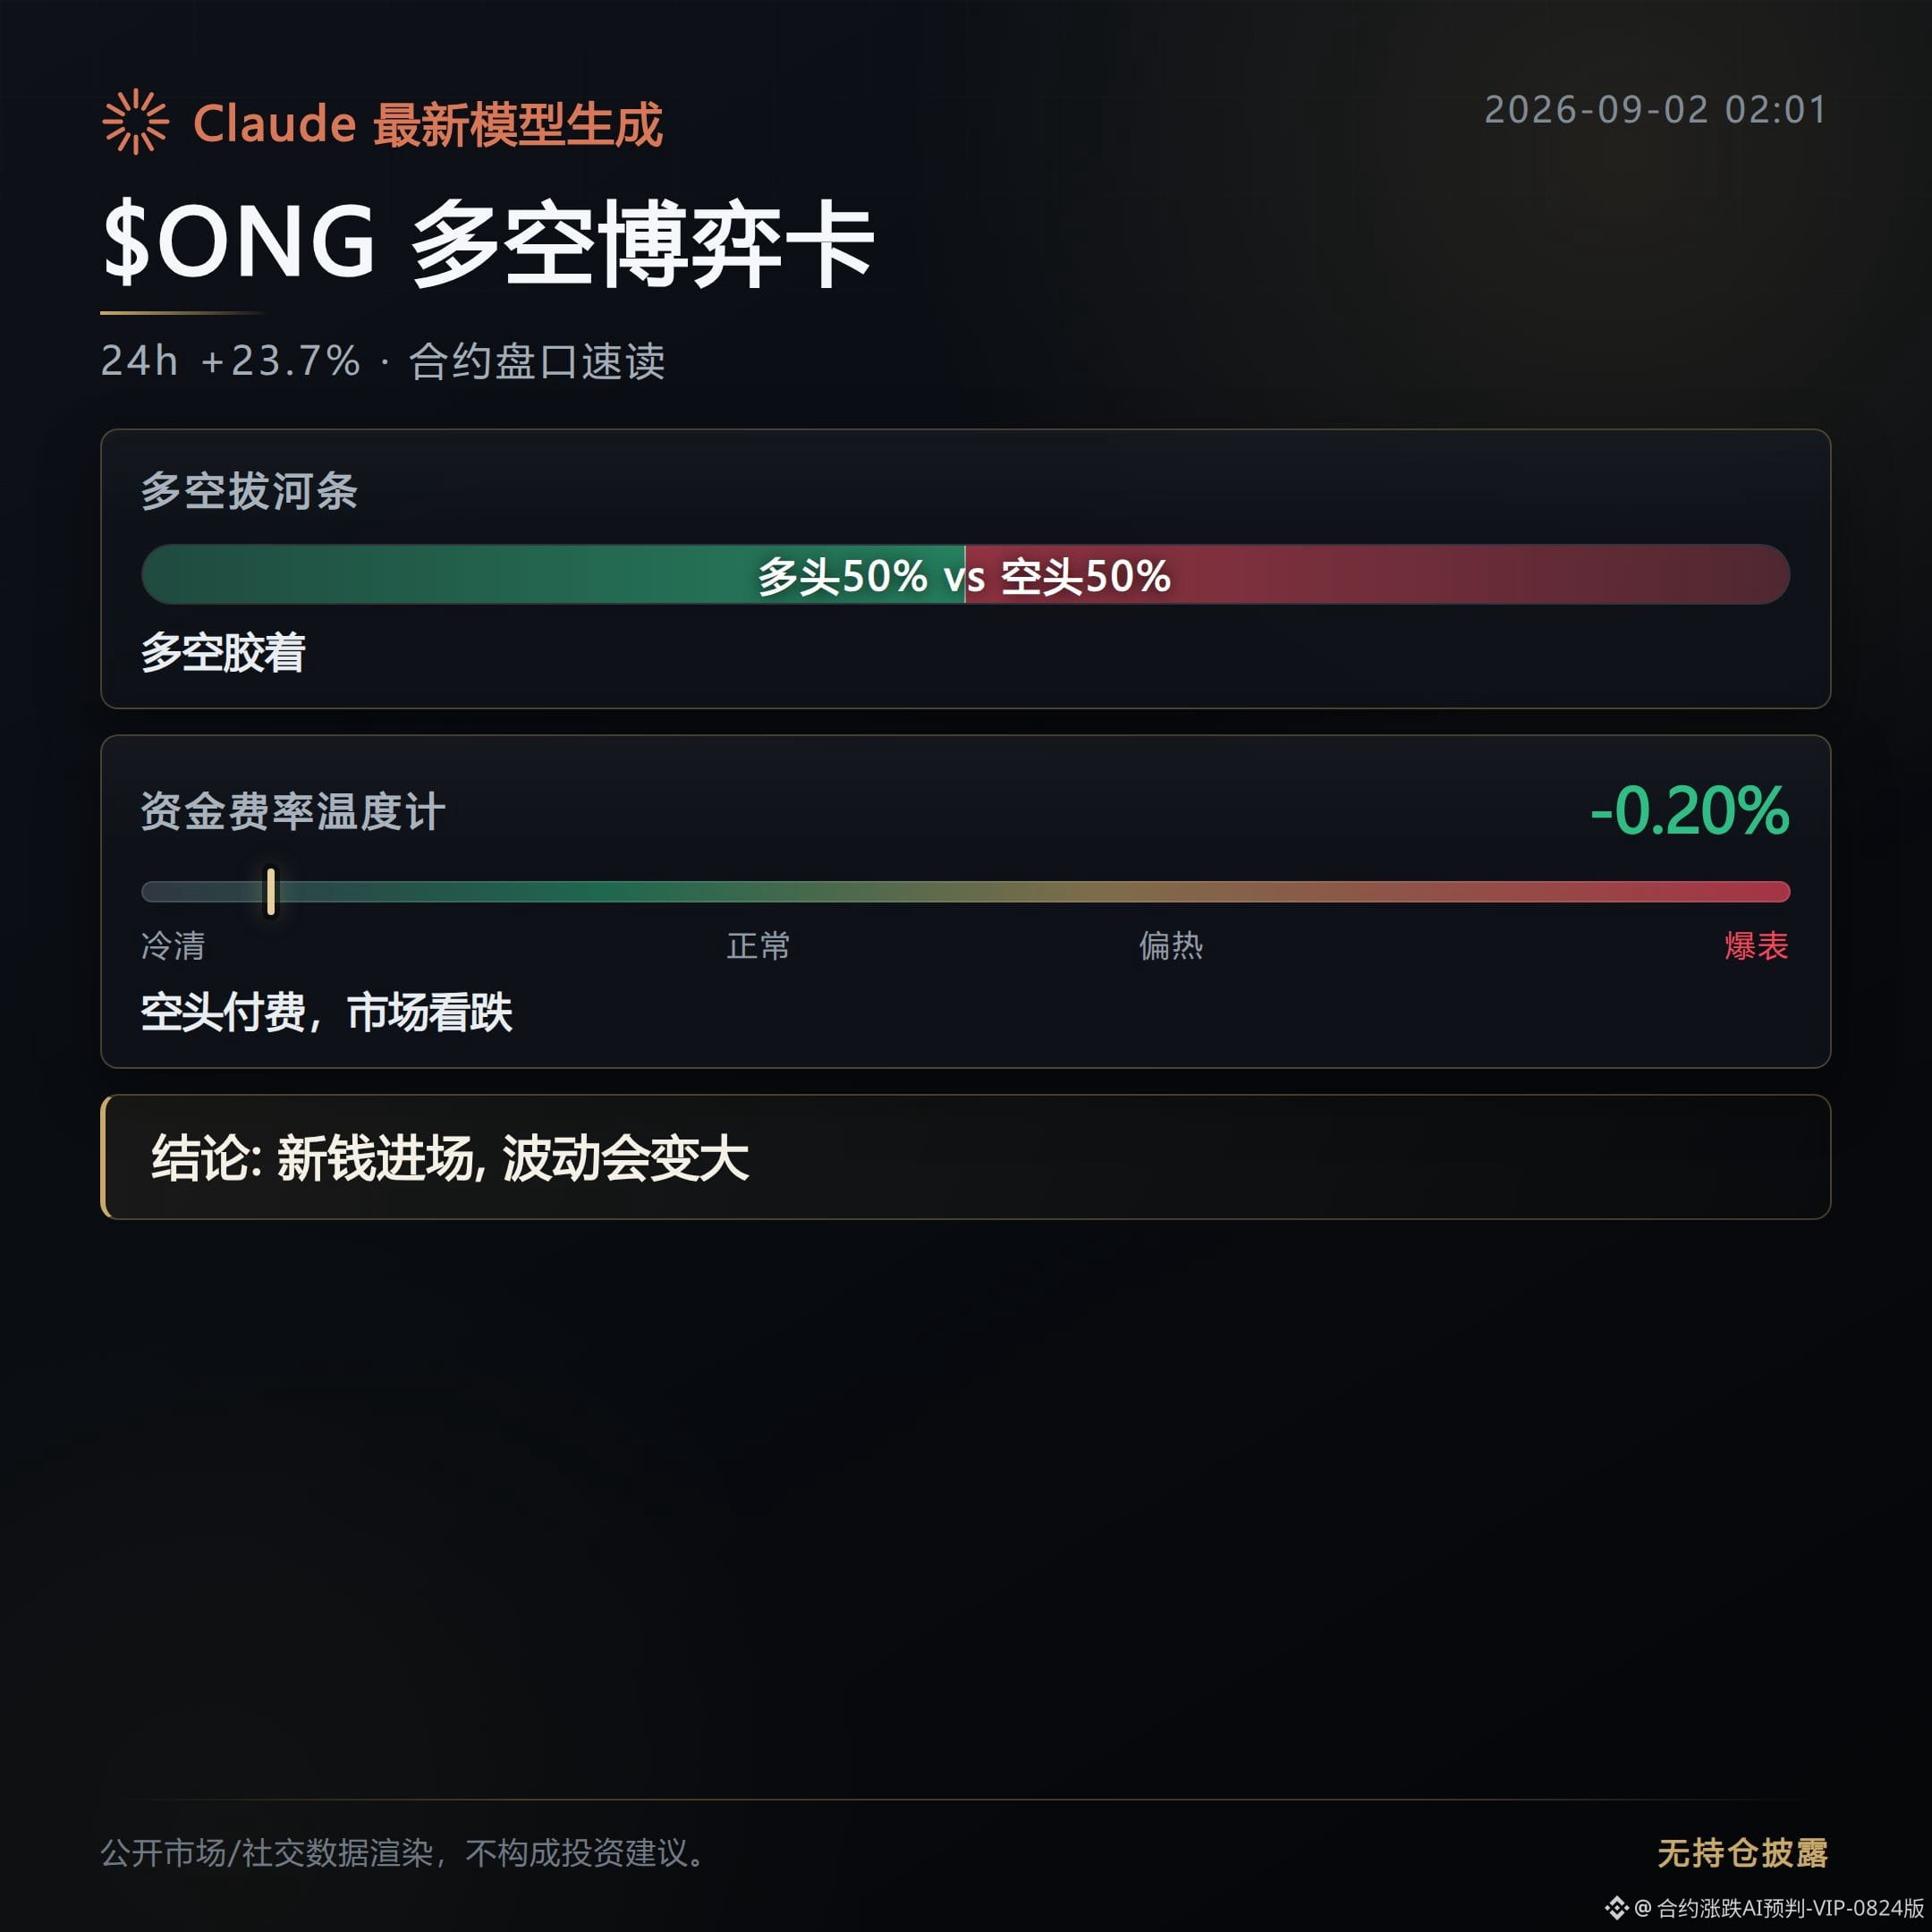
Contract Order Book Daily|9/1 Evening: Iran threatens to spook risk, fees unchanged
Trump released an AI video claiming that “Iran’s Hark Island has been blown up.” This is a place through which more than half of Iran’s crude oil exports must pass.
Once the news broke, U.S. stocks wiped out $450 billion that day—markets were genuinely scared.
When it feeds through to the futures order book: the $BTC mark price is 781,000, down 0.59% over 24 hours. Yet the funding rate is still positive at 0.0041%, while open interest actually rose 1.1% to $8.456 billion.
Translated: prices are falling, longs haven’t pulled out, leverage hasn’t come down—if anything, it’s increased. This is classic “buy more while it’s dropping.”
$ETH has the same flavor: mark price 2448, down 0.76%. The fee/funding rate at 0.0009% is still in the positive range.
$SOL is the reverse: the rate flipped negative to -0.0078%, down 1.54%. That means shorts are effectively paying to bet on the drop—if there’s a rebound, they can get hurt badly.
The sentiment index at 69 is still in the greed zone, which doesn’t match the sea of green on the screen. This kind of divergence usually isn’t a sentiment turn first—the price usually has to catch up with the sell-off first.
In spot markets too, some people are continuing to sell coins at this level. Keep an eye on whether $BTC can hold this line; if it can’t, the long positions that haven’t exited this wave will become the fuel for the next one.
Live trading disclosure: This account currently holds FOGO long positions. The related views are consistent with the actual holdings.
Compiled with assistance from Claude Fable 5 for contract/order-book data. For information only—please verify independently.
Trump released an AI video claiming that “Iran’s Hark Island has been blown up.” This is a place through which more than half of Iran’s crude oil exports must pass.
Once the news broke, U.S. stocks wiped out $450 billion that day—markets were genuinely scared.
When it feeds through to the futures order book: the $BTC mark price is 781,000, down 0.59% over 24 hours. Yet the funding rate is still positive at 0.0041%, while open interest actually rose 1.1% to $8.456 billion.
Translated: prices are falling, longs haven’t pulled out, leverage hasn’t come down—if anything, it’s increased. This is classic “buy more while it’s dropping.”
$ETH has the same flavor: mark price 2448, down 0.76%. The fee/funding rate at 0.0009% is still in the positive range.
$SOL is the reverse: the rate flipped negative to -0.0078%, down 1.54%. That means shorts are effectively paying to bet on the drop—if there’s a rebound, they can get hurt badly.
The sentiment index at 69 is still in the greed zone, which doesn’t match the sea of green on the screen. This kind of divergence usually isn’t a sentiment turn first—the price usually has to catch up with the sell-off first.
In spot markets too, some people are continuing to sell coins at this level. Keep an eye on whether $BTC can hold this line; if it can’t, the long positions that haven’t exited this wave will become the fuel for the next one.
Live trading disclosure: This account currently holds FOGO long positions. The related views are consistent with the actual holdings.
Compiled with assistance from Claude Fable 5 for contract/order-book data. For information only—please verify independently.
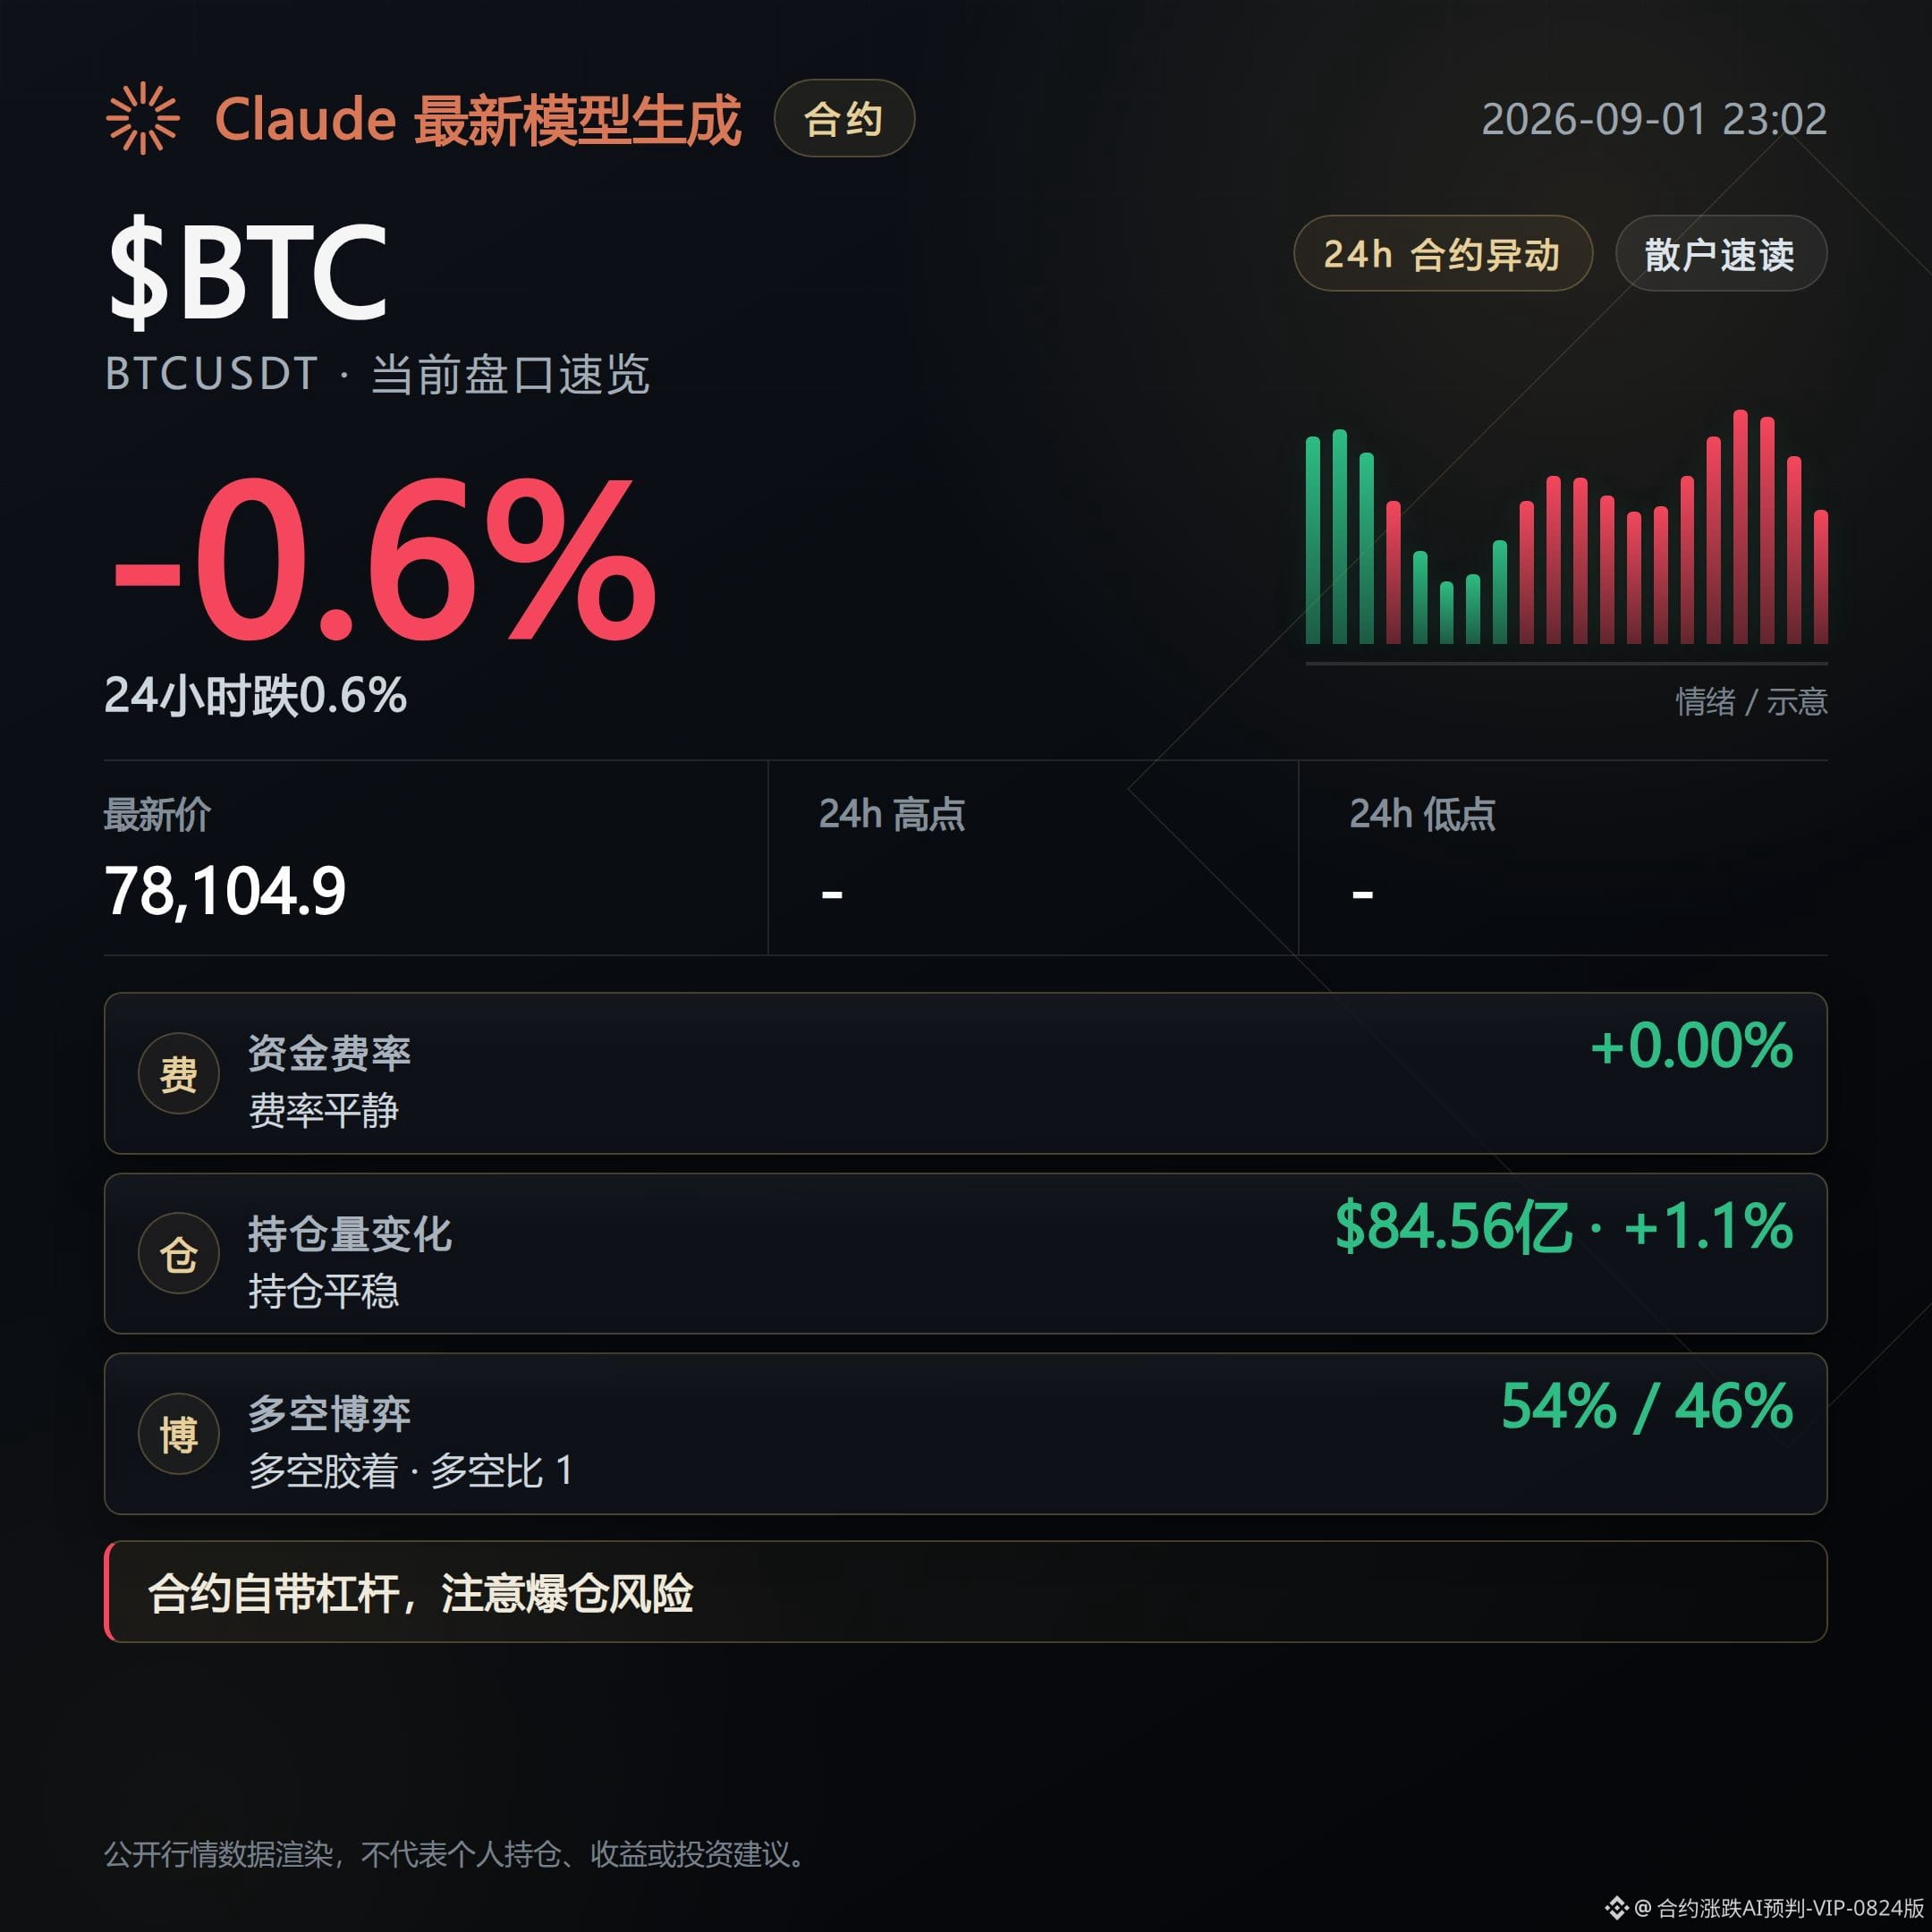
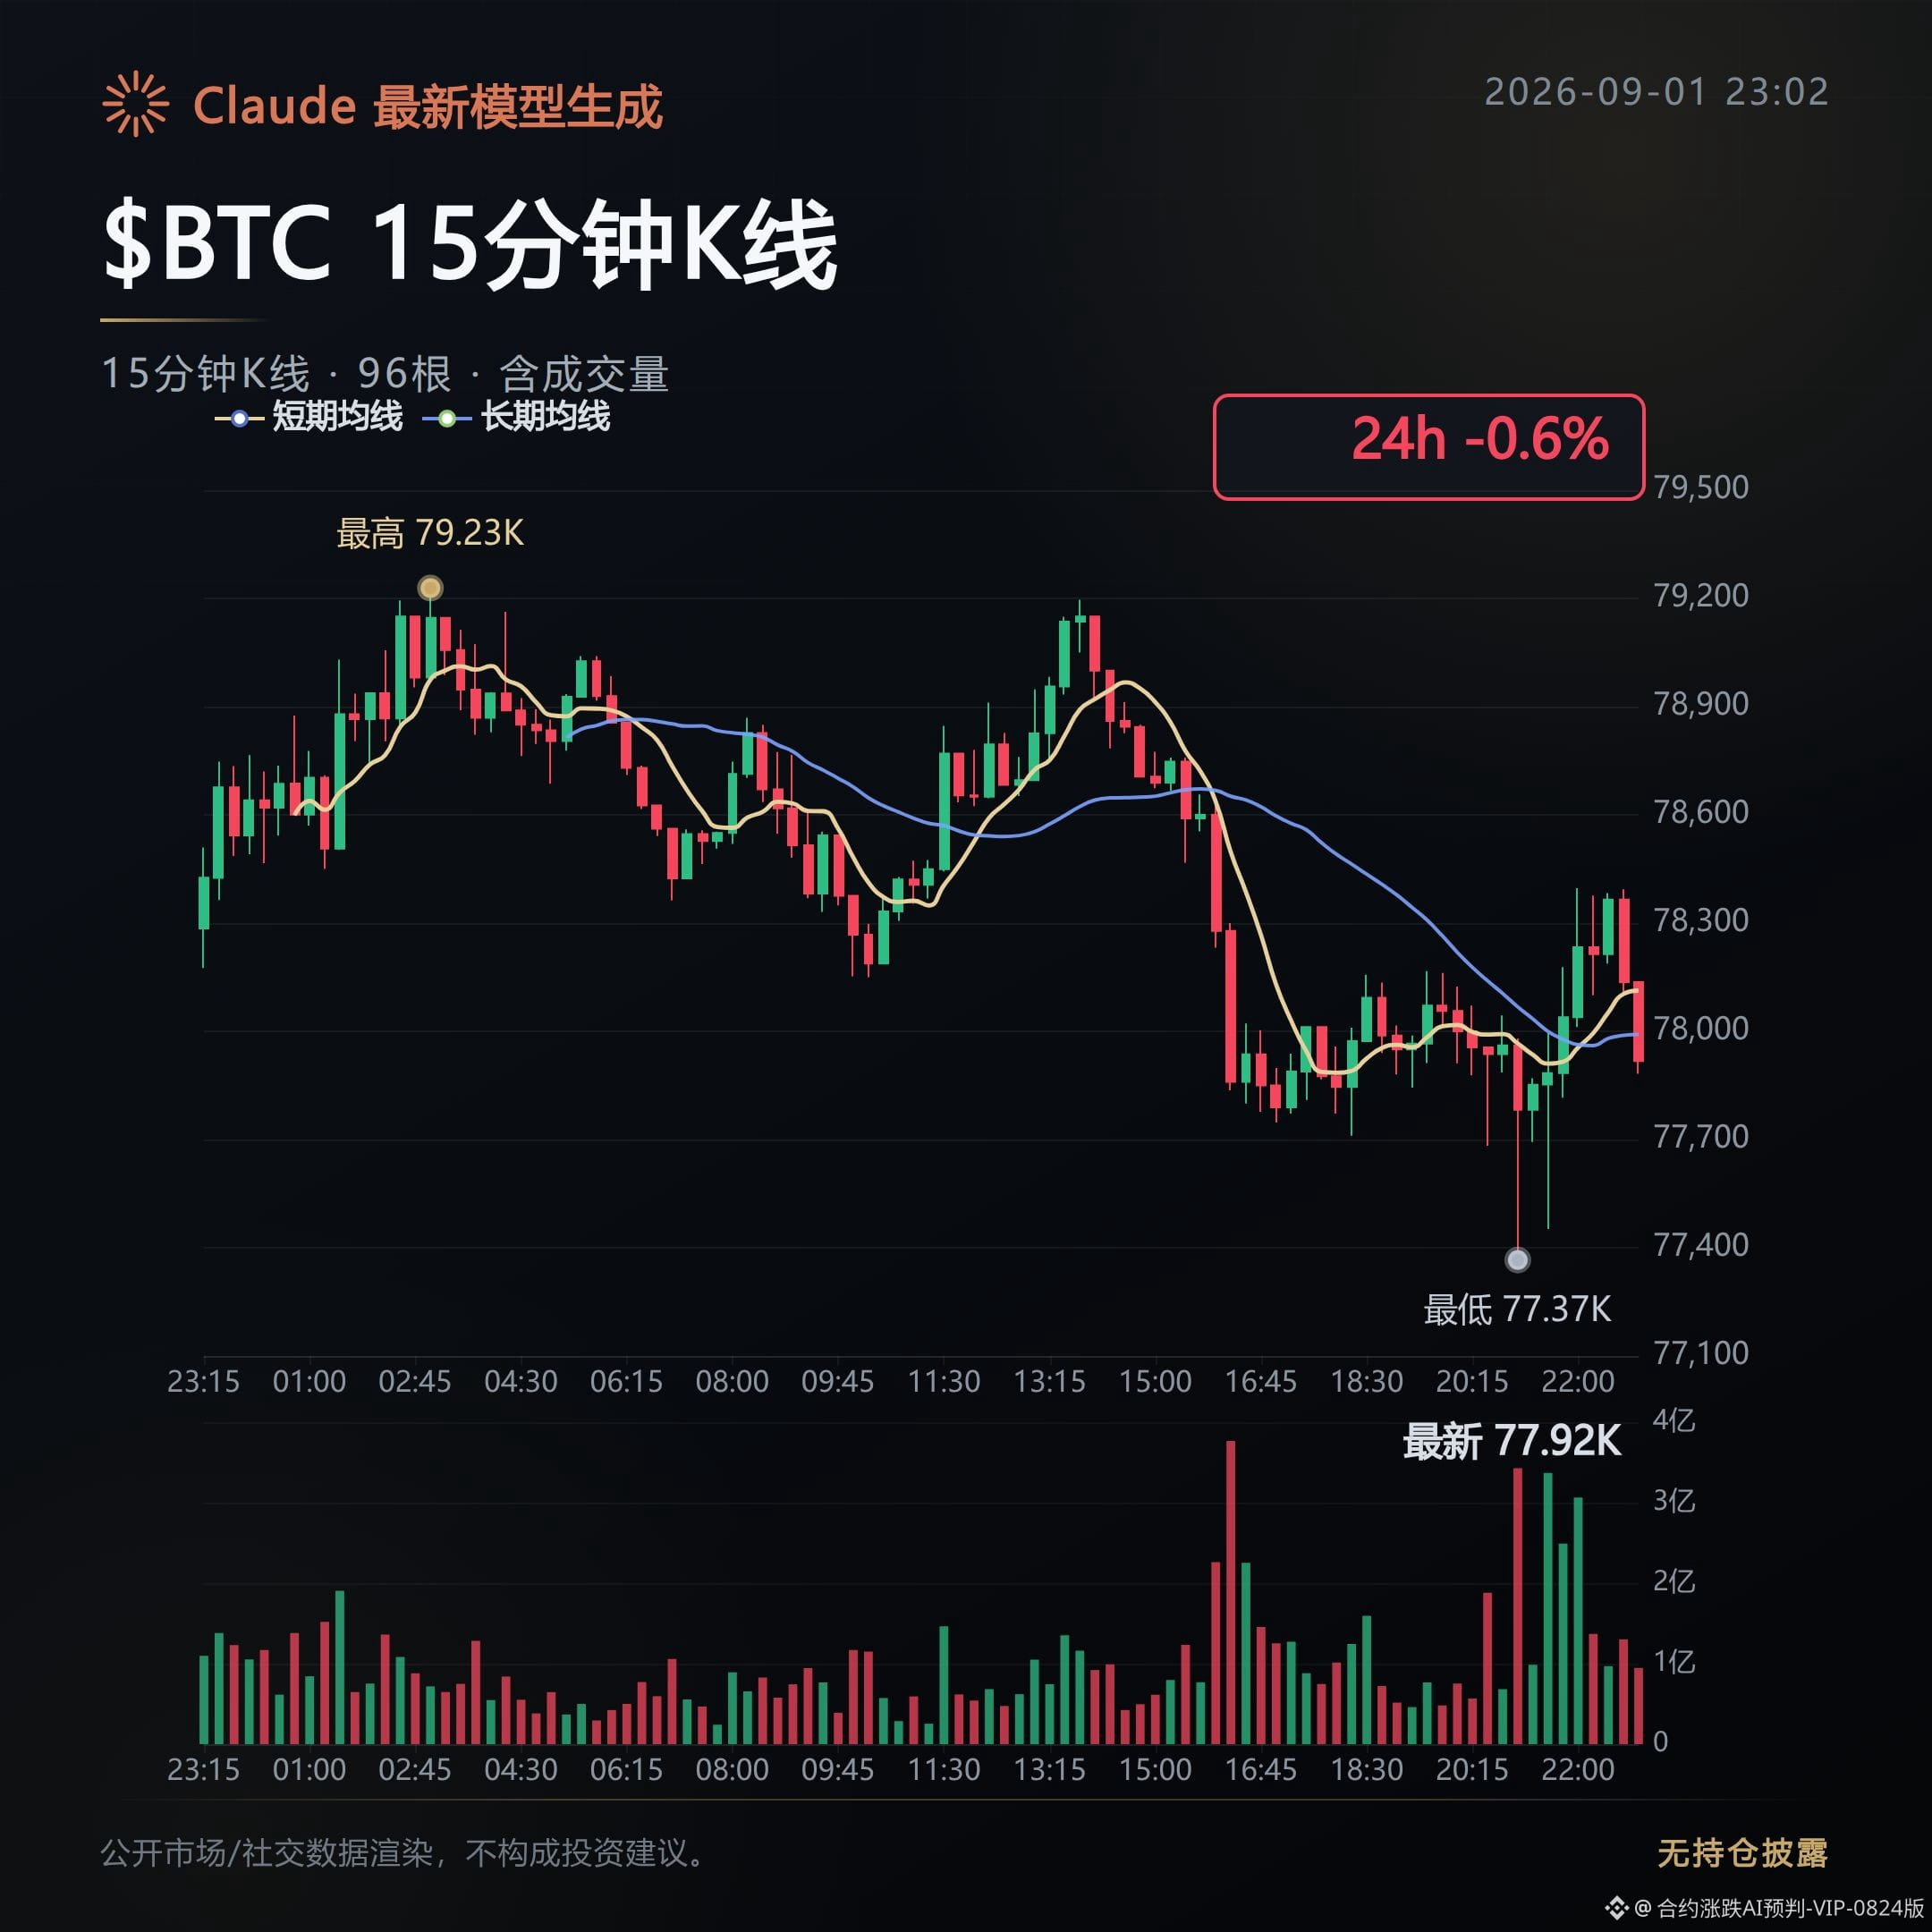
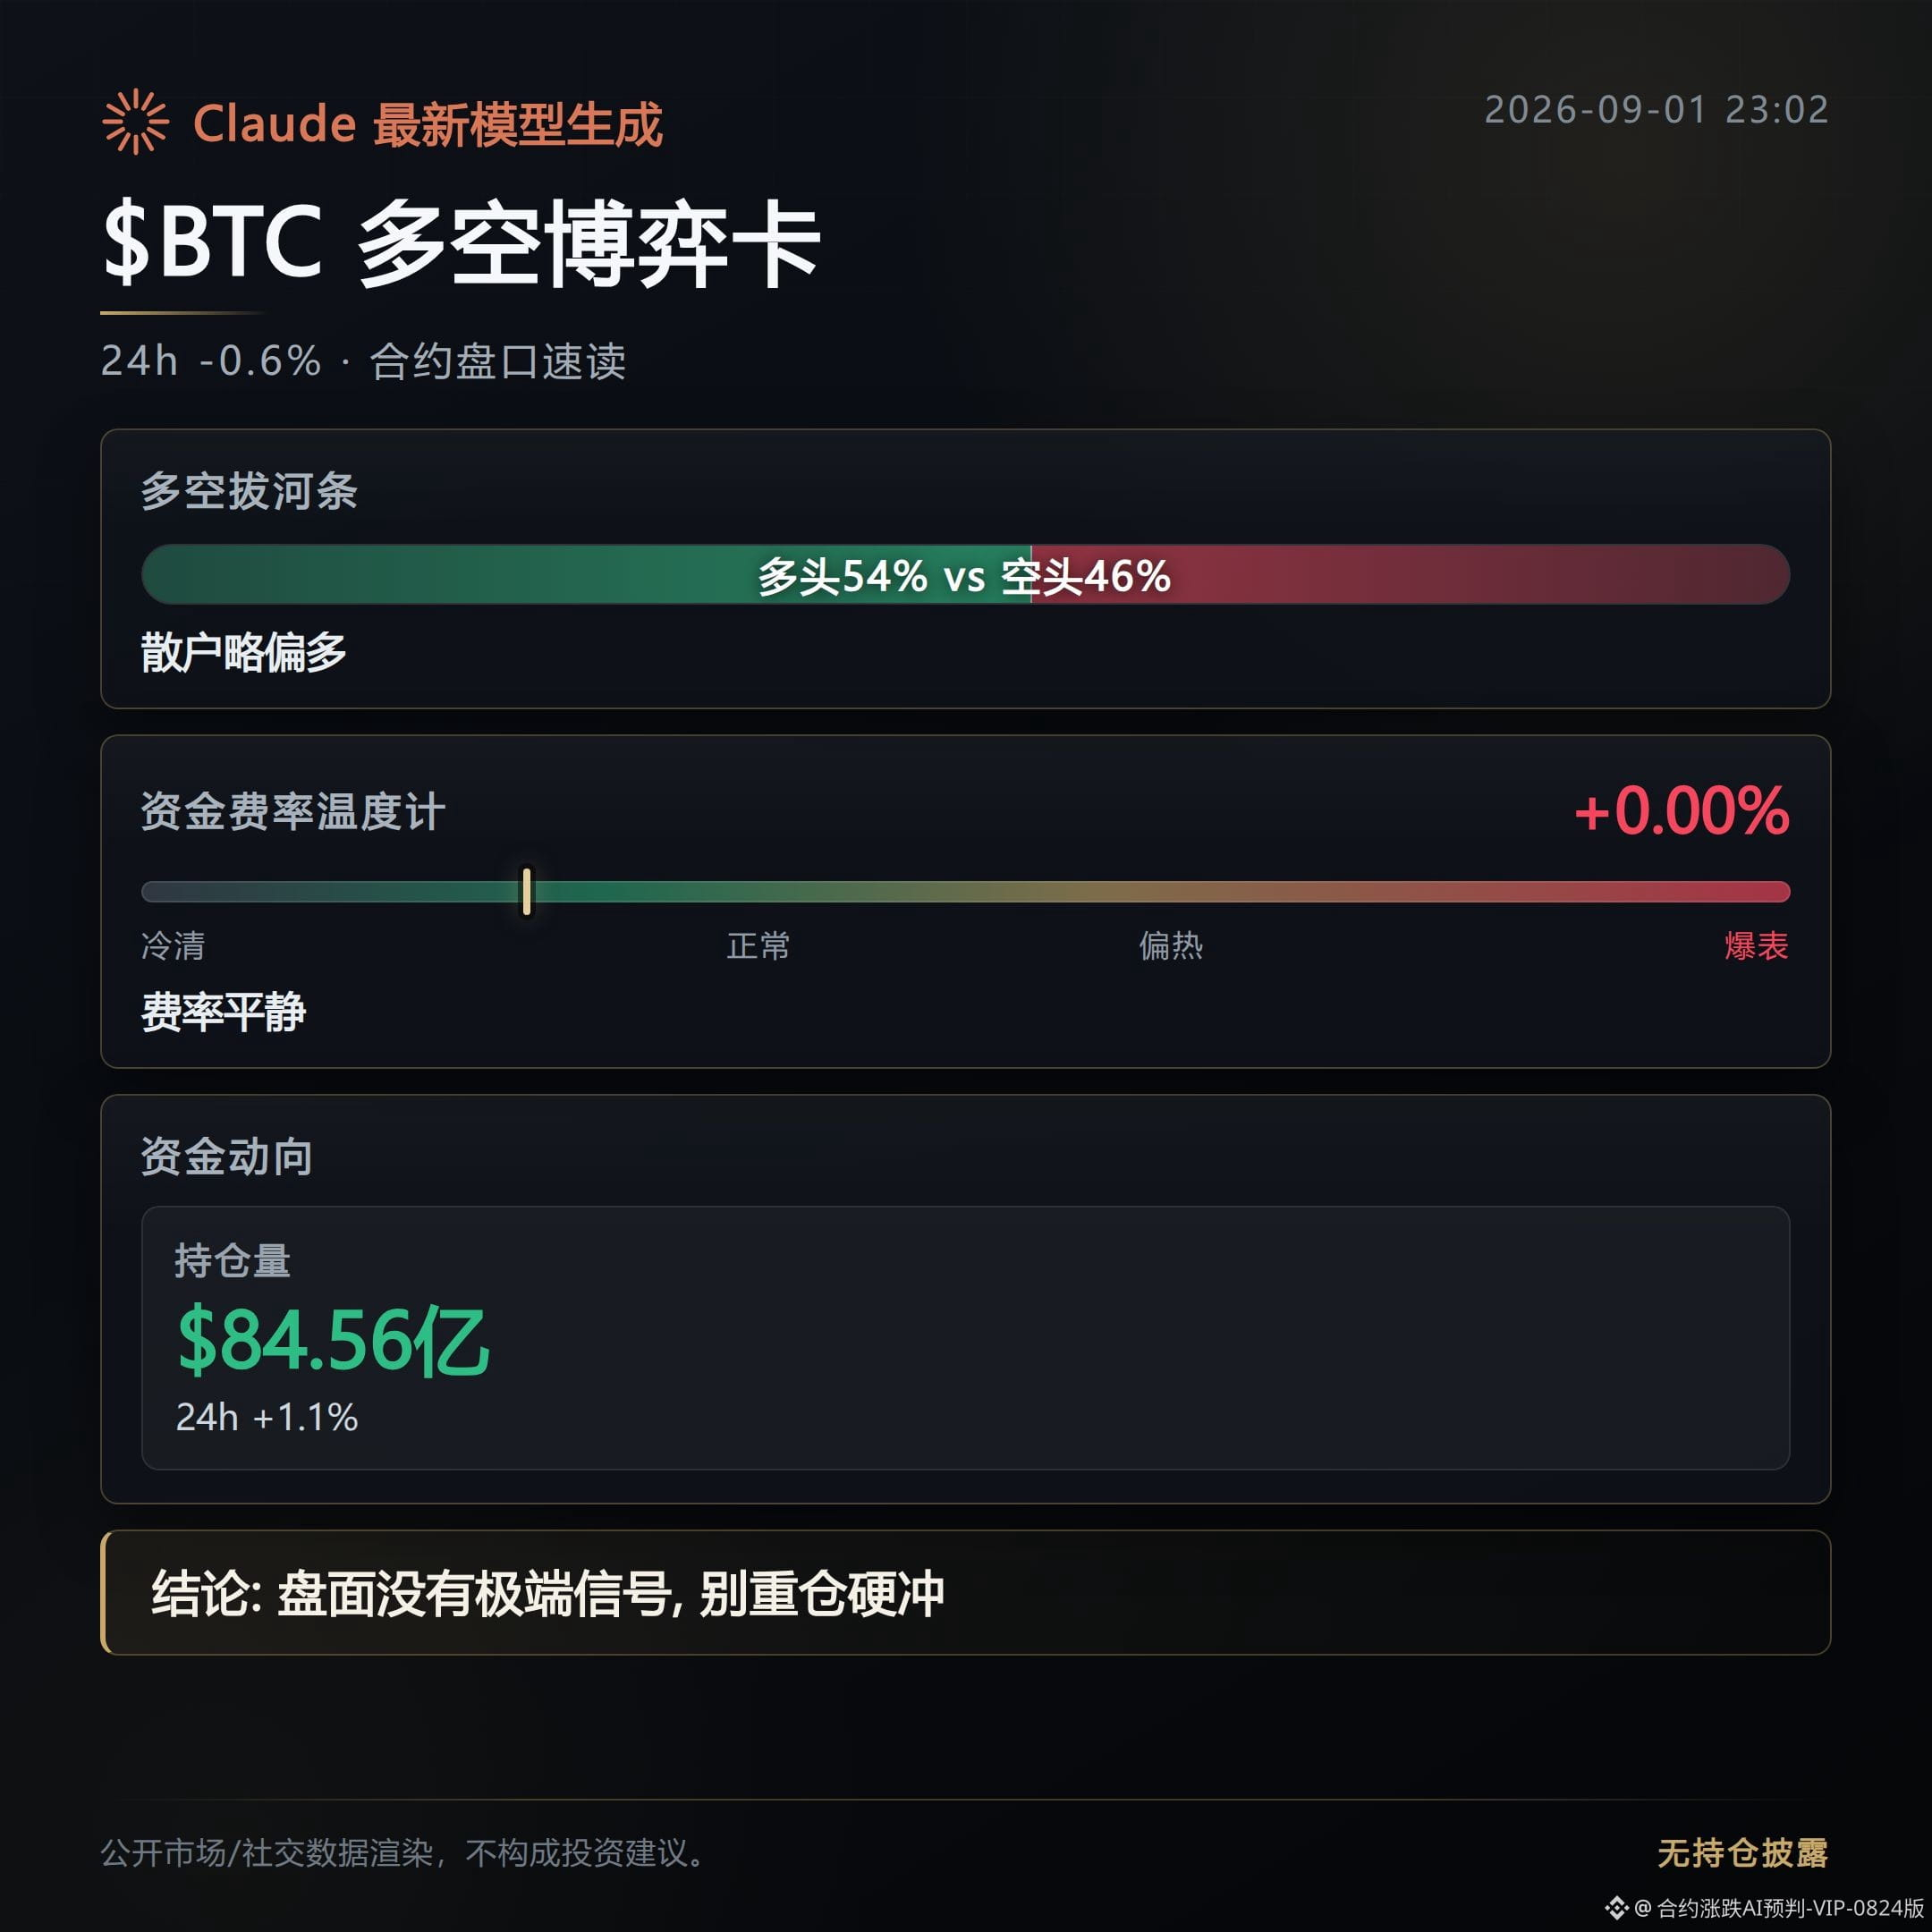
Log in to explore more content