
Table of contents
Introduction
What are support and resistance levels?
How Traders Use Support and Resistance Levels
psychological support and resistance
Trend Line Support and Resistance
Moving average support and resistance
Fibonacci support and resistance
What is convergence in technical analysis?
Summarize
Introduction
The concepts of support and resistance are some of the most fundamental topics related to technical analysis of financial markets. They are basically suitable for any financial market, whether it is stocks, forex, gold or cryptocurrencies.
These concepts are easy to understand, but difficult to master. Reading support and resistance can be completely subjective, they play different roles in changing market conditions, and you need to understand the different types of support and resistance. But most importantly, you need to learn a lot of diagrams. This guide will help you get started.
What are support and resistance levels?
At their most basic level, support and resistance are very simple concepts. When price is at a level that it cannot break, that level is a barrier of sorts. Support is when price reaches the "floor," while resistance is when price reaches the "ceiling." Basically, you can think of support zones as demand zones and resistance zones as supply zones.
While support and resistance are traditionally represented as lines, reality is often less precise. Remember: markets are not driven by physical laws that prevent the market from breaking through a certain level. Because of this, it is more appropriate to think of support and resistance as areas. You can think of these areas as ranges on a price chart that may push traders to increase activity.
Let’s look at an example of a support level. We notice that price keeps moving into areas where assets are being bought. When this area is repeatedly tested multiple times, a support range forms. Since the bears (sellers) are unable to push the price further down, the price eventually rebounds — potentially starting a new uptrend.
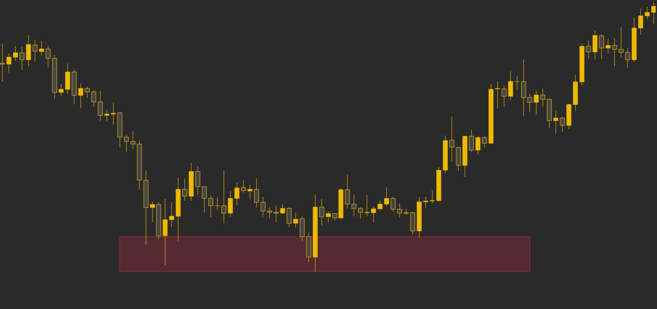
The price was oscillating around the support area before breaking out.
Now let's look at the resistance levels. As we can see, prices are trending downward. But after each rally, it failed to break out of the same area multiple times. Resistance levels form because bulls (buyers) are unable to take control of the market and push prices higher, causing the downward trend to continue.

The price is unable to break out of the resistance zone.
How Traders Use Support and Resistance Levels
Technical analysts use support and resistance levels to find areas of concern on price charts. In these areas, the likelihood of a reversal or pause in the underlying trend may be higher.
Market psychology plays a huge role in the formation of support and resistance levels. Traders and investors will remember previous price levels that increased interest and trading activity. Since many traders may be observing at the same level, this may allow increased liquidity in these areas. This often makes support and resistance areas ideal for large traders, or whales, to enter or exit positions.
Support and resistance are key concepts for proper risk management. If these areas can be identified consistently, it can lead to favorable trading opportunities. Typically, once price reaches a support or resistance area, two things can happen: The price will either bounce off that area, or it will break out and continue further in the direction of the trend — until it reaches the next support or resistance area.
Entering trades near support and resistance levels is a beneficial trading strategy. Mainly because this level is relatively close to the failure point - the point at which we would normally place a stop loss order. If the area is breached and the trade is invalid, the trader can cut their losses and exit with a small loss. In this sense, the further the entry is from the supply or demand area, the further away it is from the point of failure.
Another thing to consider is how these price points respond to changing circumstances. Generally speaking, a broken support area can turn into a resistance area when it breaks. Conversely, if the resistance area breaks, it could turn into a support level when tested again. These patterns are sometimes called support-resistance flips.

When tested again, the support zone breaks and turns into a resistance zone.
Situations where previous support areas now become resistance areas (and vice versa) confirm this pattern. Therefore, it may be advantageous to enter while this area is being retested.
Another thing to consider is the strength of the support or resistance zone. Generally, the more times the price declines and retests a support zone, the more likely it is that a breakout will occur. Likewise, the more times the price rises and retests the resistance zone, the more likely it is that a breakout of the upper limit will occur.
We have already talked about how support and resistance work in price action. And what about those types of support and resistance? Let's understand some of them.
psychological support and resistance
The first type we are going to discuss is called psychological support and resistance. These areas are not necessarily related to any technological model, it exists because of humans trying to understand how the world works.
In case you haven't noticed, we live in an incredibly complex world. As a result, we unintentionally try to simplify the world around us so that we can better understand it—for example, by rounding numbers. Have you ever thought about eating 0.7648 apples? Or buy 13,678,254 rice from the merchant?
A similar effect exists in financial markets. This is especially true for cryptocurrency trading, as it involves units of numbers that are divisible. Buying an asset for $8.0674 and selling it for $9.9765 is treated differently than buying an asset for $8 and selling it for $10. This is why round numbers can act as support or resistance on price charts.
If only it were that simple! This phenomenon has become well known over the years. Therefore, some traders may try to "jump" into areas of obvious psychological support or resistance. In this case, jumping the gun means placing an order outside the expected support or resistance area.
Let's look at the following example. When DXY approaches 100, some traders will place sell sell orders just below that level to secure a filled sell. Because too many traders expect a reversal at 100, and many jump ahead of that level, the market never reaches that level, but instead reverses before that.

The U.S. Dollar Index (DXY) reverses course before hitting 100.
Trend Line Support and Resistance
If you've read our classic chart patterns article, you'll know that patterns can also be a barrier to price. In the example below, an ascending triangle keeps price in control until it breaks through the upper limit.

Trendlines act as support and resistance for the S&P 500 Index.
You can take advantage of these patterns and identify areas of support and resistance that coincide with trend lines. This is especially true if you can identify patterns early, before they are fully formed.
Moving average support and resistance
Many indicators may also provide support or resistance when interacting with price.
One of the most straightforward examples is the moving average. Because moving averages can act as support or resistance for price, many traders use them as a barometer of the overall health of the market. Moving averages can also be of greater use when trying to spot trend reversals or pivot points.

The 200-week moving average serves as support for Bitcoin price.
Want to start your cryptocurrency journey? Buy Bitcoin on Binance today!
Fibonacci support and resistance
The levels described by the Fibonacci Retracement tool can also serve as support and resistance.
In the example below, the 61.8% Fibonacci level has acted as support multiple times, while the 23.6% level has acted as resistance.
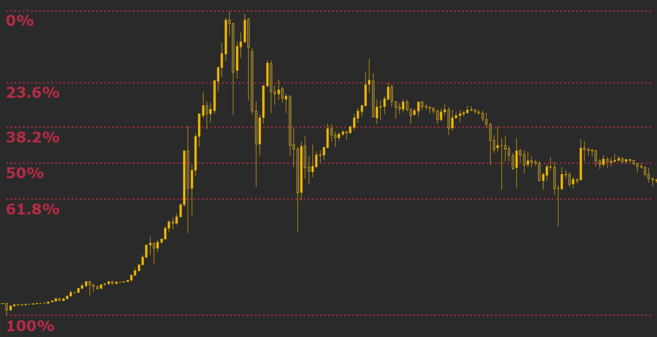
Fibonacci levels act as both support and resistance for Bitcoin price.
What is convergence in technical analysis?
So far we have explored what support and resistance are, and some of their different types. But what is the most effective way to build a trading strategy around support and resistance?
A key concept to understand first is called fusion. Fusion refers to combining multiple strategies together to form one strategy. Support and resistance levels tend to be most powerful when they fall into more than one of the categories we have discussed.
We use two examples to help understand. Which of the following potential support areas do you think is more likely to actually become support?
Support 1 complies with:
previous resistance area
Important moving averages
61.8% Fibonacci level
price integer
Support 2 complies with:
previous resistance area
price integer
If you have been paying attention to market movements, you would have guessed that support 1 has a higher chance of holding the price. This speculation could be correct, but the price could also move completely over support 1. The important point here is that support 1 is more likely to act as actual price support than support 2. Having said that, nothing is guaranteed to happen in real trading. While trading patterns can be helpful, past performance is not a guarantee of future performance, so you should be prepared for all possible outcomes.
Historically, combinations identified by multiple strategies and indicators have tended to provide the most favorable opportunities. Some successful fusion traders can be very picky about the setups they enter - this often requires patience. However, once they enter a trade, their setups tend to have a higher probability of success.
Even so, managing risk and protecting your capital from adverse price movements should always be your first priority. Even a market that seems to have the best entry point may go in the opposite direction. You should consider the possibility of multiple scenarios so you don't fall into false breakouts or bull and bear traps.
Summarize
Whether you are day trading or swing trading, you need to understand the basic concepts of support and resistance when performing technical analysis. Support is the lower limit of price, while resistance is the upper limit of price.
There may be different forms of support and resistance, some based on the interaction of price and technical indicators. The most reliable support and resistance areas tend to be areas confirmed by multiple strategies.
If you want to learn more about chart analysis, please read "12 Popular K-line Chart Patterns Used in Technical Analysis".