In the first cycle, after the ATL,
> BTC took 532 days to break above it’s previous ATH.
> In the second cycle, it’s taken 546 days to break above its previous ATH.
> If history repeats itself, we could see a new ATH around 385 days from today, possibly by December
2024.
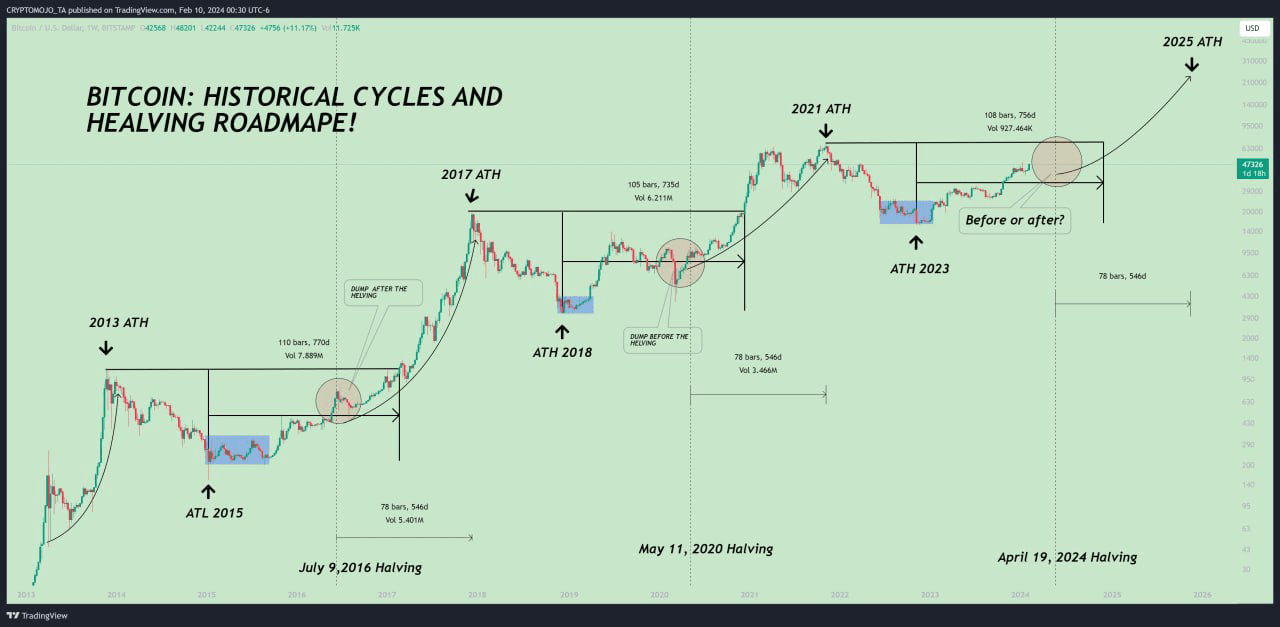
ROADMAP FOR BITCOIN HEALING
> First Halving: July 9, 2016
546 days of the bull market!
> Second Halving: May 11, 2020
546 Days of Bull Market after Halving 3
> Third Halving: April 25, 2024 (Expected)
Likely to last 528 days to 546 days of bull market.
Important THING TO BE NOTED
After every halving, BTC always does a slight dump.
As we can see in the chart, BTC dumped after the Helving on 2016.
In 2020, BTC dumped before the Helving
IMO, this time too, we may see a slight dump, but the question is before or after?
Based on fractal analysis and chart data, it is anticipated that Bitcoin will reach its next bull market peak in September 2025. Subsequently, a shift back into the bear market is expected. Consequently, a decision to exit the market before September is considered, given that these projections are assumptions derived from fractal chart data.
I hope this graph clarifies how BTC's long-term growth dynamics work.
Only in a probabilistic approach, this concept is.
This chart is likely to help you make better trade decisions if you consider upvoting it.
I would also love to know your charts and views in the comment section.
Thank you