
Let's analyze the current chart situation! The newly listed trading pair ANTB (Anthropic / bStocks) is moving into a phase of local stabilization after high initial volatility, gaining +2.72% over the day and trading at 89.20 USDT.
Key indicators and the technical picture from the chart:
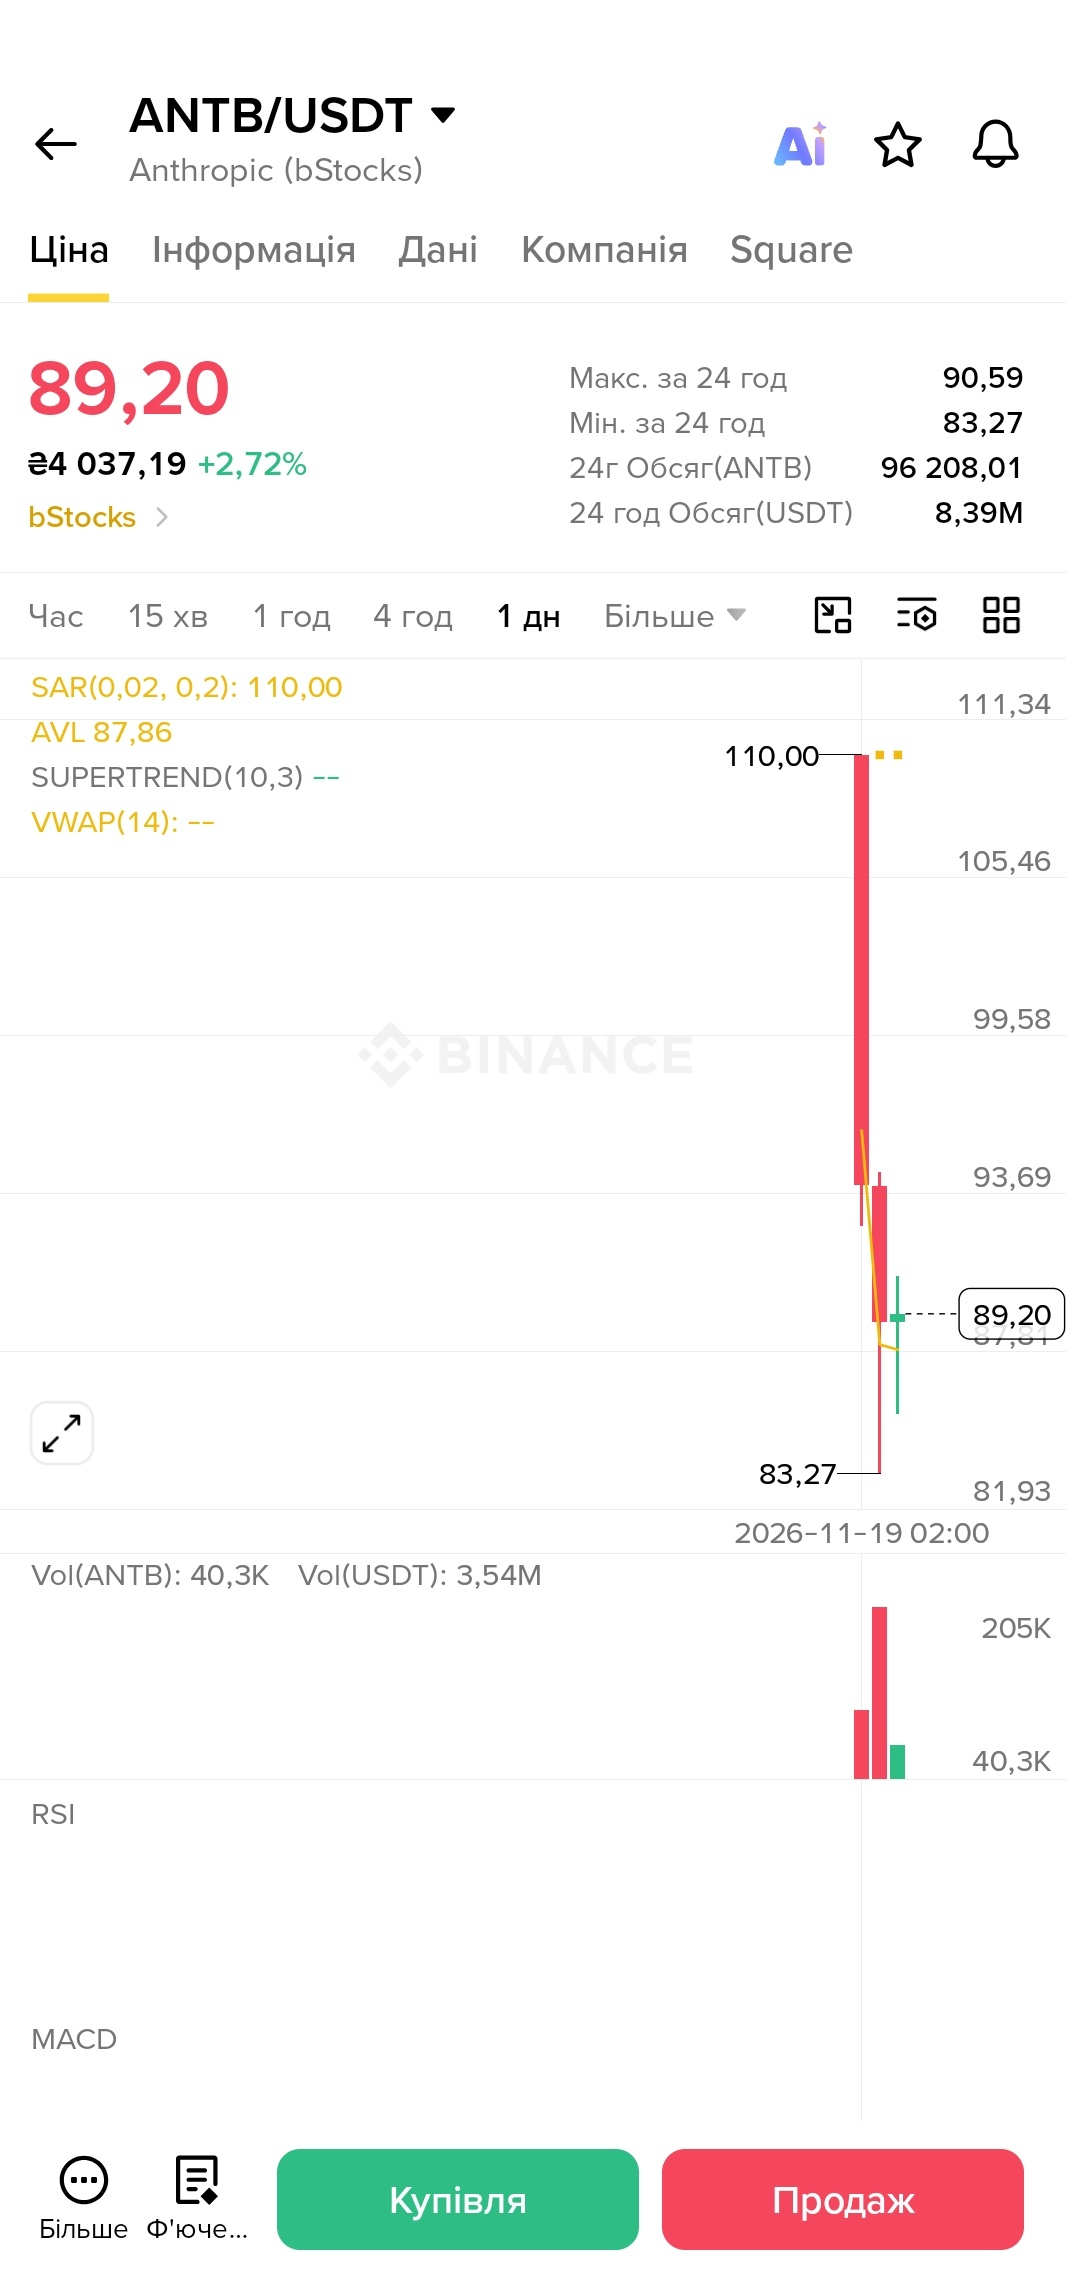
After an initial surge from the 110.00 USDT mark and a deep decline to a local low of 83.27 USDT (also the daily low), the asset formed a green rebound candle. Over the past 24 hours, the price has traded in a range from 83.27 USDT to a high of 90.59 USDT, coming very close to the psychological $90 mark.
Trading volume over 24 hours totaled 8.39 million USDT (with a volume of 96,208.01 ANTB), demonstrating active market interest in the new instrument. The current Vol(ANTB) on the candle has reached 40.3K (Vol(USDT): 3.54M).
The technical picture indicated by the indicators shows the formation of the first baseline levels over the short trading history (which is why the Supertrend (10,3) and VWAP (14) indicators have not yet produced calculated values):
The average AVL price was recorded at 87.86 USDT—the current price has successfully established itself above it, making this level the nearest local support below.
The Parabolic SAR indicator at the initial high of 110.00 USDT remains the nearest dynamic resistance above.
⚠️ Extremely important caution: recently added assets from the bStocks sector are characterized by extreme volatility and a lack of complete indicator history on the daily timeframe. Avoid impulsive trades without clear trend confirmation, be sure to set stop-losses, and strictly manage your risk!
💬 What’s your assessment of ANTB’s market debut? Can the asset establish itself above the psychological $90 mark (24-hour high: $90.59) and build on its bounce from the AVL level ($87.86), or do you expect a retest of the bottom near $83.27? Share your thoughts in the comments! 👇
#BinanceSquare #ANTB #Anthropic #BStocks #AI #cryptotrading #TechnicalAnalysis #RiskManagement