


How deep can Bitcoin go? On Friday, the price $BTC fell below $57,000, losing 30% in a month. Analysts believe the decline is not over. Most expect a bottom in the $50,000–54,000 range.
The realized price $BTC is just below $54,000. This refers to the average purchase price across all cryptocurrency investors.
U.S. spot bitcoin funds have already lost about $3.47 billion this month.
Wintermute expects bitcoin to reach $50,000
Crypto market maker Wintermute said the bear market was not over in a report dated November 16.
Wintermute pointed to the 200-week moving average near $68,000. This is the average weekly closing price over roughly four years. Traders view it as long-term support. Bitcoin has fallen below it.
The main problem is the flow of money. In 2026, net outflows from U.S. spot bitcoin ETFs exceeded $1.9 billion. In 2025, by contrast, they attracted $21 billion in new funds.
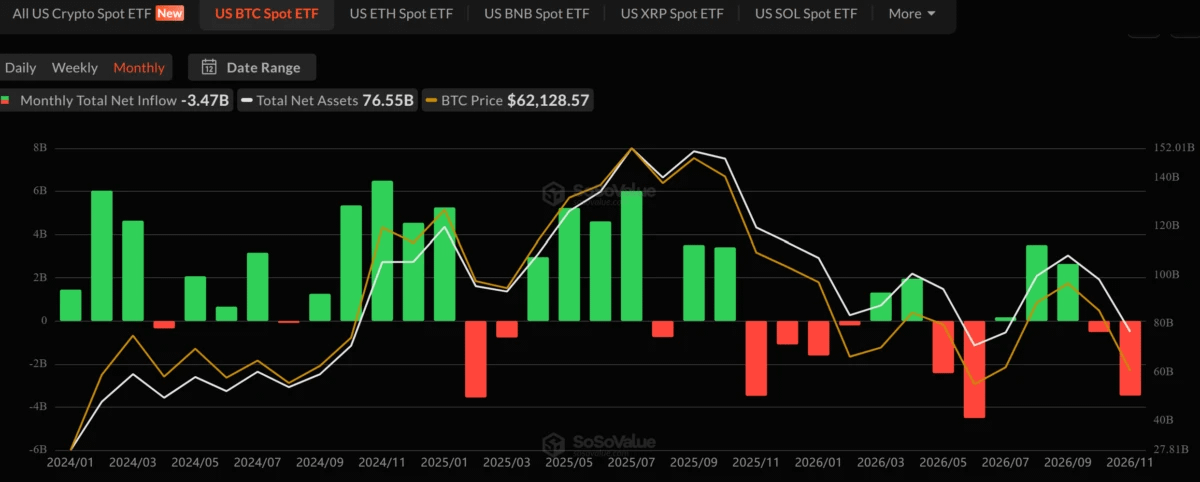
“Flows remain negative, support at the 200-week moving average has been lost—we expect pressure toward the $50,000 range, while the previous drop to $62,000 becomes the first target zone, followed by clusters of put options on Deribit near $60,000,” Wintermute’s forecast says.
A cluster of put options is a concentration of bets that the price will fall to a certain level. Both levels mentioned by Wintermute have already been breached.
The U.S. Federal Reserve (Fed) is adding to the pressure. Traders put the probability of a rate hike on December 9 at 97.9%. Higher interest rates weigh on assets that do not generate interest income.
$BTC below $54,000: what will change
Crypto analyst Benjamin Cowen described bitcoin’s typical movements during bear markets. It usually falls in the fourth quarter of U.S. midterm election years. Bitcoin also tends to decline after the first rate hike in a cycle.
Cowen noted that bitcoin usually falls below its realized price—which has now dropped below $54,000. Then, he said, the price reaches a “balanced level” that is significantly lower, though he did not specify an exact figure.
His on-chain risk indicator reads 0.167. According to Cowen, a bottom forms when the reading drops below 0.1.
Meanwhile, BitMEX co-founder and now Maelstrom chief investment officer Arthur Hayes expects further declines. He made the statement when bitcoin was trading at $61,405 on Friday.
“Next stop: the depths of the market,” Hayes wrote.
Hayes did not give a specific price target.
What the weekly bitcoin chart shows
On the weekly chart, bitcoin opened the week at $65,351 and fell as low as $57,100. That is a decline of more than 10%. There are more than two days left in the week.
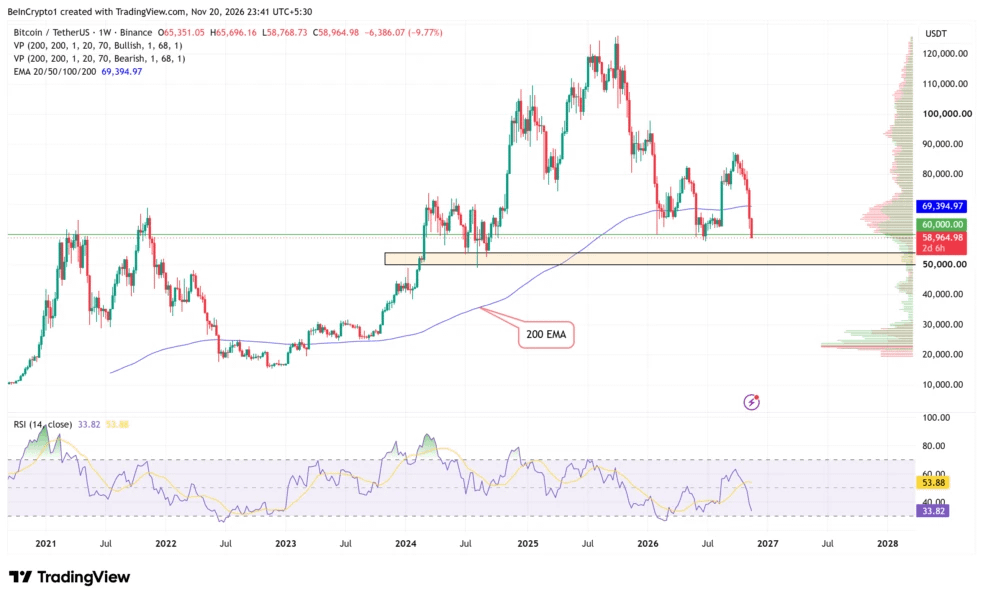
The Relative Strength Index (RSI) stands at 33.82. This means bitcoin is approaching oversold territory, and profit-taking may be exhausted.
The RSI is well below its average of 53.89 and continues to fall. The last time bitcoin’s weekly RSI dropped below 30 was in early 2026 and mid-2022—both times coinciding with significant local lows. This leaves room for further selling before an oversold signal appears.
Volume profiles add another dimension to the analysis.
The horizontal bars on the profile show where traders were most active in buying and selling. Green bars indicate bullish volume, while red bars indicate bearish volume.
Red bars dominate the $60,000–$72,000 range. This suggests sellers are concentrated above current levels and are ready to meet any rebound.
Below bitcoin’s current price, the picture changes: from $58,000 to $50,000, there is more green—buyers are waiting there.
The area of buyer interest coincides with the $50,000–$54,000 range previously cited by analysts. It also corresponds to the lows of August 2024, when bitcoin briefly fell to $50,000 before rising sharply.
A weekly close below $50,000 would take bitcoin into a low-volume area, where support is weaker.
Bitcoin’s bottom is closer than it seems
Some analysts don’t expect a prolonged decline. According to Rekt Capital, bitcoin is less than 2% away from forming a new bottom in the fourth quarter.
If the forecast comes true, bitcoin will return to its familiar four-year cycle. Under this pattern, peaks and lows in the cryptocurrency market alternate roughly every four years.
Wintermute is in no rush to announce where it thinks the bottom will be. However, the company notes that closes below the 200-week moving average attract patient investors who view the market over a horizon of several quarters. Earlier this month, Grayscale called the correction an attractive entry point.
Wintermute is ready to adopt a less defensive strategy only if two conditions are met:
A daily close above $68,000, alongside an increase in inflows into bitcoin ETFs.
A more dovish Fed outlook would also change the current stance.
The next tests are just around the corner. Data on the Fed’s favorite inflation gauge will be released on November 25, and the rate decision is due on December 9.
As Wintermute emphasizes, the market has already priced in three rate hikes by March. Bitcoin is currently trading more like a bet on U.S. interest rates than as a hedging instrument.