
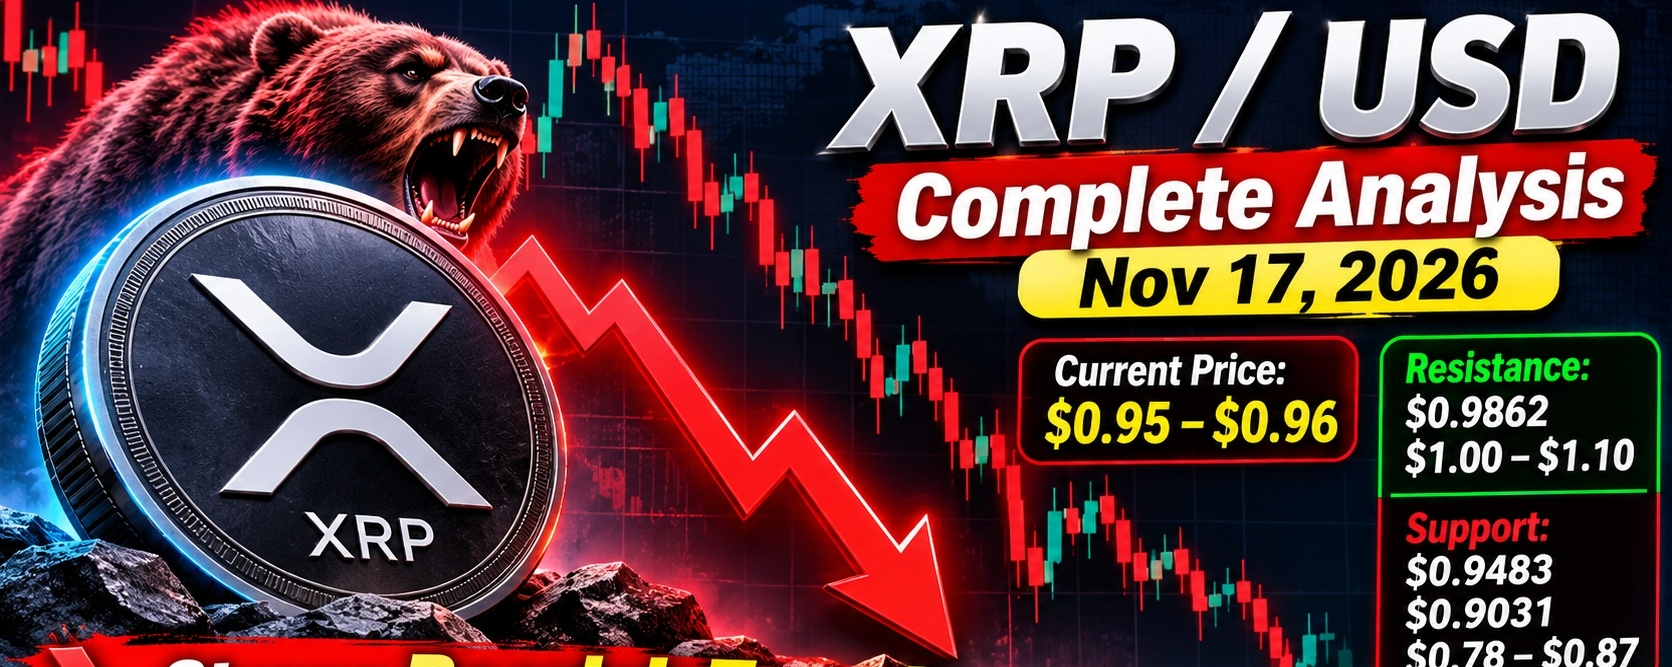

Here is complete $XRP /USD analysis for today, Nov 17, 2026
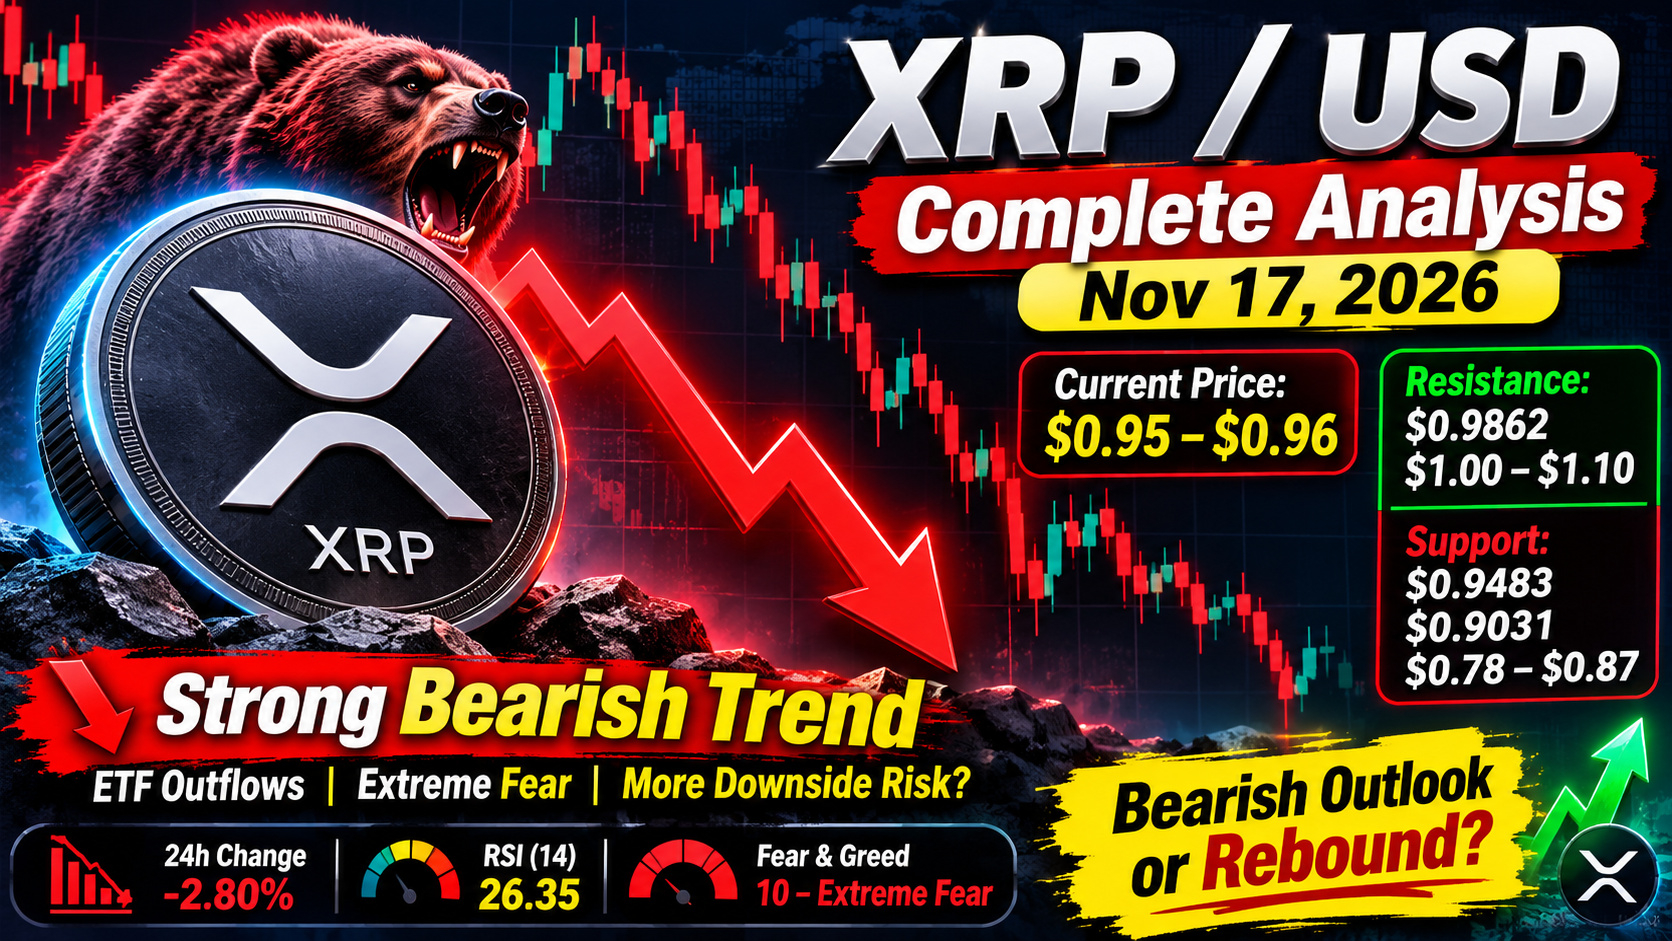
1. Current Price Snapshot
Price right now: $0.95 - $0.96 range
Latest Binance quote: $0.9537 USDT as of 2026-11-17 01:28 UTC
Day range: $0.9424 Low to $0.9769 High
24h volume: ∼$3.8B across 44 exchanges
Market cap: ∼$60.96B
Cheapest exchange: Bitstamp $0.9523, dearest HTX $0.9536 - only 0.14% spread

Performance context:
5-day: -9.89% | 1-month: -26.72% | YTD: -49.56% | 1-year: -56.17%
This is one of $XRP 's worst Novembers ever: down 19.2% in Nov 2026 vs historical average +78.3%
XRP hit lowest since Nov 2024 this weekend due to ETF outflows
2. Technical Analysis
Trend: Strong Bearish
Trading at $0.95, well beneath 50, 100, and 200-day EMAs clustered $1.23 - $1.33
Trades below key moving averages with strong downside pressure
Short-term signal: Sell (4,853 days of history model)
Fear & Greed: 10 - Extreme Fear, AI signal Bearish 67%
Momentum:
14-day RSI: 26.35 after bouncing from ∼17, deepest oversold reading - another source has RSI 26.5
Sits 3.39 points below its signal line = still deteriorating
Key Levels:
Immediate Support: $0.9483 (-0.8% from now), then $0.9031 - $0.9074, then $0.8925
Resistance: $0.9862 nearest, then $0.9985 - $1.0118
If $0.9031 breaks, analysts see $0.77 - $0.87 and specifically $0.78 as potential bottom
3. What Is Driving It?
Bearish drivers right now:
ETF outflows: US spot $XRP ETFs posted zero net flows Nov 3-6, net assets down to $1.34B, deepening liquidity concerns
Stablecoin market cap shrinking affecting majors
Retail exiting: retail investors still exiting per FXStreet analysis
Bitcoin correlation: Analyst warning if BTC drops below $60k, XRP could push under $0.90
4. Forecast Scenarios
November 2026:
CoinDCX range: $0.89 low / $1.13 high / $1.04 avg - Recovery Target
Other model: $0.9074 to $1.0118 next few days
Bear Case:
Analysts CrediBULL Crypto target $0.60-$0.90 zone
25% crash risk to $0.77 flagged on historical bearish charts
Ali Martinez: $0.78 bottom before any rally
Bull Case:
EGRAG Crypto sees shakeout near $1 then Fib extension rally up to $31.64 long-term
Weekly ascending triangle since 2017 - if $0.78 holds, target is triangle resistance ∼$3.00-$3.50
Model year-end: $0.7531-$1.11, 2027: $0.6274-$1.37, 2030: $0.5822-$2.64
5. Trading Plan (Not Financial Advice)
If you are holding:
$0.9031 is the line in the sand. Daily close below it increases probability of $0.80-$0.87.
Extreme oversold (RSI ∼26) often bounces, but in strong downtrend bounces have failed - $0.9664 bounce +4% still down 14.1% weekly.
If you are looking to buy:
Aggressive: scale near $0.9483 / $0.9031 with tight stop
Conservative: wait for reclaim of $0.9985-$1.10 and 20-day MA. A close above $1.10 opens $1.24 (15.9% move)
Want me to set up a daily XRP price alert at $0.90 support / $1.00 resistance for you, or do a deeper on-chain / whale wallet analysis?
#XRPPredictions #Xrp🔥🔥 #XRPUpdate #XRPAnalysis #TrendingTopic