
#xrppredictions
xrppredictions
16.5M views
11,229 Discussing
Hot
Latest

Article
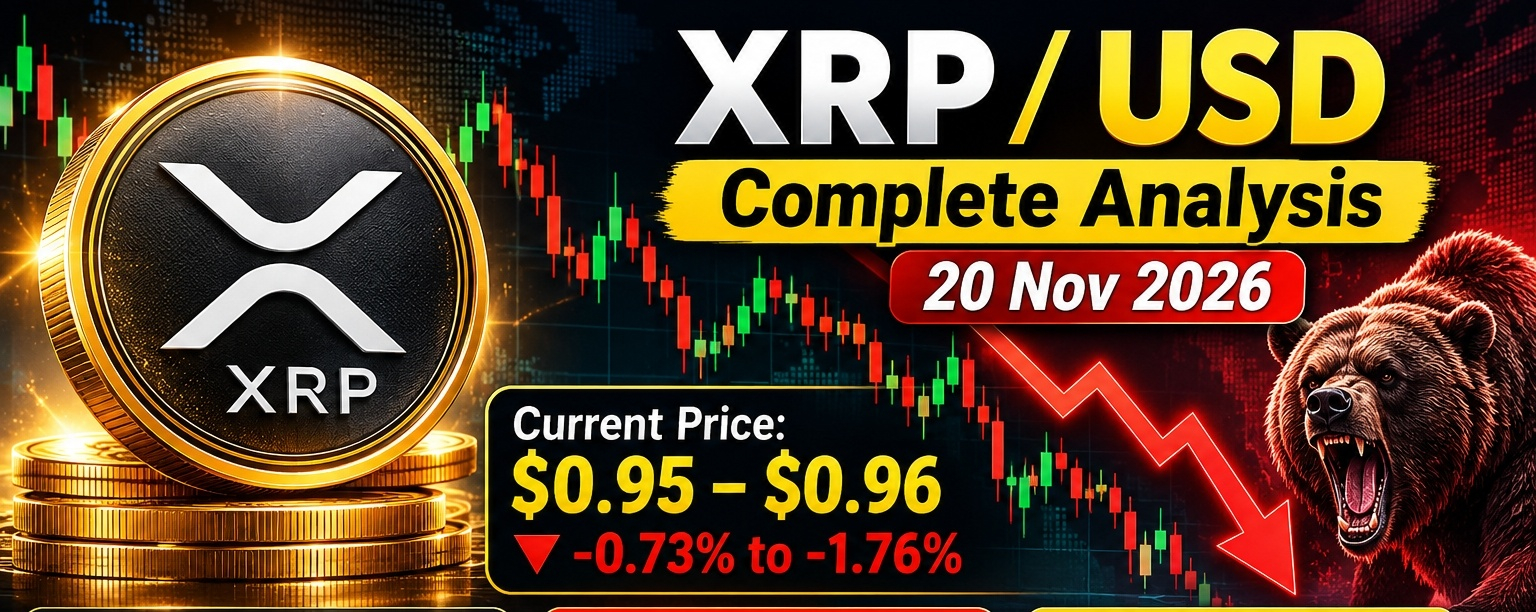
XRP / USD - Complete Analysis - 20 Nov 2026$XRP / USD - Complete Analysis - 20 Nov 2026
Current Price: ~$0.95 - $0.96
24h Range: $0.9477 - $0.9978
24h Change: -0.73% to -1.76% depending on exchange/time
Market Cap: ~$62.36B
Circulating Supply: 63.51B / Max 100B
{spot}(XRPUSDT)
$XRP is in a bearish, corrective phase after a major downtrend in 2026. It is trying to hold above its 52-week low area, but it is trading below all major moving averages.
1. Performance
| Period | Return |
| --- | --- |
| 5 Sessions | +6.19% |
| 1 Month | -26.01% |
| 6 Months | -28.98% |
| Year-to-Date | -48.35% |
| 1 Year | -51.45% |
eaf4
The short-term bounce (+6% in 5 sessions) is happening inside a much larger downtrend. XRP is down almost half this year.
2. Technical Analysis
Trend: Bearish
Price is below its 50-day average of $1.2475 and below its 200-day average of $1.2440, which is a classic long-t 85ad
On intraday charts, price is just below H1 SMA-20 at $0.9579, H1 SMA-50 at $0.9591, and c27b
Technical rating is Bearish, with only 1 f2bf
Momentum:
14-day RSI: 30 - showing downward momentum, approaching oversold but no 85ad
MACD: Below signal line - bearish reading s 85ad
Sentiment is bearish, with fear dominating social media and trader position 2eb8
3. Key Levels
| Type | Level | Why It Matters |
| --- | --- | --- |
| Immediate Support | $0.9147 - $0.9031 | 52-week low area. Support sits at the 52-week low of $0.9137, reached on Nov 14, 2026. Another analysis puts support at $0.9031 |
| Strong Support | $0.90 - $0.94 | Immediate support zone. A break below could send XRP toward $0.85 |
| Deep Support | $0.78 | Multi-year ascending trendline - deeper floor if $0.85 fails |
| Immediate Resistance | $0.9985 - $1.00 | Psychological $1.00 level + recent high. Resistance sits near $0.9985 |
| First Breakout | $1.08 - $1.10 | Resistance starts at the 20-day EMA of $1.08. November target range is $0.89 to $1.10 |
| Major Resistance | $1.24 - $1.25 | 20-day / 50-day MA cluster and prior pivot |
f2bf2047e8b1b9c0
Short-term forecast: Next 24h expected in $0.94 to $1.00 band, with a $0.98 target. Next trading day expe.9987**. b9c0c27b
4. Fundamentals & Flows
Bearish Factors:
ETF Outflows: U.S. spot XRP ETFs recorded $19.1M in net outflows from Nov 9-13, driven by institutional redemptions. Earlier in Novembdrawn. c27b2047
Weak Demand: News on Nov 19nd demand. 2eb8
Bullish / Mixed Factors:
Earlier in the cycle, U.S. spot XRP ETFs had taken in $4.32M for week ending Oct 30, the only major crypto ETF category with positive flows at that time, and the XRP Ledger added 7,934 new wallets on Nov 1, its sixth-highest daily total of 20w stalled. 7b72
One rating service rates XRP **Strong Sell witof Nov 19. f2bf
5. Scenarios
1. Bullish Scenario (30% probability)
Trigger: Hold above $0.95 and close above $1.00.
Targets: $1.05 -> $1.10 -> $1.24
Reclaiming $1.00 would mark an important first step, wi1.10 next. e8b1
2. Base / Sideways Scenario (40% probability)
Range: $0.91 - $1.00
XRP chops between support and $1.00 resistance while RSI recovers from near 30. This fits the November projection of $0.89 to $ry target. b9c0
3. Bearish Scenario (30% probability)
Trigger: Daily close below $0.9031 / $0.90
Targets: $0.85 -> $0.78
Price trades below key moving averages with strong downside pressure and highe declines. 2047
6. What To Watch
$0.90 hold or break: This is the make-or-break level for November.
$1.00 reclaim: Needed to flip short-term bias from bearish to neutral.
ETF flows: Return to inflows would be the first sign of institutional buying returning.
Bitcoin / Overall Market: XRP is unlikely to rally strongly alone while the broader market is weak.
RSI: If RSI drops below 30 and holds, a relief bounce becomes more likely, but not a trend reversal.
Bottom Line: $XRP is in a downtrend, oversold-ish but not yet capitulated. Short-term traders should respect $0.90 as support and $1.00 as resistance. A sustained move above $1.08-$1.10 is needed to confirm a real recovery toward $1.24. Until then, rallies are likely to be sold.
This is market analysis for information only, not financial advice.
#XRPPredictions #XRPUSDT🚨 #XRPAnalysis #XRPUpdate #XRPRealityCheck
XRP / USD - Complete Analysis - 20 Nov 2026
$XRP / USD - Complete Analysis - 20 Nov 2026
Current Price: ~$0.95 - $0.96
24h Range: $0.9477 - $0.9978
24h Change: -0.73% to -1.76% depending on exchange/time
Market Cap: ~$62.36B
Circulating Supply: 63.51B / Max 100B
$XRP is in a bearish, corrective phase after a major downtrend in 2026. It is trying to hold above its 52-week low area, but it is trading below all major moving averages.
1. Performance
| Period | Return |
| --- | --- |
| 5 Sessions | +6.19% |
| 1 Month | -26.01% |
| 6 Months | -28.98% |
| Year-to-Date | -48.35% |
| 1 Year | -51.45% |
eaf4
The short-term bounce (+6% in 5 sessions) is happening inside a much larger downtrend. XRP is down almost half this year.
2. Technical Analysis
Trend: Bearish
Price is below its 50-day average of $1.2475 and below its 200-day average of $1.2440, which is a classic long-t 85ad
On intraday charts, price is just below H1 SMA-20 at $0.9579, H1 SMA-50 at $0.9591, and c27b
Technical rating is Bearish, with only 1 f2bf
Momentum:
14-day RSI: 30 - showing downward momentum, approaching oversold but no 85ad
MACD: Below signal line - bearish reading s 85ad
Sentiment is bearish, with fear dominating social media and trader position 2eb8
3. Key Levels
| Type | Level | Why It Matters |
| --- | --- | --- |
| Immediate Support | $0.9147 - $0.9031 | 52-week low area. Support sits at the 52-week low of $0.9137, reached on Nov 14, 2026. Another analysis puts support at $0.9031 |
| Strong Support | $0.90 - $0.94 | Immediate support zone. A break below could send XRP toward $0.85 |
| Deep Support | $0.78 | Multi-year ascending trendline - deeper floor if $0.85 fails |
| Immediate Resistance | $0.9985 - $1.00 | Psychological $1.00 level + recent high. Resistance sits near $0.9985 |
| First Breakout | $1.08 - $1.10 | Resistance starts at the 20-day EMA of $1.08. November target range is $0.89 to $1.10 |
| Major Resistance | $1.24 - $1.25 | 20-day / 50-day MA cluster and prior pivot |
f2bf2047e8b1b9c0
Short-term forecast: Next 24h expected in $0.94 to $1.00 band, with a $0.98 target. Next trading day expe.9987**. b9c0c27b
4. Fundamentals & Flows
Bearish Factors:
ETF Outflows: U.S. spot XRP ETFs recorded $19.1M in net outflows from Nov 9-13, driven by institutional redemptions. Earlier in Novembdrawn. c27b2047
Weak Demand: News on Nov 19nd demand. 2eb8
Bullish / Mixed Factors:
Earlier in the cycle, U.S. spot XRP ETFs had taken in $4.32M for week ending Oct 30, the only major crypto ETF category with positive flows at that time, and the XRP Ledger added 7,934 new wallets on Nov 1, its sixth-highest daily total of 20w stalled. 7b72
One rating service rates XRP **Strong Sell witof Nov 19. f2bf
5. Scenarios
1. Bullish Scenario (30% probability)
Trigger: Hold above $0.95 and close above $1.00.
Targets: $1.05 -> $1.10 -> $1.24
Reclaiming $1.00 would mark an important first step, wi1.10 next. e8b1
2. Base / Sideways Scenario (40% probability)
Range: $0.91 - $1.00
XRP chops between support and $1.00 resistance while RSI recovers from near 30. This fits the November projection of $0.89 to $ry target. b9c0
3. Bearish Scenario (30% probability)
Trigger: Daily close below $0.9031 / $0.90
Targets: $0.85 -> $0.78
Price trades below key moving averages with strong downside pressure and highe declines. 2047
6. What To Watch
$0.90 hold or break: This is the make-or-break level for November.
$1.00 reclaim: Needed to flip short-term bias from bearish to neutral.
ETF flows: Return to inflows would be the first sign of institutional buying returning.
Bitcoin / Overall Market: XRP is unlikely to rally strongly alone while the broader market is weak.
RSI: If RSI drops below 30 and holds, a relief bounce becomes more likely, but not a trend reversal.
Bottom Line: $XRP is in a downtrend, oversold-ish but not yet capitulated. Short-term traders should respect $0.90 as support and $1.00 as resistance. A sustained move above $1.08-$1.10 is needed to confirm a real recovery toward $1.24. Until then, rallies are likely to be sold.
This is market analysis for information only, not financial advice.
#XRPPredictions #XRPUSDT🚨 #XRPAnalysis #XRPUpdate #XRPRealityCheck
Current Price: ~$0.95 - $0.96
24h Range: $0.9477 - $0.9978
24h Change: -0.73% to -1.76% depending on exchange/time
Market Cap: ~$62.36B
Circulating Supply: 63.51B / Max 100B
$XRP is in a bearish, corrective phase after a major downtrend in 2026. It is trying to hold above its 52-week low area, but it is trading below all major moving averages.
1. Performance
| Period | Return |
| --- | --- |
| 5 Sessions | +6.19% |
| 1 Month | -26.01% |
| 6 Months | -28.98% |
| Year-to-Date | -48.35% |
| 1 Year | -51.45% |
eaf4
The short-term bounce (+6% in 5 sessions) is happening inside a much larger downtrend. XRP is down almost half this year.
2. Technical Analysis
Trend: Bearish
Price is below its 50-day average of $1.2475 and below its 200-day average of $1.2440, which is a classic long-t 85ad
On intraday charts, price is just below H1 SMA-20 at $0.9579, H1 SMA-50 at $0.9591, and c27b
Technical rating is Bearish, with only 1 f2bf
Momentum:
14-day RSI: 30 - showing downward momentum, approaching oversold but no 85ad
MACD: Below signal line - bearish reading s 85ad
Sentiment is bearish, with fear dominating social media and trader position 2eb8
3. Key Levels
| Type | Level | Why It Matters |
| --- | --- | --- |
| Immediate Support | $0.9147 - $0.9031 | 52-week low area. Support sits at the 52-week low of $0.9137, reached on Nov 14, 2026. Another analysis puts support at $0.9031 |
| Strong Support | $0.90 - $0.94 | Immediate support zone. A break below could send XRP toward $0.85 |
| Deep Support | $0.78 | Multi-year ascending trendline - deeper floor if $0.85 fails |
| Immediate Resistance | $0.9985 - $1.00 | Psychological $1.00 level + recent high. Resistance sits near $0.9985 |
| First Breakout | $1.08 - $1.10 | Resistance starts at the 20-day EMA of $1.08. November target range is $0.89 to $1.10 |
| Major Resistance | $1.24 - $1.25 | 20-day / 50-day MA cluster and prior pivot |
f2bf2047e8b1b9c0
Short-term forecast: Next 24h expected in $0.94 to $1.00 band, with a $0.98 target. Next trading day expe.9987**. b9c0c27b
4. Fundamentals & Flows
Bearish Factors:
ETF Outflows: U.S. spot XRP ETFs recorded $19.1M in net outflows from Nov 9-13, driven by institutional redemptions. Earlier in Novembdrawn. c27b2047
Weak Demand: News on Nov 19nd demand. 2eb8
Bullish / Mixed Factors:
Earlier in the cycle, U.S. spot XRP ETFs had taken in $4.32M for week ending Oct 30, the only major crypto ETF category with positive flows at that time, and the XRP Ledger added 7,934 new wallets on Nov 1, its sixth-highest daily total of 20w stalled. 7b72
One rating service rates XRP **Strong Sell witof Nov 19. f2bf
5. Scenarios
1. Bullish Scenario (30% probability)
Trigger: Hold above $0.95 and close above $1.00.
Targets: $1.05 -> $1.10 -> $1.24
Reclaiming $1.00 would mark an important first step, wi1.10 next. e8b1
2. Base / Sideways Scenario (40% probability)
Range: $0.91 - $1.00
XRP chops between support and $1.00 resistance while RSI recovers from near 30. This fits the November projection of $0.89 to $ry target. b9c0
3. Bearish Scenario (30% probability)
Trigger: Daily close below $0.9031 / $0.90
Targets: $0.85 -> $0.78
Price trades below key moving averages with strong downside pressure and highe declines. 2047
6. What To Watch
$0.90 hold or break: This is the make-or-break level for November.
$1.00 reclaim: Needed to flip short-term bias from bearish to neutral.
ETF flows: Return to inflows would be the first sign of institutional buying returning.
Bitcoin / Overall Market: XRP is unlikely to rally strongly alone while the broader market is weak.
RSI: If RSI drops below 30 and holds, a relief bounce becomes more likely, but not a trend reversal.
Bottom Line: $XRP is in a downtrend, oversold-ish but not yet capitulated. Short-term traders should respect $0.90 as support and $1.00 as resistance. A sustained move above $1.08-$1.10 is needed to confirm a real recovery toward $1.24. Until then, rallies are likely to be sold.
This is market analysis for information only, not financial advice.
#XRPPredictions #XRPUSDT🚨 #XRPAnalysis #XRPUpdate #XRPRealityCheck
1
894
{spot}(XRPUSDT)
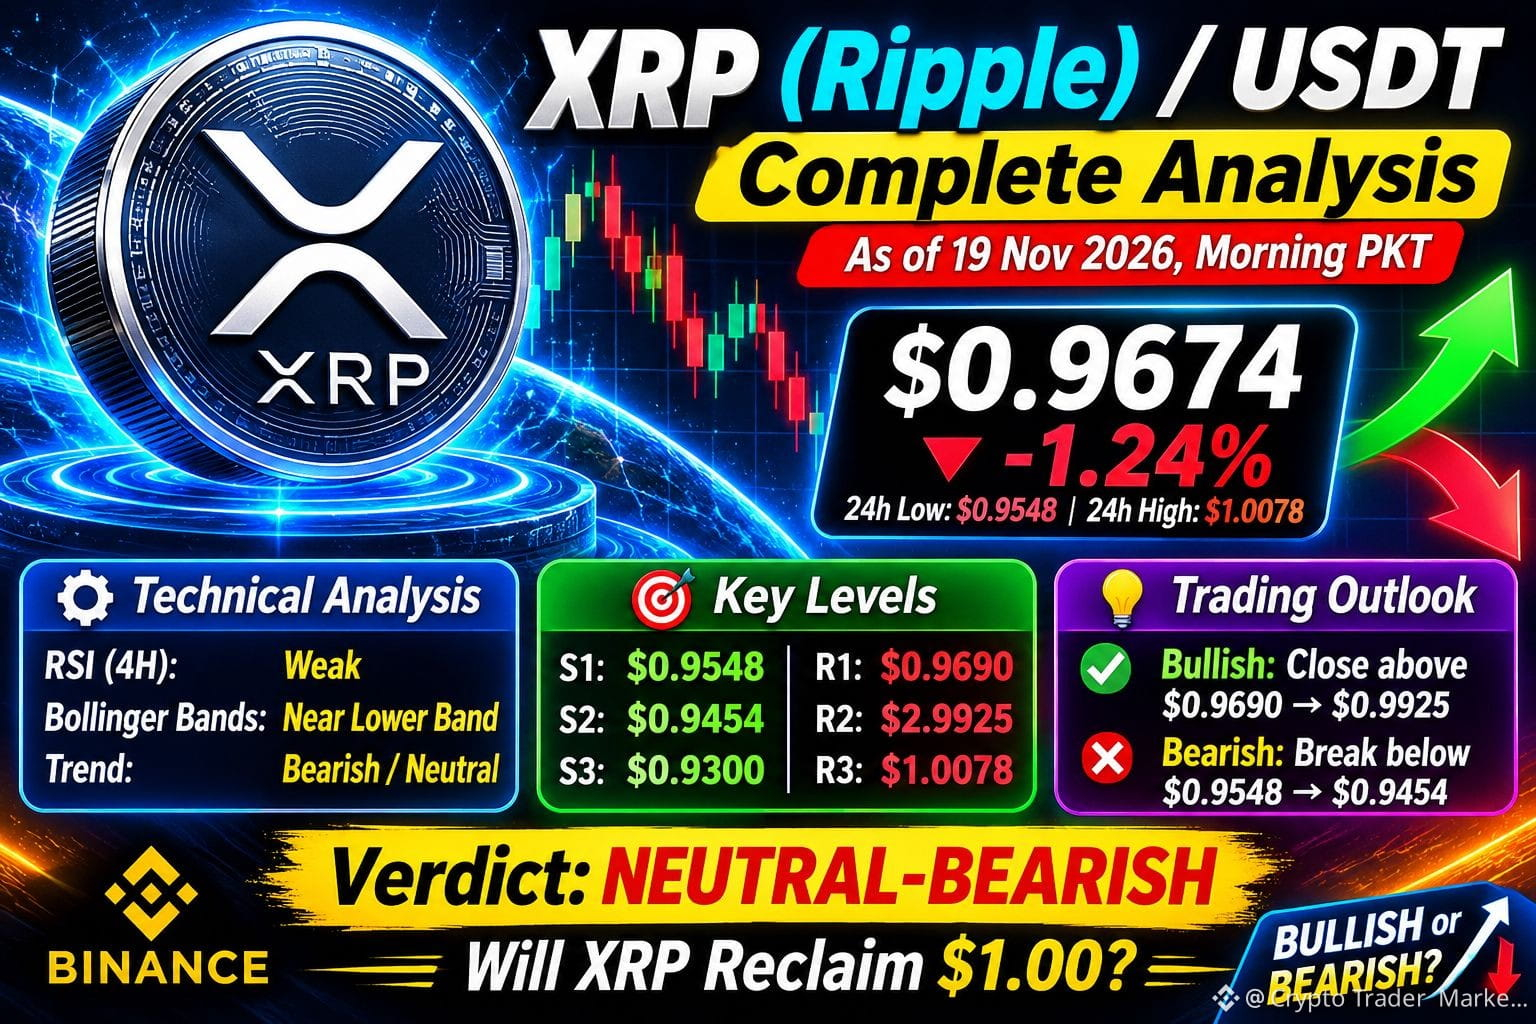
$XRP 🚨 XRP/USDT UPDATE – BEARS ARE STILL IN CONTROL? 📉
XRP is trading around $0.9674, down 1.24% in the last 24 hours.
📊 4-Hour Chart Analysis:
🔴 Current Price: $0.9674
🔴 24H High: $1.0078
🟢 24H Low: $0.9548
Bollinger Bands:
Upper Band: $0.9925
Middle Band: $0.9690
Lower Band: $0.9454
🔥 Important Levels to Watch:
🟢 Support 1: $0.9548
🟢 Support 2: $0.9454
🟢 Strong Support: $0.9300
🔴 Resistance 1: $0.9690
🔴 Resistance 2: $0.9925
🔴 Major Resistance: $1.0078
My Technical View:
XRP recently bounced from approximately $0.8930 but faced selling pressure near the $0.99 area.
The price is now slightly below the Bollinger middle band, suggesting weak short-term momentum.
🐂 Bullish Scenario: A strong 4H close above $0.9690 could open the door toward $0.9925 and $1.0078.
🐻 Bearish Scenario: A breakdown below $0.9548 could send XRP toward $0.9454 and potentially $0.9300.
🎯 My Verdict: NEUTRAL-BEARISH
Which direction will XRP move next?
$BTC $ETH
#Xrp🔥🔥 #XRPPredictions
$XRP 🚨 XRP/USDT UPDATE – BEARS ARE STILL IN CONTROL? 📉
XRP is trading around $0.9674, down 1.24% in the last 24 hours.
📊 4-Hour Chart Analysis:
🔴 Current Price: $0.9674
🔴 24H High: $1.0078
🟢 24H Low: $0.9548
Bollinger Bands:
Upper Band: $0.9925
Middle Band: $0.9690
Lower Band: $0.9454
🔥 Important Levels to Watch:
🟢 Support 1: $0.9548
🟢 Support 2: $0.9454
🟢 Strong Support: $0.9300
🔴 Resistance 1: $0.9690
🔴 Resistance 2: $0.9925
🔴 Major Resistance: $1.0078
My Technical View:
XRP recently bounced from approximately $0.8930 but faced selling pressure near the $0.99 area.
The price is now slightly below the Bollinger middle band, suggesting weak short-term momentum.
🐂 Bullish Scenario: A strong 4H close above $0.9690 could open the door toward $0.9925 and $1.0078.
🐻 Bearish Scenario: A breakdown below $0.9548 could send XRP toward $0.9454 and potentially $0.9300.
🎯 My Verdict: NEUTRAL-BEARISH
Which direction will XRP move next?
$BTC $ETH
#Xrp🔥🔥 #XRPPredictions
$XRP 🚨 XRP/USDT UPDATE – BEARS ARE STILL IN CONTROL? 📉
XRP is trading around $0.9674, down 1.24% in the last 24 hours.
📊 4-Hour Chart Analysis:
🔴 Current Price: $0.9674
🔴 24H High: $1.0078
🟢 24H Low: $0.9548
Bollinger Bands:
Upper Band: $0.9925
Middle Band: $0.9690
Lower Band: $0.9454
🔥 Important Levels to Watch:
🟢 Support 1: $0.9548
🟢 Support 2: $0.9454
🟢 Strong Support: $0.9300
🔴 Resistance 1: $0.9690
🔴 Resistance 2: $0.9925
🔴 Major Resistance: $1.0078
My Technical View:
XRP recently bounced from approximately $0.8930 but faced selling pressure near the $0.99 area.
The price is now slightly below the Bollinger middle band, suggesting weak short-term momentum.
🐂 Bullish Scenario: A strong 4H close above $0.9690 could open the door toward $0.9925 and $1.0078.
🐻 Bearish Scenario: A breakdown below $0.9548 could send XRP toward $0.9454 and potentially $0.9300.
🎯 My Verdict: NEUTRAL-BEARISH
Which direction will XRP move next?
$BTC $ETH
#Xrp🔥🔥 #XRPPredictions
126

·
--
Bearish
🚨 XRP Crashes to 0.89 Then Bounces! Is a Massive Recovery Coming?
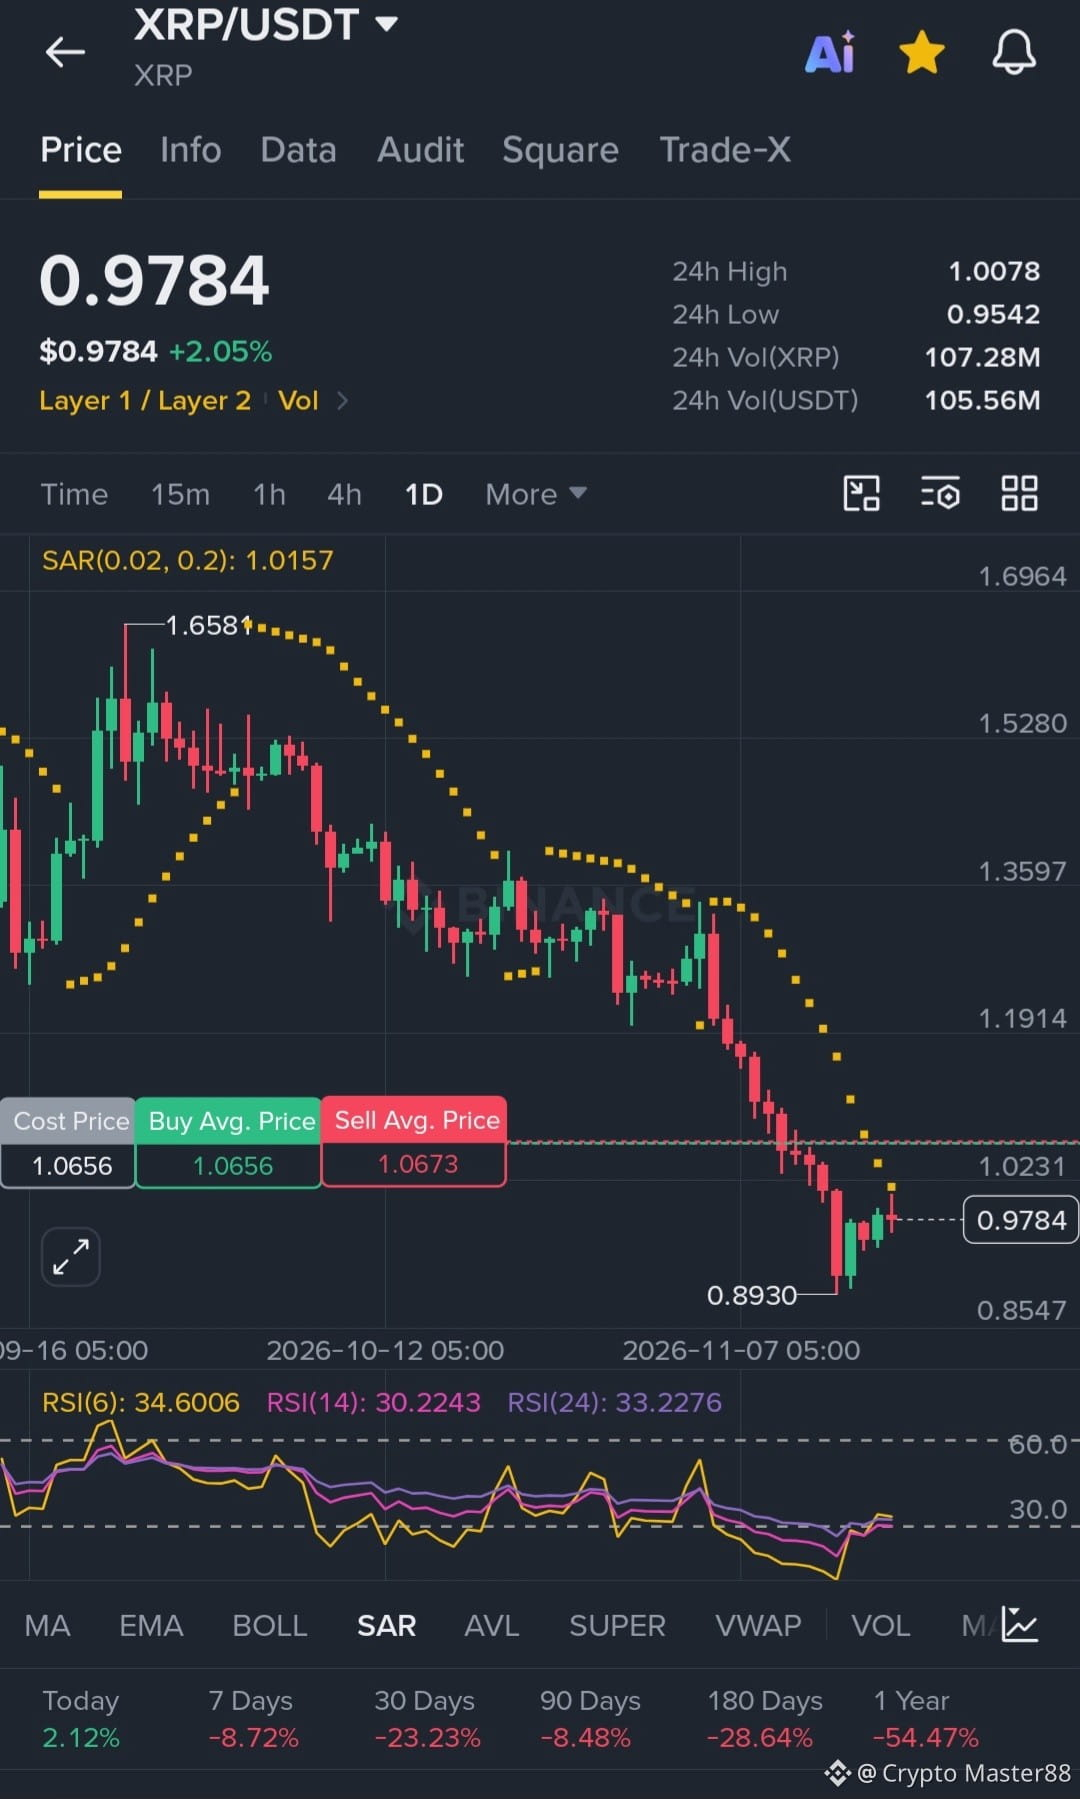
XRP just had a massive shakeout, dropping to a low of 0.8930 before bouncing back to 0.9784. Looking at the daily chart, the RSI is sitting around 30, which means it is right on the edge of the oversold zone. The Parabolic SAR is still above the price at 1.0157, showing the trend is technically still down. However, the strong green candles and the long lower wick from the recent drop show that big buyers are actively defending the 0.90 area. The market is trying hard to find a bottom here.
Here is the big news driving the price action. The crypto market is buzzing with optimism as Ripple's long legal battle with the SEC is finally nearing its absolute end, with the community expecting a massive win. On top of that, Ripple's new stablecoin, RLUSD, is gaining huge traction, and on-chain data shows that whales have been aggressively accumulating XRP during this dip. This combination of regulatory clarity and new institutional products is giving buyers the confidence to step back in.
Here is your trading plan for this setup:
🟢 BUY / LONG ZONE: If the price pulls back to the 0.92 - 0.94 support zone and shows a green rejection candle on the 15-minute chart, you can buy. Targets are 1.00 and 1.05. Keep a strict stop-loss below 0.89.
🔴 SELL / SHORT ZONE: If the price pumps up to the 1.01 - 1.03 resistance (near the SAR dots) and gets rejected with a red candle, you can short. Targets are 0.96 and 0.92. Keep your stop-loss above 1.06.
#XRPPredictions #XRPHACKED #XRPUSDT🚨 $XRP
{future}(XRPUSDT)
🚨 XRP Crashes to 0.89 Then Bounces! Is a Massive Recovery Coming?
XRP just had a massive shakeout, dropping to a low of 0.8930 before bouncing back to 0.9784. Looking at the daily chart, the RSI is sitting around 30, which means it is right on the edge of the oversold zone. The Parabolic SAR is still above the price at 1.0157, showing the trend is technically still down. However, the strong green candles and the long lower wick from the recent drop show that big buyers are actively defending the 0.90 area. The market is trying hard to find a bottom here.
Here is the big news driving the price action. The crypto market is buzzing with optimism as Ripple's long legal battle with the SEC is finally nearing its absolute end, with the community expecting a massive win. On top of that, Ripple's new stablecoin, RLUSD, is gaining huge traction, and on-chain data shows that whales have been aggressively accumulating XRP during this dip. This combination of regulatory clarity and new institutional products is giving buyers the confidence to step back in.
Here is your trading plan for this setup:
🟢 BUY / LONG ZONE: If the price pulls back to the 0.92 - 0.94 support zone and shows a green rejection candle on the 15-minute chart, you can buy. Targets are 1.00 and 1.05. Keep a strict stop-loss below 0.89.
🔴 SELL / SHORT ZONE: If the price pumps up to the 1.01 - 1.03 resistance (near the SAR dots) and gets rejected with a red candle, you can short. Targets are 0.96 and 0.92. Keep your stop-loss above 1.06.
#XRPPredictions #XRPHACKED #XRPUSDT🚨 $XRP
XRP just had a massive shakeout, dropping to a low of 0.8930 before bouncing back to 0.9784. Looking at the daily chart, the RSI is sitting around 30, which means it is right on the edge of the oversold zone. The Parabolic SAR is still above the price at 1.0157, showing the trend is technically still down. However, the strong green candles and the long lower wick from the recent drop show that big buyers are actively defending the 0.90 area. The market is trying hard to find a bottom here.
Here is the big news driving the price action. The crypto market is buzzing with optimism as Ripple's long legal battle with the SEC is finally nearing its absolute end, with the community expecting a massive win. On top of that, Ripple's new stablecoin, RLUSD, is gaining huge traction, and on-chain data shows that whales have been aggressively accumulating XRP during this dip. This combination of regulatory clarity and new institutional products is giving buyers the confidence to step back in.
Here is your trading plan for this setup:
🟢 BUY / LONG ZONE: If the price pulls back to the 0.92 - 0.94 support zone and shows a green rejection candle on the 15-minute chart, you can buy. Targets are 1.00 and 1.05. Keep a strict stop-loss below 0.89.
🔴 SELL / SHORT ZONE: If the price pumps up to the 1.01 - 1.03 resistance (near the SAR dots) and gets rejected with a red candle, you can short. Targets are 0.96 and 0.92. Keep your stop-loss above 1.06.
#XRPPredictions #XRPHACKED #XRPUSDT🚨 $XRP
2
2.6k

·
--
Bearish
$XRP
{future}(XRPUSDT)
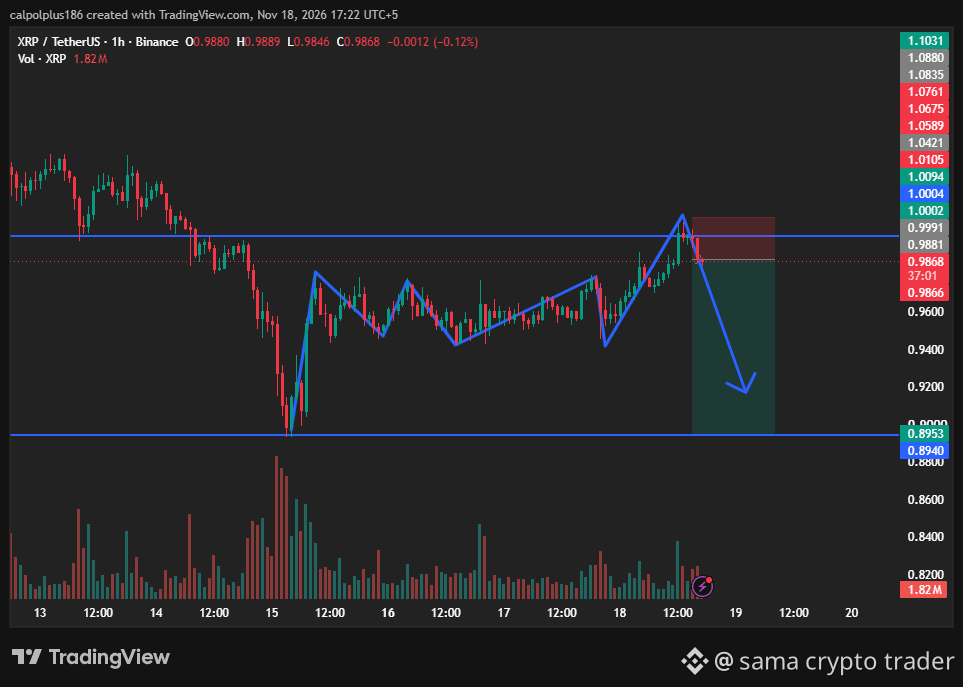
I have just opened a short position on XRP/USDT Can anyone tell me whether I will get stopped out or if my take-profit (TP) will be hit? Given that the overall trend for both XRP and Bitcoin is downward could someone provide some guidance?
#XRPPredictions #XRPUSDT🚨 #BinanceSquare
$XRP
I have just opened a short position on XRP/USDT Can anyone tell me whether I will get stopped out or if my take-profit (TP) will be hit? Given that the overall trend for both XRP and Bitcoin is downward could someone provide some guidance?
#XRPPredictions #XRPUSDT🚨 #BinanceSquare
I have just opened a short position on XRP/USDT Can anyone tell me whether I will get stopped out or if my take-profit (TP) will be hit? Given that the overall trend for both XRP and Bitcoin is downward could someone provide some guidance?
#XRPPredictions #XRPUSDT🚨 #BinanceSquare
SOVRIN FUND:
Happy hunting🥷🏿🌱
2
1.2k
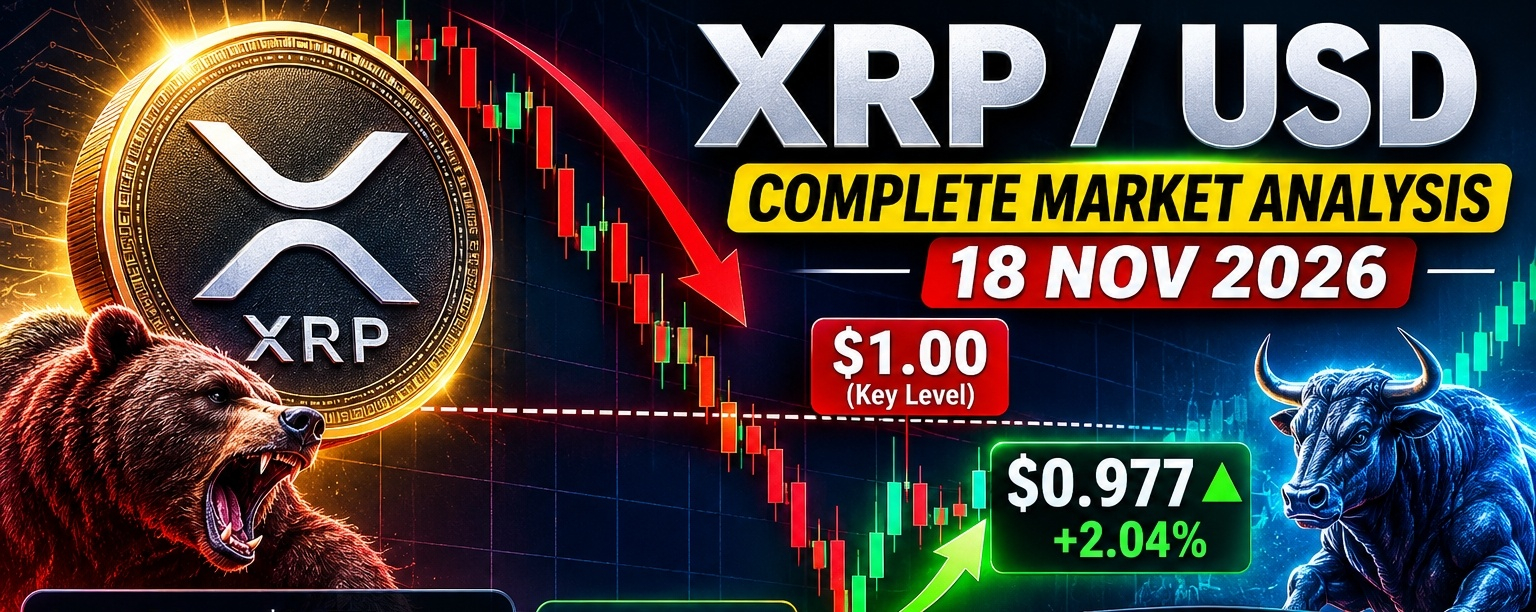
Article
XRP / USD - Complete Analysis
18 Nov 2026 | Price: ∼$0.977$XRP / USD - Complete Analysis
18 Nov 2026 | Price: ∼$0.977
$XRP is in a bearish, oversold bounce phase. It just crashed to its lowest level since November 2024, lost the psychologically critical $1.00 level, and is now trying to reclaim it. The long-term regulatory story has improved dramatically, but short-term price action, ETF outflows, and market-wide fear are dominating.
This is not financial advice. Crypto is highly volatile.
{spot}(XRPUSDT)
1. Live Market Snapshot
| Metric | Value |
| --- | --- |
| Current Price | $0.9772 |
| 24h Range | $0.9456 - $0.9918 |
| 24h Change | +2.04% |
| 24h Volume | ~$1.62B |
| Market Cap | ~$61.03B |
| Circulating Supply | 63.51B XRP |
| Total / Max Supply | 99.98B / 100B XRP |
| All-Time High | $3.65 (17 July 2025) - now -73.3% below ATH |
Performance:
5 sessions: -6.72%
1 month: -25.69%
6 months: -30.12%
Year-to-date: -48.33%
1 year: -56.19%
Sentiment is Extreme Fear - Fear & Greed at 11, with AI signal rated Bearish 67% in recent trackers.
## 2. What Just Happened?
$XRP fell to $0.89 on 15 Nov, its lowest since November 2024, during sector-wide outflows from crypto ETFs and a contraction in stablecoin market cap.
It has since rebounded +2.36% to $0.9768, but is still below $1 for the first time since mid-August.
In short: Capitulation -> weak bounce -> now stuck under $1.00.
3. Technical Analysis
Trend: Bearish
Price is well below its major moving averages. The nearest moving average is close to $1.13 and the longer-term average remains above $1.30. That means every rally has to fight through overhead supply.
Momentum: Deeply Oversold, Starting to Turn
14-day RSI reads 26.35 after rebounding from a low near 17, its deepest oversold reading on the chart, and sits 3.39 points below its signal line at 29.74.
RSI < 30 = oversold. This often leads to a bounce, but in a strong downtrend it can stay oversold for a while. It does NOT mean the bottom is in.
Key Levels
| Type | Level | Why it matters |
| --- | --- | --- |
| Strong Support | $0.89 - $0.90 | Recent crash low, Nov 2024 levels. Break below opens $0.77-$0.87 |
| Support 1 | $0.9383 - $0.9483 | Nearest support, ∼3% below current price |
| Support 2 | $0.9031 | Consolidation floor for next 2-3 days |
| Resistance 1 | $0.9597 - $0.9971 | Ichimoku Kijun + first resistance. Must clear to hold bounce |
| Psychological Resistance | $1.00 | The big round number. Losing it was bearish, reclaiming it is bullish |
| Resistance 2 | $1.10 - $1.13 | 20-day EMA. First major level a real rebound must clear |
| Resistance 3 | $1.24 - $1.40 | 30-day high zone + previous breakdown zone |
Immediate outlook from analysts: Consolidation expected between $0.9031 and $0.9985 over the next 2-3 trading days, with Kijun at $0.9613 acting as immediate resistance.
First resistance is $0.9971 (+2.8%), first support $0.9383 (-3.3%).
4. Fundamental Analysis - Why Long-Term Is Different From Price
Bullish Fundamentals
1. Regulatory Clarity - Solved
On 17 March 2026, the SEC and CFTC jointly classified XRP as a digital commodity, placing it on the same legal footing as Bitcoin and Ethereum. This removes the key legal barrier that kept institutions away for years.
2. Spot XRP ETFs Are Live
Six spot XRP ETFs are now live in the U.S., with expense ratios from 0.19% to 0.75%. Funds include Bitwise, Grayscale, Franklin Templeton, 21Shares, Canary, and REX-Osprey. First spot ETFs cleared in November 2025 after the SEC ended its case against Ripple.
3. ETF Options Expansion
In Sept 2026, Canadian Derivatives Clearing Corporation registered options on the Evolve XRP ETF and Purpose XRP ETF for sale in the US. This adds hedging tools for institutions.
4. Ripple's Real Use Case
XRP Ledger is built for fast, cheap cross-border payments - a real utility narrative vs. pure meme coins.
Bearish Fundamentals
1. ETF Flows Are Negative Right Now
The recent crash was driven by outflows from crypto ETFs. Even with ETFs approved, inflows have stalled.
2. No Recovery Catalyst
Analysts note XRP is near $61B market cap but "lacks recovery catalyst" despite the regulatory wins.
3. Supply Overhang
∼36B XRP still not in circulation (held by Ripple escrow / company). Unlocks create constant selling pressure fear.
4. Crypto Market-Wide Weakness
Bitcoin and altcoins are also falling, stablecoin market is shrinking - XRP is not falling alone.
5. Scenarios - What to Watch
🟢 Bullish Scenario (30% probability short-term)
Trigger: Daily close back above $1.00, then above $1.10
Target: $1.13 -> $1.24 -> $1.40
November projection targets $1.04, within range $0.89 to $1.13. Upside target is $1.24, 15.9% above $1.07, once XRP closes above $1.10 and ETF flows turn positive.
🟡 Base / Sideways Scenario (45% probability)
Range: $0.90 - $1.00
XRP consolidates, builds a base, RSI recovers from oversold. This is the "continued struggle near the bottom of the 52-week range" base case.
🔴 Bearish Scenario (25% probability)
Trigger: Lose $0.89 on a daily close with high volume
Target: $0.77 - $0.87
Longer-term chart projections identify a lower potential support range between $0.77 and $0.87. Some analysts warn losing $0.99 could expose XRP to further losses toward $0.80. EGRAG identifies $0.75 to $0.85 as a major support zone.
Ignore extreme long-term hype targets like $31.64 Fibonacci extensions circulating on social media - those require a full new bull cycle and massive adoption, not a short-term trade.
6. Key Dates Ahead
30 Nov 2026: GraniteShares leveraged XRP ETFs (3x Long / 3x Short) new effective date after delay from Oct 26 filing. Leveraged products increase volatility, not necessarily price.
Late Nov: Watch for spot ETF weekly flow data - if inflows return, that's the first real bullish signal.
7. Strategy Summary (Not Advice)
For Traders:
Do NOT chase the bounce under $1.00
Bullish confirmation = close above $1.00 + hold it for 2 days
Bearish confirmation = close below $0.89
Stop-loss logic for longs is typically just below $0.89
For Long-Term Holders / DCA:
Current zone $0.89 - $1.00 is historically a value zone (Nov 2024 levels)
Risk is still high: YTD -48% shows trend is down
Fundamentals (commodity status + ETFs) are best ever, price is worst in 2 years - that divergence is why many long-term holders are accumulating cautiously, not all-in
Risk Score: 41/100 - moderate-high risk environment.
#XRPPredictions #Xrp🔥🔥 #XRPUSDT #Ripple #CryptoNews #WhaleAlert #BinanceUpdates #MarketVolatility
XRP / USD - Complete Analysis 18 Nov 2026 | Price: ∼$0.977
$XRP / USD - Complete Analysis
18 Nov 2026 | Price: ∼$0.977
$XRP is in a bearish, oversold bounce phase. It just crashed to its lowest level since November 2024, lost the psychologically critical $1.00 level, and is now trying to reclaim it. The long-term regulatory story has improved dramatically, but short-term price action, ETF outflows, and market-wide fear are dominating.
This is not financial advice. Crypto is highly volatile.
1. Live Market Snapshot
| Metric | Value |
| --- | --- |
| Current Price | $0.9772 |
| 24h Range | $0.9456 - $0.9918 |
| 24h Change | +2.04% |
| 24h Volume | ~$1.62B |
| Market Cap | ~$61.03B |
| Circulating Supply | 63.51B XRP |
| Total / Max Supply | 99.98B / 100B XRP |
| All-Time High | $3.65 (17 July 2025) - now -73.3% below ATH |
Performance:
5 sessions: -6.72%
1 month: -25.69%
6 months: -30.12%
Year-to-date: -48.33%
1 year: -56.19%
Sentiment is Extreme Fear - Fear & Greed at 11, with AI signal rated Bearish 67% in recent trackers.
## 2. What Just Happened?
$XRP fell to $0.89 on 15 Nov, its lowest since November 2024, during sector-wide outflows from crypto ETFs and a contraction in stablecoin market cap.
It has since rebounded +2.36% to $0.9768, but is still below $1 for the first time since mid-August.
In short: Capitulation -> weak bounce -> now stuck under $1.00.
3. Technical Analysis
Trend: Bearish
Price is well below its major moving averages. The nearest moving average is close to $1.13 and the longer-term average remains above $1.30. That means every rally has to fight through overhead supply.
Momentum: Deeply Oversold, Starting to Turn
14-day RSI reads 26.35 after rebounding from a low near 17, its deepest oversold reading on the chart, and sits 3.39 points below its signal line at 29.74.
RSI < 30 = oversold. This often leads to a bounce, but in a strong downtrend it can stay oversold for a while. It does NOT mean the bottom is in.
Key Levels
| Type | Level | Why it matters |
| --- | --- | --- |
| Strong Support | $0.89 - $0.90 | Recent crash low, Nov 2024 levels. Break below opens $0.77-$0.87 |
| Support 1 | $0.9383 - $0.9483 | Nearest support, ∼3% below current price |
| Support 2 | $0.9031 | Consolidation floor for next 2-3 days |
| Resistance 1 | $0.9597 - $0.9971 | Ichimoku Kijun + first resistance. Must clear to hold bounce |
| Psychological Resistance | $1.00 | The big round number. Losing it was bearish, reclaiming it is bullish |
| Resistance 2 | $1.10 - $1.13 | 20-day EMA. First major level a real rebound must clear |
| Resistance 3 | $1.24 - $1.40 | 30-day high zone + previous breakdown zone |
Immediate outlook from analysts: Consolidation expected between $0.9031 and $0.9985 over the next 2-3 trading days, with Kijun at $0.9613 acting as immediate resistance.
First resistance is $0.9971 (+2.8%), first support $0.9383 (-3.3%).
4. Fundamental Analysis - Why Long-Term Is Different From Price
Bullish Fundamentals
1. Regulatory Clarity - Solved
On 17 March 2026, the SEC and CFTC jointly classified XRP as a digital commodity, placing it on the same legal footing as Bitcoin and Ethereum. This removes the key legal barrier that kept institutions away for years.
2. Spot XRP ETFs Are Live
Six spot XRP ETFs are now live in the U.S., with expense ratios from 0.19% to 0.75%. Funds include Bitwise, Grayscale, Franklin Templeton, 21Shares, Canary, and REX-Osprey. First spot ETFs cleared in November 2025 after the SEC ended its case against Ripple.
3. ETF Options Expansion
In Sept 2026, Canadian Derivatives Clearing Corporation registered options on the Evolve XRP ETF and Purpose XRP ETF for sale in the US. This adds hedging tools for institutions.
4. Ripple's Real Use Case
XRP Ledger is built for fast, cheap cross-border payments - a real utility narrative vs. pure meme coins.
Bearish Fundamentals
1. ETF Flows Are Negative Right Now
The recent crash was driven by outflows from crypto ETFs. Even with ETFs approved, inflows have stalled.
2. No Recovery Catalyst
Analysts note XRP is near $61B market cap but "lacks recovery catalyst" despite the regulatory wins.
3. Supply Overhang
∼36B XRP still not in circulation (held by Ripple escrow / company). Unlocks create constant selling pressure fear.
4. Crypto Market-Wide Weakness
Bitcoin and altcoins are also falling, stablecoin market is shrinking - XRP is not falling alone.
5. Scenarios - What to Watch
🟢 Bullish Scenario (30% probability short-term)
Trigger: Daily close back above $1.00, then above $1.10
Target: $1.13 -> $1.24 -> $1.40
November projection targets $1.04, within range $0.89 to $1.13. Upside target is $1.24, 15.9% above $1.07, once XRP closes above $1.10 and ETF flows turn positive.
🟡 Base / Sideways Scenario (45% probability)
Range: $0.90 - $1.00
XRP consolidates, builds a base, RSI recovers from oversold. This is the "continued struggle near the bottom of the 52-week range" base case.
🔴 Bearish Scenario (25% probability)
Trigger: Lose $0.89 on a daily close with high volume
Target: $0.77 - $0.87
Longer-term chart projections identify a lower potential support range between $0.77 and $0.87. Some analysts warn losing $0.99 could expose XRP to further losses toward $0.80. EGRAG identifies $0.75 to $0.85 as a major support zone.
Ignore extreme long-term hype targets like $31.64 Fibonacci extensions circulating on social media - those require a full new bull cycle and massive adoption, not a short-term trade.
6. Key Dates Ahead
30 Nov 2026: GraniteShares leveraged XRP ETFs (3x Long / 3x Short) new effective date after delay from Oct 26 filing. Leveraged products increase volatility, not necessarily price.
Late Nov: Watch for spot ETF weekly flow data - if inflows return, that's the first real bullish signal.
7. Strategy Summary (Not Advice)
For Traders:
Do NOT chase the bounce under $1.00
Bullish confirmation = close above $1.00 + hold it for 2 days
Bearish confirmation = close below $0.89
Stop-loss logic for longs is typically just below $0.89
For Long-Term Holders / DCA:
Current zone $0.89 - $1.00 is historically a value zone (Nov 2024 levels)
Risk is still high: YTD -48% shows trend is down
Fundamentals (commodity status + ETFs) are best ever, price is worst in 2 years - that divergence is why many long-term holders are accumulating cautiously, not all-in
Risk Score: 41/100 - moderate-high risk environment.
#XRPPredictions #Xrp🔥🔥 #XRPUSDT #Ripple #CryptoNews #WhaleAlert #BinanceUpdates #MarketVolatility
18 Nov 2026 | Price: ∼$0.977
$XRP is in a bearish, oversold bounce phase. It just crashed to its lowest level since November 2024, lost the psychologically critical $1.00 level, and is now trying to reclaim it. The long-term regulatory story has improved dramatically, but short-term price action, ETF outflows, and market-wide fear are dominating.
This is not financial advice. Crypto is highly volatile.
1. Live Market Snapshot
| Metric | Value |
| --- | --- |
| Current Price | $0.9772 |
| 24h Range | $0.9456 - $0.9918 |
| 24h Change | +2.04% |
| 24h Volume | ~$1.62B |
| Market Cap | ~$61.03B |
| Circulating Supply | 63.51B XRP |
| Total / Max Supply | 99.98B / 100B XRP |
| All-Time High | $3.65 (17 July 2025) - now -73.3% below ATH |
Performance:
5 sessions: -6.72%
1 month: -25.69%
6 months: -30.12%
Year-to-date: -48.33%
1 year: -56.19%
Sentiment is Extreme Fear - Fear & Greed at 11, with AI signal rated Bearish 67% in recent trackers.
## 2. What Just Happened?
$XRP fell to $0.89 on 15 Nov, its lowest since November 2024, during sector-wide outflows from crypto ETFs and a contraction in stablecoin market cap.
It has since rebounded +2.36% to $0.9768, but is still below $1 for the first time since mid-August.
In short: Capitulation -> weak bounce -> now stuck under $1.00.
3. Technical Analysis
Trend: Bearish
Price is well below its major moving averages. The nearest moving average is close to $1.13 and the longer-term average remains above $1.30. That means every rally has to fight through overhead supply.
Momentum: Deeply Oversold, Starting to Turn
14-day RSI reads 26.35 after rebounding from a low near 17, its deepest oversold reading on the chart, and sits 3.39 points below its signal line at 29.74.
RSI < 30 = oversold. This often leads to a bounce, but in a strong downtrend it can stay oversold for a while. It does NOT mean the bottom is in.
Key Levels
| Type | Level | Why it matters |
| --- | --- | --- |
| Strong Support | $0.89 - $0.90 | Recent crash low, Nov 2024 levels. Break below opens $0.77-$0.87 |
| Support 1 | $0.9383 - $0.9483 | Nearest support, ∼3% below current price |
| Support 2 | $0.9031 | Consolidation floor for next 2-3 days |
| Resistance 1 | $0.9597 - $0.9971 | Ichimoku Kijun + first resistance. Must clear to hold bounce |
| Psychological Resistance | $1.00 | The big round number. Losing it was bearish, reclaiming it is bullish |
| Resistance 2 | $1.10 - $1.13 | 20-day EMA. First major level a real rebound must clear |
| Resistance 3 | $1.24 - $1.40 | 30-day high zone + previous breakdown zone |
Immediate outlook from analysts: Consolidation expected between $0.9031 and $0.9985 over the next 2-3 trading days, with Kijun at $0.9613 acting as immediate resistance.
First resistance is $0.9971 (+2.8%), first support $0.9383 (-3.3%).
4. Fundamental Analysis - Why Long-Term Is Different From Price
Bullish Fundamentals
1. Regulatory Clarity - Solved
On 17 March 2026, the SEC and CFTC jointly classified XRP as a digital commodity, placing it on the same legal footing as Bitcoin and Ethereum. This removes the key legal barrier that kept institutions away for years.
2. Spot XRP ETFs Are Live
Six spot XRP ETFs are now live in the U.S., with expense ratios from 0.19% to 0.75%. Funds include Bitwise, Grayscale, Franklin Templeton, 21Shares, Canary, and REX-Osprey. First spot ETFs cleared in November 2025 after the SEC ended its case against Ripple.
3. ETF Options Expansion
In Sept 2026, Canadian Derivatives Clearing Corporation registered options on the Evolve XRP ETF and Purpose XRP ETF for sale in the US. This adds hedging tools for institutions.
4. Ripple's Real Use Case
XRP Ledger is built for fast, cheap cross-border payments - a real utility narrative vs. pure meme coins.
Bearish Fundamentals
1. ETF Flows Are Negative Right Now
The recent crash was driven by outflows from crypto ETFs. Even with ETFs approved, inflows have stalled.
2. No Recovery Catalyst
Analysts note XRP is near $61B market cap but "lacks recovery catalyst" despite the regulatory wins.
3. Supply Overhang
∼36B XRP still not in circulation (held by Ripple escrow / company). Unlocks create constant selling pressure fear.
4. Crypto Market-Wide Weakness
Bitcoin and altcoins are also falling, stablecoin market is shrinking - XRP is not falling alone.
5. Scenarios - What to Watch
🟢 Bullish Scenario (30% probability short-term)
Trigger: Daily close back above $1.00, then above $1.10
Target: $1.13 -> $1.24 -> $1.40
November projection targets $1.04, within range $0.89 to $1.13. Upside target is $1.24, 15.9% above $1.07, once XRP closes above $1.10 and ETF flows turn positive.
🟡 Base / Sideways Scenario (45% probability)
Range: $0.90 - $1.00
XRP consolidates, builds a base, RSI recovers from oversold. This is the "continued struggle near the bottom of the 52-week range" base case.
🔴 Bearish Scenario (25% probability)
Trigger: Lose $0.89 on a daily close with high volume
Target: $0.77 - $0.87
Longer-term chart projections identify a lower potential support range between $0.77 and $0.87. Some analysts warn losing $0.99 could expose XRP to further losses toward $0.80. EGRAG identifies $0.75 to $0.85 as a major support zone.
Ignore extreme long-term hype targets like $31.64 Fibonacci extensions circulating on social media - those require a full new bull cycle and massive adoption, not a short-term trade.
6. Key Dates Ahead
30 Nov 2026: GraniteShares leveraged XRP ETFs (3x Long / 3x Short) new effective date after delay from Oct 26 filing. Leveraged products increase volatility, not necessarily price.
Late Nov: Watch for spot ETF weekly flow data - if inflows return, that's the first real bullish signal.
7. Strategy Summary (Not Advice)
For Traders:
Do NOT chase the bounce under $1.00
Bullish confirmation = close above $1.00 + hold it for 2 days
Bearish confirmation = close below $0.89
Stop-loss logic for longs is typically just below $0.89
For Long-Term Holders / DCA:
Current zone $0.89 - $1.00 is historically a value zone (Nov 2024 levels)
Risk is still high: YTD -48% shows trend is down
Fundamentals (commodity status + ETFs) are best ever, price is worst in 2 years - that divergence is why many long-term holders are accumulating cautiously, not all-in
Risk Score: 41/100 - moderate-high risk environment.
#XRPPredictions #Xrp🔥🔥 #XRPUSDT #Ripple #CryptoNews #WhaleAlert #BinanceUpdates #MarketVolatility
365

·
--
Three key levels to understand its current structure
The price action of $XRP often triggers rapid moves when overall liquidity in the crypto market increases or news emerges about its payments ecosystem. Before rushing into trades, it’s worth patiently analyzing the price structure:
Support zones: identifying the levels where the price has previously rejected declines helps gauge buyer strength and avoid chasing momentum.
Volume confirmation: a breakout or bounce without volume often indicates a lack of institutional interest or short-term speculative buying.
Relationship with $BTC: when the leading cryptocurrency consolidates, altcoins like $XRP tend to show greater volatility, making it essential to adjust risk management.
What strategy or level are you monitoring today for $XRP ?
#xrp
#XRPRealityCheck
#XRPPredictions
{spot}(XRPUSDT)
Three key levels to understand its current structure
The price action of $XRP often triggers rapid moves when overall liquidity in the crypto market increases or news emerges about its payments ecosystem. Before rushing into trades, it’s worth patiently analyzing the price structure:
Support zones: identifying the levels where the price has previously rejected declines helps gauge buyer strength and avoid chasing momentum.
Volume confirmation: a breakout or bounce without volume often indicates a lack of institutional interest or short-term speculative buying.
Relationship with $BTC: when the leading cryptocurrency consolidates, altcoins like $XRP tend to show greater volatility, making it essential to adjust risk management.
What strategy or level are you monitoring today for $XRP ?
#xrp
#XRPRealityCheck
#XRPPredictions
The price action of $XRP often triggers rapid moves when overall liquidity in the crypto market increases or news emerges about its payments ecosystem. Before rushing into trades, it’s worth patiently analyzing the price structure:
Support zones: identifying the levels where the price has previously rejected declines helps gauge buyer strength and avoid chasing momentum.
Volume confirmation: a breakout or bounce without volume often indicates a lack of institutional interest or short-term speculative buying.
Relationship with $BTC: when the leading cryptocurrency consolidates, altcoins like $XRP tend to show greater volatility, making it essential to adjust risk management.
What strategy or level are you monitoring today for $XRP ?
#xrp
#XRPRealityCheck
#XRPPredictions
1
138
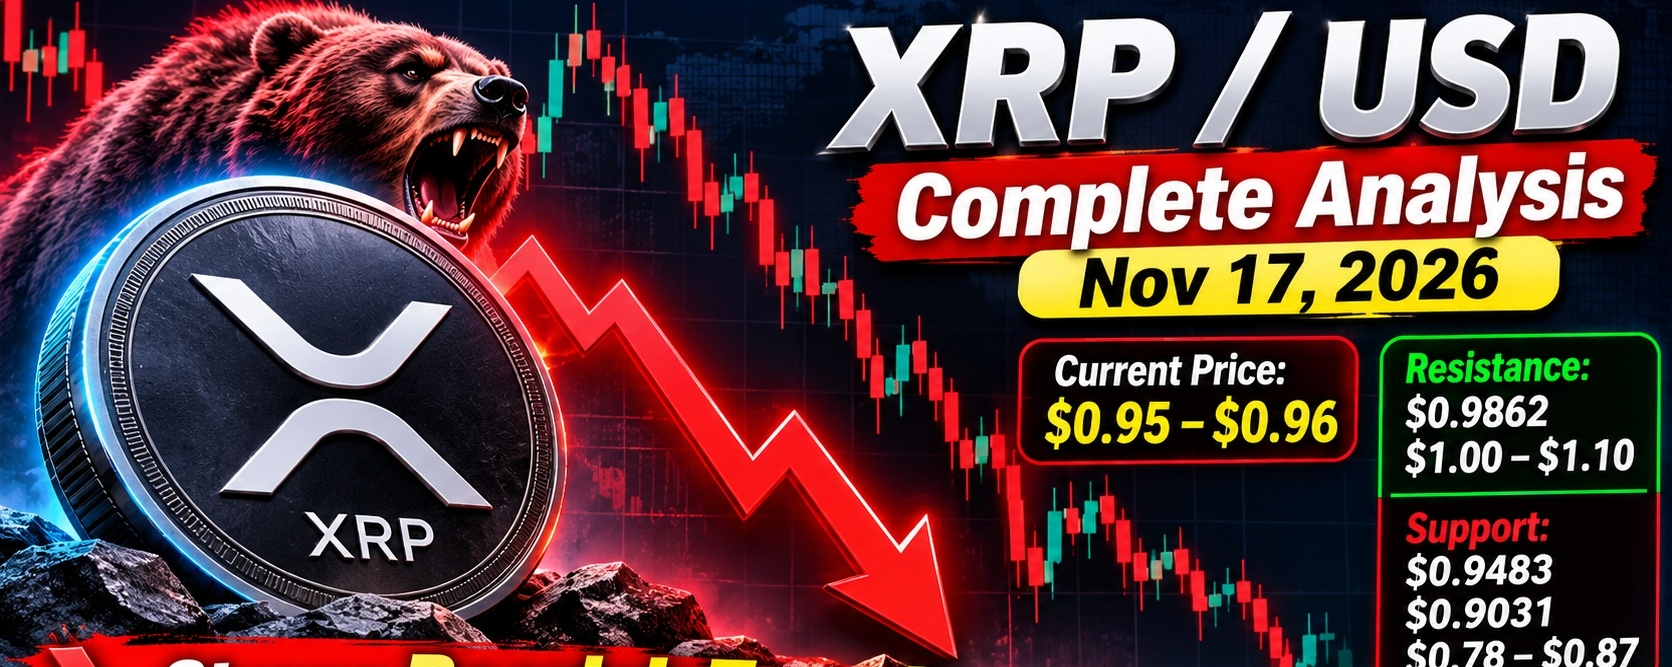
Article
Here is complete XRP/USD analysis for today, Nov 17, 2026Here is complete $XRP /USD analysis for today, Nov 17, 2026
1. Current Price Snapshot
Price right now: $0.95 - $0.96 range
Latest Binance quote: $0.9537 USDT as of 2026-11-17 01:28 UTC
Day range: $0.9424 Low to $0.9769 High
24h volume: ∼$3.8B across 44 exchanges
Market cap: ∼$60.96B
Cheapest exchange: Bitstamp $0.9523, dearest HTX $0.9536 - only 0.14% spread
{future}(XRPUSDT)
Performance context:
5-day: -9.89% | 1-month: -26.72% | YTD: -49.56% | 1-year: -56.17%
This is one of $XRP 's worst Novembers ever: down 19.2% in Nov 2026 vs historical average +78.3%
XRP hit lowest since Nov 2024 this weekend due to ETF outflows
2. Technical Analysis
Trend: Strong Bearish
Trading at $0.95, well beneath 50, 100, and 200-day EMAs clustered $1.23 - $1.33
Trades below key moving averages with strong downside pressure
Short-term signal: Sell (4,853 days of history model)
Fear & Greed: 10 - Extreme Fear, AI signal Bearish 67%
Momentum:
14-day RSI: 26.35 after bouncing from ∼17, deepest oversold reading - another source has RSI 26.5
Sits 3.39 points below its signal line = still deteriorating
Key Levels:
Immediate Support: $0.9483 (-0.8% from now), then $0.9031 - $0.9074, then $0.8925
Resistance: $0.9862 nearest, then $0.9985 - $1.0118
If $0.9031 breaks, analysts see $0.77 - $0.87 and specifically $0.78 as potential bottom
3. What Is Driving It?
Bearish drivers right now:
ETF outflows: US spot $XRP ETFs posted zero net flows Nov 3-6, net assets down to $1.34B, deepening liquidity concerns
Stablecoin market cap shrinking affecting majors
Retail exiting: retail investors still exiting per FXStreet analysis
Bitcoin correlation: Analyst warning if BTC drops below $60k, XRP could push under $0.90
4. Forecast Scenarios
November 2026:
CoinDCX range: $0.89 low / $1.13 high / $1.04 avg - Recovery Target
Other model: $0.9074 to $1.0118 next few days
Bear Case:
Analysts CrediBULL Crypto target $0.60-$0.90 zone
25% crash risk to $0.77 flagged on historical bearish charts
Ali Martinez: $0.78 bottom before any rally
Bull Case:
EGRAG Crypto sees shakeout near $1 then Fib extension rally up to $31.64 long-term
Weekly ascending triangle since 2017 - if $0.78 holds, target is triangle resistance ∼$3.00-$3.50
Model year-end: $0.7531-$1.11, 2027: $0.6274-$1.37, 2030: $0.5822-$2.64
5. Trading Plan (Not Financial Advice)
If you are holding:
$0.9031 is the line in the sand. Daily close below it increases probability of $0.80-$0.87.
Extreme oversold (RSI ∼26) often bounces, but in strong downtrend bounces have failed - $0.9664 bounce +4% still down 14.1% weekly.
If you are looking to buy:
Aggressive: scale near $0.9483 / $0.9031 with tight stop
Conservative: wait for reclaim of $0.9985-$1.10 and 20-day MA. A close above $1.10 opens $1.24 (15.9% move)
Want me to set up a daily XRP price alert at $0.90 support / $1.00 resistance for you, or do a deeper on-chain / whale wallet analysis?
#XRPPredictions #Xrp🔥🔥 #XRPUpdate #XRPAnalysis #TrendingTopic
Here is complete XRP/USD analysis for today, Nov 17, 2026
Here is complete $XRP /USD analysis for today, Nov 17, 2026
1. Current Price Snapshot
Price right now: $0.95 - $0.96 range
Latest Binance quote: $0.9537 USDT as of 2026-11-17 01:28 UTC
Day range: $0.9424 Low to $0.9769 High
24h volume: ∼$3.8B across 44 exchanges
Market cap: ∼$60.96B
Cheapest exchange: Bitstamp $0.9523, dearest HTX $0.9536 - only 0.14% spread
Performance context:
5-day: -9.89% | 1-month: -26.72% | YTD: -49.56% | 1-year: -56.17%
This is one of $XRP 's worst Novembers ever: down 19.2% in Nov 2026 vs historical average +78.3%
XRP hit lowest since Nov 2024 this weekend due to ETF outflows
2. Technical Analysis
Trend: Strong Bearish
Trading at $0.95, well beneath 50, 100, and 200-day EMAs clustered $1.23 - $1.33
Trades below key moving averages with strong downside pressure
Short-term signal: Sell (4,853 days of history model)
Fear & Greed: 10 - Extreme Fear, AI signal Bearish 67%
Momentum:
14-day RSI: 26.35 after bouncing from ∼17, deepest oversold reading - another source has RSI 26.5
Sits 3.39 points below its signal line = still deteriorating
Key Levels:
Immediate Support: $0.9483 (-0.8% from now), then $0.9031 - $0.9074, then $0.8925
Resistance: $0.9862 nearest, then $0.9985 - $1.0118
If $0.9031 breaks, analysts see $0.77 - $0.87 and specifically $0.78 as potential bottom
3. What Is Driving It?
Bearish drivers right now:
ETF outflows: US spot $XRP ETFs posted zero net flows Nov 3-6, net assets down to $1.34B, deepening liquidity concerns
Stablecoin market cap shrinking affecting majors
Retail exiting: retail investors still exiting per FXStreet analysis
Bitcoin correlation: Analyst warning if BTC drops below $60k, XRP could push under $0.90
4. Forecast Scenarios
November 2026:
CoinDCX range: $0.89 low / $1.13 high / $1.04 avg - Recovery Target
Other model: $0.9074 to $1.0118 next few days
Bear Case:
Analysts CrediBULL Crypto target $0.60-$0.90 zone
25% crash risk to $0.77 flagged on historical bearish charts
Ali Martinez: $0.78 bottom before any rally
Bull Case:
EGRAG Crypto sees shakeout near $1 then Fib extension rally up to $31.64 long-term
Weekly ascending triangle since 2017 - if $0.78 holds, target is triangle resistance ∼$3.00-$3.50
Model year-end: $0.7531-$1.11, 2027: $0.6274-$1.37, 2030: $0.5822-$2.64
5. Trading Plan (Not Financial Advice)
If you are holding:
$0.9031 is the line in the sand. Daily close below it increases probability of $0.80-$0.87.
Extreme oversold (RSI ∼26) often bounces, but in strong downtrend bounces have failed - $0.9664 bounce +4% still down 14.1% weekly.
If you are looking to buy:
Aggressive: scale near $0.9483 / $0.9031 with tight stop
Conservative: wait for reclaim of $0.9985-$1.10 and 20-day MA. A close above $1.10 opens $1.24 (15.9% move)
Want me to set up a daily XRP price alert at $0.90 support / $1.00 resistance for you, or do a deeper on-chain / whale wallet analysis?
#XRPPredictions #Xrp🔥🔥 #XRPUpdate #XRPAnalysis #TrendingTopic
1. Current Price Snapshot
Price right now: $0.95 - $0.96 range
Latest Binance quote: $0.9537 USDT as of 2026-11-17 01:28 UTC
Day range: $0.9424 Low to $0.9769 High
24h volume: ∼$3.8B across 44 exchanges
Market cap: ∼$60.96B
Cheapest exchange: Bitstamp $0.9523, dearest HTX $0.9536 - only 0.14% spread
Performance context:
5-day: -9.89% | 1-month: -26.72% | YTD: -49.56% | 1-year: -56.17%
This is one of $XRP 's worst Novembers ever: down 19.2% in Nov 2026 vs historical average +78.3%
XRP hit lowest since Nov 2024 this weekend due to ETF outflows
2. Technical Analysis
Trend: Strong Bearish
Trading at $0.95, well beneath 50, 100, and 200-day EMAs clustered $1.23 - $1.33
Trades below key moving averages with strong downside pressure
Short-term signal: Sell (4,853 days of history model)
Fear & Greed: 10 - Extreme Fear, AI signal Bearish 67%
Momentum:
14-day RSI: 26.35 after bouncing from ∼17, deepest oversold reading - another source has RSI 26.5
Sits 3.39 points below its signal line = still deteriorating
Key Levels:
Immediate Support: $0.9483 (-0.8% from now), then $0.9031 - $0.9074, then $0.8925
Resistance: $0.9862 nearest, then $0.9985 - $1.0118
If $0.9031 breaks, analysts see $0.77 - $0.87 and specifically $0.78 as potential bottom
3. What Is Driving It?
Bearish drivers right now:
ETF outflows: US spot $XRP ETFs posted zero net flows Nov 3-6, net assets down to $1.34B, deepening liquidity concerns
Stablecoin market cap shrinking affecting majors
Retail exiting: retail investors still exiting per FXStreet analysis
Bitcoin correlation: Analyst warning if BTC drops below $60k, XRP could push under $0.90
4. Forecast Scenarios
November 2026:
CoinDCX range: $0.89 low / $1.13 high / $1.04 avg - Recovery Target
Other model: $0.9074 to $1.0118 next few days
Bear Case:
Analysts CrediBULL Crypto target $0.60-$0.90 zone
25% crash risk to $0.77 flagged on historical bearish charts
Ali Martinez: $0.78 bottom before any rally
Bull Case:
EGRAG Crypto sees shakeout near $1 then Fib extension rally up to $31.64 long-term
Weekly ascending triangle since 2017 - if $0.78 holds, target is triangle resistance ∼$3.00-$3.50
Model year-end: $0.7531-$1.11, 2027: $0.6274-$1.37, 2030: $0.5822-$2.64
5. Trading Plan (Not Financial Advice)
If you are holding:
$0.9031 is the line in the sand. Daily close below it increases probability of $0.80-$0.87.
Extreme oversold (RSI ∼26) often bounces, but in strong downtrend bounces have failed - $0.9664 bounce +4% still down 14.1% weekly.
If you are looking to buy:
Aggressive: scale near $0.9483 / $0.9031 with tight stop
Conservative: wait for reclaim of $0.9985-$1.10 and 20-day MA. A close above $1.10 opens $1.24 (15.9% move)
Want me to set up a daily XRP price alert at $0.90 support / $1.00 resistance for you, or do a deeper on-chain / whale wallet analysis?
#XRPPredictions #Xrp🔥🔥 #XRPUpdate #XRPAnalysis #TrendingTopic
ghjkgff:
Rapaz esse lixo só vai começar a ficar bom pra não cair pra R$0,10
3
18
18.9k

·
--
Bullish
{spot}(XRPUSDT)
#XRPPredictions $XRP
The chart is showing a major recovery with firm support. Remember, it’s explosive; within a few hours, we could be seeing a massive recovery across the entire ecosystem and stable prices above 1.05
#XRPPredictions $XRP
The chart is showing a major recovery with firm support. Remember, it’s explosive; within a few hours, we could be seeing a massive recovery across the entire ecosystem and stable prices above 1.05
The chart is showing a major recovery with firm support. Remember, it’s explosive; within a few hours, we could be seeing a massive recovery across the entire ecosystem and stable prices above 1.05
57

·
--
When $XRP
{spot}(XRPUSDT)
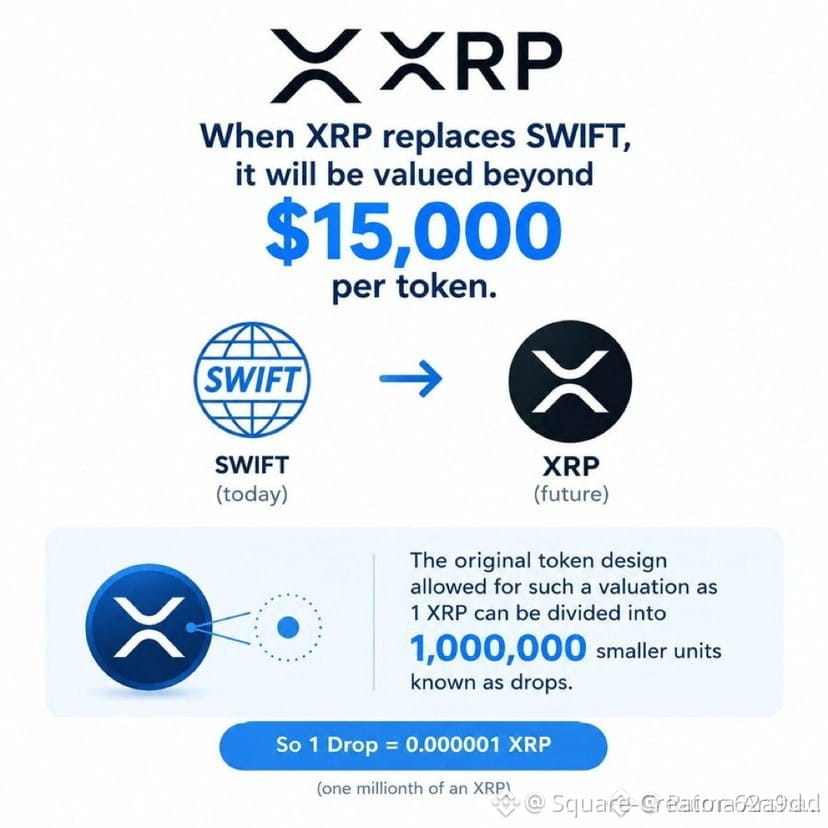
replaces Swift, its value will exceed $15,000 per token.
This valuation was enabled in the token's original design, as 1 #xrp can be divided into 1,000,000 smaller units known as drops.
So, 1 drop = 0.000001 $XRP
(one-millionth of XRP)
#XRPPredictions
When $XRP
replaces Swift, its value will exceed $15,000 per token.
This valuation was enabled in the token's original design, as 1 #xrp can be divided into 1,000,000 smaller units known as drops.
So, 1 drop = 0.000001 $XRP
(one-millionth of XRP)
#XRPPredictions
replaces Swift, its value will exceed $15,000 per token.
This valuation was enabled in the token's original design, as 1 #xrp can be divided into 1,000,000 smaller units known as drops.
So, 1 drop = 0.000001 $XRP
(one-millionth of XRP)
#XRPPredictions
23


Article
WILL XRP EVER TOUCH $3 AGAIN, OR WAS THAT OUR LAST CHANCE? 😔🚀Many XRP holders are tired of watching their investment move in the wrong direction. The excitement around $3 has turned into fear, uncertainty and one big question:
Can $XRP really recover, or are we waiting for a rally that may never come?
{spot}(XRPUSDT)
Let's look beyond the hype.
1. The $3 target isn't impossible, but it's not easy.
With XRP trading around $0.95, reaching $3 would require an increase of approximately 216%.
That would put its market capitalization near $190 billion, assuming circulating supply stays similar.
This is a significant target. It would require substantial new capital, stronger demand and a much healthier crypto market.
2. Three things could change XRP's direction.
ETF demand: Institutional interest is important, but recent ETF outflows show that demand isn't consistently strong.
Technical recovery: XRP needs to reclaim $1 and break through resistance around $1.26–$1.30. An oversold RSI alone doesn't confirm a reversal.
Bitcoin's direction: If Bitcoin stabilizes and money returns to altcoins, XRP could benefit. Another major market decline could delay its recovery.
3. My personal market outlook
I see three possible outcomes:
Bullish: XRP reclaims important resistance levels and eventually challenges $2–$3.
Neutral: XRP consolidates while investors wait for stronger signals.
Bearish: Continued selling pressure pushes XRP toward lower support levels.
Personally, I wouldn't call XRP finished, but I also wouldn't promise anyone a $3 recovery.
The market needs to prove its strength before that target becomes realistic.
ONE QUESTION FOR EVERY XRP HOLDER 👇
If XRP reaches $3 again, will you finally sell and recover your investment, or will you hold for $5?
Are we witnessing the beginning of another opportunity, or are we still holding on to an old dream?
Market analysis, not financial advice.
#cryptouniverseofficial #XRPPredictions #XRPFallsTo$0.89LowestSinceNovember2024 #BitcoinExtendsLosingStreakToSixWeeks #A Packed Week of Earnings and Data Tests Markets
WILL XRP EVER TOUCH $3 AGAIN, OR WAS THAT OUR LAST CHANCE? 😔🚀
Many XRP holders are tired of watching their investment move in the wrong direction. The excitement around $3 has turned into fear, uncertainty and one big question:
Can $XRP really recover, or are we waiting for a rally that may never come?
Let's look beyond the hype.
1. The $3 target isn't impossible, but it's not easy.
With XRP trading around $0.95, reaching $3 would require an increase of approximately 216%.
That would put its market capitalization near $190 billion, assuming circulating supply stays similar.
This is a significant target. It would require substantial new capital, stronger demand and a much healthier crypto market.
2. Three things could change XRP's direction.
ETF demand: Institutional interest is important, but recent ETF outflows show that demand isn't consistently strong.
Technical recovery: XRP needs to reclaim $1 and break through resistance around $1.26–$1.30. An oversold RSI alone doesn't confirm a reversal.
Bitcoin's direction: If Bitcoin stabilizes and money returns to altcoins, XRP could benefit. Another major market decline could delay its recovery.
3. My personal market outlook
I see three possible outcomes:
Bullish: XRP reclaims important resistance levels and eventually challenges $2–$3.
Neutral: XRP consolidates while investors wait for stronger signals.
Bearish: Continued selling pressure pushes XRP toward lower support levels.
Personally, I wouldn't call XRP finished, but I also wouldn't promise anyone a $3 recovery.
The market needs to prove its strength before that target becomes realistic.
ONE QUESTION FOR EVERY XRP HOLDER 👇
If XRP reaches $3 again, will you finally sell and recover your investment, or will you hold for $5?
Are we witnessing the beginning of another opportunity, or are we still holding on to an old dream?
Market analysis, not financial advice.
#cryptouniverseofficial #XRPPredictions #XRPFallsTo$0.89LowestSinceNovember2024 #BitcoinExtendsLosingStreakToSixWeeks #A Packed Week of Earnings and Data Tests Markets
Can $XRP really recover, or are we waiting for a rally that may never come?
Let's look beyond the hype.
1. The $3 target isn't impossible, but it's not easy.
With XRP trading around $0.95, reaching $3 would require an increase of approximately 216%.
That would put its market capitalization near $190 billion, assuming circulating supply stays similar.
This is a significant target. It would require substantial new capital, stronger demand and a much healthier crypto market.
2. Three things could change XRP's direction.
ETF demand: Institutional interest is important, but recent ETF outflows show that demand isn't consistently strong.
Technical recovery: XRP needs to reclaim $1 and break through resistance around $1.26–$1.30. An oversold RSI alone doesn't confirm a reversal.
Bitcoin's direction: If Bitcoin stabilizes and money returns to altcoins, XRP could benefit. Another major market decline could delay its recovery.
3. My personal market outlook
I see three possible outcomes:
Bullish: XRP reclaims important resistance levels and eventually challenges $2–$3.
Neutral: XRP consolidates while investors wait for stronger signals.
Bearish: Continued selling pressure pushes XRP toward lower support levels.
Personally, I wouldn't call XRP finished, but I also wouldn't promise anyone a $3 recovery.
The market needs to prove its strength before that target becomes realistic.
ONE QUESTION FOR EVERY XRP HOLDER 👇
If XRP reaches $3 again, will you finally sell and recover your investment, or will you hold for $5?
Are we witnessing the beginning of another opportunity, or are we still holding on to an old dream?
Market analysis, not financial advice.
#cryptouniverseofficial #XRPPredictions #XRPFallsTo$0.89LowestSinceNovember2024 #BitcoinExtendsLosingStreakToSixWeeks #A Packed Week of Earnings and Data Tests Markets
1
210

·
--
🚨 THIS IS WHAT THE XRP FUTURE COULD LOOK LIKE! 👀🔥
2026: 589 XRP
2028: 21 XRP
2030: 67 XRP
Three different years. Three different numbers. But ONE BIG QUESTION:
Are we watching the early stages of something the world isn’t prepared for?
Imagine looking back at today’s XRP prices in 2030 and realizing you had an opportunity to position yourself before mainstream adoption took off.
#XRPRealityCheck #Xrp🔥🔥 #XRPRealityCheck #XRPPredictions #XRPUSDT🚨
$XRP
{spot}(XRPUSDT)
🚨 THIS IS WHAT THE XRP FUTURE COULD LOOK LIKE! 👀🔥
2026: 589 XRP
2028: 21 XRP
2030: 67 XRP
Three different years. Three different numbers. But ONE BIG QUESTION:
Are we watching the early stages of something the world isn’t prepared for?
Imagine looking back at today’s XRP prices in 2030 and realizing you had an opportunity to position yourself before mainstream adoption took off.
#XRPRealityCheck #Xrp🔥🔥 #XRPRealityCheck #XRPPredictions #XRPUSDT🚨
$XRP
2026: 589 XRP
2028: 21 XRP
2030: 67 XRP
Three different years. Three different numbers. But ONE BIG QUESTION:
Are we watching the early stages of something the world isn’t prepared for?
Imagine looking back at today’s XRP prices in 2030 and realizing you had an opportunity to position yourself before mainstream adoption took off.
#XRPRealityCheck #Xrp🔥🔥 #XRPRealityCheck #XRPPredictions #XRPUSDT🚨
$XRP

1
86

·
--
#XRPRealityCheck #XRPPredictions
XRP/USDT is trading around $0.97, about 26% below its Nov 4 close near $1.30. Here's November's daily trend:
After ten straight daily declines (Nov 5–14), XRP bounced about 5.6% on Nov 15. It had hit an intraday low near $0.89 on Nov 14.
Daily closes are XRP/USD from Yahoo Finance. USDT tracks the dollar closely, so the shape is the same. The last point (Nov 16) is the live quote.
I can also do a candlestick view or a longer time range if you'd like.
#XRPRealityCheck #XRPPredictions
XRP/USDT is trading around $0.97, about 26% below its Nov 4 close near $1.30. Here's November's daily trend:
After ten straight daily declines (Nov 5–14), XRP bounced about 5.6% on Nov 15. It had hit an intraday low near $0.89 on Nov 14.
Daily closes are XRP/USD from Yahoo Finance. USDT tracks the dollar closely, so the shape is the same. The last point (Nov 16) is the live quote.
I can also do a candlestick view or a longer time range if you'd like.
XRP/USDT is trading around $0.97, about 26% below its Nov 4 close near $1.30. Here's November's daily trend:
After ten straight daily declines (Nov 5–14), XRP bounced about 5.6% on Nov 15. It had hit an intraday low near $0.89 on Nov 14.
Daily closes are XRP/USD from Yahoo Finance. USDT tracks the dollar closely, so the shape is the same. The last point (Nov 16) is the live quote.
I can also do a candlestick view or a longer time range if you'd like.
315

·
--
Hey millionaire let's trade 👋
XRP/USDT — SHORT
$XRP
{spot}(XRPUSDT)
Entry Zone: 0.9555–0.9583
Stop Loss: 0.9880
Take Profit 1: 0.9336
Take Profit 2: 0.9181
Take Profit 3: 0.8948
Trade Management
Close 50% at TP1
Close 25% at TP2
Close final 25% at TP3
After TP1 is reached, move the stop-loss to your entry price.
Setup Rationale
XRP is trading below bearish EMA structures across multiple timeframes. On the daily chart, price remains below both the 50 EMA and 200 EMA, which keeps the broader trend tilted downward. This setup has moderate conviction only—use risk controls and keep exposure light#Xrp🔥🔥 #XRPPredictions .
Hey millionaire let's trade 👋
XRP/USDT — SHORT
$XRP
Entry Zone: 0.9555–0.9583
Stop Loss: 0.9880
Take Profit 1: 0.9336
Take Profit 2: 0.9181
Take Profit 3: 0.8948
Trade Management
Close 50% at TP1
Close 25% at TP2
Close final 25% at TP3
After TP1 is reached, move the stop-loss to your entry price.
Setup Rationale
XRP is trading below bearish EMA structures across multiple timeframes. On the daily chart, price remains below both the 50 EMA and 200 EMA, which keeps the broader trend tilted downward. This setup has moderate conviction only—use risk controls and keep exposure light#Xrp🔥🔥 #XRPPredictions .
XRP/USDT — SHORT
$XRP
Entry Zone: 0.9555–0.9583
Stop Loss: 0.9880
Take Profit 1: 0.9336
Take Profit 2: 0.9181
Take Profit 3: 0.8948
Trade Management
Close 50% at TP1
Close 25% at TP2
Close final 25% at TP3
After TP1 is reached, move the stop-loss to your entry price.
Setup Rationale
XRP is trading below bearish EMA structures across multiple timeframes. On the daily chart, price remains below both the 50 EMA and 200 EMA, which keeps the broader trend tilted downward. This setup has moderate conviction only—use risk controls and keep exposure light#Xrp🔥🔥 #XRPPredictions .
422

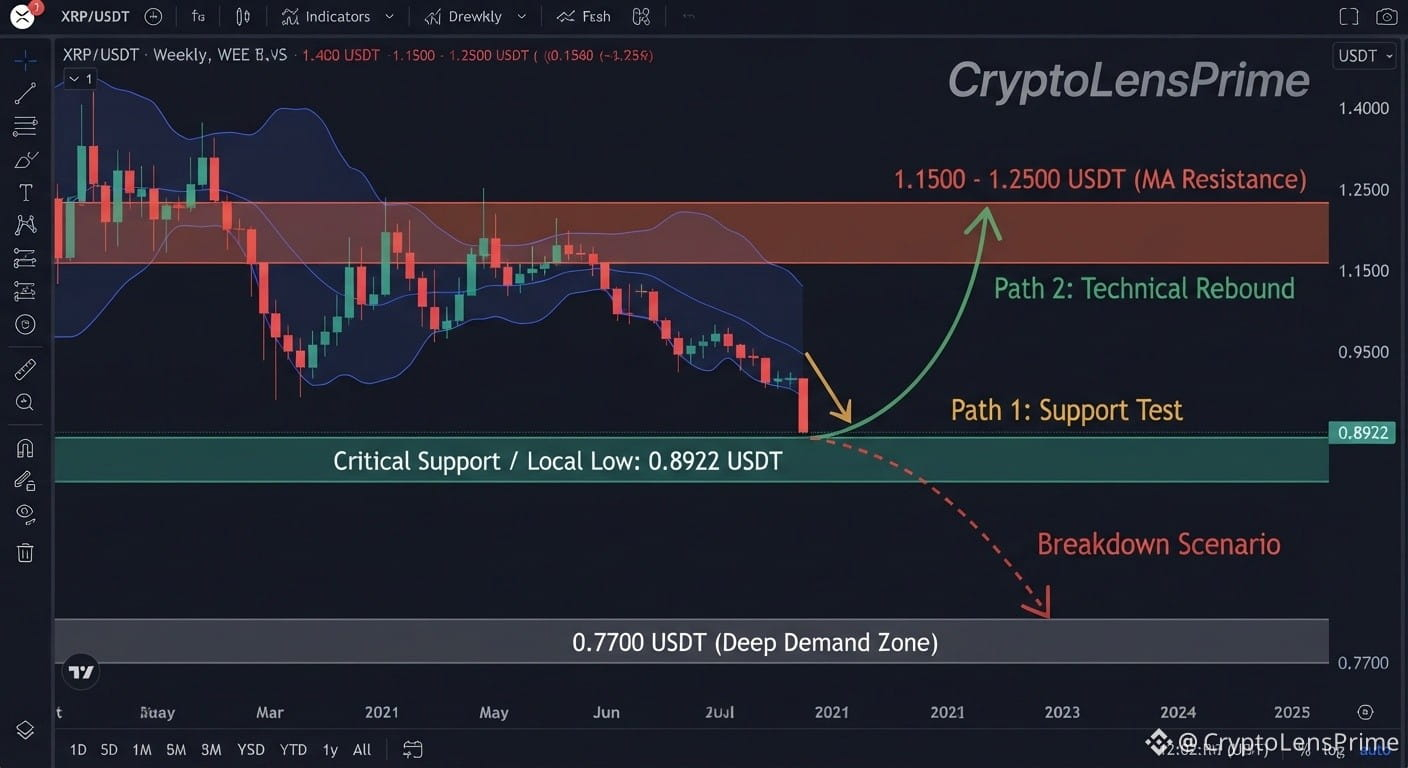
#xrp A drop to $0.540 represents a bearish scenario that would only occur with a complete structural collapse of the market and a break below all historical support levels.
Technically, however, the price is currently moving around $0.96, with liquidity concentrated and near-term targets between $1.00 and $1.08. Support levels at $0.93–$0.88 are protecting it.
For spot investing, a decline toward $0.50 (if it happens in the future) is not a cause for concern for a spot investor; rather, it would be considered a golden opportunity for long-term accumulation. However, it is not the most likely scenario at present. We follow a dollar-cost averaging (DCA) investment plan because the price may not fall, and the opportunity could pass.
Personally, I deal with investors by dividing the capital into 3 installments instead of entering with the full amount of liquidity all at once.$XRP #XRPPredictions
#xrp A drop to $0.540 represents a bearish scenario that would only occur with a complete structural collapse of the market and a break below all historical support levels.
Technically, however, the price is currently moving around $0.96, with liquidity concentrated and near-term targets between $1.00 and $1.08. Support levels at $0.93–$0.88 are protecting it.
For spot investing, a decline toward $0.50 (if it happens in the future) is not a cause for concern for a spot investor; rather, it would be considered a golden opportunity for long-term accumulation. However, it is not the most likely scenario at present. We follow a dollar-cost averaging (DCA) investment plan because the price may not fall, and the opportunity could pass.
Personally, I deal with investors by dividing the capital into 3 installments instead of entering with the full amount of liquidity all at once.$XRP #XRPPredictions
Technically, however, the price is currently moving around $0.96, with liquidity concentrated and near-term targets between $1.00 and $1.08. Support levels at $0.93–$0.88 are protecting it.
For spot investing, a decline toward $0.50 (if it happens in the future) is not a cause for concern for a spot investor; rather, it would be considered a golden opportunity for long-term accumulation. However, it is not the most likely scenario at present. We follow a dollar-cost averaging (DCA) investment plan because the price may not fall, and the opportunity could pass.
Personally, I deal with investors by dividing the capital into 3 installments instead of entering with the full amount of liquidity all at once.$XRP #XRPPredictions

Mohammed Alotaibi
·
--
Ma'am, I think it will reach 0.54, and this is where to buy.
4
292

·
--
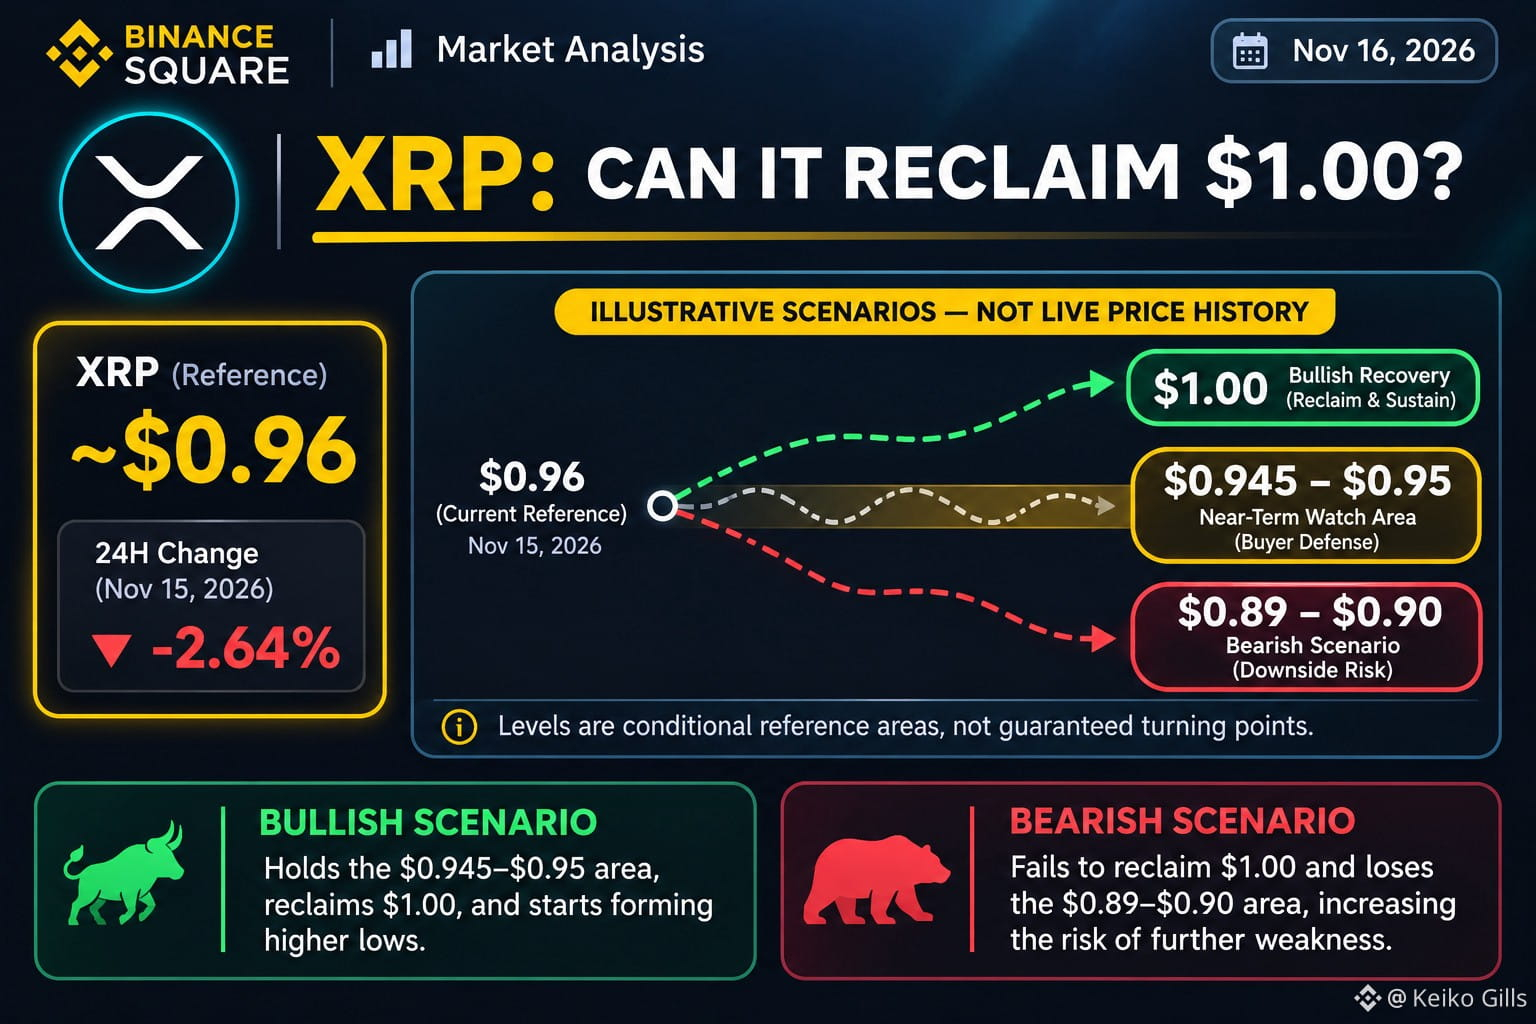
🚨 $XRP BELOW $1 — IS THIS A RECOVERY SETUP OR ANOTHER TRAP?
XRP has slipped below the psychological $1 level, and the next move could reveal whether buyers are ready to defend the market.
📊 LATEST VERIFIED SNAPSHOT
💰 XRP: ~$0.96
📉 24H Change: −2.64%
💥 Reported Long Liquidations: ~$43M
🏦 Weekly Spot Fund Outflows: ~$19M
🔍 WHAT'S DRIVING THE PRESSURE?
The broader crypto market is weakening.
Liquidations have added selling pressure, while fund outflows suggest reduced demand through investment products.
But here's the important part:
A price drop alone doesn't confirm further downside.
🎯 3 KEY AREAS TO WATCH
🟢 $0.99–$1.00 | Recovery Zone
A sustained reclaim, supported by stronger buying volume, could improve short-term momentum.
🟡 $0.945–$0.95 | Near-Term Defense
Watch whether buyers can stabilize price around this area.
🔴 $0.89–$0.90 | Downside Risk Zone
A confirmed breakdown could increase bearish pressure.
🐂 BULLISH SCENARIO
XRP holds its near-term defense area, recovers $1, and begins forming higher lows.
🐻 BEARISH SCENARIO
XRP fails to reclaim $1 and loses the $0.89–$0.90 area, increasing the risk of further weakness.
🧠 TRADING LESSON
Don't buy simply because a coin looks cheap.
Wait for confirmation.
Define your invalidation.
Risk only what your trading plan allows.
💬 WHAT'S YOUR XRP PLAN?
🚀 Reclaim $1.00?
📉 Retest $0.90?
⏳ Wait for confirmation?
👇 Share your next price target and reasoning.
🔖 Save this analysis to review the levels later.
#XRP #Ripple #BinanceSquare #CryptoAnalysis #Altcoins #CryptoTrading #RiskManagement
Not financial advice (NFA). Do your own research (DYOR).
#XRPRealityCheck #XRPGoal #XRPUSDT🚨
#XRPPredictions
{spot}(XRPUSDT)
🚨 $XRP BELOW $1 — IS THIS A RECOVERY SETUP OR ANOTHER TRAP?
XRP has slipped below the psychological $1 level, and the next move could reveal whether buyers are ready to defend the market.
📊 LATEST VERIFIED SNAPSHOT
💰 XRP: ~$0.96
📉 24H Change: −2.64%
💥 Reported Long Liquidations: ~$43M
🏦 Weekly Spot Fund Outflows: ~$19M
🔍 WHAT'S DRIVING THE PRESSURE?
The broader crypto market is weakening.
Liquidations have added selling pressure, while fund outflows suggest reduced demand through investment products.
But here's the important part:
A price drop alone doesn't confirm further downside.
🎯 3 KEY AREAS TO WATCH
🟢 $0.99–$1.00 | Recovery Zone
A sustained reclaim, supported by stronger buying volume, could improve short-term momentum.
🟡 $0.945–$0.95 | Near-Term Defense
Watch whether buyers can stabilize price around this area.
🔴 $0.89–$0.90 | Downside Risk Zone
A confirmed breakdown could increase bearish pressure.
🐂 BULLISH SCENARIO
XRP holds its near-term defense area, recovers $1, and begins forming higher lows.
🐻 BEARISH SCENARIO
XRP fails to reclaim $1 and loses the $0.89–$0.90 area, increasing the risk of further weakness.
🧠 TRADING LESSON
Don't buy simply because a coin looks cheap.
Wait for confirmation.
Define your invalidation.
Risk only what your trading plan allows.
💬 WHAT'S YOUR XRP PLAN?
🚀 Reclaim $1.00?
📉 Retest $0.90?
⏳ Wait for confirmation?
👇 Share your next price target and reasoning.
🔖 Save this analysis to review the levels later.
#XRP #Ripple #BinanceSquare #CryptoAnalysis #Altcoins #CryptoTrading #RiskManagement
Not financial advice (NFA). Do your own research (DYOR).
#XRPRealityCheck #XRPGoal #XRPUSDT🚨
#XRPPredictions
XRP has slipped below the psychological $1 level, and the next move could reveal whether buyers are ready to defend the market.
📊 LATEST VERIFIED SNAPSHOT
💰 XRP: ~$0.96
📉 24H Change: −2.64%
💥 Reported Long Liquidations: ~$43M
🏦 Weekly Spot Fund Outflows: ~$19M
🔍 WHAT'S DRIVING THE PRESSURE?
The broader crypto market is weakening.
Liquidations have added selling pressure, while fund outflows suggest reduced demand through investment products.
But here's the important part:
A price drop alone doesn't confirm further downside.
🎯 3 KEY AREAS TO WATCH
🟢 $0.99–$1.00 | Recovery Zone
A sustained reclaim, supported by stronger buying volume, could improve short-term momentum.
🟡 $0.945–$0.95 | Near-Term Defense
Watch whether buyers can stabilize price around this area.
🔴 $0.89–$0.90 | Downside Risk Zone
A confirmed breakdown could increase bearish pressure.
🐂 BULLISH SCENARIO
XRP holds its near-term defense area, recovers $1, and begins forming higher lows.
🐻 BEARISH SCENARIO
XRP fails to reclaim $1 and loses the $0.89–$0.90 area, increasing the risk of further weakness.
🧠 TRADING LESSON
Don't buy simply because a coin looks cheap.
Wait for confirmation.
Define your invalidation.
Risk only what your trading plan allows.
💬 WHAT'S YOUR XRP PLAN?
🚀 Reclaim $1.00?
📉 Retest $0.90?
⏳ Wait for confirmation?
👇 Share your next price target and reasoning.
🔖 Save this analysis to review the levels later.
#XRP #Ripple #BinanceSquare #CryptoAnalysis #Altcoins #CryptoTrading #RiskManagement
Not financial advice (NFA). Do your own research (DYOR).
#XRPRealityCheck #XRPGoal #XRPUSDT🚨
#XRPPredictions
2
251

·
--
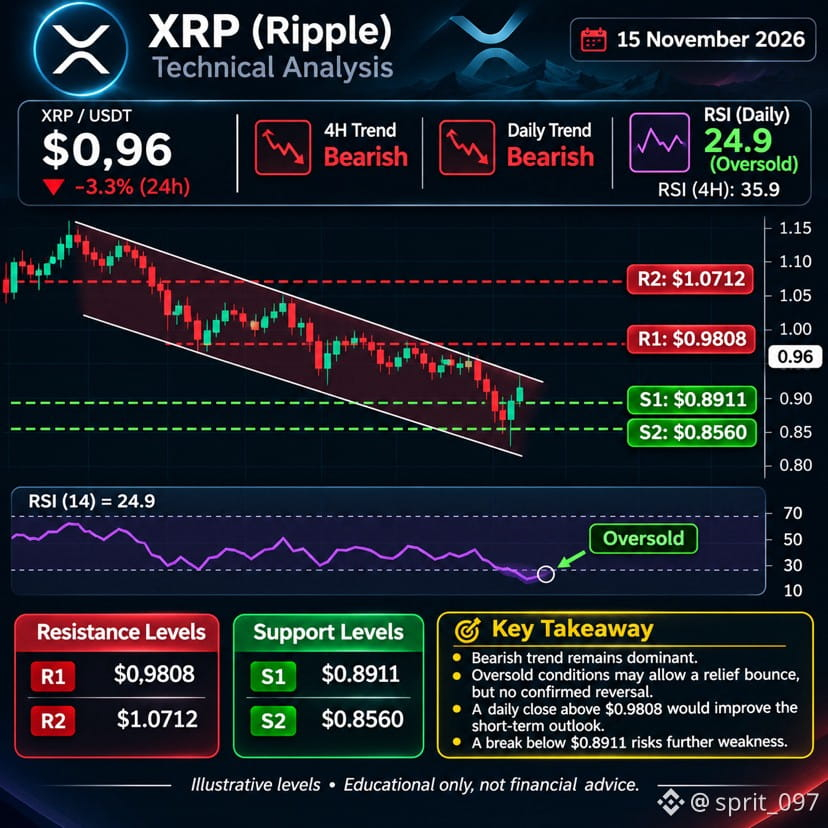
$XRP Below $0.8911: Further downside risk.
Above $0.9808: Short-term bullish improvement.
RSI 24.9: Oversold; bounce possible.
#xrp #XRPPredictions
{spot}(XRPUSDT)
$XRP Below $0.8911: Further downside risk.
Above $0.9808: Short-term bullish improvement.
RSI 24.9: Oversold; bounce possible.
#xrp #XRPPredictions
Above $0.9808: Short-term bullish improvement.
RSI 24.9: Oversold; bounce possible.
#xrp #XRPPredictions
85

·
--
Bullish
Verified
🚨 XRP ETF SHOCKWAVE: Biggest Weekly Outflow in 8 Months Raises Institutional Confidence Concerns
By Crypto Market Desk
US Spot XRP ETFs have just recorded their largest weekly outflow in eight months, signaling heightened caution among institutional
investors and triggering fresh debate about XRP's near-term outlook.
📊 Key Highlights
🔻 $19.13 Million
Total net outflows during the week ending November 13, 2026.
🔻 $10.42 Million
Largest single-day withdrawal recorded on November 9.
🔻 Below $1.00
XRP lost a major psychological support level, increasing bearish pressure.
🔻 $1.15 Billion
Total XRP ETF assets under management, down approximately 14% in one week.
🔻 2 Consecutive Weeks
Institutional ETF investors have now withdrawn funds for two straight weeks.
📉 Why Does It Matter?
ETF flows are often viewed as a key indicator of institutional sentiment. Sustained outflows can reflect risk-off behavior, profit-taking, or reduced confidence in short-term price performance.
While the recent withdrawals have raised concerns, market participants remain divided on whether this represents a broader trend or simply a temporary repositioning ahead of the next market move.
🎯 Key Levels To Watch
✅ Support Zone: $0.99
If XRP fails to hold this level, analysts are watching for a possible move toward $0.97.
✅ Recovery Zone: $1.09 – $1.11
A successful reclaim of this range could improve market sentiment and encourage buyers back into the market.
🔍 Market Outlook
Despite the recent ETF outflows, XRP remains one of the most closely watched digital assets in the market. The coming sessions could determine whether institutional capital returns or whether selling pressure continues to dominate.
The next major move may depend on whether XRP can regain momentum above key resistance or maintain critical support levels.
#usspotxrpetfsseelargestweeklyoutflowin8months $XRP #XRPPredictions #BinanceExplorers
Trade here 👇
🟥Future
{future}(XRPUSDT)
🟦Spot
{spot}(XRPUSDT)
🚨 XRP ETF SHOCKWAVE: Biggest Weekly Outflow in 8 Months Raises Institutional Confidence Concerns
By Crypto Market Desk
US Spot XRP ETFs have just recorded their largest weekly outflow in eight months, signaling heightened caution among institutional
investors and triggering fresh debate about XRP's near-term outlook.
📊 Key Highlights
🔻 $19.13 Million
Total net outflows during the week ending November 13, 2026.
🔻 $10.42 Million
Largest single-day withdrawal recorded on November 9.
🔻 Below $1.00
XRP lost a major psychological support level, increasing bearish pressure.
🔻 $1.15 Billion
Total XRP ETF assets under management, down approximately 14% in one week.
🔻 2 Consecutive Weeks
Institutional ETF investors have now withdrawn funds for two straight weeks.
📉 Why Does It Matter?
ETF flows are often viewed as a key indicator of institutional sentiment. Sustained outflows can reflect risk-off behavior, profit-taking, or reduced confidence in short-term price performance.
While the recent withdrawals have raised concerns, market participants remain divided on whether this represents a broader trend or simply a temporary repositioning ahead of the next market move.
🎯 Key Levels To Watch
✅ Support Zone: $0.99
If XRP fails to hold this level, analysts are watching for a possible move toward $0.97.
✅ Recovery Zone: $1.09 – $1.11
A successful reclaim of this range could improve market sentiment and encourage buyers back into the market.
🔍 Market Outlook
Despite the recent ETF outflows, XRP remains one of the most closely watched digital assets in the market. The coming sessions could determine whether institutional capital returns or whether selling pressure continues to dominate.
The next major move may depend on whether XRP can regain momentum above key resistance or maintain critical support levels.
#usspotxrpetfsseelargestweeklyoutflowin8months $XRP #XRPPredictions #BinanceExplorers
Trade here 👇
🟥Future
🟦Spot
By Crypto Market Desk
US Spot XRP ETFs have just recorded their largest weekly outflow in eight months, signaling heightened caution among institutional
investors and triggering fresh debate about XRP's near-term outlook.
📊 Key Highlights
🔻 $19.13 Million
Total net outflows during the week ending November 13, 2026.
🔻 $10.42 Million
Largest single-day withdrawal recorded on November 9.
🔻 Below $1.00
XRP lost a major psychological support level, increasing bearish pressure.
🔻 $1.15 Billion
Total XRP ETF assets under management, down approximately 14% in one week.
🔻 2 Consecutive Weeks
Institutional ETF investors have now withdrawn funds for two straight weeks.
📉 Why Does It Matter?
ETF flows are often viewed as a key indicator of institutional sentiment. Sustained outflows can reflect risk-off behavior, profit-taking, or reduced confidence in short-term price performance.
While the recent withdrawals have raised concerns, market participants remain divided on whether this represents a broader trend or simply a temporary repositioning ahead of the next market move.
🎯 Key Levels To Watch
✅ Support Zone: $0.99
If XRP fails to hold this level, analysts are watching for a possible move toward $0.97.
✅ Recovery Zone: $1.09 – $1.11
A successful reclaim of this range could improve market sentiment and encourage buyers back into the market.
🔍 Market Outlook
Despite the recent ETF outflows, XRP remains one of the most closely watched digital assets in the market. The coming sessions could determine whether institutional capital returns or whether selling pressure continues to dominate.
The next major move may depend on whether XRP can regain momentum above key resistance or maintain critical support levels.
#usspotxrpetfsseelargestweeklyoutflowin8months $XRP #XRPPredictions #BinanceExplorers
Trade here 👇
🟥Future
🟦Spot
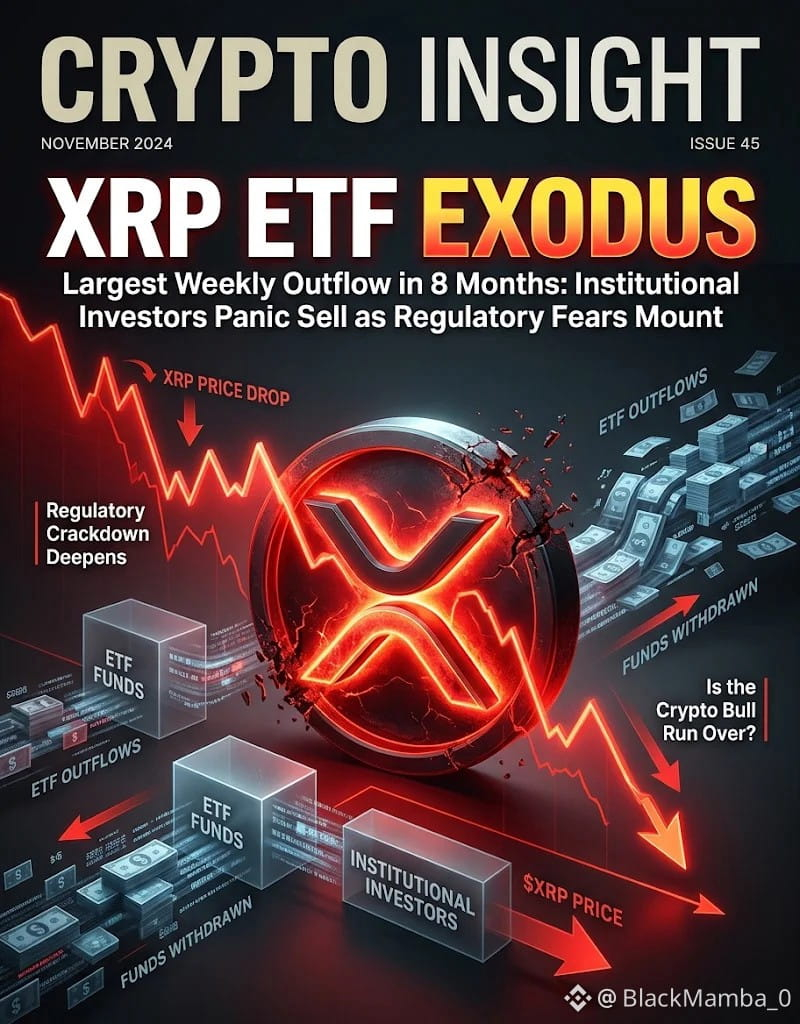
1.1k
·
--
Bearish
$XRP
(Ripple) Short Analysis - 14 Nov 2026*
*Price:* ∼$0.9524
*24h:* -7.14% | *7 Days:* ~-15% | *1 Month:* -25.43% | *From ATH:* -73% down ($3.55 - July 2025)
*What's happening?*
XRP just lost the big psychological level of *$1.00*. This is the worst part - once $1.00 breaks, retail panic selling starts. XRP is now falling faster than BTC and ETH because it's a higher-beta altcoin. Market cap is down to $62.3B, still ranked #6.
*Key Levels:*
- *Support:* $0.937 - This is the immediate last defence. If this breaks, next is $0.85 - $0.80
- *Resistance:* $0.987 - $1.03 - XRP needs to reclaim $1.00 and close above $1.03 to turn bullish again
- *Sentiment:* Very weak. Everyone is watching if $0.937 holds.
*My view:*
XRP is in danger zone. Don't buy just because it's "cheap below $1". If $0.937 breaks, it can drop quickly to $0.85. If $0.937 holds, a bounce back to $1.03 is possible. Wait for a daily close above $1.00 before thinking about buying.
Note:
This is not financial advice, just analysis.
{spot}(XRPUSDT)
#XRPUSDT🚨 #XRPPredictions #XrpAnalaysis🔥🔥🔥🔥
$XRP
(Ripple) Short Analysis - 14 Nov 2026*
*Price:* ∼$0.9524
*24h:* -7.14% | *7 Days:* ~-15% | *1 Month:* -25.43% | *From ATH:* -73% down ($3.55 - July 2025)
*What's happening?*
XRP just lost the big psychological level of *$1.00*. This is the worst part - once $1.00 breaks, retail panic selling starts. XRP is now falling faster than BTC and ETH because it's a higher-beta altcoin. Market cap is down to $62.3B, still ranked #6.
*Key Levels:*
- *Support:* $0.937 - This is the immediate last defence. If this breaks, next is $0.85 - $0.80
- *Resistance:* $0.987 - $1.03 - XRP needs to reclaim $1.00 and close above $1.03 to turn bullish again
- *Sentiment:* Very weak. Everyone is watching if $0.937 holds.
*My view:*
XRP is in danger zone. Don't buy just because it's "cheap below $1". If $0.937 breaks, it can drop quickly to $0.85. If $0.937 holds, a bounce back to $1.03 is possible. Wait for a daily close above $1.00 before thinking about buying.
Note:
This is not financial advice, just analysis.
#XRPUSDT🚨 #XRPPredictions #XrpAnalaysis🔥🔥🔥🔥
(Ripple) Short Analysis - 14 Nov 2026*
*Price:* ∼$0.9524
*24h:* -7.14% | *7 Days:* ~-15% | *1 Month:* -25.43% | *From ATH:* -73% down ($3.55 - July 2025)
*What's happening?*
XRP just lost the big psychological level of *$1.00*. This is the worst part - once $1.00 breaks, retail panic selling starts. XRP is now falling faster than BTC and ETH because it's a higher-beta altcoin. Market cap is down to $62.3B, still ranked #6.
*Key Levels:*
- *Support:* $0.937 - This is the immediate last defence. If this breaks, next is $0.85 - $0.80
- *Resistance:* $0.987 - $1.03 - XRP needs to reclaim $1.00 and close above $1.03 to turn bullish again
- *Sentiment:* Very weak. Everyone is watching if $0.937 holds.
*My view:*
XRP is in danger zone. Don't buy just because it's "cheap below $1". If $0.937 breaks, it can drop quickly to $0.85. If $0.937 holds, a bounce back to $1.03 is possible. Wait for a daily close above $1.00 before thinking about buying.
Note:
This is not financial advice, just analysis.
#XRPUSDT🚨 #XRPPredictions #XrpAnalaysis🔥🔥🔥🔥
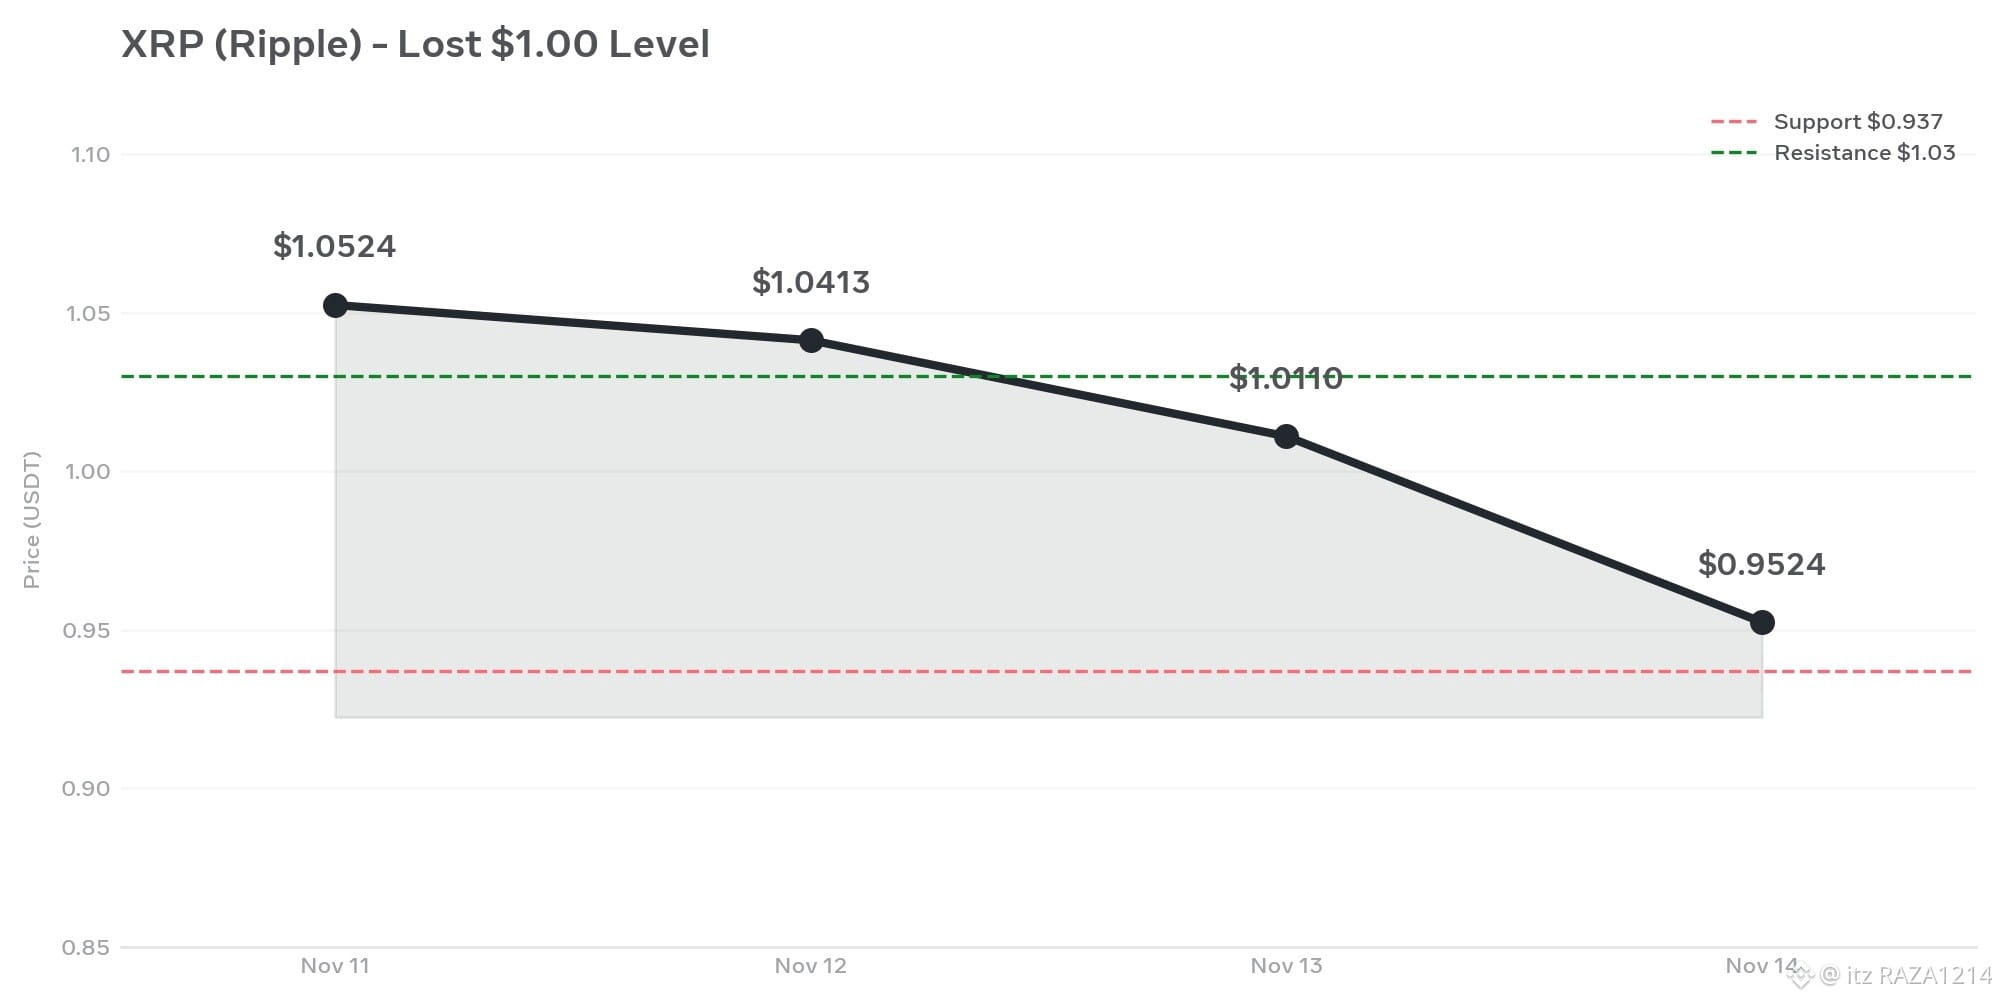
1
146
·
--
$XRP
Technical analysis:
Trend: Bearish.
RSI: 19.7 – Deep oversold.
Support 1: $0.992–$0.998
Support 2: $0.957
Resistance 1: $1.026–$1.044
Resistance 2: $1.053–$1.066
Trading scenarios:
Bearish: Break below $0.992 → possible move towards $0.957.
Bullish: Reclaim $1.044 → possible recovery towards $1.053–$1.066.
My view: Sellers are in control. Avoid aggressive longs until a bullish reversal is confirmed.
#XRPPredictions #xrp
{spot}(XRPUSDT)
$XRP
Technical analysis:
Trend: Bearish.
RSI: 19.7 – Deep oversold.
Support 1: $0.992–$0.998
Support 2: $0.957
Resistance 1: $1.026–$1.044
Resistance 2: $1.053–$1.066
Trading scenarios:
Bearish: Break below $0.992 → possible move towards $0.957.
Bullish: Reclaim $1.044 → possible recovery towards $1.053–$1.066.
My view: Sellers are in control. Avoid aggressive longs until a bullish reversal is confirmed.
#XRPPredictions #xrp
Technical analysis:
Trend: Bearish.
RSI: 19.7 – Deep oversold.
Support 1: $0.992–$0.998
Support 2: $0.957
Resistance 1: $1.026–$1.044
Resistance 2: $1.053–$1.066
Trading scenarios:
Bearish: Break below $0.992 → possible move towards $0.957.
Bullish: Reclaim $1.044 → possible recovery towards $1.053–$1.066.
My view: Sellers are in control. Avoid aggressive longs until a bullish reversal is confirmed.
#XRPPredictions #xrp
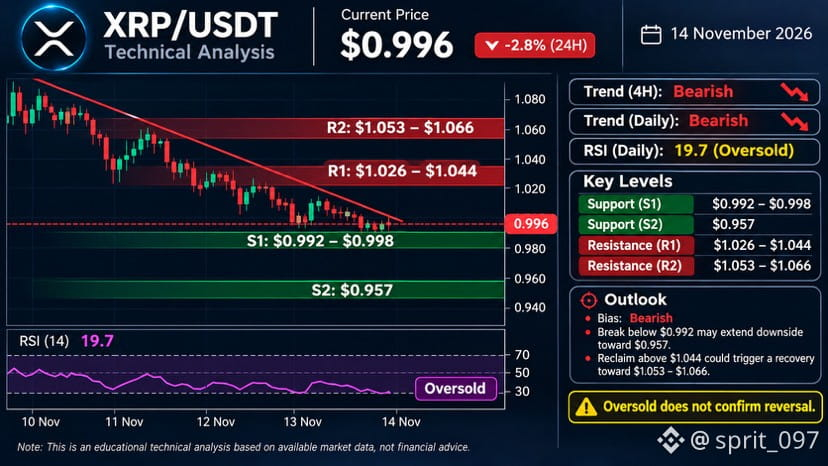
130

·
--
🚨 COMMUNITY ALERT! 🚨 DOES THE BIG PICTURE OF $XRP SHOW US THE NEXT BULLISH SPRINGBOARD? 🚀
My people, let's analyze the real price history so we don't fall into psychological traps! 🦅 If we take a close look at the macro behavior of $XRP in its long-term charts, we can see with surgical precision where we've come from and where we're headed.
After reaching all-time highs in previous cycles, the market has gone through a natural correction and cooling-off phase. But take note of one key technical detail: the RSI indicator is touching the absolute bottom of extreme oversold territory! 📉🔥
Historically, whenever the market pushes XRPtoward these zones of deep compression, whales and major institutions take the opportunity to scoop up every available coin and move it into cold storage, completely drying up exchange liquidity.
This is no cause for alarm; it's the biggest discount zone the chart is offering us before an imminent technical rebound. The most successful portfolios are built by having the patience to see the full picture when screens are awash in red.
🎯 My view as an analyst: Today's patience is tomorrow's massive profit. Don't let short-term noise push you out of a position with so much potential.
👇 Tell me in the comments: How are you managing your portfolio right now? Are you accumulating more $XRP, $BTC, and $Ethereum, or would you rather wait for the takeoff? I'll read your comments and reply! 💬🤝
#BinanceSquare #XRP #community #BTC #Ethereum✅
$XRP
#XRPPredictions
#Xrp🔥🔥
#btc走勢
{spot}(XRPUSDT)
🚨 COMMUNITY ALERT! 🚨 DOES THE BIG PICTURE OF $XRP SHOW US THE NEXT BULLISH SPRINGBOARD? 🚀
My people, let's analyze the real price history so we don't fall into psychological traps! 🦅 If we take a close look at the macro behavior of $XRP in its long-term charts, we can see with surgical precision where we've come from and where we're headed.
After reaching all-time highs in previous cycles, the market has gone through a natural correction and cooling-off phase. But take note of one key technical detail: the RSI indicator is touching the absolute bottom of extreme oversold territory! 📉🔥
Historically, whenever the market pushes XRPtoward these zones of deep compression, whales and major institutions take the opportunity to scoop up every available coin and move it into cold storage, completely drying up exchange liquidity.
This is no cause for alarm; it's the biggest discount zone the chart is offering us before an imminent technical rebound. The most successful portfolios are built by having the patience to see the full picture when screens are awash in red.
🎯 My view as an analyst: Today's patience is tomorrow's massive profit. Don't let short-term noise push you out of a position with so much potential.
👇 Tell me in the comments: How are you managing your portfolio right now? Are you accumulating more $XRP , $BTC, and $Ethereum, or would you rather wait for the takeoff? I'll read your comments and reply! 💬🤝
#BinanceSquare #XRP #community #BTC #Ethereum✅
$XRP
#XRPPredictions
#Xrp🔥🔥
#btc走勢
My people, let's analyze the real price history so we don't fall into psychological traps! 🦅 If we take a close look at the macro behavior of $XRP in its long-term charts, we can see with surgical precision where we've come from and where we're headed.
After reaching all-time highs in previous cycles, the market has gone through a natural correction and cooling-off phase. But take note of one key technical detail: the RSI indicator is touching the absolute bottom of extreme oversold territory! 📉🔥
Historically, whenever the market pushes XRPtoward these zones of deep compression, whales and major institutions take the opportunity to scoop up every available coin and move it into cold storage, completely drying up exchange liquidity.
This is no cause for alarm; it's the biggest discount zone the chart is offering us before an imminent technical rebound. The most successful portfolios are built by having the patience to see the full picture when screens are awash in red.
🎯 My view as an analyst: Today's patience is tomorrow's massive profit. Don't let short-term noise push you out of a position with so much potential.
👇 Tell me in the comments: How are you managing your portfolio right now? Are you accumulating more $XRP , $BTC, and $Ethereum, or would you rather wait for the takeoff? I'll read your comments and reply! 💬🤝
#BinanceSquare #XRP #community #BTC #Ethereum✅
$XRP
#XRPPredictions
#Xrp🔥🔥
#btc走勢
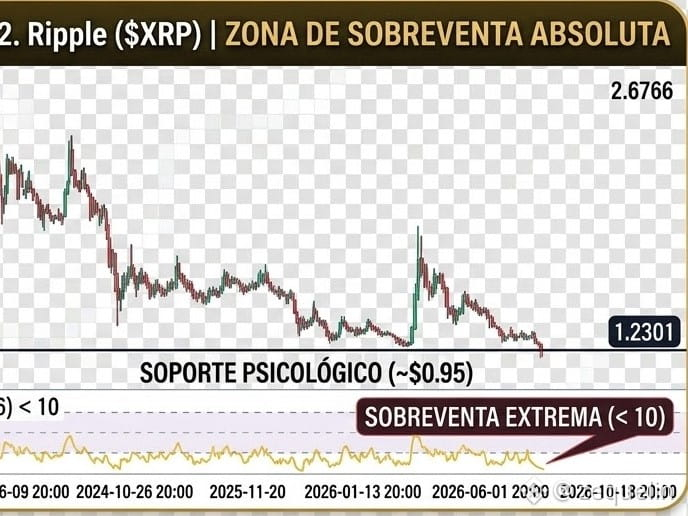
1
279
Log in to explore more content
Join global crypto users on Binance Square
⚡️ Get latest and useful information about crypto.
💬 Trusted by the world’s largest crypto exchange.
👍 Discover real insights from verified creators.
Email / Phone number
Trending Topics
1
#CanBTCReboundAfterFallingBelow60K?
0 views
284 Discussing
2
#GlobalStocksFaceLongestLosingStreakSince2023
0 views
364 Discussing
3
#AnthropicPlungesTowardIPOPriceonDay2
0 views
95 Discussing
4
#GaoTengBitcoinETFListsOnHKEX
0 views
311 Discussing
5
#TradFiForBeginners
946,825 views
5,636 Discussing
6
#NvidiaBoardReportedlySplitOverHuang’sReturn
258,674 views
2,483 Discussing
7
#TetherBurns8BillionUSDTInPast20Days
0 views
121 Discussing
8
#BitcoinWalletSignatureFlawExploitableWithinSeconds
0 views
54 Discussing
9
#CanGTA6'sLaunchLiftTTWOShares?
207,868 views
1,752 Discussing
10
#HongKongProposesSFCLicensingForFourVirtualAssetServices
404 views
32 Discussing