
Mhd_Fzlul
2.9k Posts

Mhd_Fzlul
 Square Verified+
Report
Block User
🇱🇰SL🥈Square Verified Creator🌟 | Market Updates📈 | Long-Term Vision 🚀 | Learn • Trade • Grow 💹 | Bina_ID : 1204481861.
66 Following
32.0K+ Followers
22.2K+ Liked
Posts
All
Quotes
Videos
PINNED
·
--
Bullish
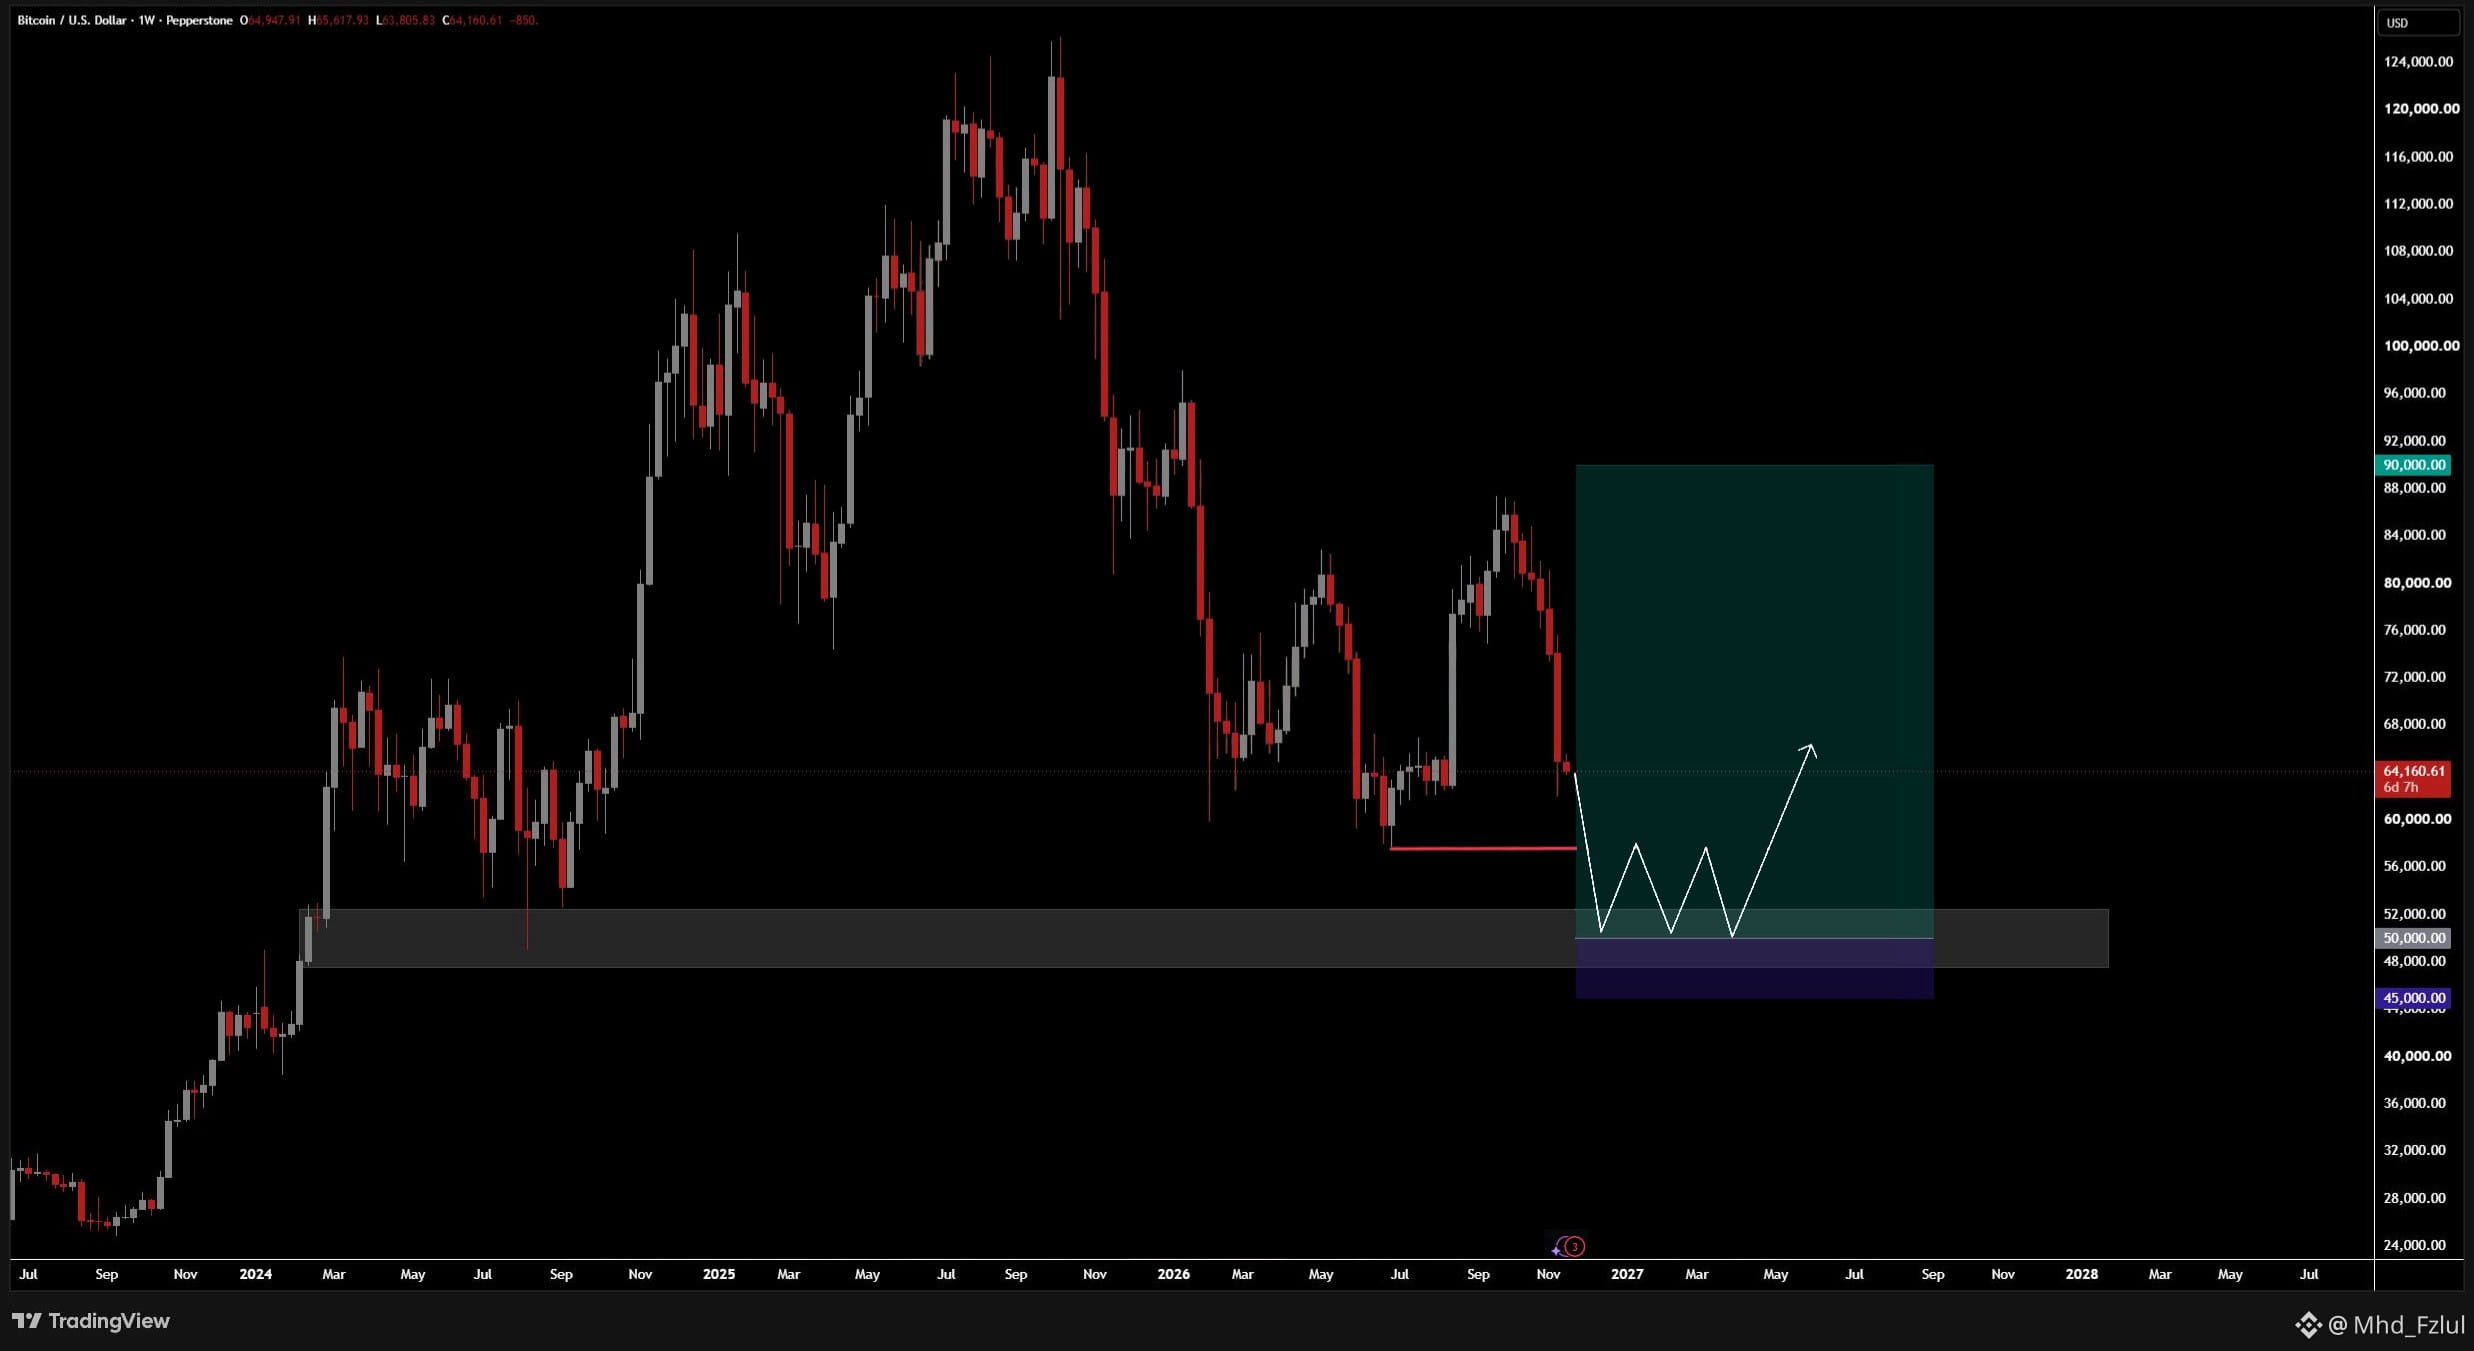
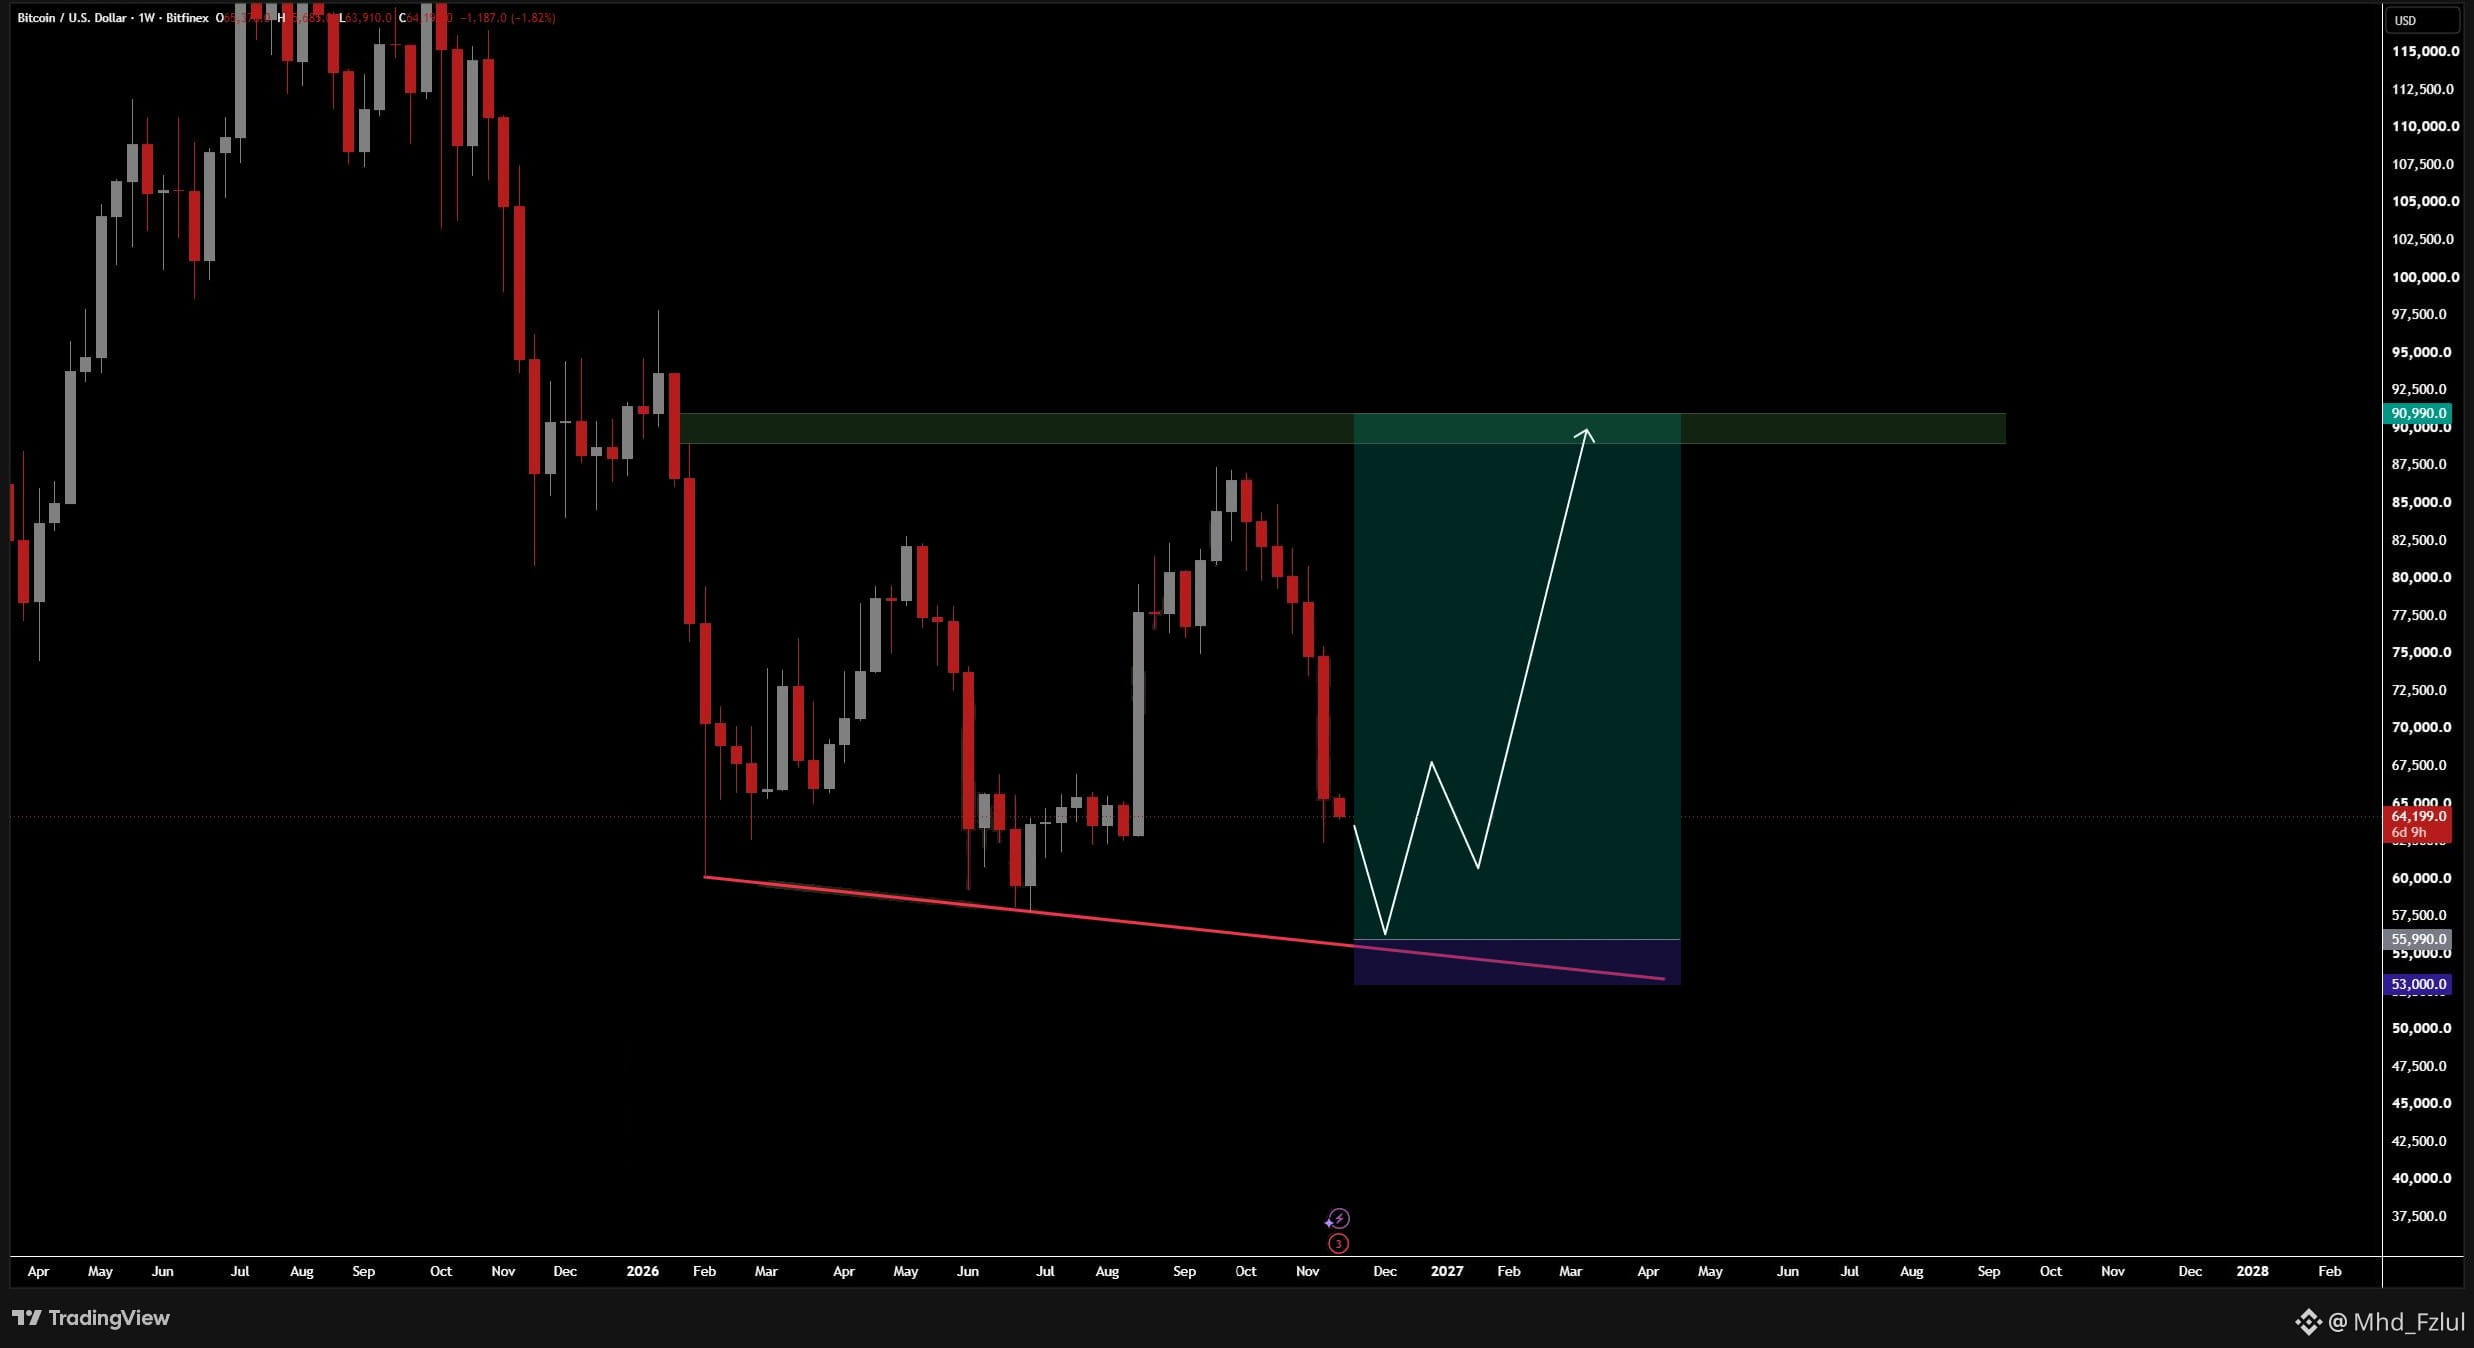
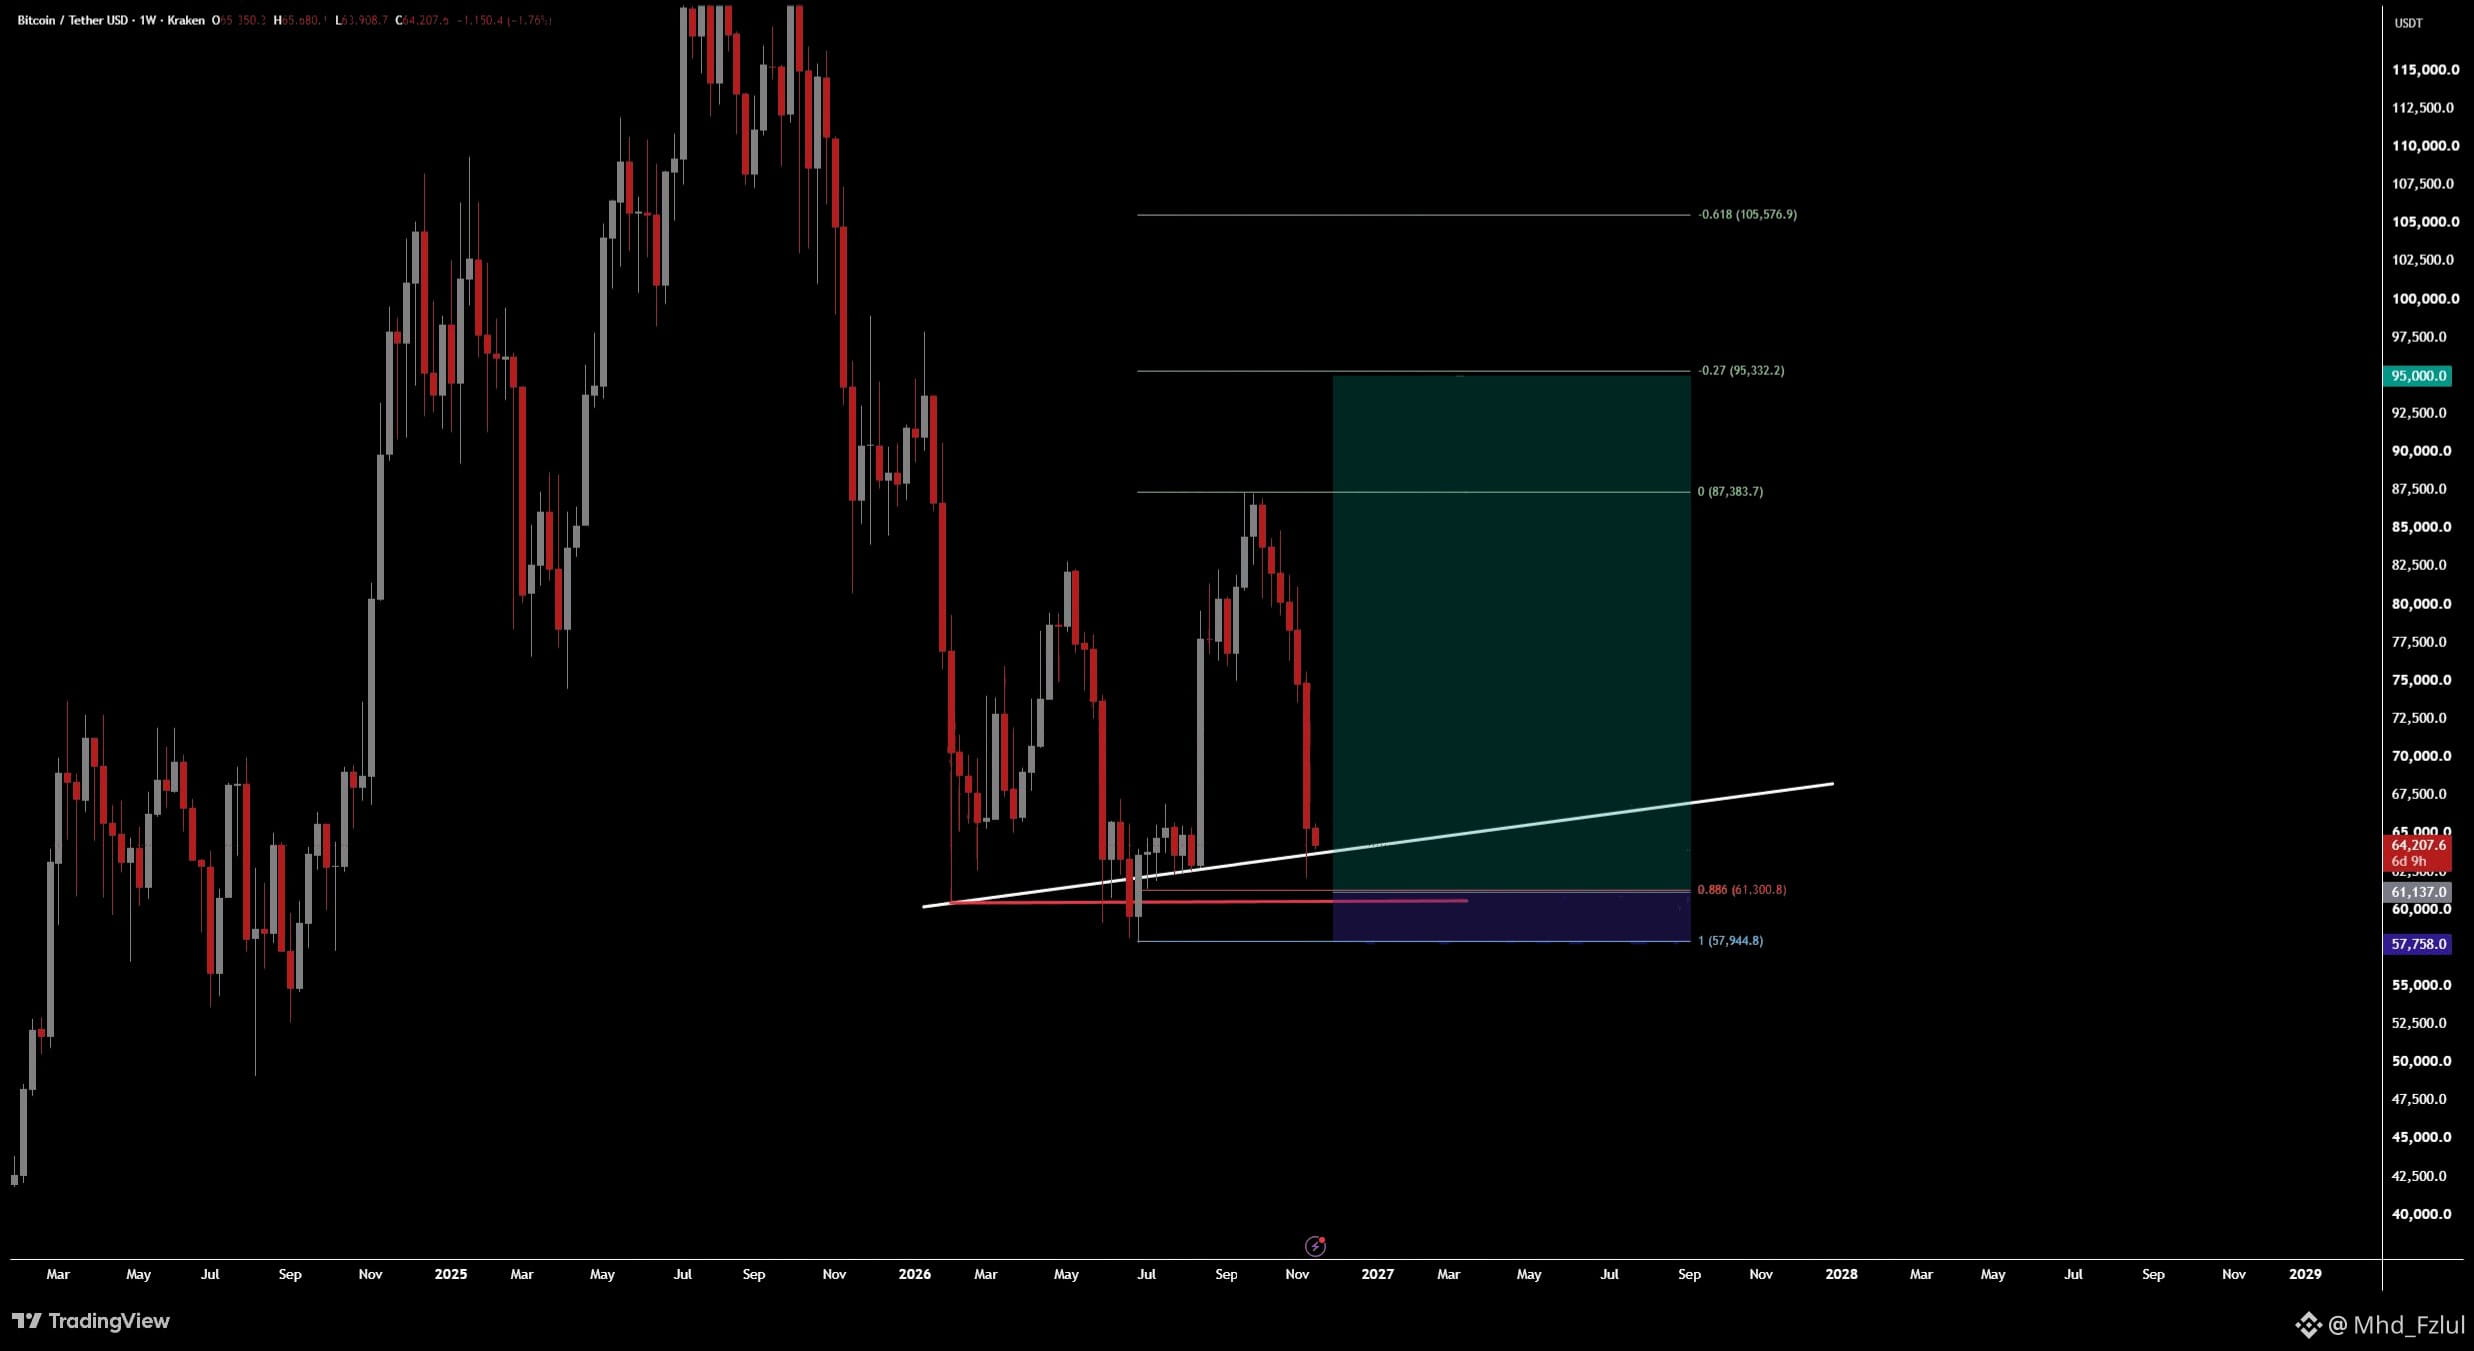
Bitcoin is at a critical point, and this are my 3 possible scenarios for the next move. 👇
🟢 SCENARIO 1: Reversal from $60K–$61K
$BTC managed to close above the trendline, which is a positive sign.
If the $60K–$61K zone holds, we could see an inverse Head & Shoulders pattern forming and a potential recovery.
This would be a high-risk long setup, so confirmation is important.
🟢 SCENARIO 2: One More Drop to $56K
#bitcoin could drop toward the descending trendline around $56K before reversing.
This could be where buyers step in and we start seeing a stronger recovery.
I’ll be watching closely for a possible entry.
🟢 SCENARIO 3: Bigger Crash Toward $52K
This is the scenario we can’t ignore.
If BTC loses its current support and breaks below the previous low, things could get ugly.
There is still significant historical liquidity around $52K–$56K, and the market could sweep that zone before any meaningful recovery.
🔎 MY THOUGHTS
Despite all the negative news and selling pressure, Bitcoin has still managed to defend $60K.
That’s important.
We’re now at a crucial decision point. Either buyers step in and we recover, or another leg down is coming.
Don’t rush into trades. Let the market confirm the direction first.
I’ll keep sharing my charts and updates here as things develop.❤️
$BTC
{future}(BTCUSDT)
@Mhd_Fzlul #Mhd_Fzlul
#BitcoinExtendsLosingStreakToSixWeeks
#BTC
#BTTC
Bitcoin is at a critical point, and this are my 3 possible scenarios for the next move. 👇
🟢 SCENARIO 1: Reversal from $60K–$61K
$BTC managed to close above the trendline, which is a positive sign.
If the $60K–$61K zone holds, we could see an inverse Head & Shoulders pattern forming and a potential recovery.
This would be a high-risk long setup, so confirmation is important.
🟢 SCENARIO 2: One More Drop to $56K
#bitcoin could drop toward the descending trendline around $56K before reversing.
This could be where buyers step in and we start seeing a stronger recovery.
I’ll be watching closely for a possible entry.
🟢 SCENARIO 3: Bigger Crash Toward $52K
This is the scenario we can’t ignore.
If BTC loses its current support and breaks below the previous low, things could get ugly.
There is still significant historical liquidity around $52K–$56K, and the market could sweep that zone before any meaningful recovery.
🔎 MY THOUGHTS
Despite all the negative news and selling pressure, Bitcoin has still managed to defend $60K.
That’s important.
We’re now at a crucial decision point. Either buyers step in and we recover, or another leg down is coming.
Don’t rush into trades. Let the market confirm the direction first.
I’ll keep sharing my charts and updates here as things develop.❤️
$BTC
@Mhd_Fzlul #Mhd_Fzlul
#BitcoinExtendsLosingStreakToSixWeeks
#BTC
#BTTC
🟢 SCENARIO 1: Reversal from $60K–$61K
$BTC managed to close above the trendline, which is a positive sign.
If the $60K–$61K zone holds, we could see an inverse Head & Shoulders pattern forming and a potential recovery.
This would be a high-risk long setup, so confirmation is important.
🟢 SCENARIO 2: One More Drop to $56K
#bitcoin could drop toward the descending trendline around $56K before reversing.
This could be where buyers step in and we start seeing a stronger recovery.
I’ll be watching closely for a possible entry.
🟢 SCENARIO 3: Bigger Crash Toward $52K
This is the scenario we can’t ignore.
If BTC loses its current support and breaks below the previous low, things could get ugly.
There is still significant historical liquidity around $52K–$56K, and the market could sweep that zone before any meaningful recovery.
🔎 MY THOUGHTS
Despite all the negative news and selling pressure, Bitcoin has still managed to defend $60K.
That’s important.
We’re now at a crucial decision point. Either buyers step in and we recover, or another leg down is coming.
Don’t rush into trades. Let the market confirm the direction first.
I’ll keep sharing my charts and updates here as things develop.❤️
$BTC
@Mhd_Fzlul #Mhd_Fzlul
#BitcoinExtendsLosingStreakToSixWeeks
#BTC
#BTTC
319
4
12
319
·
--
Binance Exchange Adds Anthropic (ANTB) bStocks Trading Pairs on Binance Spot/Convert - 2026-11-19
To expand the list of trading choices offered on Binance Spot and enhance users’ trading experience, Binance Exchange will open trading and Rebalancing Bots services for the bStocks Anthropic (ANTB) trading pair according to the following schedule:
- Trading pair: ANTB/USDT at 2026-11-19 18:00 (UTC)
- Rebalancing Bots: Will be enabled within 24 hours of it being listed on Spot
Binance Exchange Adds Anthropic (ANTB) bStocks Trading Pairs on Binance Spot/Convert - 2026-11-19
To expand the list of trading choices offered on Binance Spot and enhance users’ trading experience, Binance Exchange will open trading and Rebalancing Bots services for the bStocks Anthropic (ANTB) trading pair according to the following schedule:
- Trading pair: ANTB/USDT at 2026-11-19 18:00 (UTC)
- Rebalancing Bots: Will be enabled within 24 hours of it being listed on Spot
To expand the list of trading choices offered on Binance Spot and enhance users’ trading experience, Binance Exchange will open trading and Rebalancing Bots services for the bStocks Anthropic (ANTB) trading pair according to the following schedule:
- Trading pair: ANTB/USDT at 2026-11-19 18:00 (UTC)
- Rebalancing Bots: Will be enabled within 24 hours of it being listed on Spot

1
153
·
--
$BTC 👌🏻
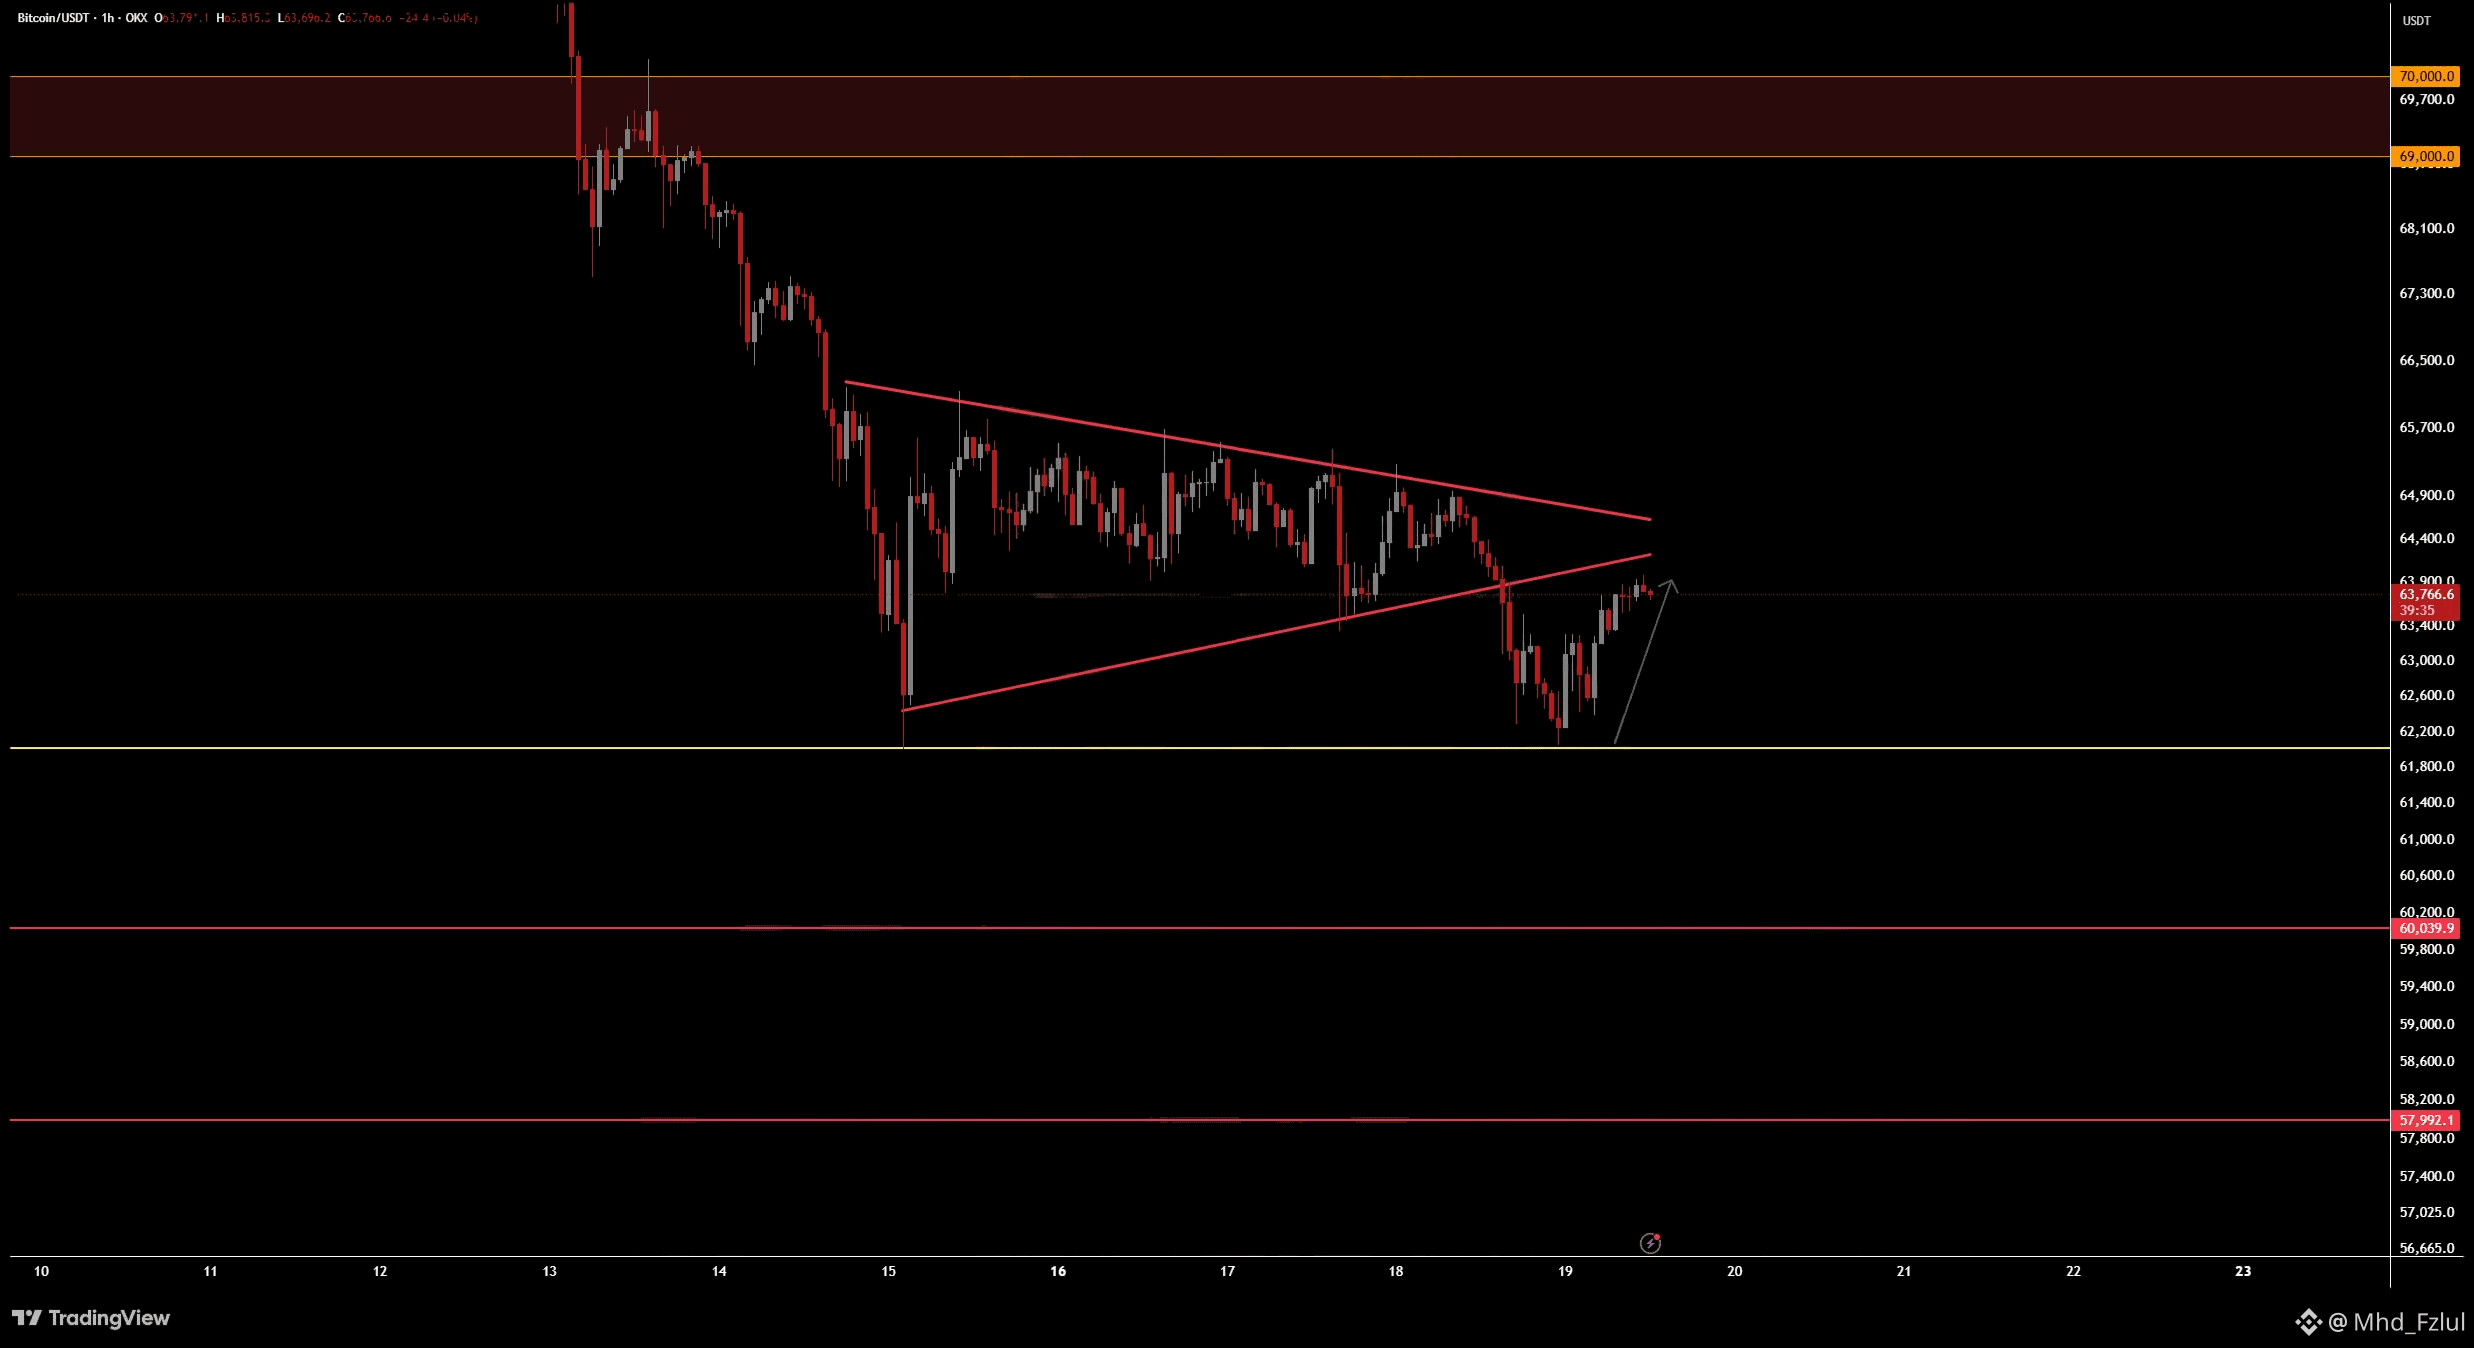
Bitcoin broke down from the triangle, swept the $62K support area and bounced straight back.
Now we’re retesting the broken trendline around $64K.
Reclaim it, and bulls can get some short term momentum.
Get rejected, and another move toward $62K is coming.
@Mhd_Fzlul #Mhd_Fzlul
#BTC #BTCRemainsUnderPressureAfterHawkishFOMCMinutes
{future}(BTCUSDT)
$BTC 👌🏻
Bitcoin broke down from the triangle, swept the $62K support area and bounced straight back.
Now we’re retesting the broken trendline around $64K.
Reclaim it, and bulls can get some short term momentum.
Get rejected, and another move toward $62K is coming.
@Mhd_Fzlul #Mhd_Fzlul
#BTC #BTCRemainsUnderPressureAfterHawkishFOMCMinutes
Bitcoin broke down from the triangle, swept the $62K support area and bounced straight back.
Now we’re retesting the broken trendline around $64K.
Reclaim it, and bulls can get some short term momentum.
Get rejected, and another move toward $62K is coming.
@Mhd_Fzlul #Mhd_Fzlul
#BTC #BTCRemainsUnderPressureAfterHawkishFOMCMinutes
Mhd_Fzlul
·
--
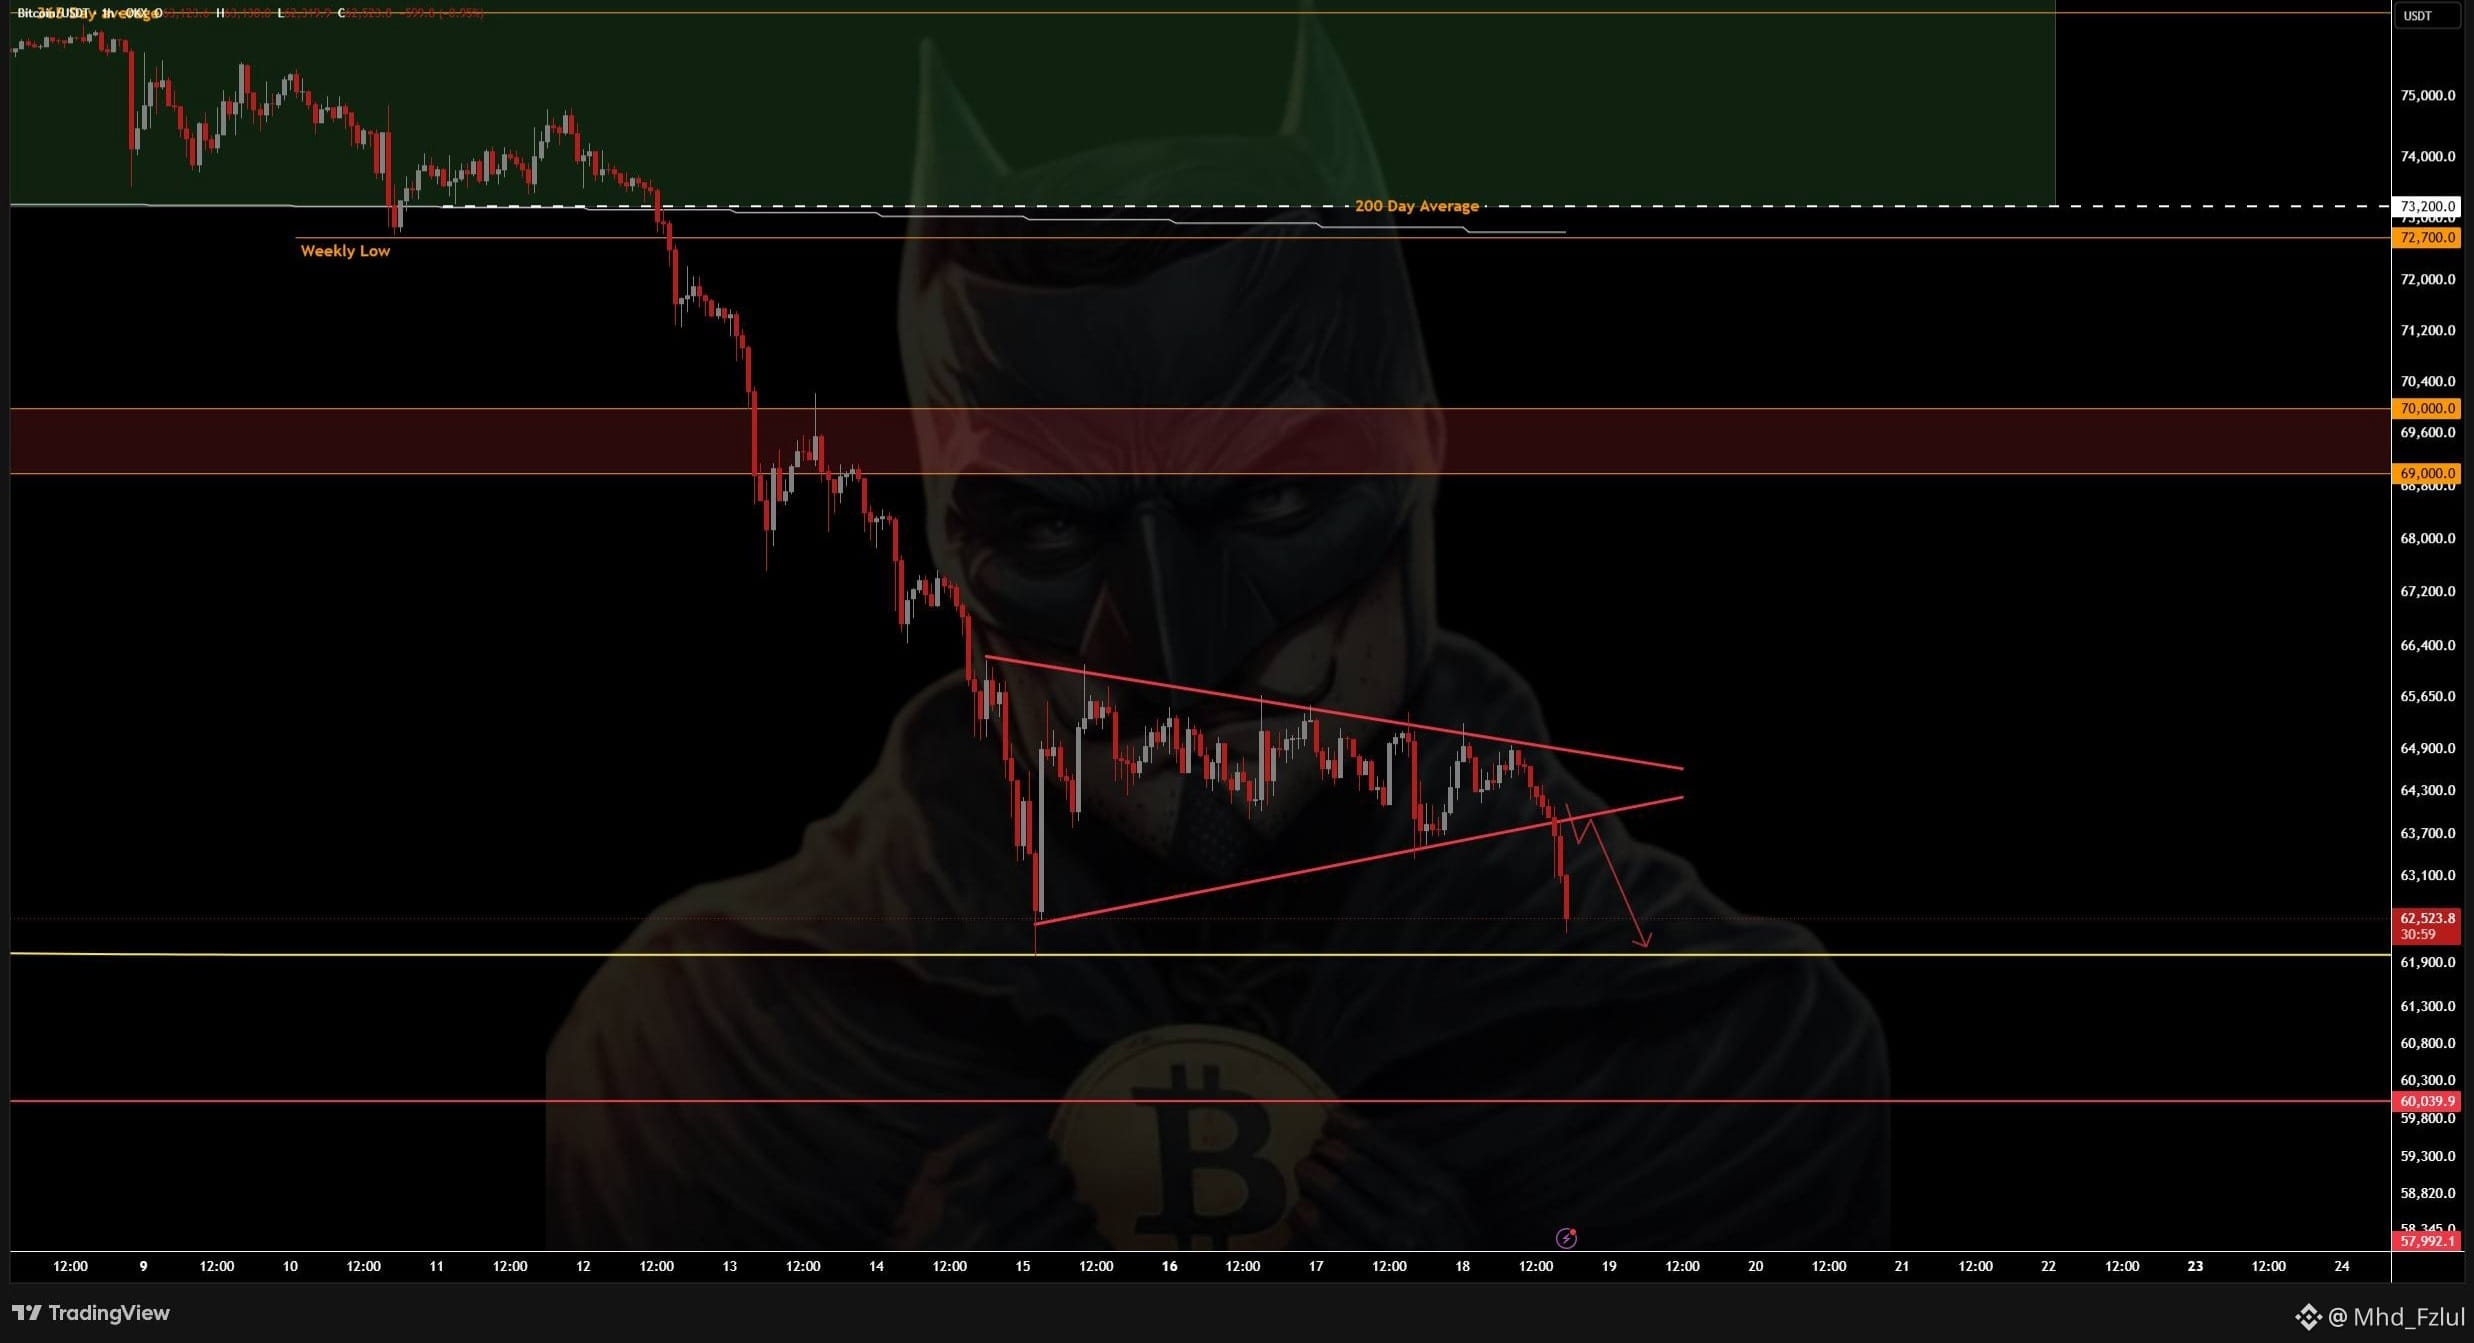
BearishTold you the move is coming 👀
@Mhd_Fzlul #Mhd_Fzlul
#BTC
#CanNvidia’sDataCenterGrowthContinue?
#LedgerHardwareImplantReportsExtendToDubai
@Mhd_Fzlul #Mhd_Fzlul
#BTC
#CanNvidia’sDataCenterGrowthContinue?
#LedgerHardwareImplantReportsExtendToDubai
1
128
·
--
Bearish
Mhd_Fzlul
·
--
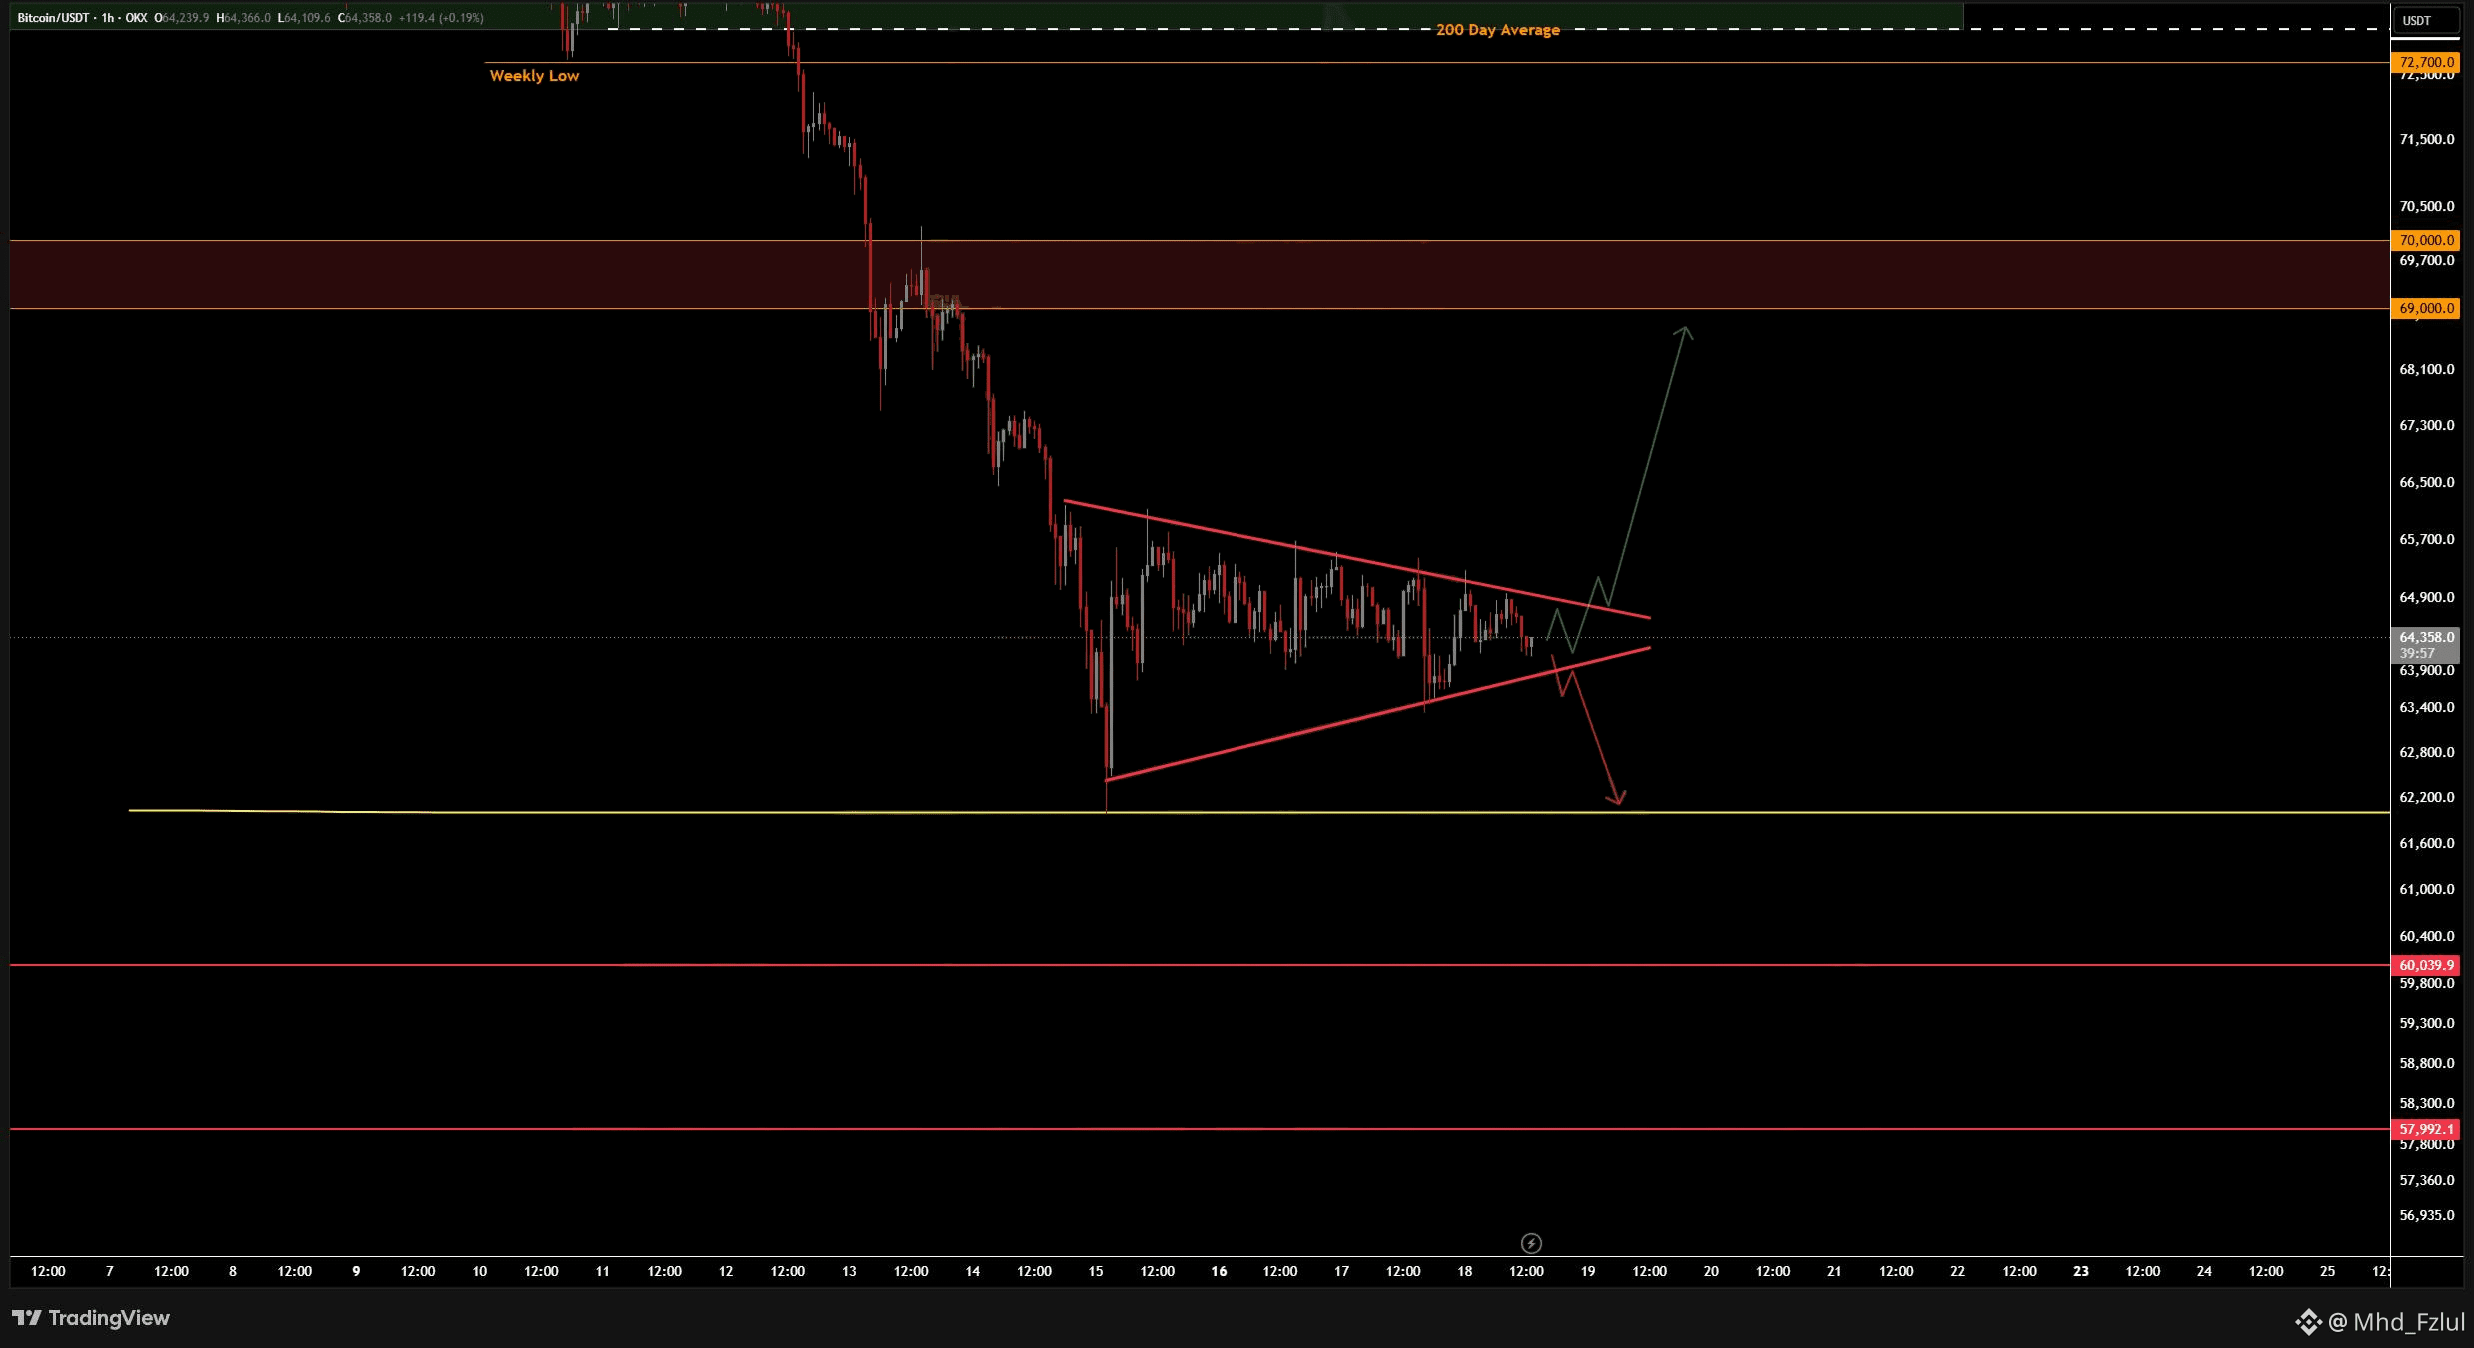
Soon probably the move from $BTC will come. I’m staying out for now still
@Mhd_Fzlul #Mhd_Fzlul
#BTC
@Mhd_Fzlul #Mhd_Fzlul
#BTC
1
1
120
·
--
Bearish
Notice of Removal of Spot Trading Pairs - 2026-11-20
Based on our most recent reviews, Binance will remove and cease trading on the following spot trading pairs at 2026-11-20 03:00 (UTC): GAS/TRY, HBAR/BNB, HIVE/TRY, KSM/TRY and ZAMA/TRY
#DelistingAlert #delisting #DelistingNotice
Notice of Removal of Spot Trading Pairs - 2026-11-20
Based on our most recent reviews, Binance will remove and cease trading on the following spot trading pairs at 2026-11-20 03:00 (UTC): GAS/TRY, HBAR/BNB, HIVE/TRY, KSM/TRY and ZAMA/TRY
#DelistingAlert #delisting #DelistingNotice
Based on our most recent reviews, Binance will remove and cease trading on the following spot trading pairs at 2026-11-20 03:00 (UTC): GAS/TRY, HBAR/BNB, HIVE/TRY, KSM/TRY and ZAMA/TRY
#DelistingAlert #delisting #DelistingNotice

2
221
·
--

king Gulfam
·
--
Bullish#FutureTradingSignals
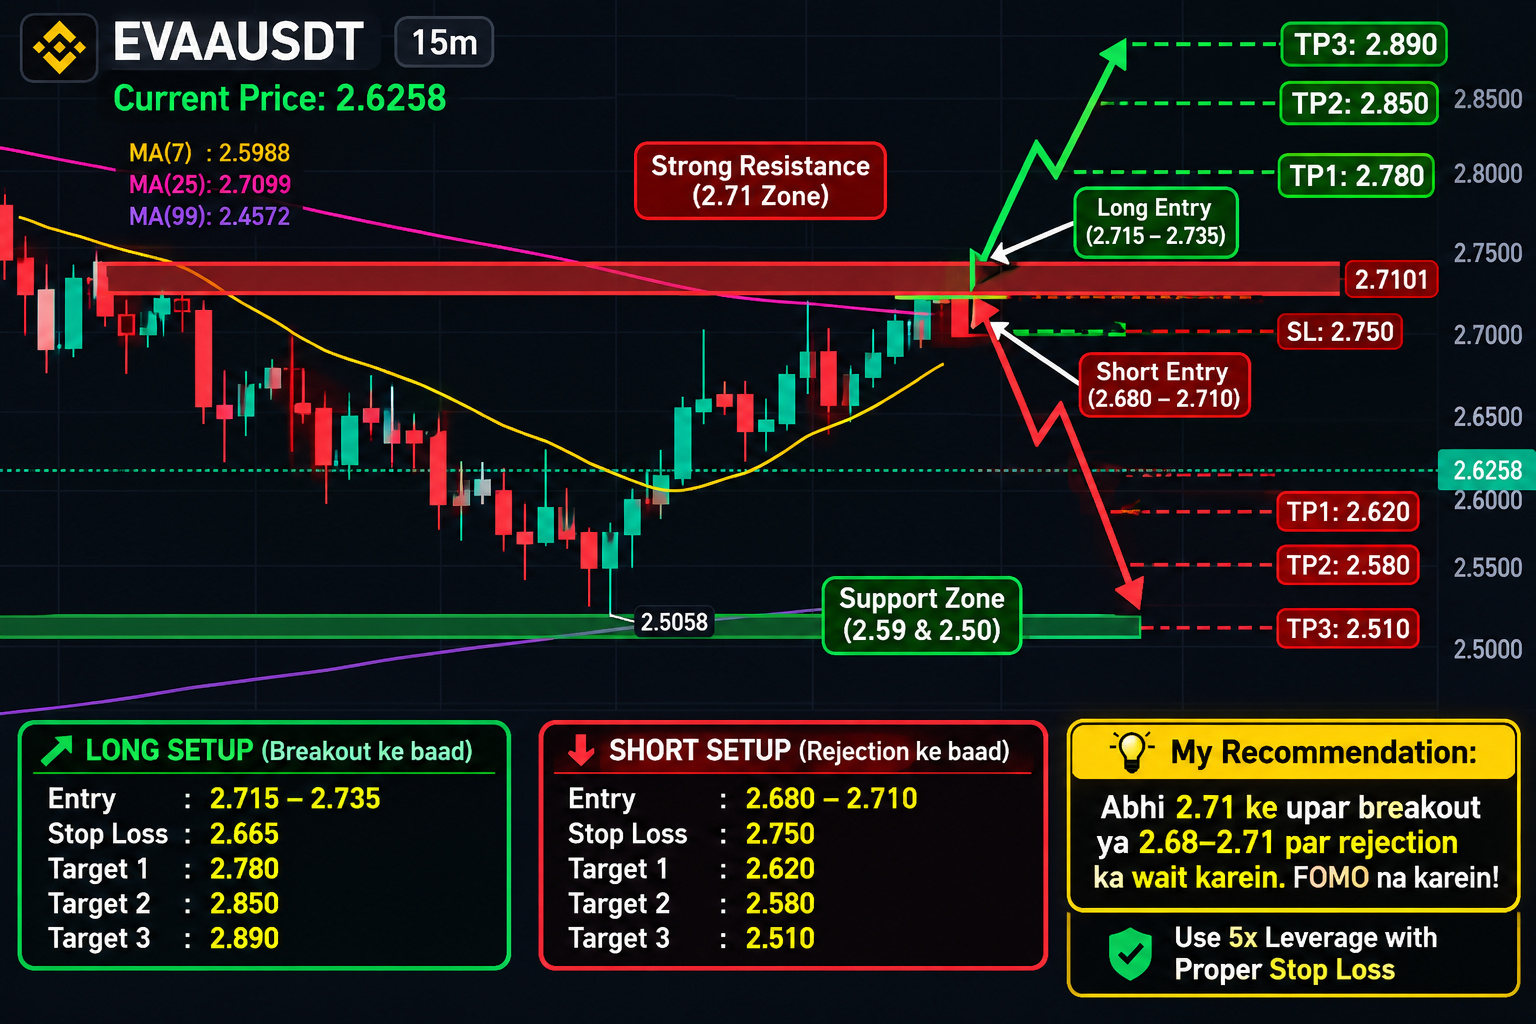
🚀 EVAAUSDT Trading Analysis |
Current Price: 2.6258
Key Resistance: 2.7100
Support Zones: 2.5900 and 2.5058
📈 LONG SETUP (After Breakout)
Entry: 2.715 – 2.735
Stop Loss: 2.665
TP1: 2.780
TP2: 2.850
TP3: 2.890
📉 SHORT SETUP (After Rejection)
Entry: 2.680 – 2.710
Stop Loss: 2.750
TP1: 2.620
TP2: 2.580
TP3: 2.510
⚠️ Use 5x leverage with proper risk management and always place a stop loss.
Trade Smart. Protect Your Capital!
$EVAA
$AKE
$BNB
#EVAA #EVAAUSDT #CryptoTrading
🚀 EVAAUSDT Trading Analysis |
Current Price: 2.6258
Key Resistance: 2.7100
Support Zones: 2.5900 and 2.5058
📈 LONG SETUP (After Breakout)
Entry: 2.715 – 2.735
Stop Loss: 2.665
TP1: 2.780
TP2: 2.850
TP3: 2.890
📉 SHORT SETUP (After Rejection)
Entry: 2.680 – 2.710
Stop Loss: 2.750
TP1: 2.620
TP2: 2.580
TP3: 2.510
⚠️ Use 5x leverage with proper risk management and always place a stop loss.
Trade Smart. Protect Your Capital!
$EVAA
$AKE
$BNB
#EVAA #EVAAUSDT #CryptoTrading
1
176
·
--
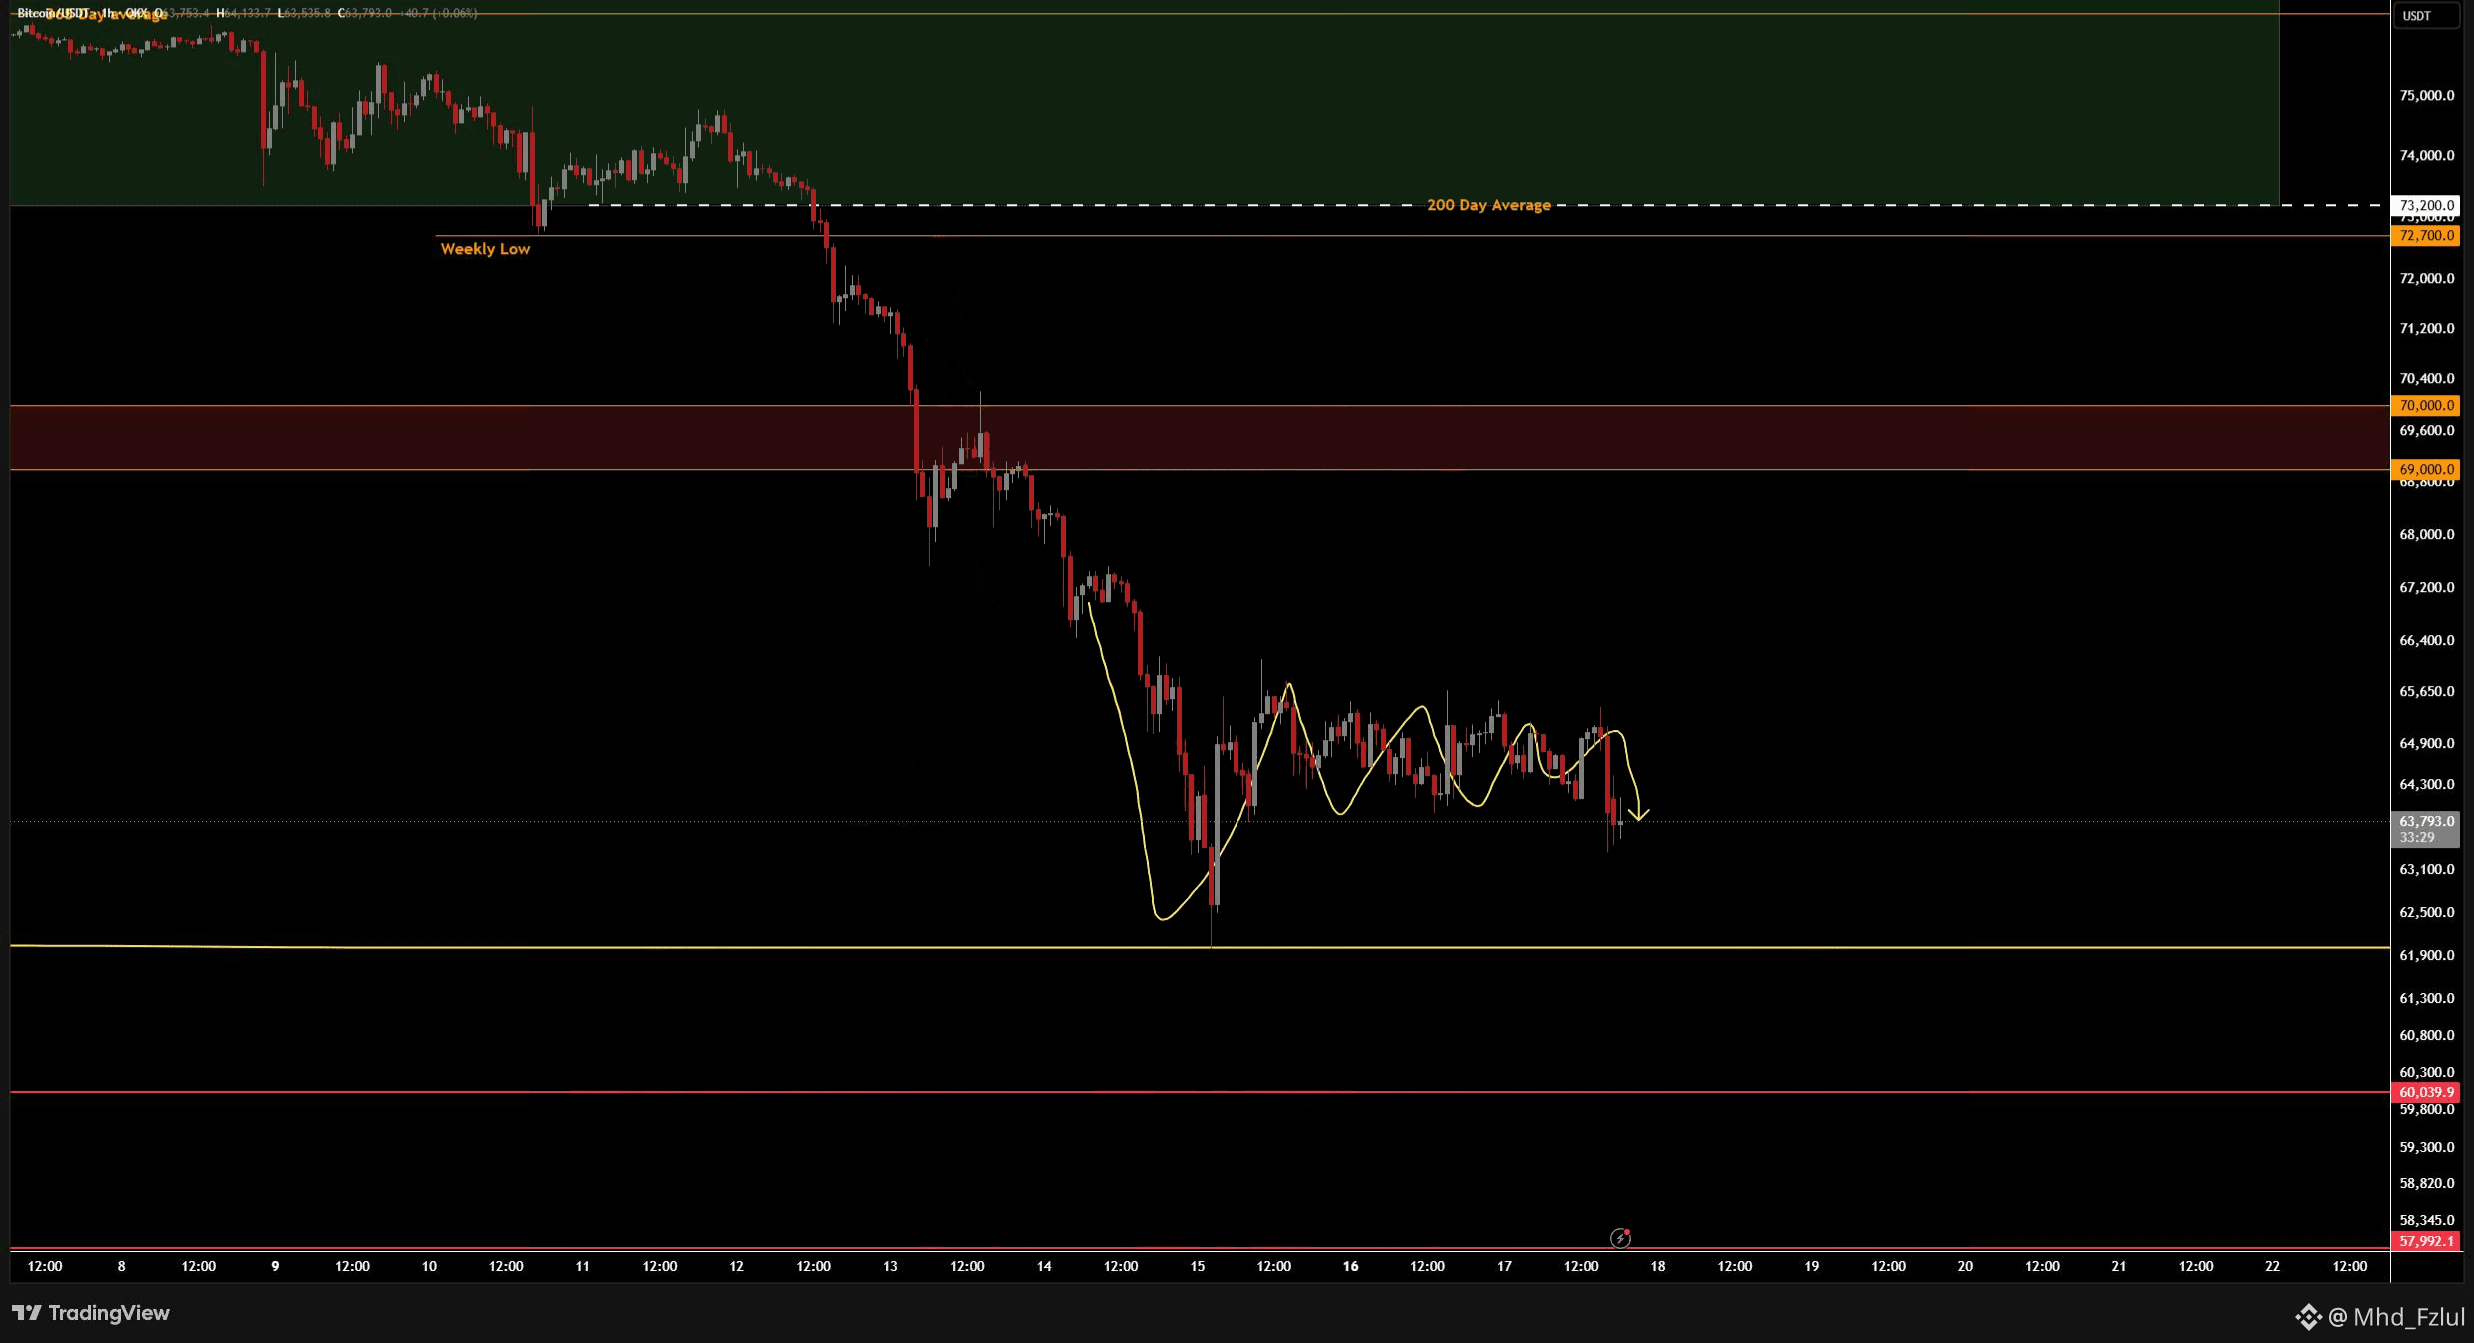
If you’re trading right now, I honestly don’t think you’re doing yourself any favours.
Too much volatility, and now we’re moving sideways after a massive drop.
This looks like fuel for another big move ‼️
@Mhd_Fzlul #Mhd_Fzlul
#BTC
If you’re trading right now, I honestly don’t think you’re doing yourself any favours.
Too much volatility, and now we’re moving sideways after a massive drop.
This looks like fuel for another big move ‼️
@Mhd_Fzlul #Mhd_Fzlul
#BTC
Too much volatility, and now we’re moving sideways after a massive drop.
This looks like fuel for another big move ‼️
@Mhd_Fzlul #Mhd_Fzlul
#BTC
2
169
·
--
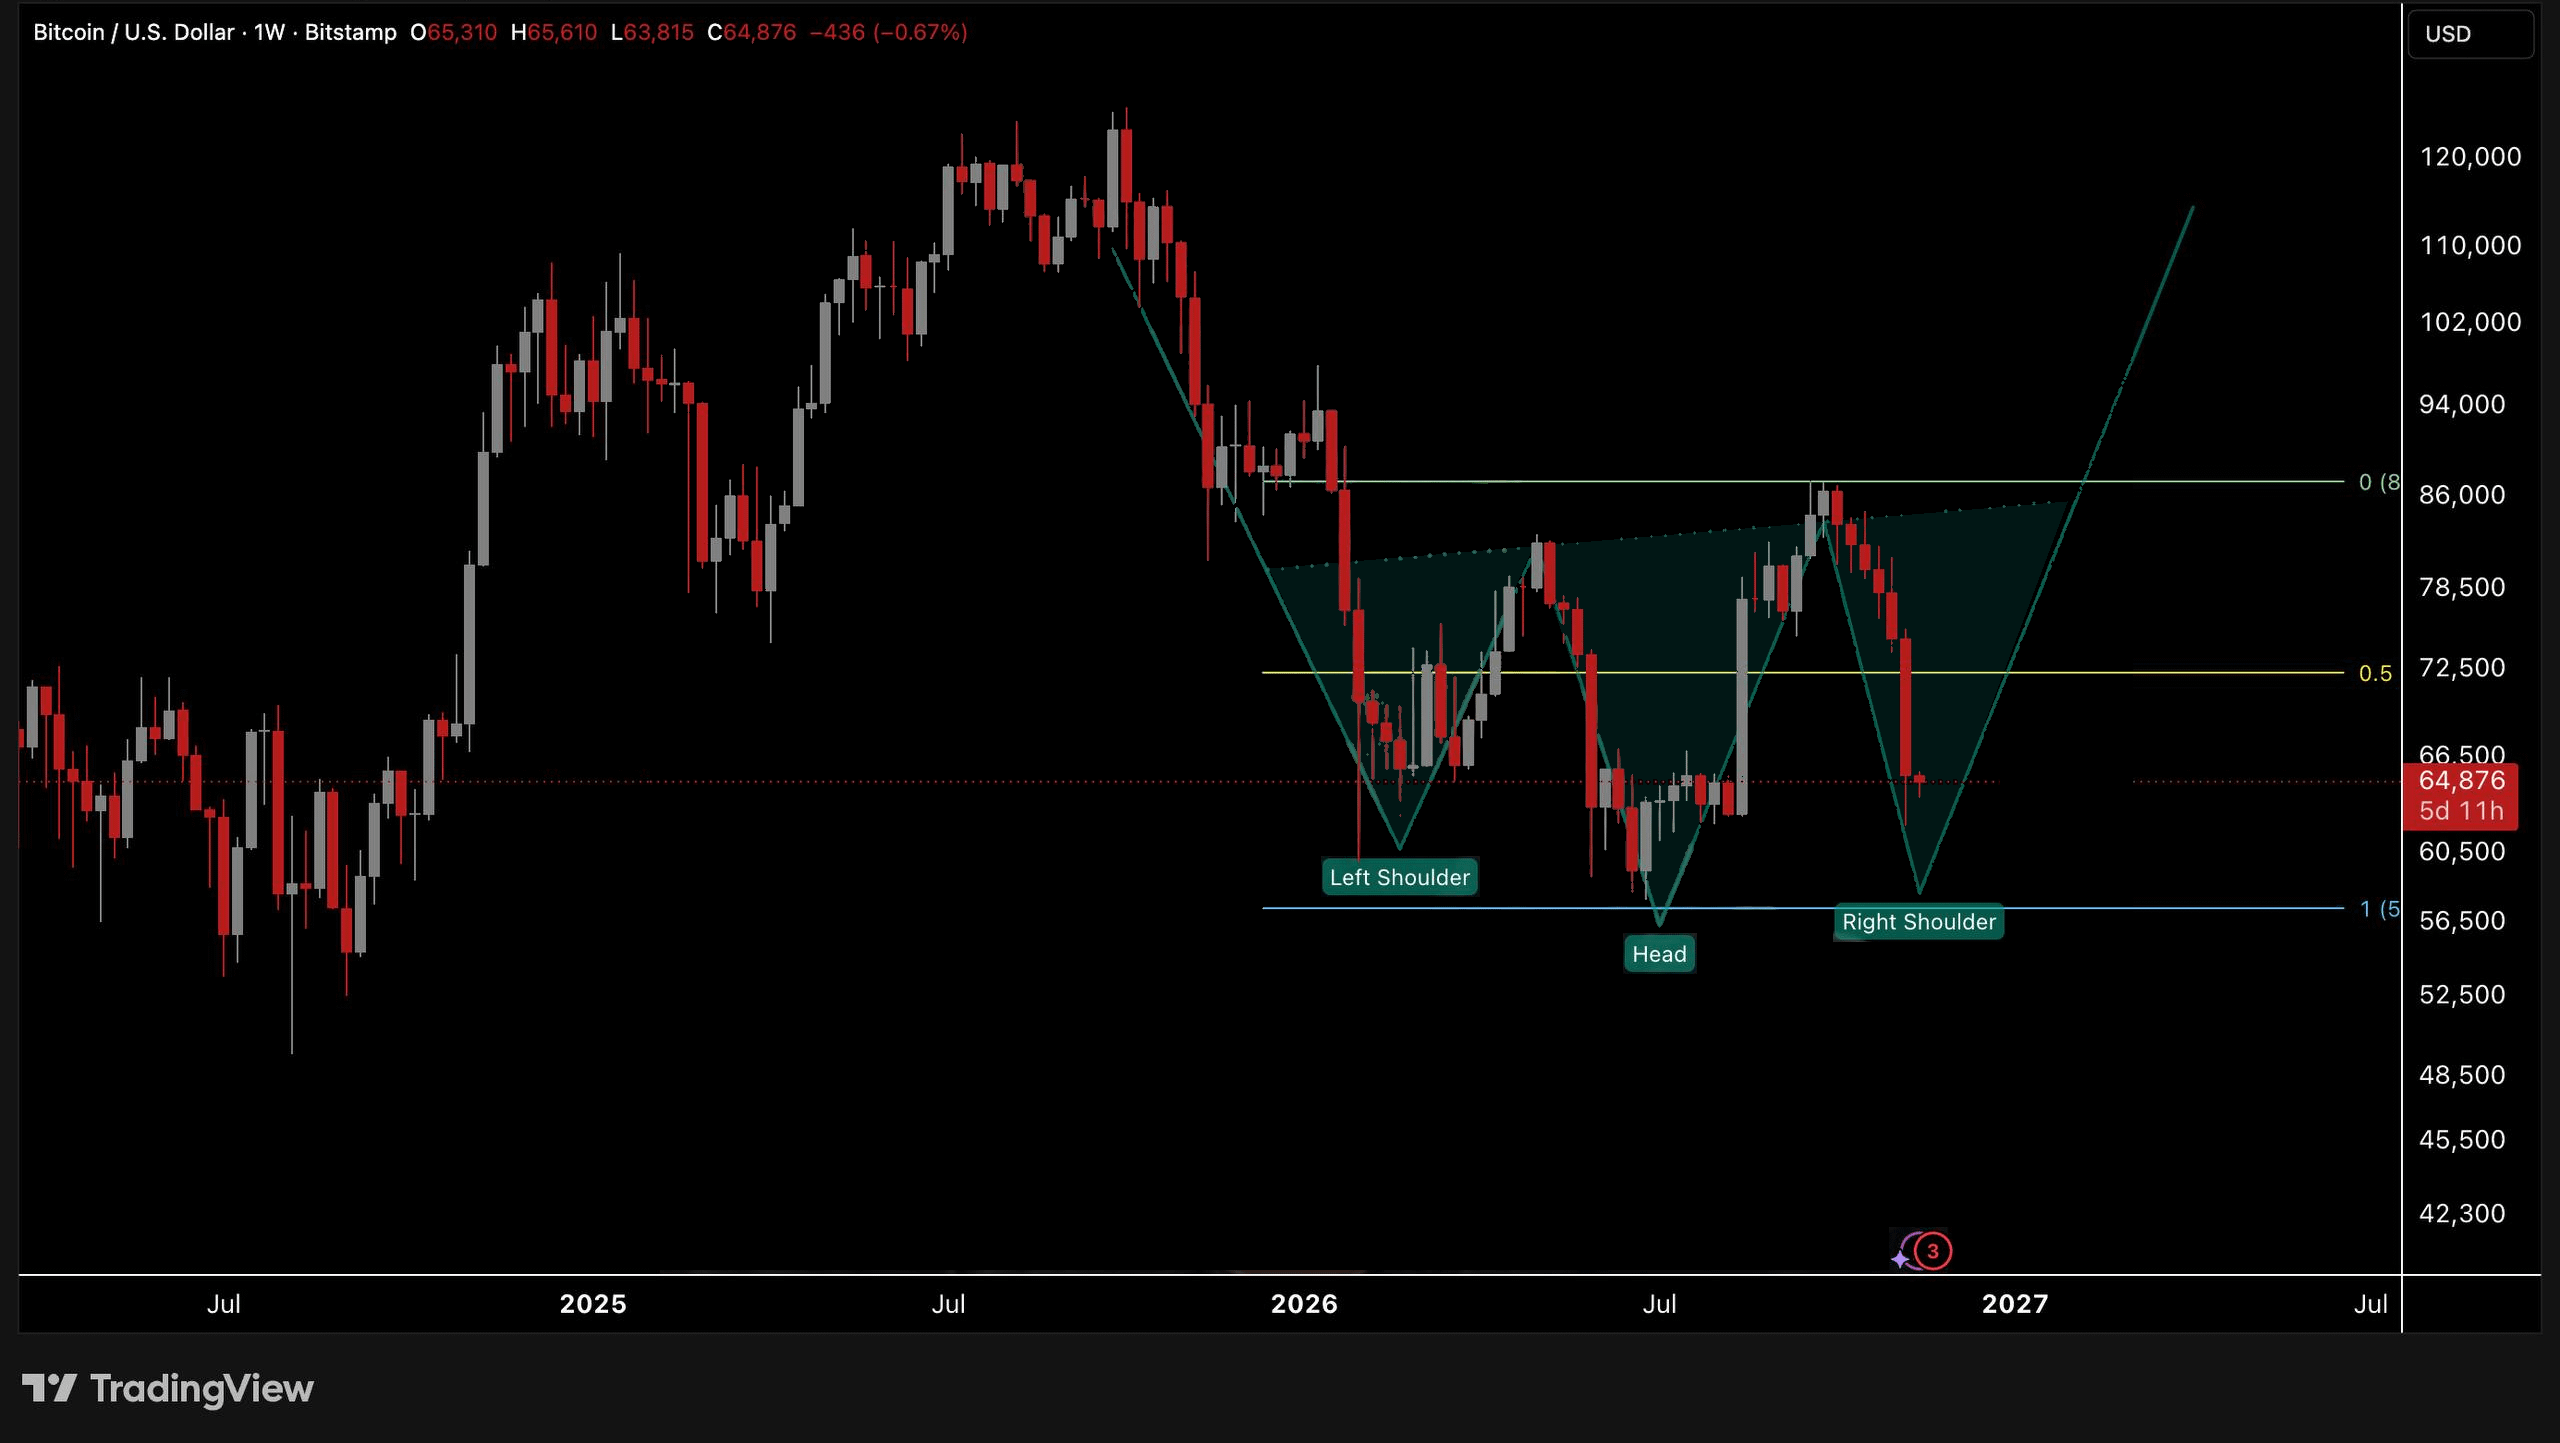
Alright guys once again for $BTC I’m 95% confident we’re very close to the bottom!
$56K–$57K should hold on the weekly close. But in crypto — a midweek wick below to grab liquidity and wipe out overleveraged traders is absolutely possible.
Yesterday I posted also my 3 possible scenarios 🔗
My targets remain a lot higher for this cycle and this is where I’m putting my own money.
I strongly believe the odds are in our favor. 😉
$BTC
{future}(BTCUSDT)
@Mhd_Fzlul #Mhd_Fzlul
#NvidiaEarningsTonight:AIStocks’NextMove?
#BTC
Alright guys once again for $BTC I’m 95% confident we’re very close to the bottom!
$56K–$57K should hold on the weekly close. But in crypto — a midweek wick below to grab liquidity and wipe out overleveraged traders is absolutely possible.
Yesterday I posted also my 3 possible scenarios 🔗
My targets remain a lot higher for this cycle and this is where I’m putting my own money.
I strongly believe the odds are in our favor. 😉
$BTC
@Mhd_Fzlul #Mhd_Fzlul
#NvidiaEarningsTonight:AIStocks’NextMove?
#BTC
$56K–$57K should hold on the weekly close. But in crypto — a midweek wick below to grab liquidity and wipe out overleveraged traders is absolutely possible.
Yesterday I posted also my 3 possible scenarios 🔗
My targets remain a lot higher for this cycle and this is where I’m putting my own money.
I strongly believe the odds are in our favor. 😉
$BTC
@Mhd_Fzlul #Mhd_Fzlul
#NvidiaEarningsTonight:AIStocks’NextMove?
#BTC
Mhd_Fzlul
·
--
BearishYour job is to know when market is not tradable.
Stay patient, protect your capital, and we’ll make money soon !!👇
@Mhd_Fzlul #Mhd_Fzlul
#BitcoinActiveSupplyInProfitDropsBelow45%
#BTC
$BTC
Stay patient, protect your capital, and we’ll make money soon !!👇
@Mhd_Fzlul #Mhd_Fzlul
#BitcoinActiveSupplyInProfitDropsBelow45%
#BTC
$BTC
2
162
·
--
Bearish
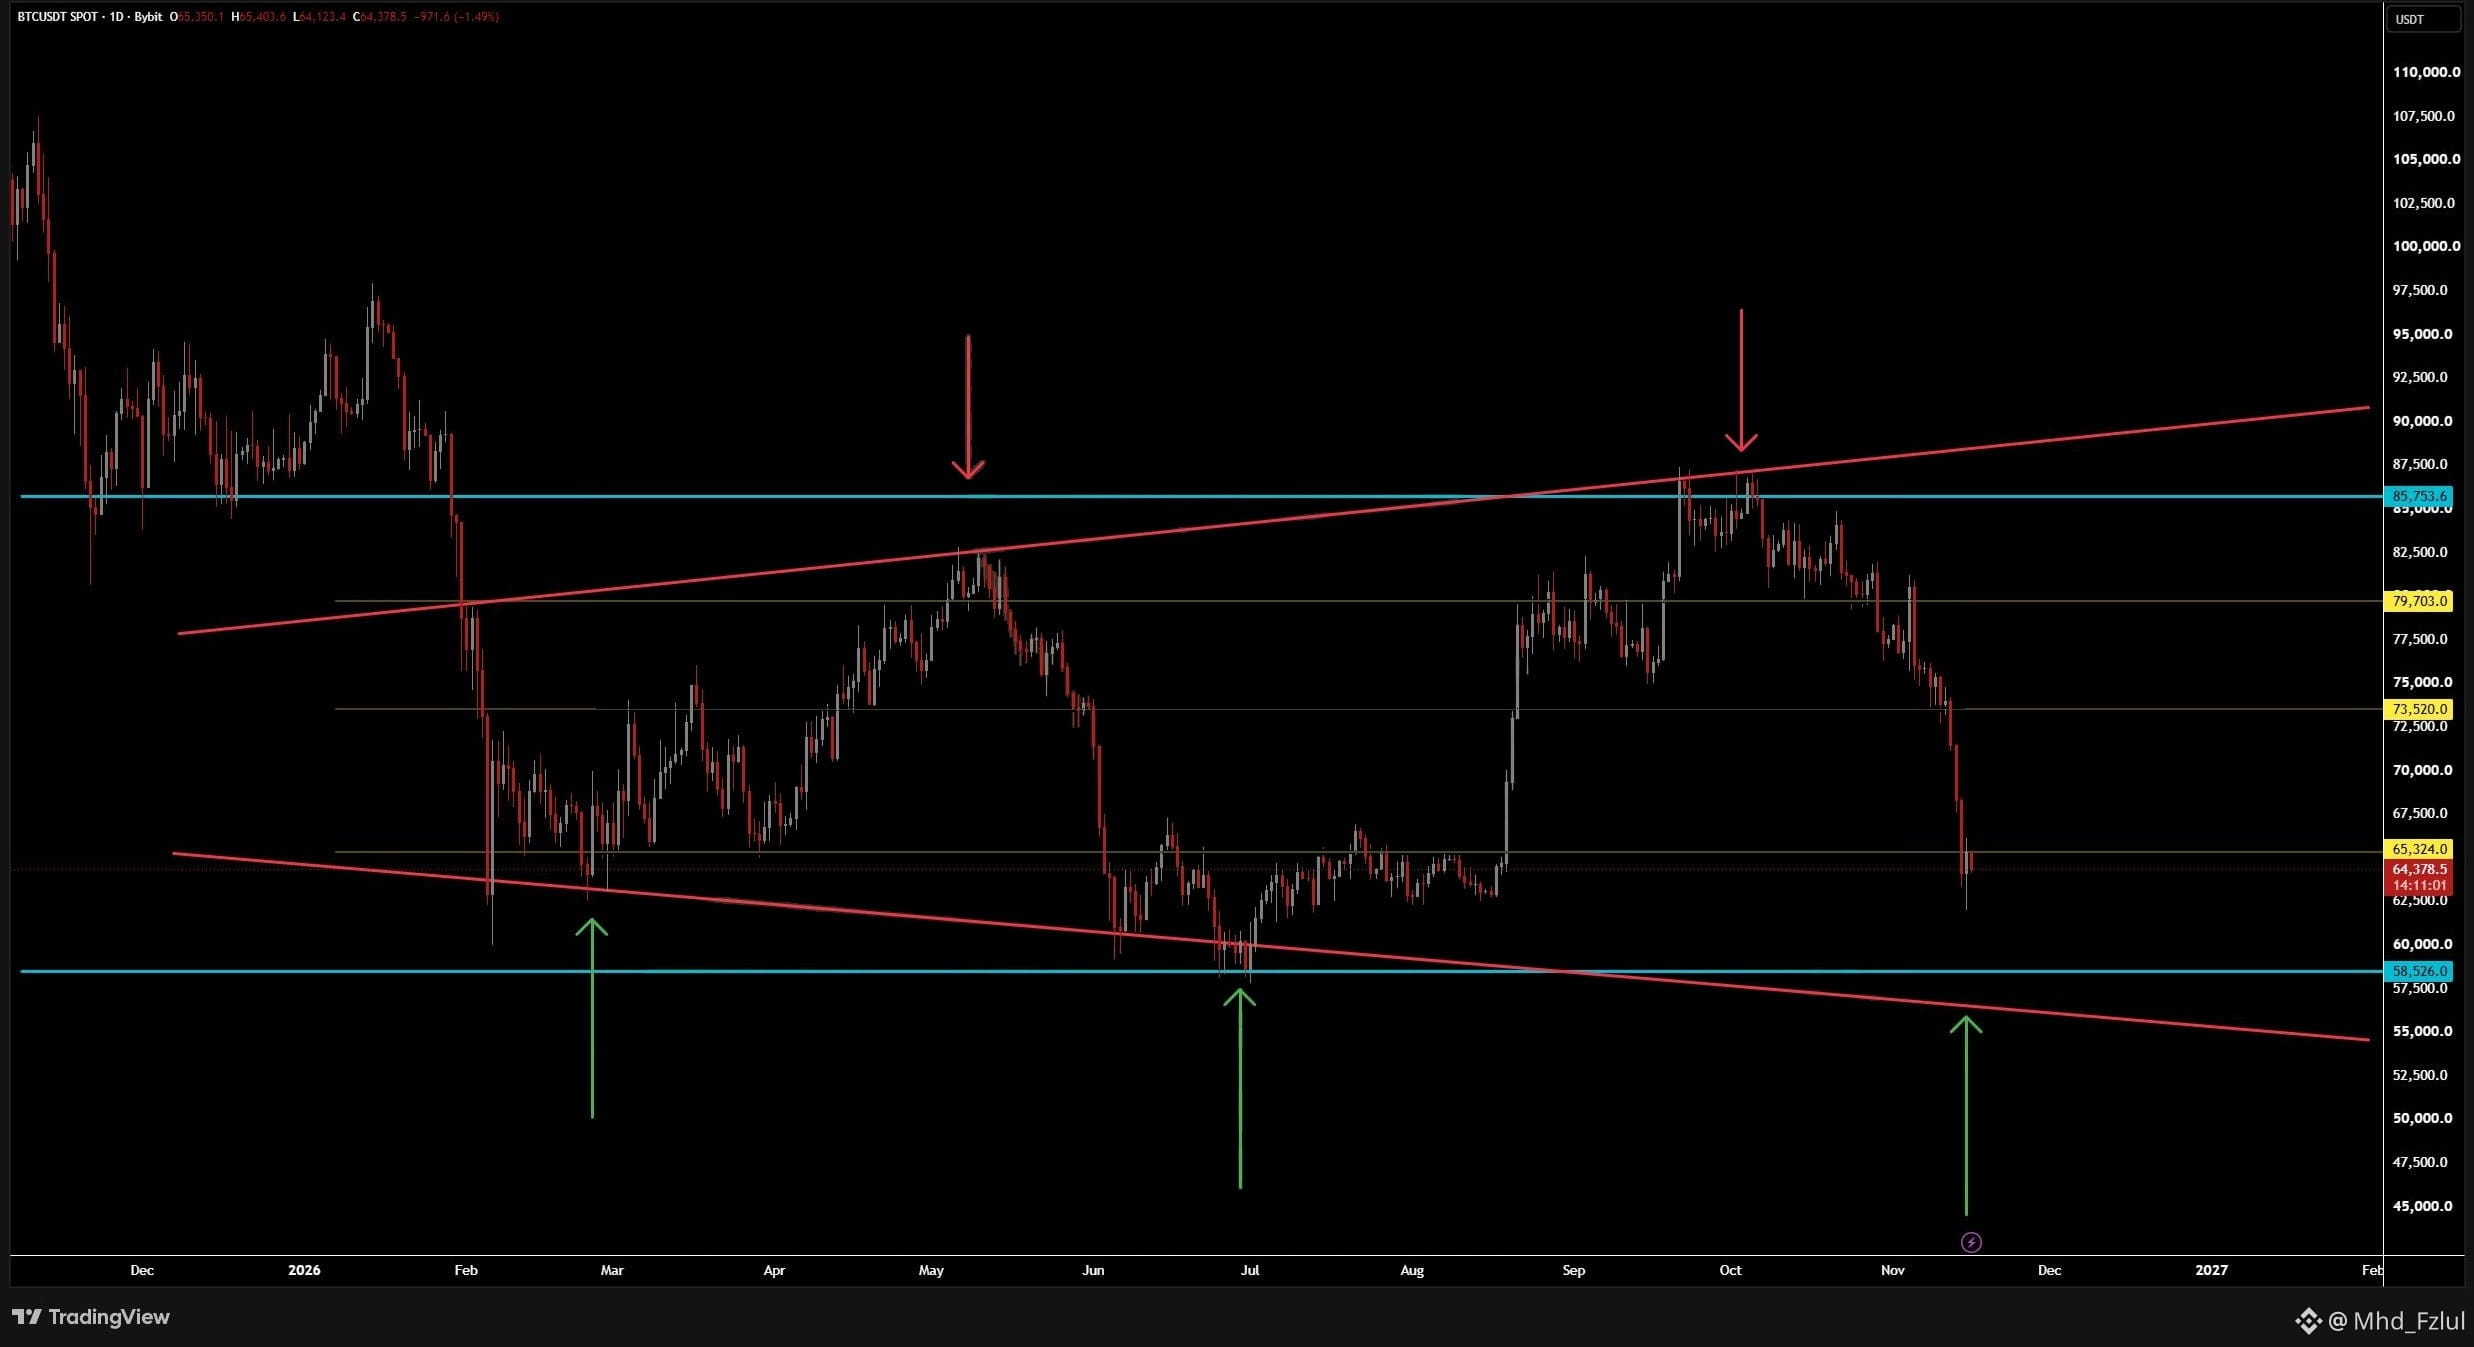
$BTC : MASSIVE BROADENING TRIANGLE
We have to zoom out in times like this now.
What if Bitcoin is simply moving inside a massive symmetrical broadening triangle on the daily chart?
We’ve seen multiple rejections at the top and strong reactions at the bottom.
It’s bearish now, but let’s stay patient.
{future}(BTCUSDT)
@Mhd_Fzlul #Mhd_Fzlul
#BTC
$BTC : MASSIVE BROADENING TRIANGLE
We have to zoom out in times like this now.
What if Bitcoin is simply moving inside a massive symmetrical broadening triangle on the daily chart?
We’ve seen multiple rejections at the top and strong reactions at the bottom.
It’s bearish now, but let’s stay patient.
@Mhd_Fzlul #Mhd_Fzlul
#BTC
We have to zoom out in times like this now.
What if Bitcoin is simply moving inside a massive symmetrical broadening triangle on the daily chart?
We’ve seen multiple rejections at the top and strong reactions at the bottom.
It’s bearish now, but let’s stay patient.
@Mhd_Fzlul #Mhd_Fzlul
#BTC
2
164
·
--
Bearish
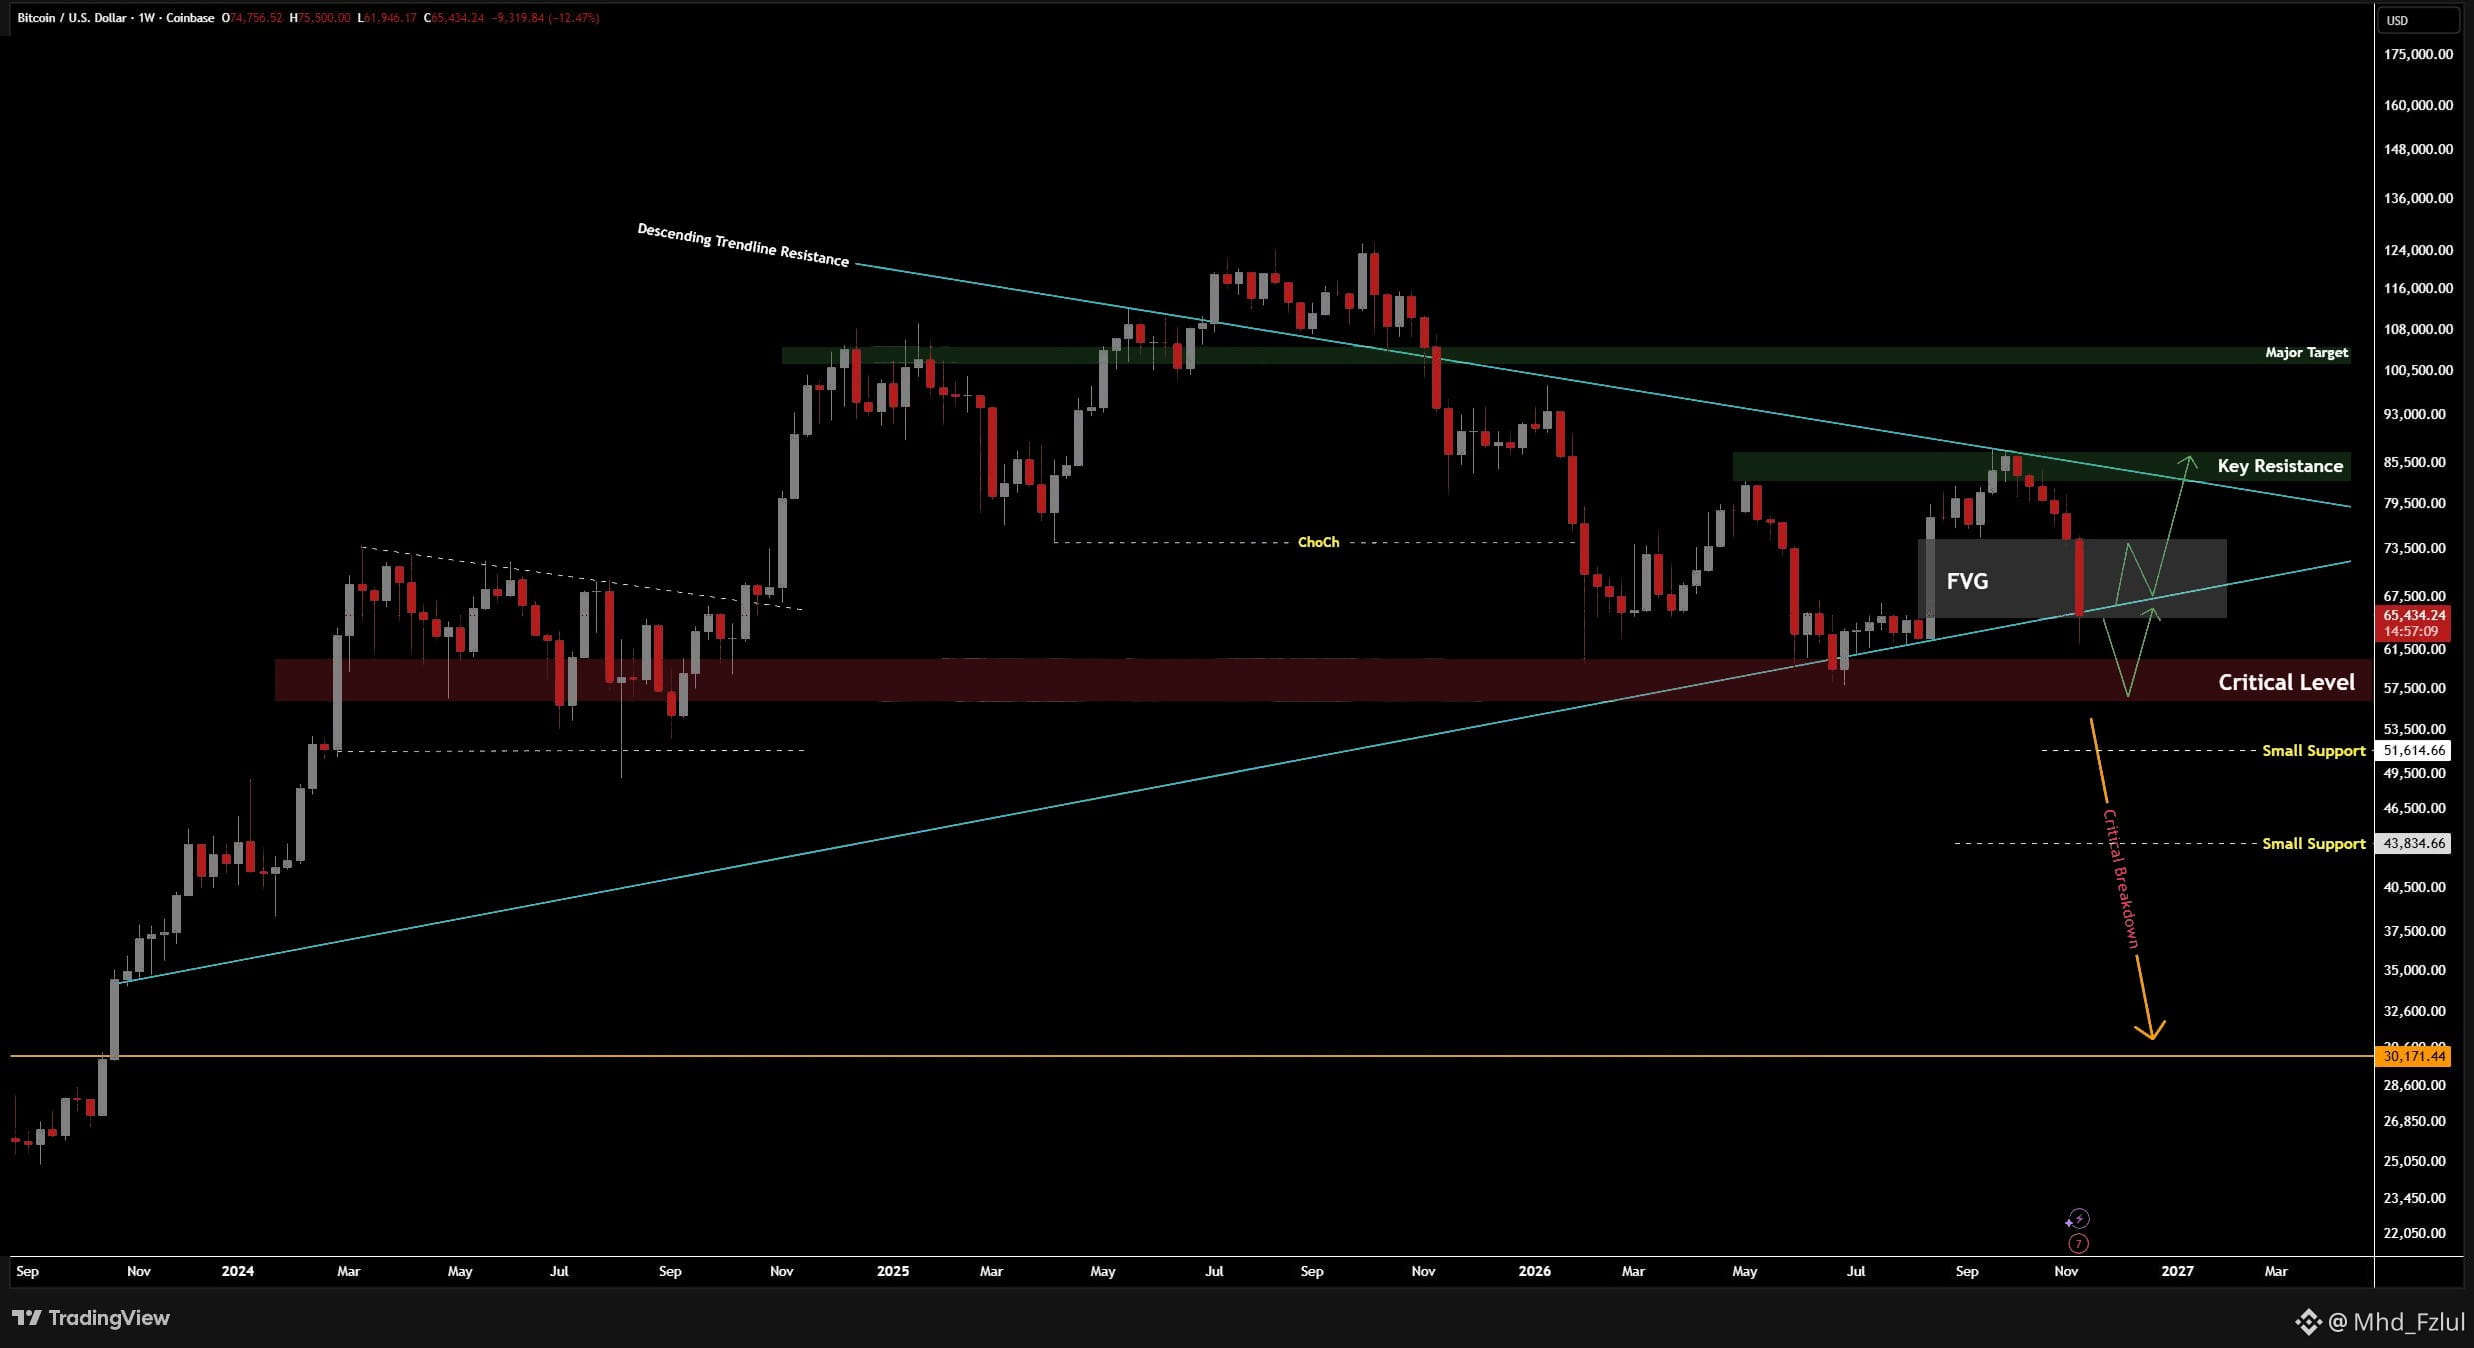
Let’s start again with $BTC and what’s there on the weekly chart.
The $60K–$57K zone is very much possible if we see another breakdown.
Losing $62K again, especially breaking below the last wick, could make things even uglier.
$62k was the only support that we could get a proper bounce from!
For now, I’m watching these levels closely. No reason to rush into new trades without confirmation.
I’ll keep you updated as always so I’ll appreciate to stay with me 🙏❤️
@Mhd_Fzlul #Mhd_Fzlul
#BitcoinActiveSupplyInProfitDropsBelow45%
#BTC
{future}(BTCUSDT)
Let’s start again with $BTC and what’s there on the weekly chart.
The $60K–$57K zone is very much possible if we see another breakdown.
Losing $62K again, especially breaking below the last wick, could make things even uglier.
$62k was the only support that we could get a proper bounce from!
For now, I’m watching these levels closely. No reason to rush into new trades without confirmation.
I’ll keep you updated as always so I’ll appreciate to stay with me 🙏❤️
@Mhd_Fzlul #Mhd_Fzlul
#BitcoinActiveSupplyInProfitDropsBelow45%
#BTC
The $60K–$57K zone is very much possible if we see another breakdown.
Losing $62K again, especially breaking below the last wick, could make things even uglier.
$62k was the only support that we could get a proper bounce from!
For now, I’m watching these levels closely. No reason to rush into new trades without confirmation.
I’ll keep you updated as always so I’ll appreciate to stay with me 🙏❤️
@Mhd_Fzlul #Mhd_Fzlul
#BitcoinActiveSupplyInProfitDropsBelow45%
#BTC
1
204
·
--
Bearish
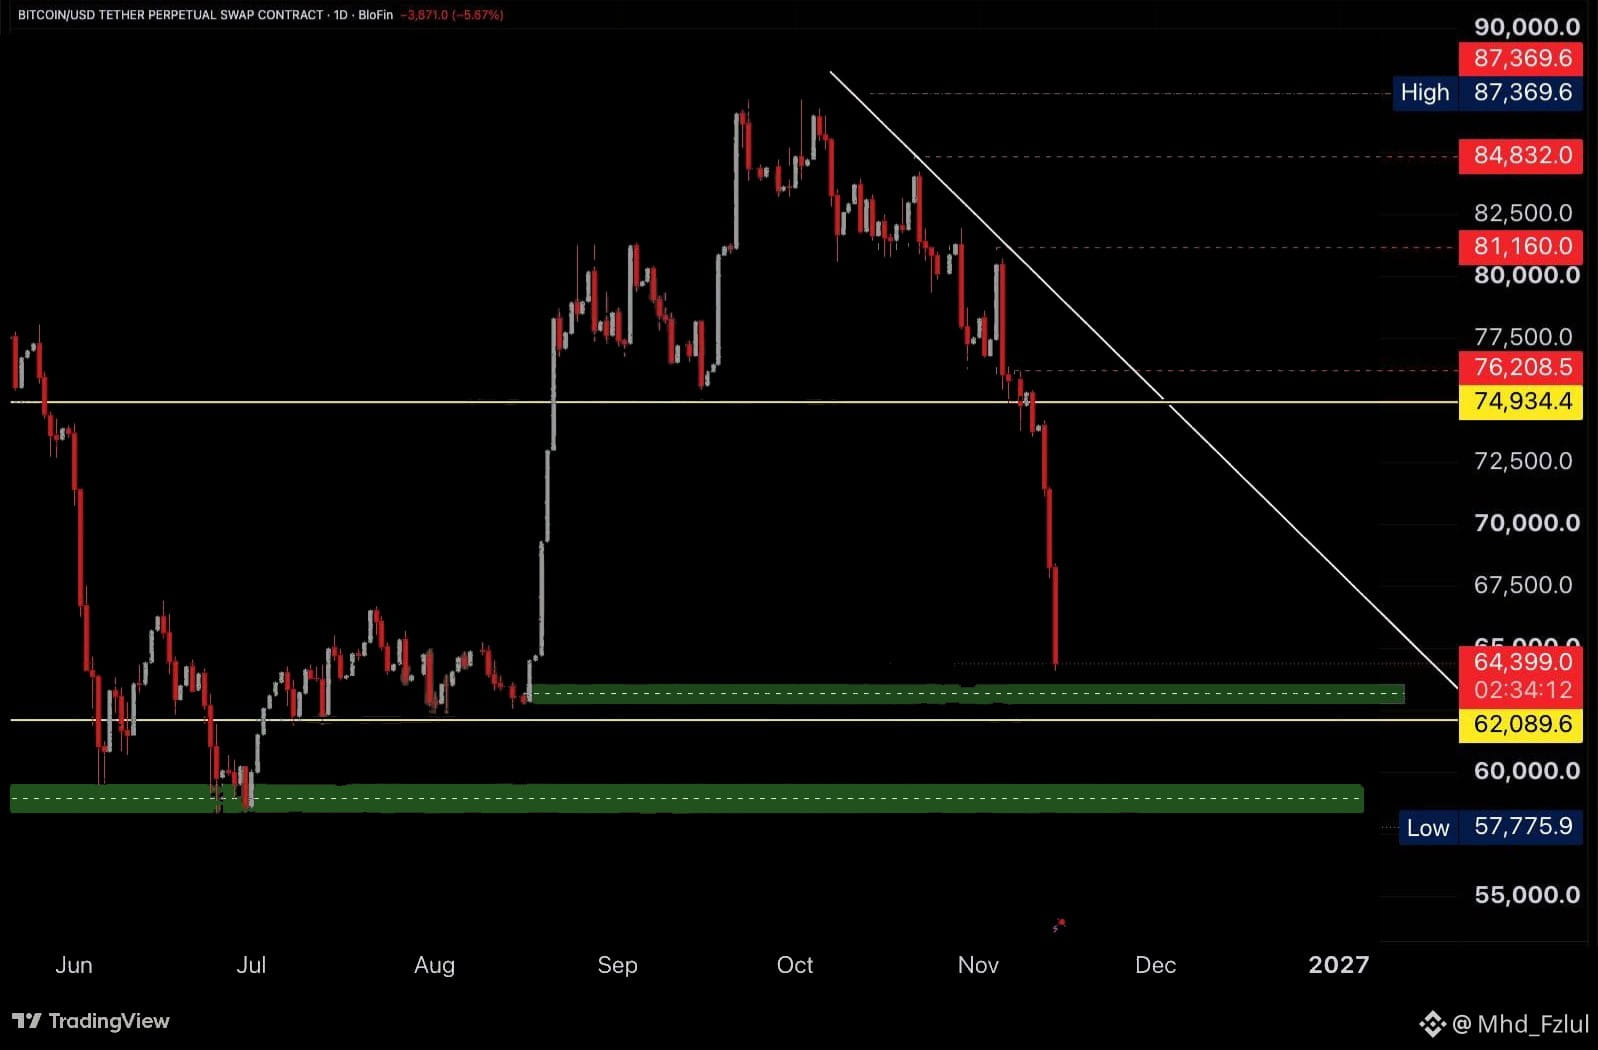
Your job is to know when market is not tradable.
Stay patient, protect your capital, and we’ll make money soon !!👇
@Mhd_Fzlul #Mhd_Fzlul
#BitcoinActiveSupplyInProfitDropsBelow45%
#BTC
$BTC
{future}(BTCUSDT)
Your job is to know when market is not tradable.
Stay patient, protect your capital, and we’ll make money soon !!👇
@Mhd_Fzlul #Mhd_Fzlul
#BitcoinActiveSupplyInProfitDropsBelow45%
#BTC
$BTC
Stay patient, protect your capital, and we’ll make money soon !!👇
@Mhd_Fzlul #Mhd_Fzlul
#BitcoinActiveSupplyInProfitDropsBelow45%
#BTC
$BTC
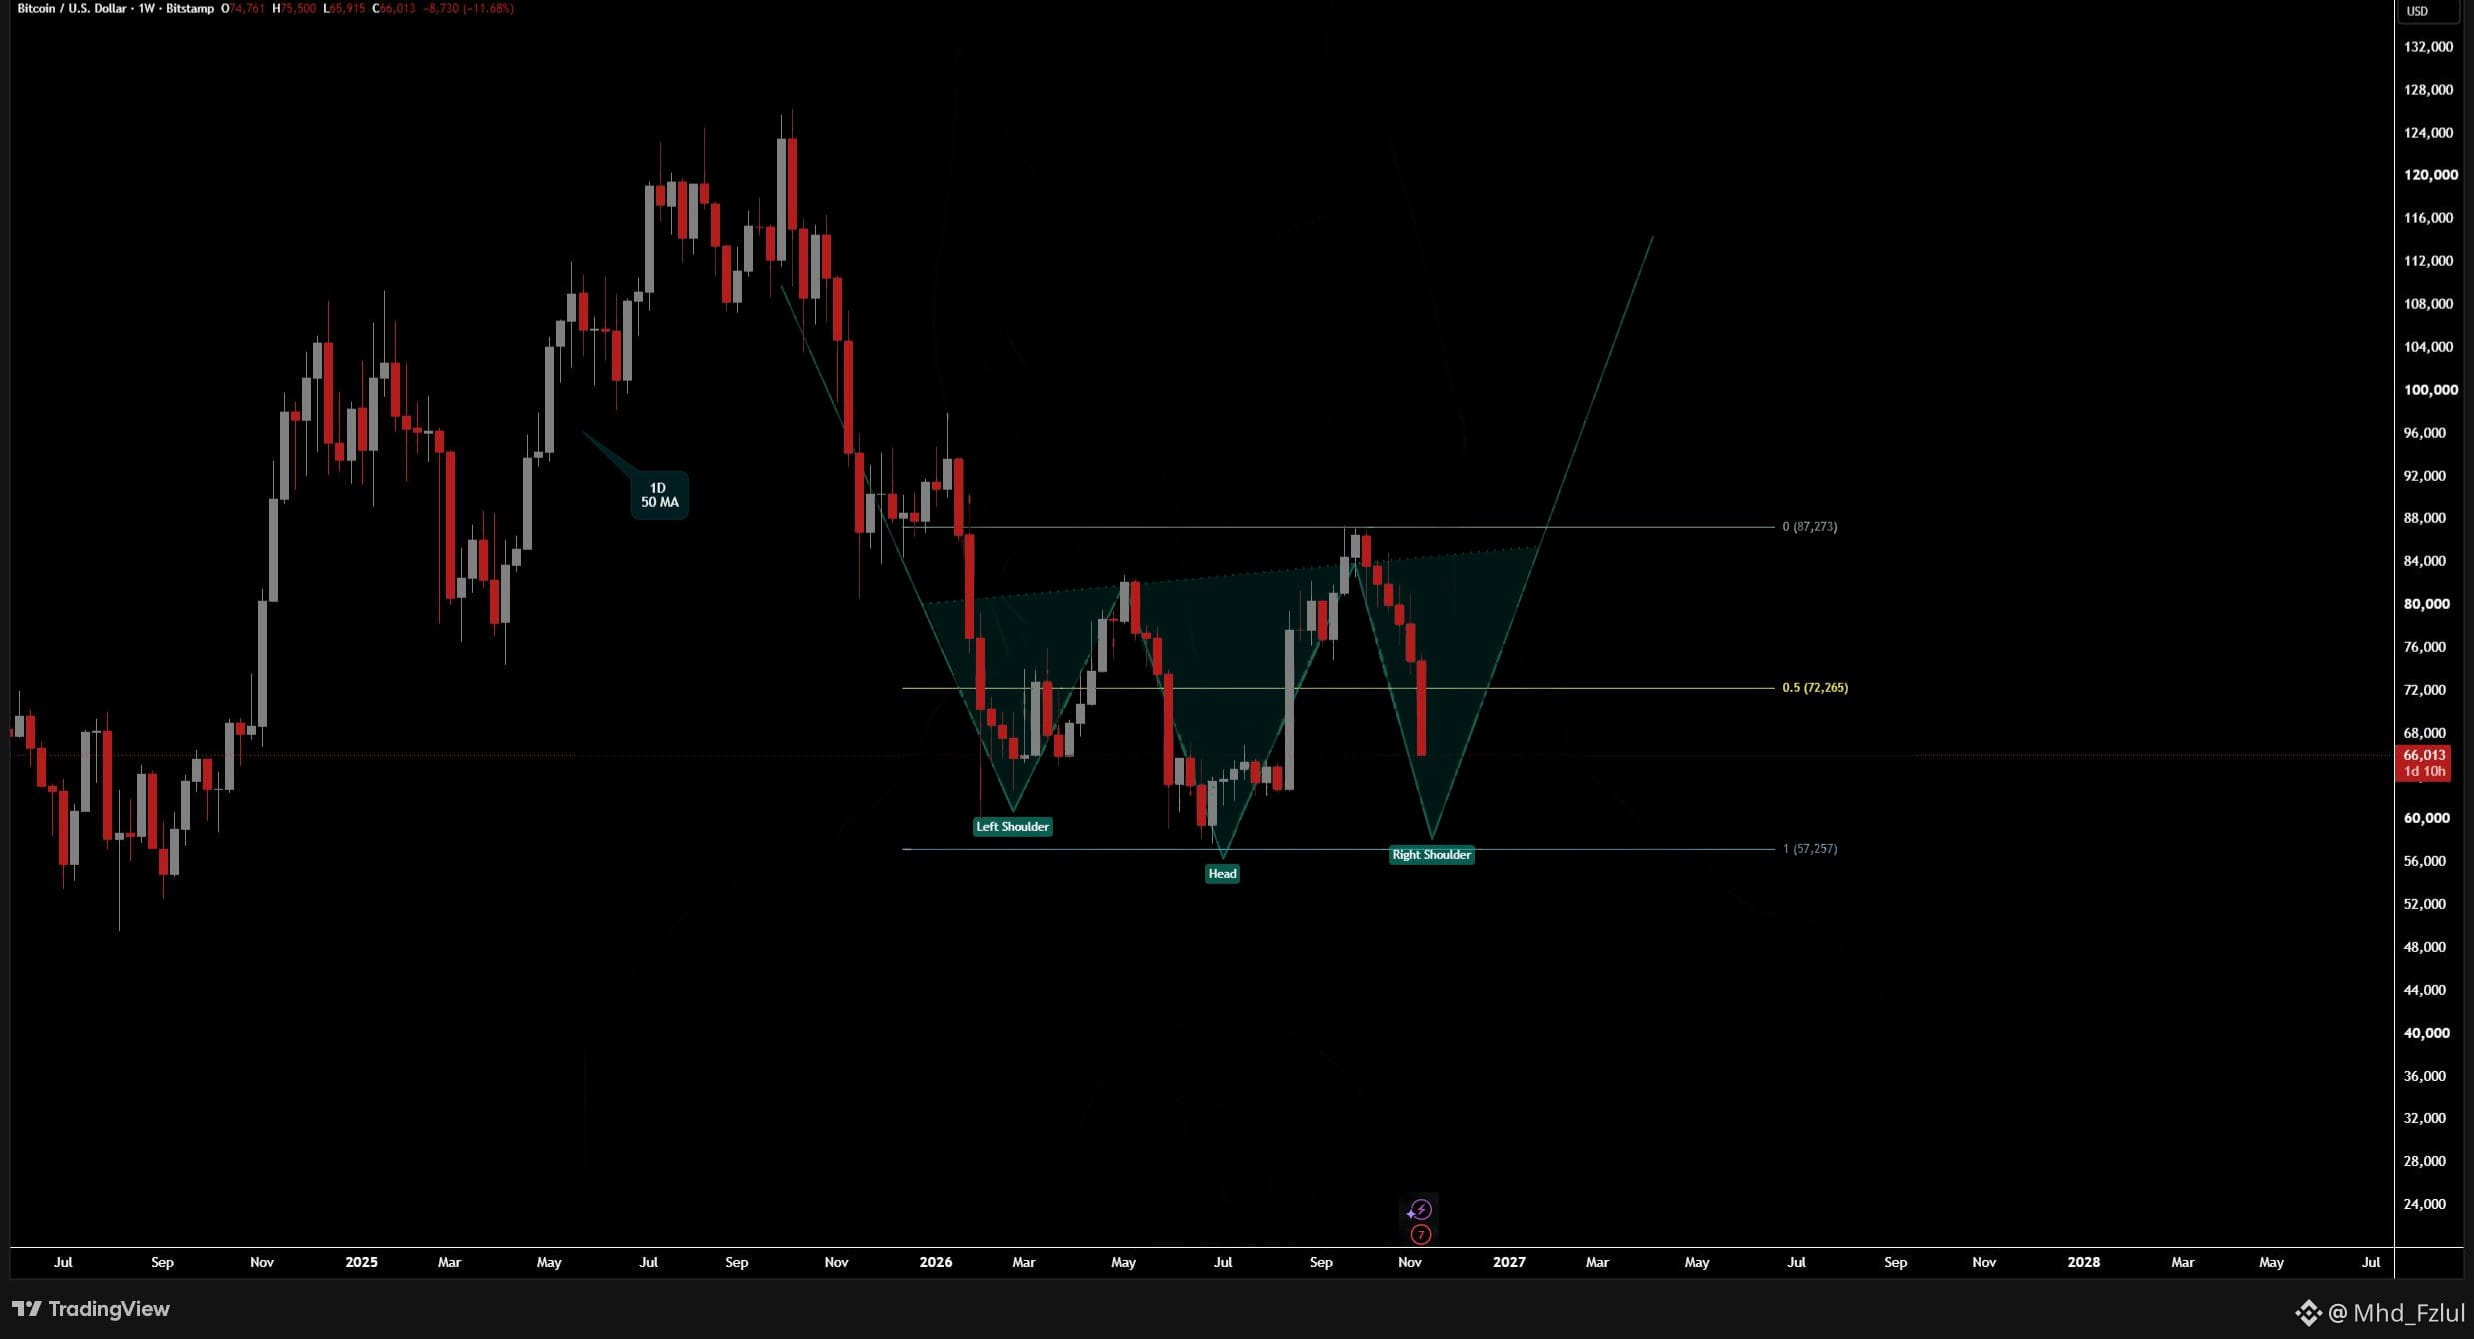
Mhd_Fzlul
·
--
The Critical movement😬🩺🔥
@Mhd_Fzlul #Mhd_Fzlul
#BTC #WhatWillDriveCryptoandStocks’NextRebound?
@Mhd_Fzlul #Mhd_Fzlul
#BTC #WhatWillDriveCryptoandStocks’NextRebound?
1
1
197
·
--
Bearish
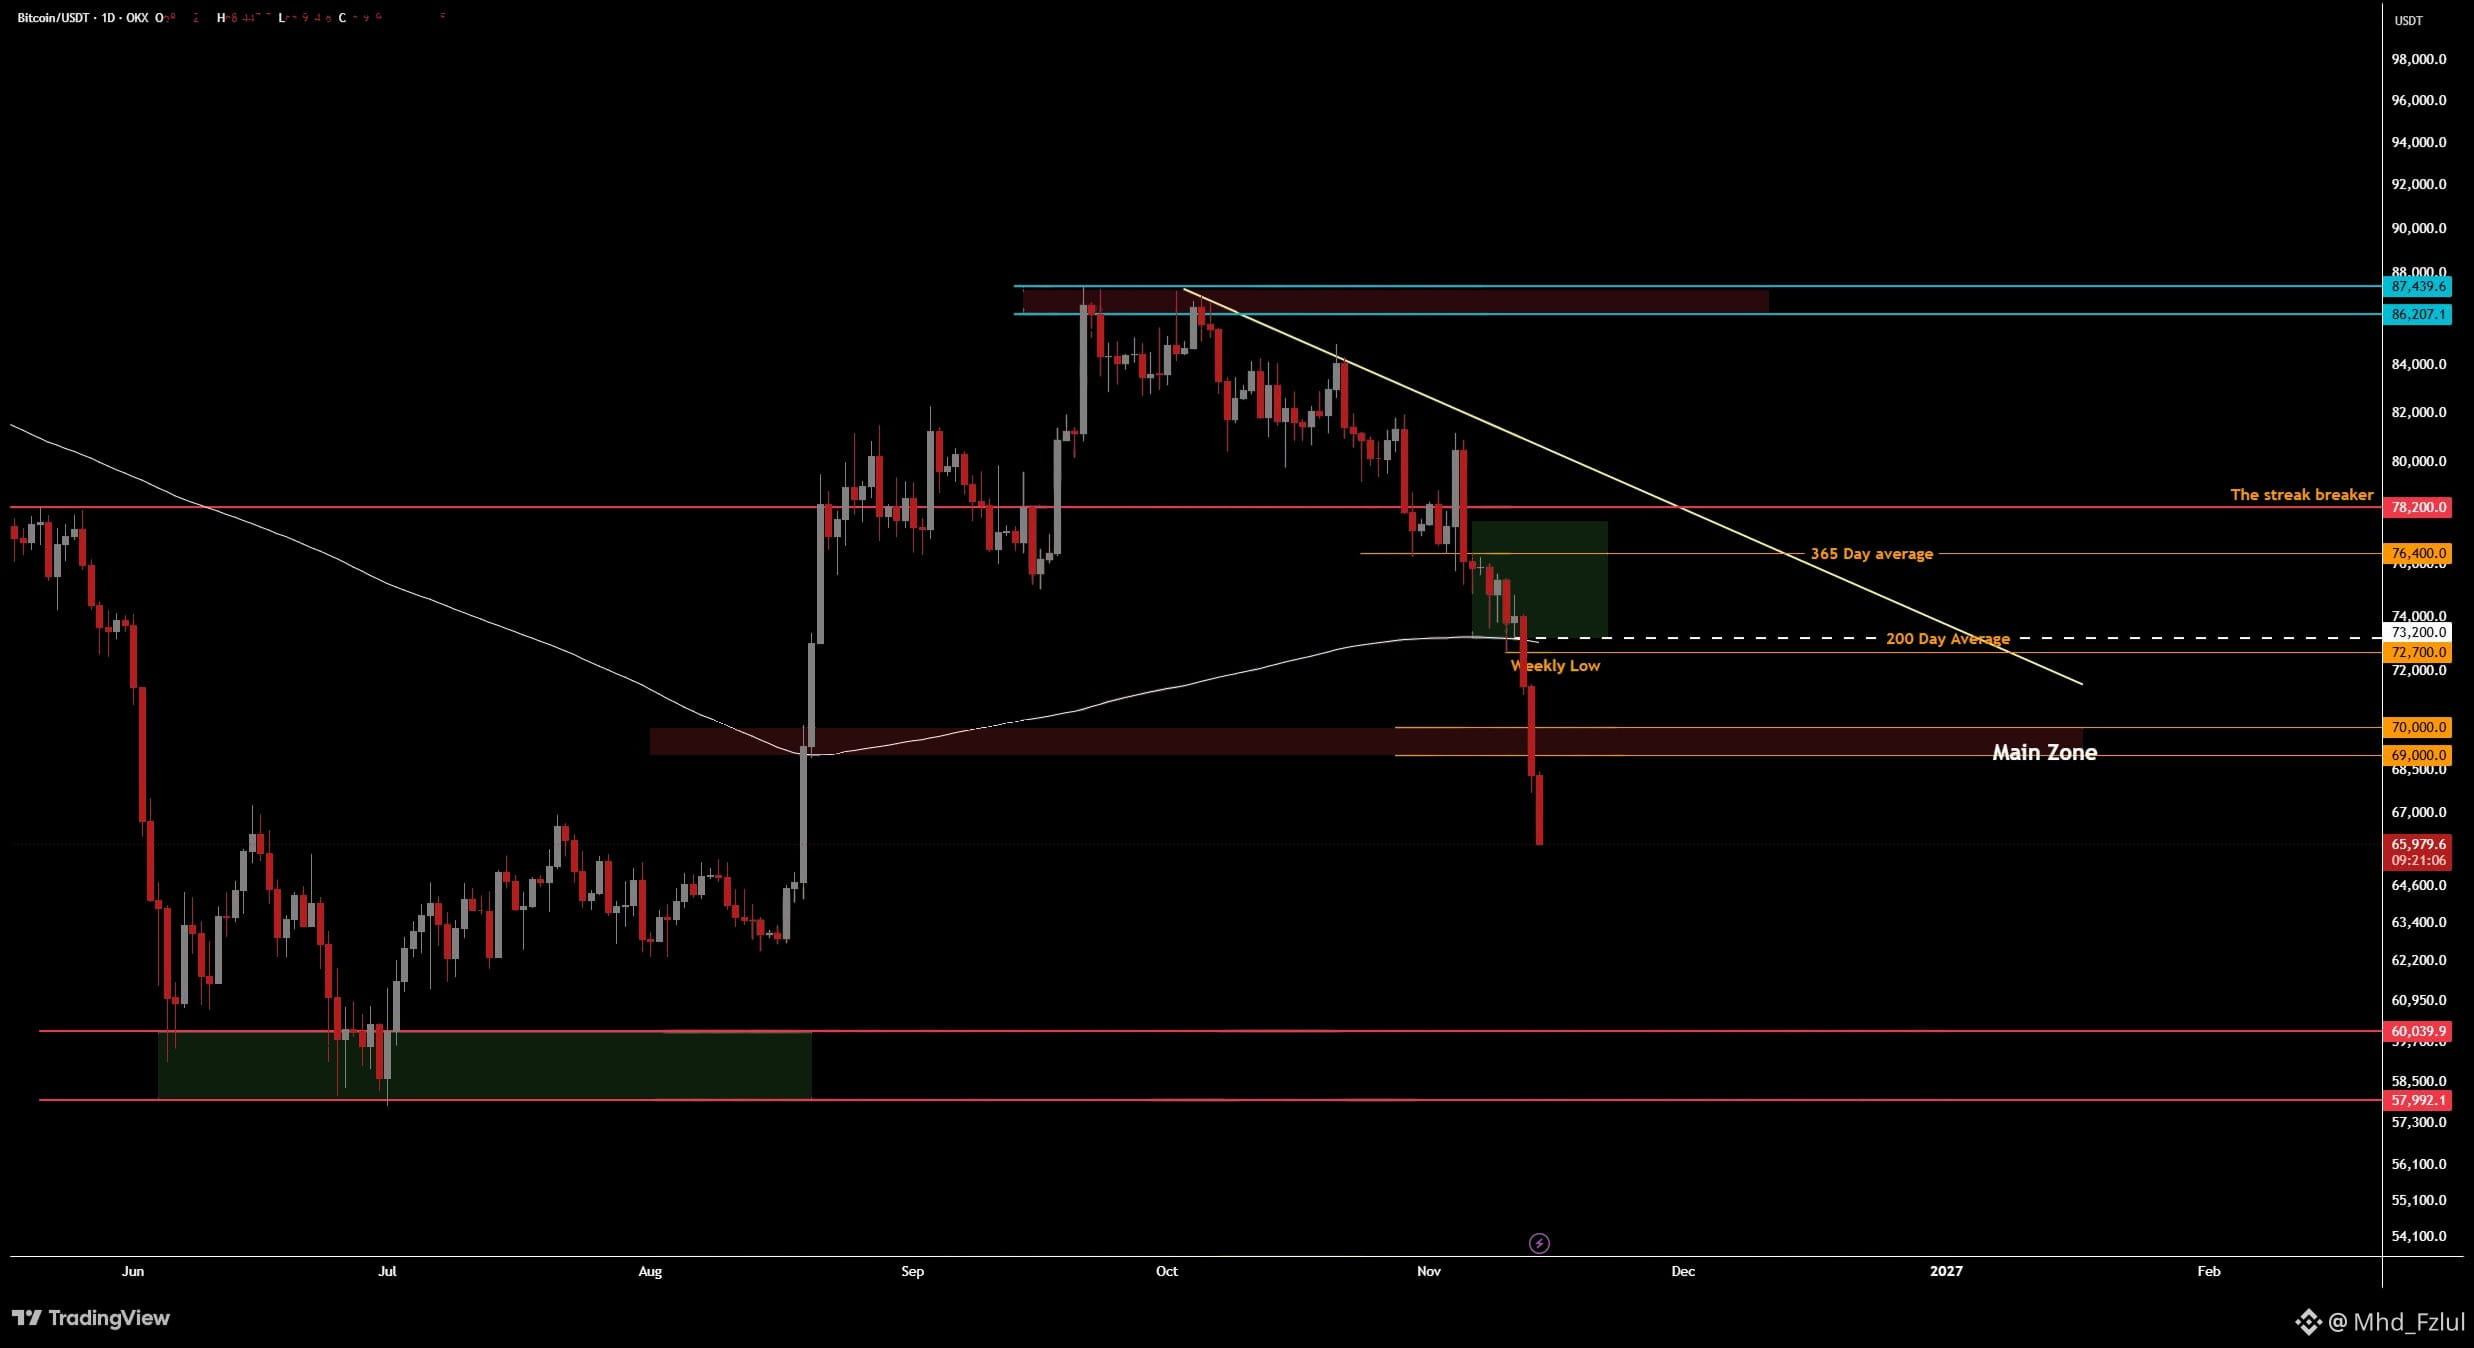
Thank me later. I might’ve saved you from this dump.
While other channels were spamming longs, we had a clear invalidation. Below $70K was danger territory.
$BTC dumping even on weekends🩸
{future}(BTCUSDT)
@Mhd_Fzlul #Mhd_Fzlul
#BitcoinActiveSupplyInProfitDropsBelow45% #BTC
Thank me later. I might’ve saved you from this dump.
While other channels were spamming longs, we had a clear invalidation. Below $70K was danger territory.
$BTC dumping even on weekends🩸
@Mhd_Fzlul #Mhd_Fzlul
#BitcoinActiveSupplyInProfitDropsBelow45% #BTC
While other channels were spamming longs, we had a clear invalidation. Below $70K was danger territory.
$BTC dumping even on weekends🩸
@Mhd_Fzlul #Mhd_Fzlul
#BitcoinActiveSupplyInProfitDropsBelow45% #BTC
Mhd_Fzlul
·
--
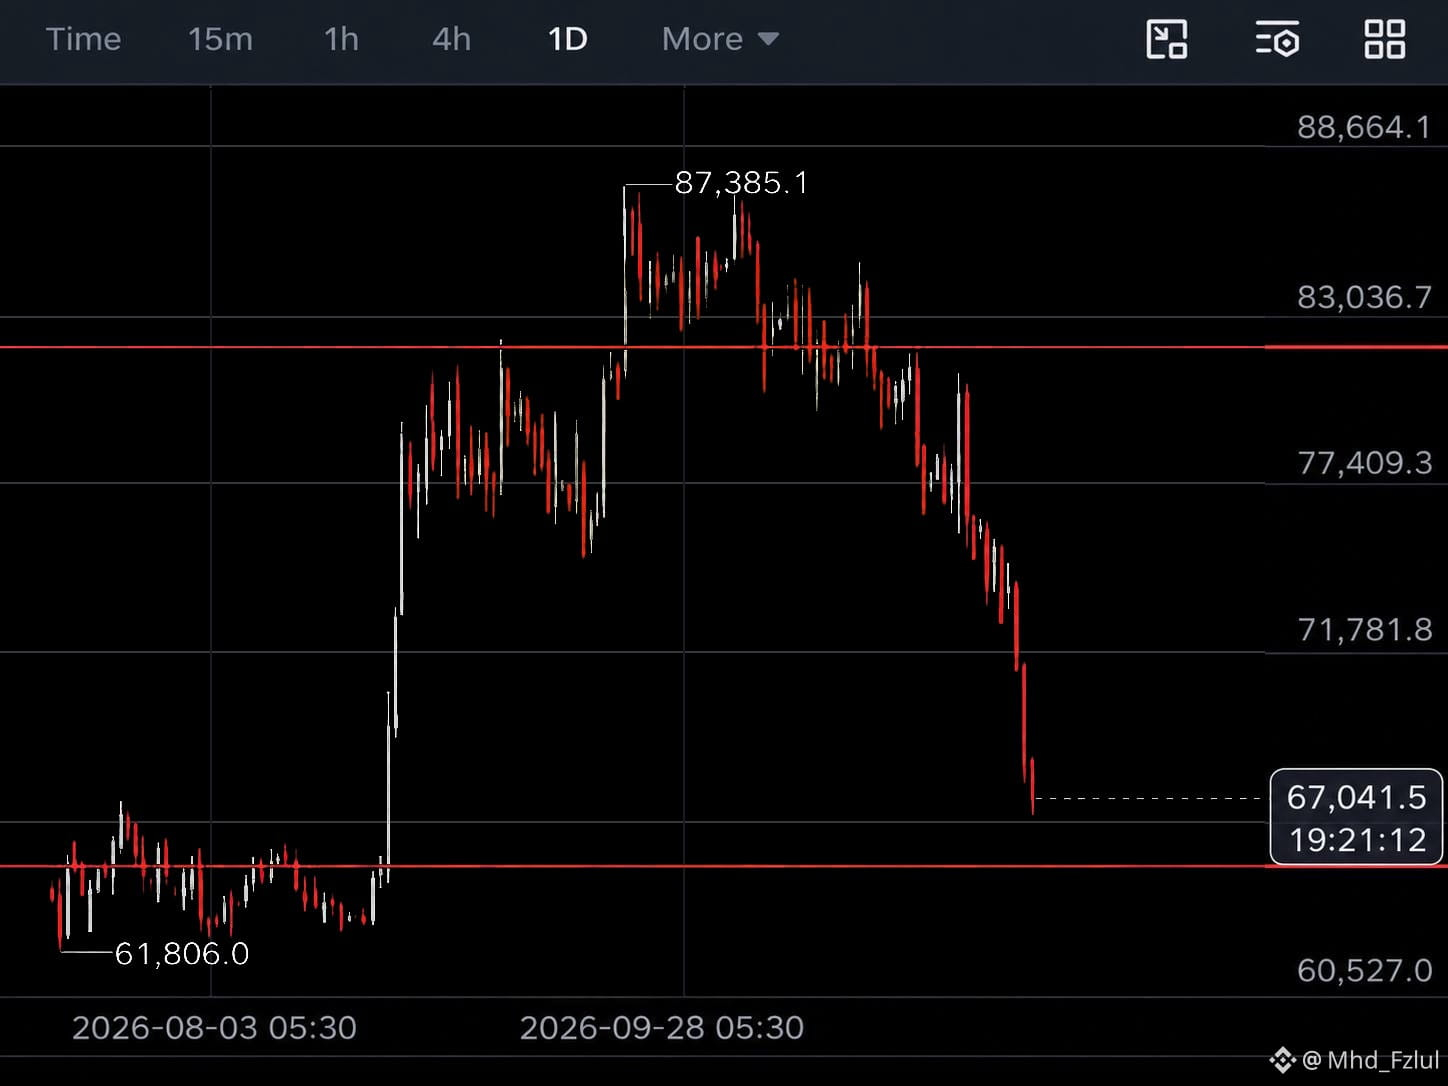
Simple Bart formation, people laugh about it but it happens so many times.
The amount of people longing below $70k is crazy, that’s why we keep dumping
@Mhd_Fzlul #Mhd_Fzlul
$BTC
#BTC
The amount of people longing below $70k is crazy, that’s why we keep dumping
@Mhd_Fzlul #Mhd_Fzlul
$BTC
#BTC
1
152
·
--
Simple Bart formation, people laugh about it but it happens so many times.
The amount of people longing below $70k is crazy, that’s why we keep dumping
@Mhd_Fzlul #Mhd_Fzlul
$BTC
{future}(BTCUSDT)
#BTC
Simple Bart formation, people laugh about it but it happens so many times.
The amount of people longing below $70k is crazy, that’s why we keep dumping
@Mhd_Fzlul #Mhd_Fzlul
$BTC
#BTC
The amount of people longing below $70k is crazy, that’s why we keep dumping
@Mhd_Fzlul #Mhd_Fzlul
$BTC
#BTC
1
1
302
·
--
Bullish
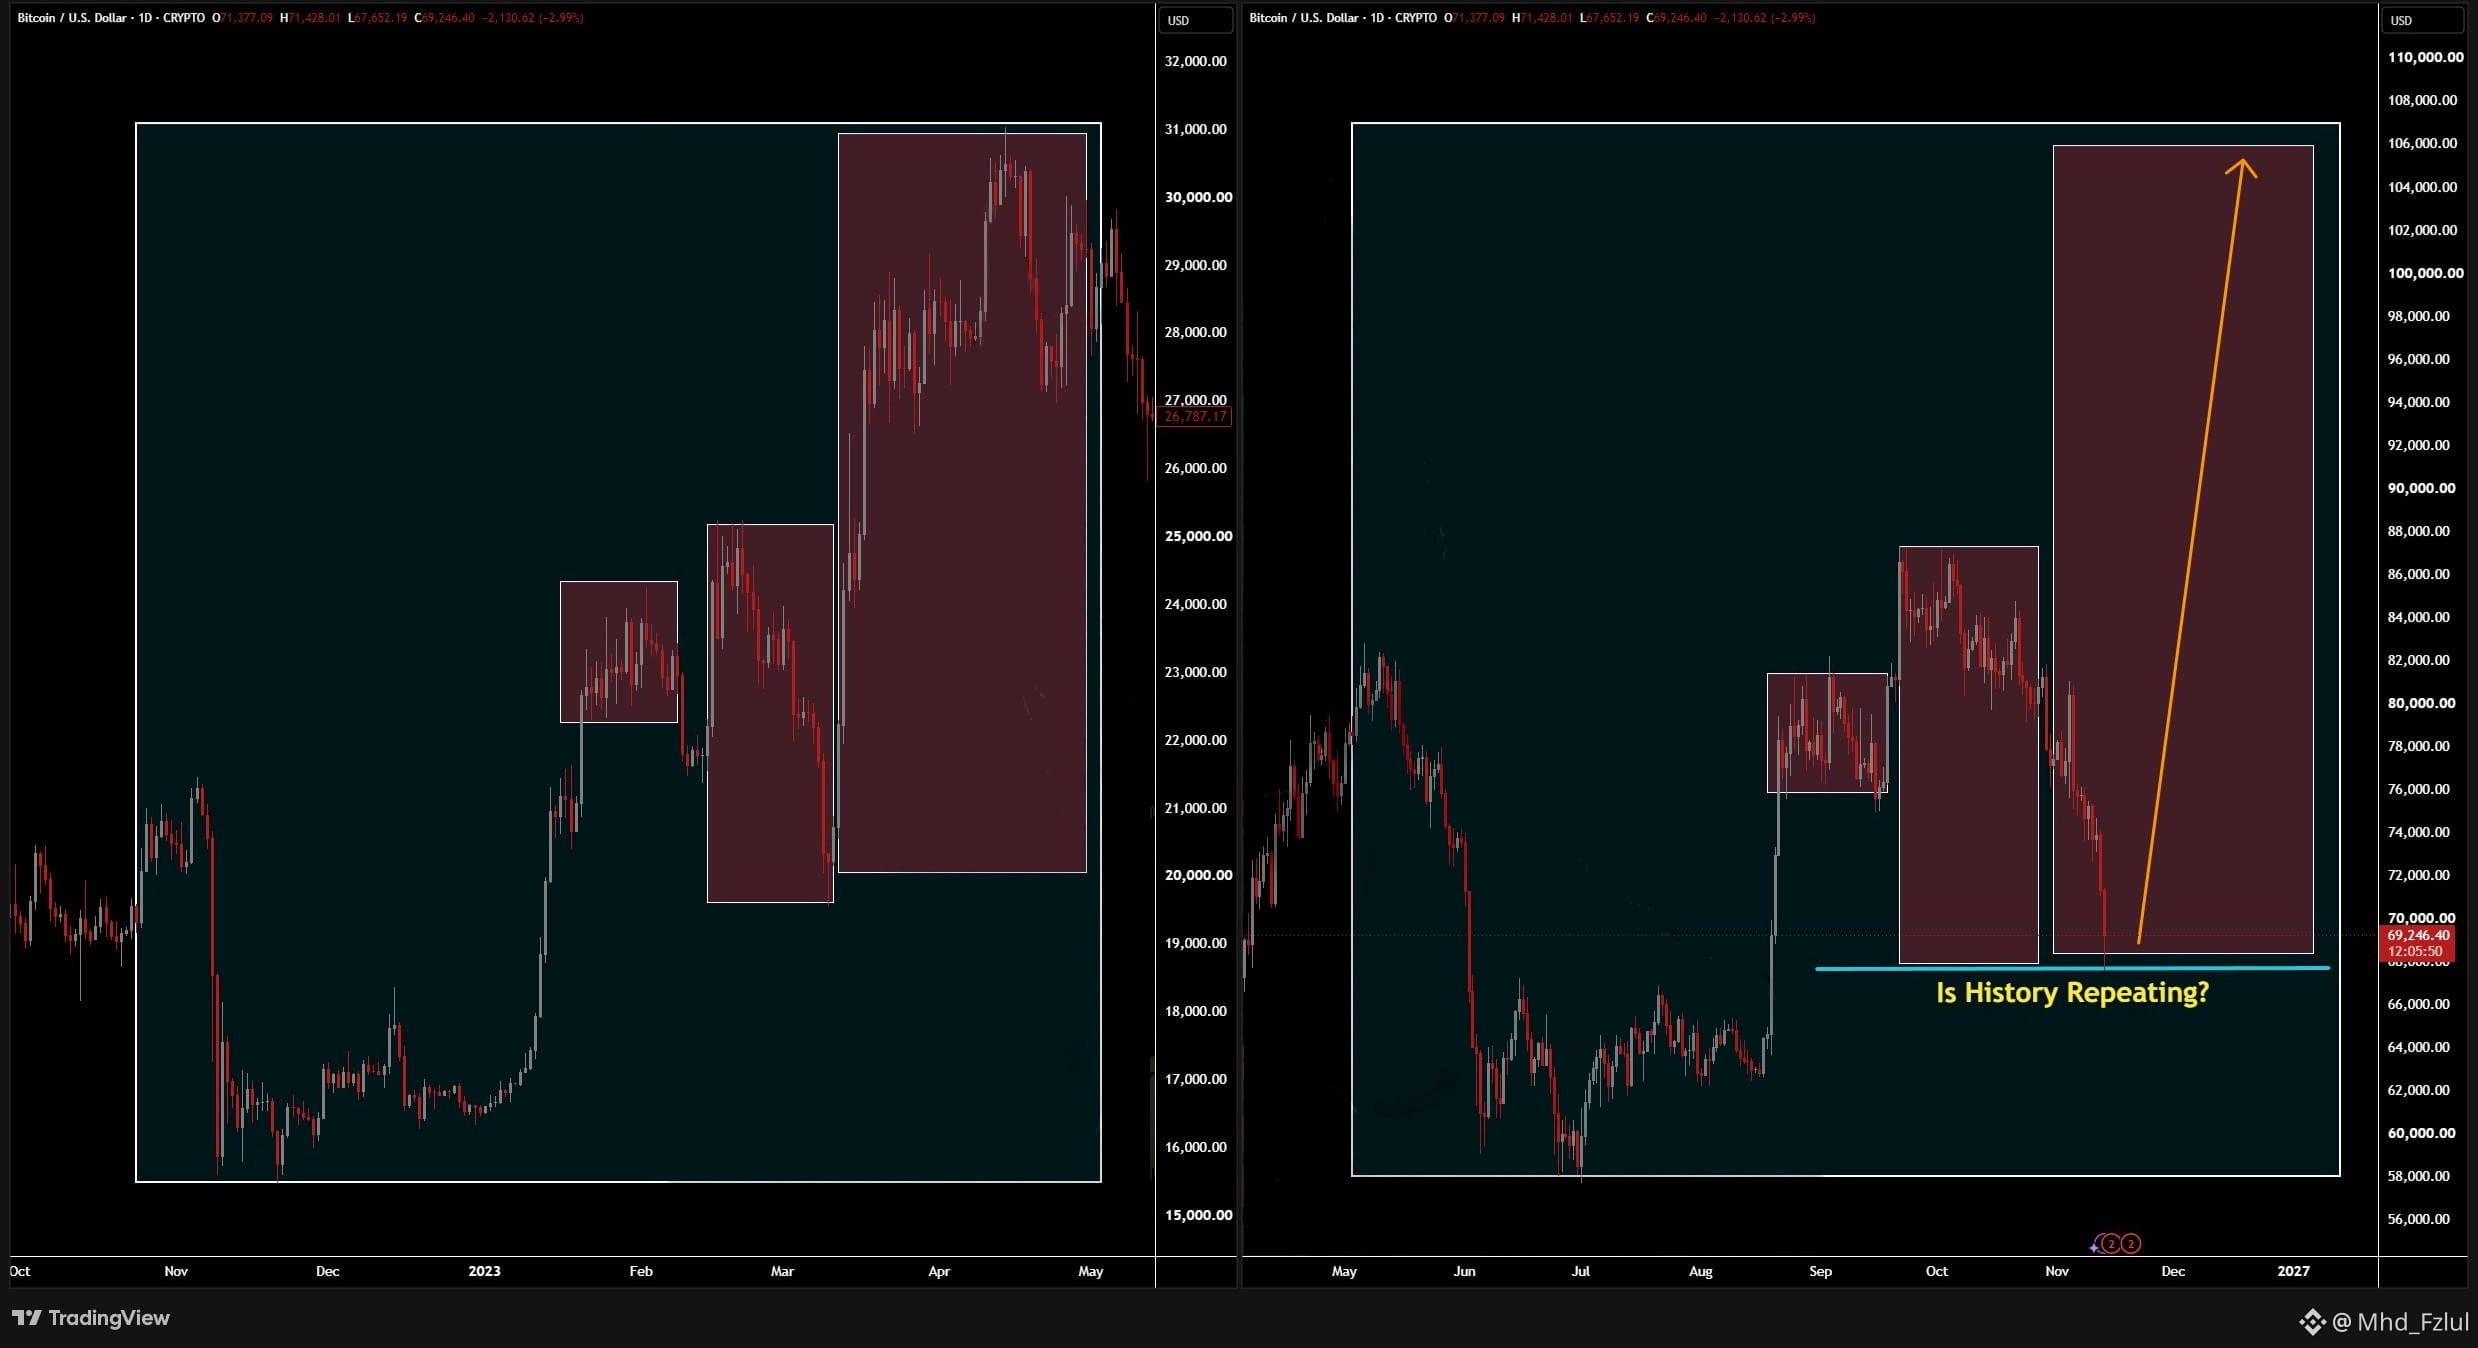
Just so you guys know, a scenario like 2023 is still possible.
Everything looks like capitulation, then out of nowhere they pump the price.
I think the chances are low, but I wouldn’t rule it out.
For now, I’ll wait for confirmation and take it step by step.
$BTC
{future}(BTCUSDT)
@Mhd_Fzlul #Mhd_Fzlul
#BitcoinCoreDisclosesTorTrafficVulnerability
#BitcoinBreaksBelow200WeekMovingAverage
Just so you guys know, a scenario like 2023 is still possible.
Everything looks like capitulation, then out of nowhere they pump the price.
I think the chances are low, but I wouldn’t rule it out.
For now, I’ll wait for confirmation and take it step by step.
$BTC
@Mhd_Fzlul #Mhd_Fzlul
#BitcoinCoreDisclosesTorTrafficVulnerability
#BitcoinBreaksBelow200WeekMovingAverage
Everything looks like capitulation, then out of nowhere they pump the price.
I think the chances are low, but I wouldn’t rule it out.
For now, I’ll wait for confirmation and take it step by step.
$BTC
@Mhd_Fzlul #Mhd_Fzlul
#BitcoinCoreDisclosesTorTrafficVulnerability
#BitcoinBreaksBelow200WeekMovingAverage
1
184
·
--
Mhd_Fzlul
·
--
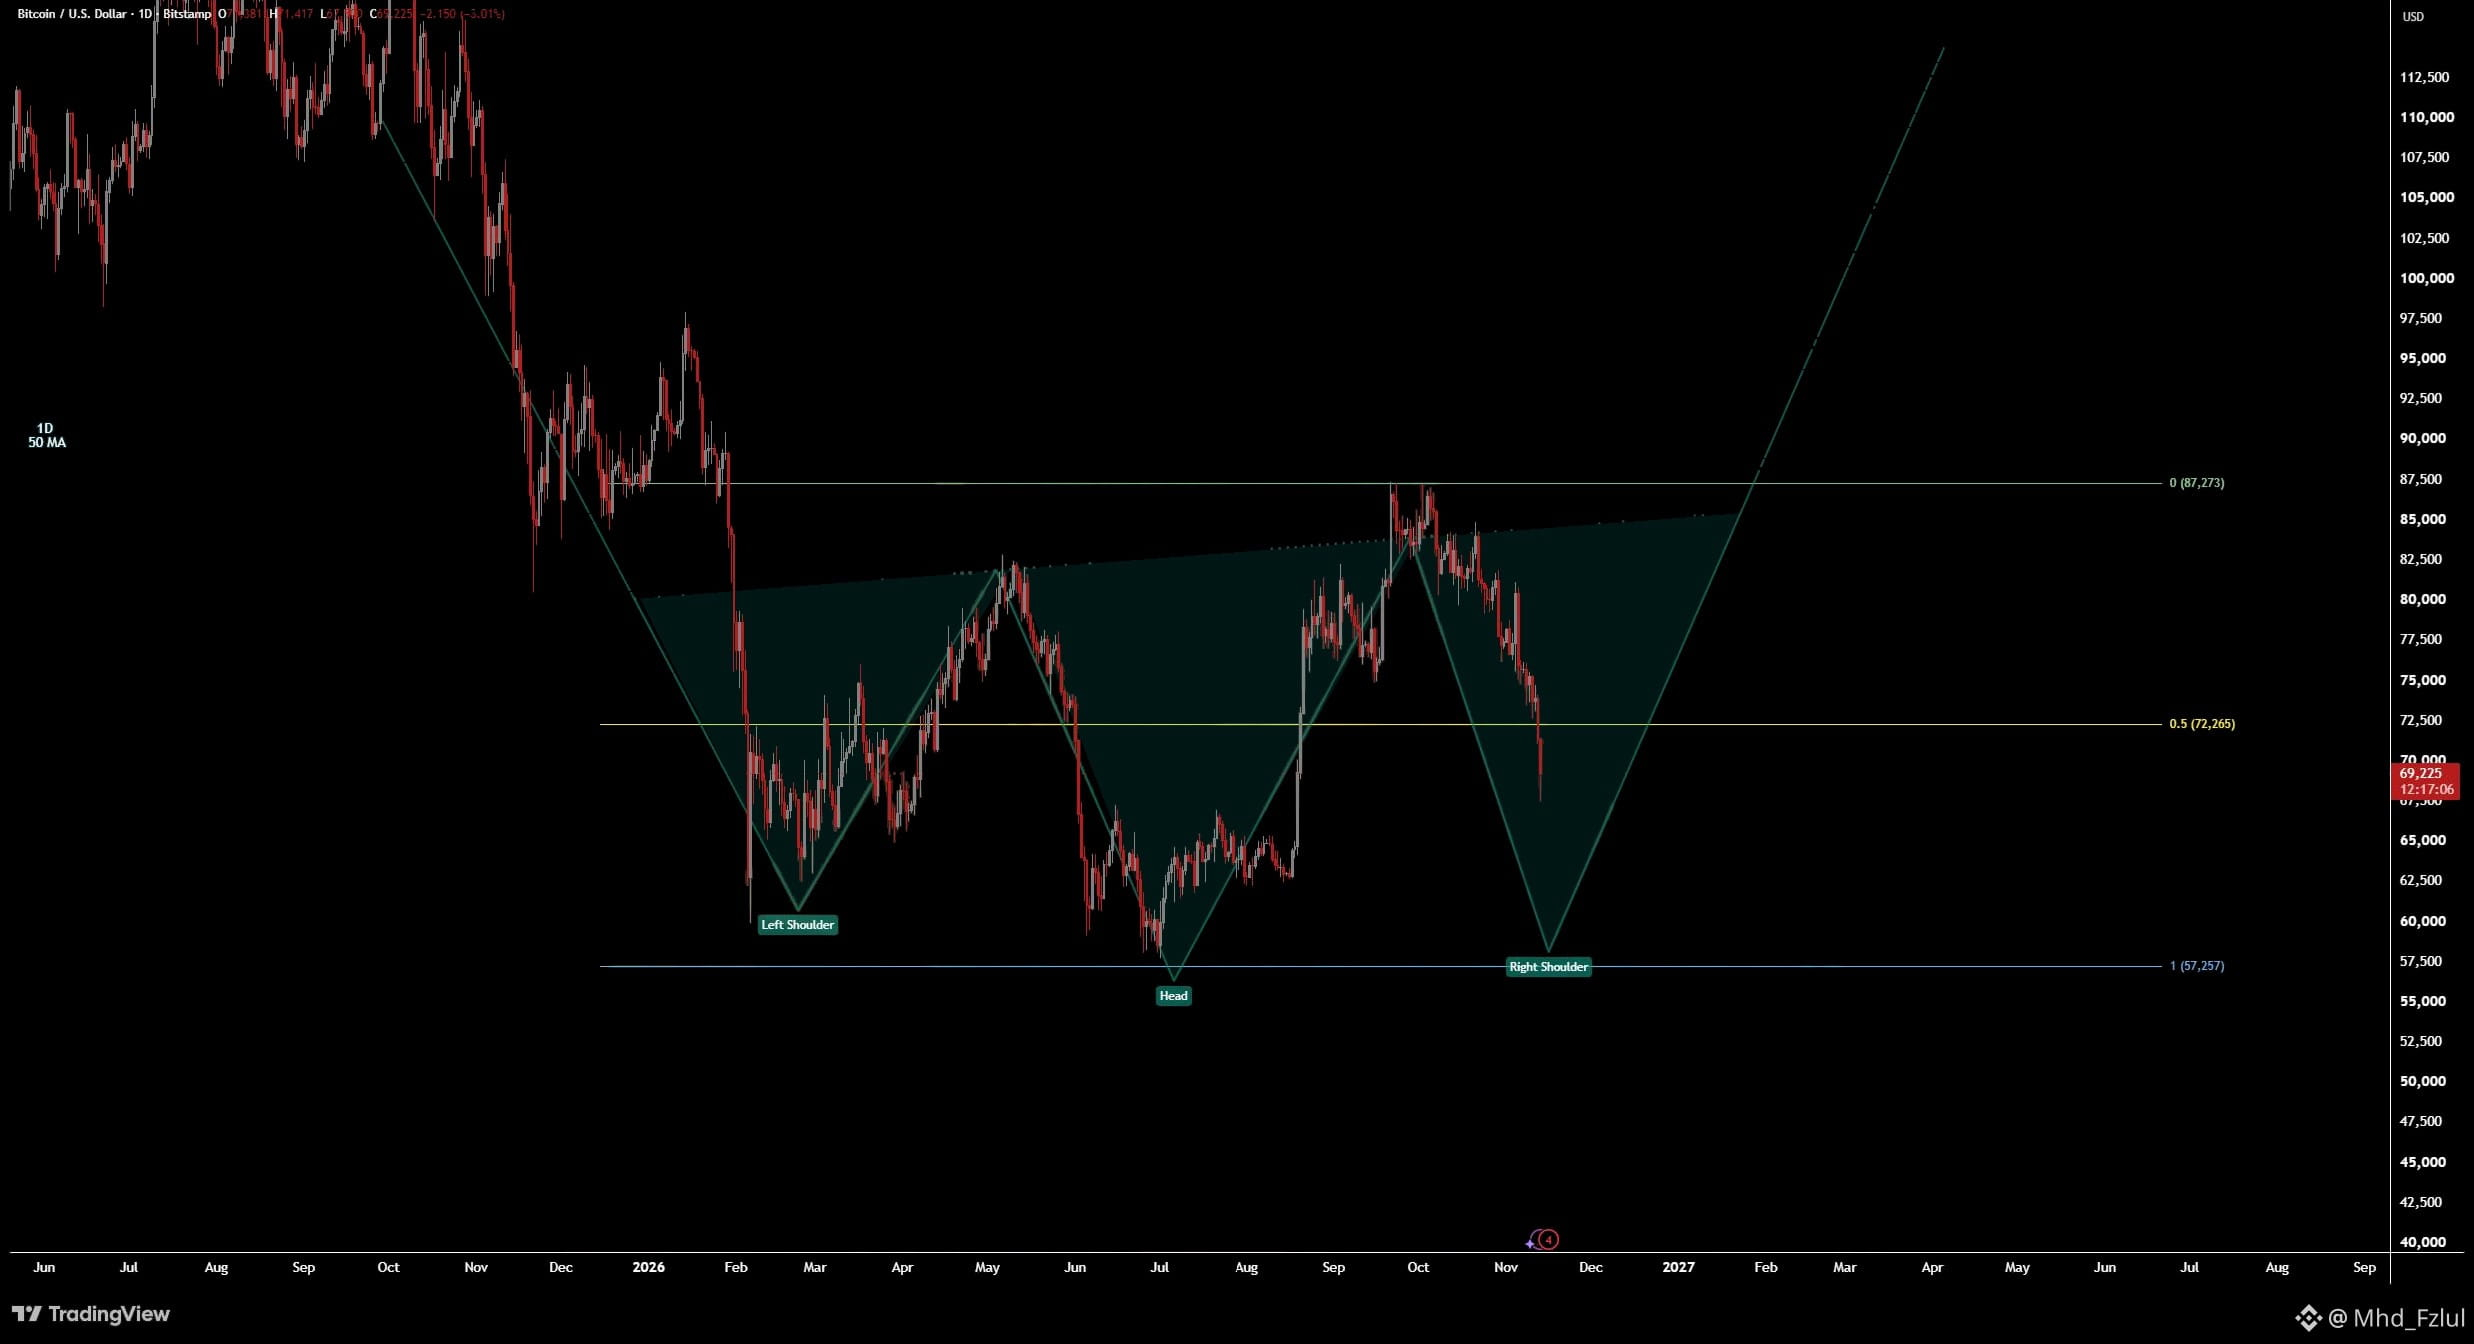
BullishI was right about the bigger picture since September. 🎯
But I got too focused on the lower timeframes (LTF) and lost sight of what the higher timeframes (HTF) were telling me all along.
$BTC
@Mhd_Fzlul #Mhd_Fzlul
#BTC #WhatWillDriveCryptoandStocks’NextRebound?
But I got too focused on the lower timeframes (LTF) and lost sight of what the higher timeframes (HTF) were telling me all along.
$BTC
@Mhd_Fzlul #Mhd_Fzlul
#BTC #WhatWillDriveCryptoandStocks’NextRebound?
1
1
104
·
--
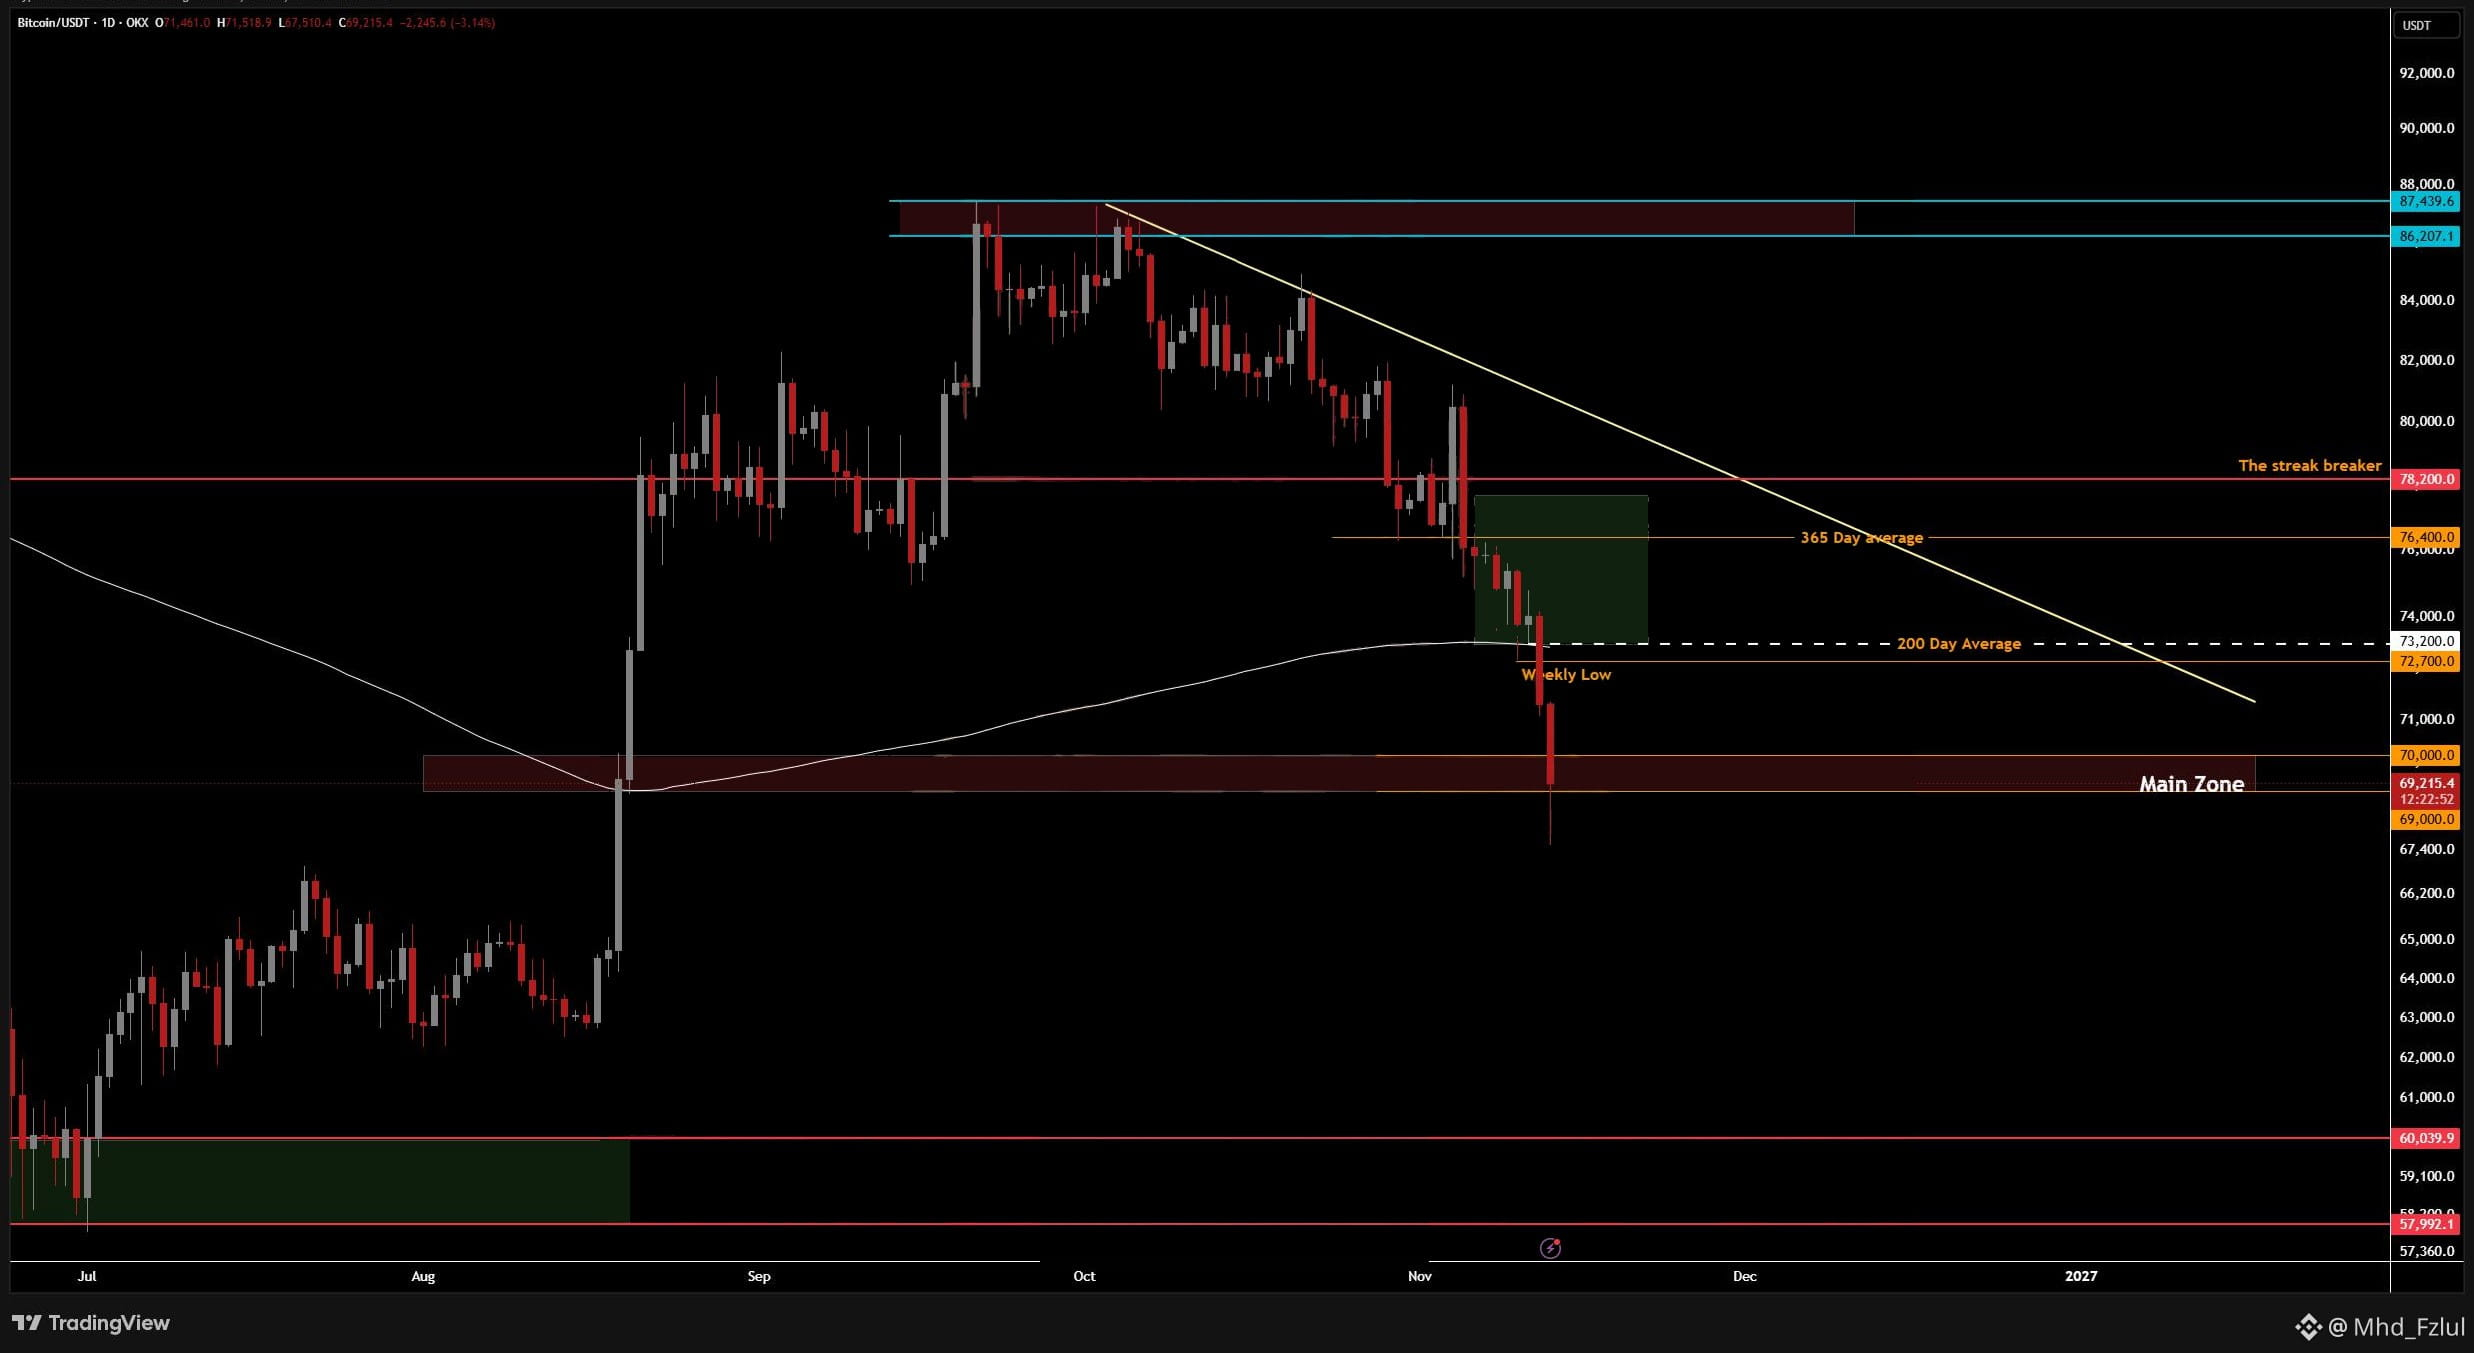
As long as this zone holds on daily. We’re good. MUST HOLD.
If not we go further down eventually
$BTC
{future}(BTCUSDT)
@Mhd_Fzlul #Mhd_Fzlul
#BTC
As long as this zone holds on daily. We’re good. MUST HOLD.
If not we go further down eventually
$BTC
@Mhd_Fzlul #Mhd_Fzlul
#BTC
If not we go further down eventually
$BTC
@Mhd_Fzlul #Mhd_Fzlul
#BTC
Mhd_Fzlul
·
--
BullishI was right about the bigger picture since September. 🎯
But I got too focused on the lower timeframes (LTF) and lost sight of what the higher timeframes (HTF) were telling me all along.
$BTC
@Mhd_Fzlul #Mhd_Fzlul
#BTC #WhatWillDriveCryptoandStocks’NextRebound?
But I got too focused on the lower timeframes (LTF) and lost sight of what the higher timeframes (HTF) were telling me all along.
$BTC
@Mhd_Fzlul #Mhd_Fzlul
#BTC #WhatWillDriveCryptoandStocks’NextRebound?
1
137
·
--
Bullish
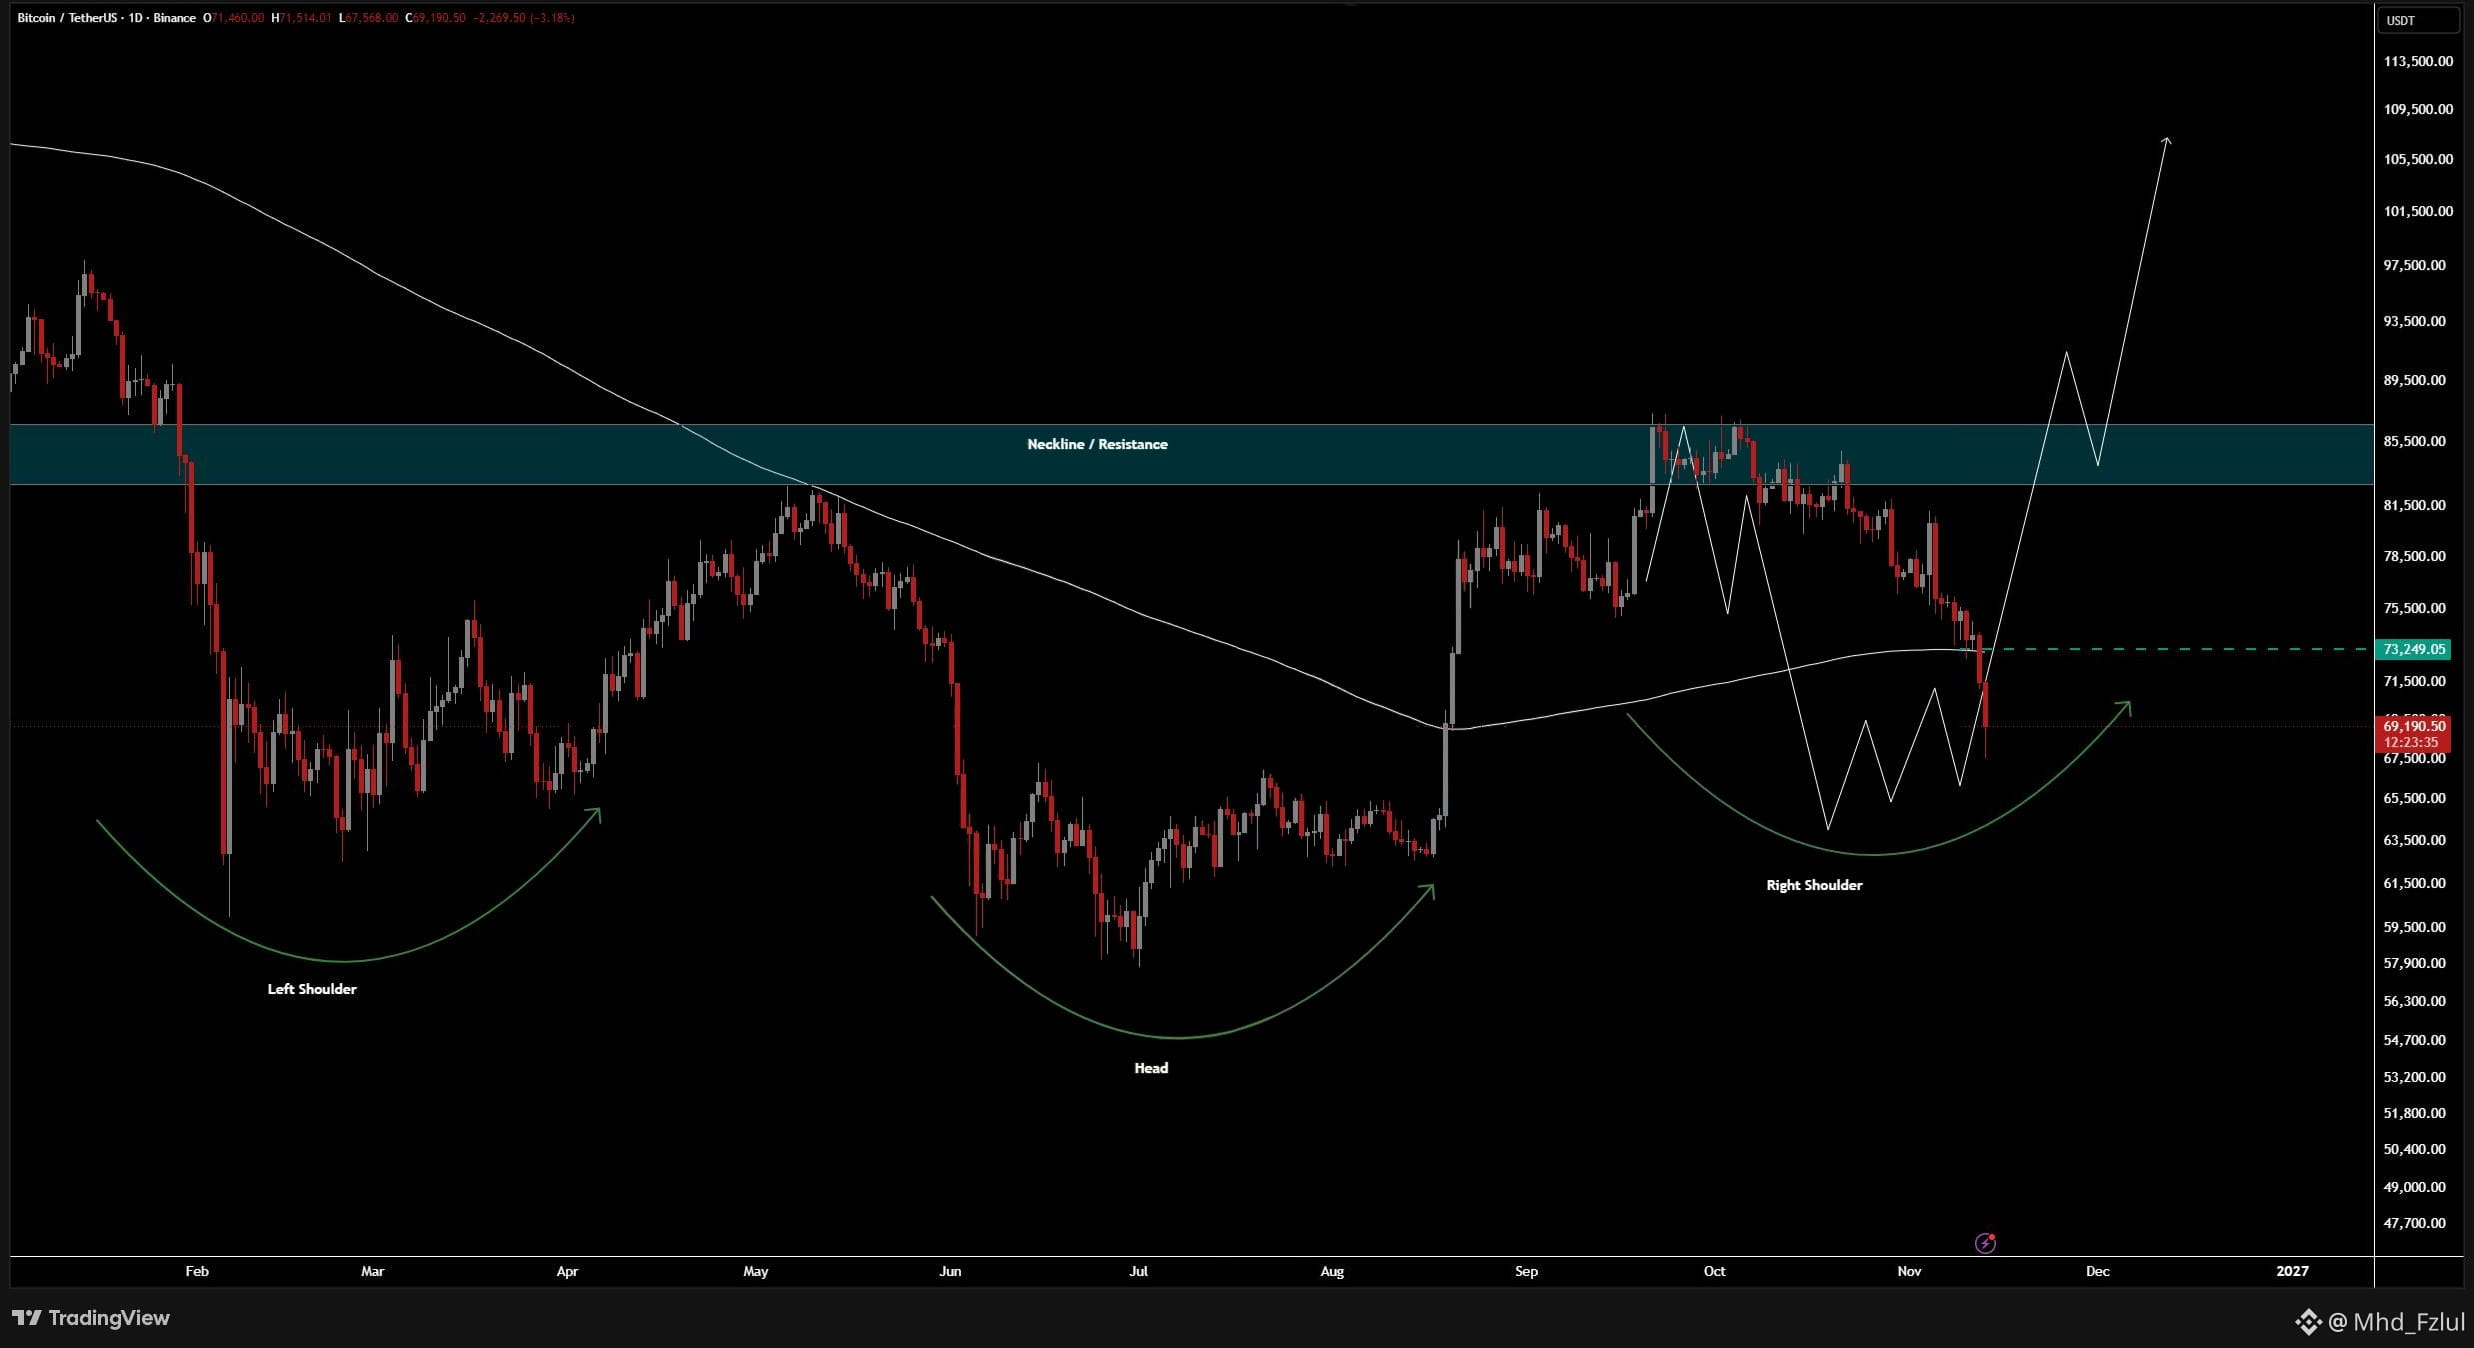
I was right about the bigger picture since September. 🎯
But I got too focused on the lower timeframes (LTF) and lost sight of what the higher timeframes (HTF) were telling me all along.
$BTC
{future}(BTCUSDT)
@Mhd_Fzlul #Mhd_Fzlul
#BTC #WhatWillDriveCryptoandStocks’NextRebound?
I was right about the bigger picture since September. 🎯
But I got too focused on the lower timeframes (LTF) and lost sight of what the higher timeframes (HTF) were telling me all along.
$BTC
@Mhd_Fzlul #Mhd_Fzlul
#BTC #WhatWillDriveCryptoandStocks’NextRebound?
But I got too focused on the lower timeframes (LTF) and lost sight of what the higher timeframes (HTF) were telling me all along.
$BTC
@Mhd_Fzlul #Mhd_Fzlul
#BTC #WhatWillDriveCryptoandStocks’NextRebound?
Mhd_Fzlul
·
--
BullishIf anything we still have our $BTC back up plan right? 😁
@Mhd_Fzlul #Mhd_Fzlul
#BTC
#JobsReportRaisesHikeOdds
@Mhd_Fzlul #Mhd_Fzlul
#BTC
#JobsReportRaisesHikeOdds
2
1
146
·
--
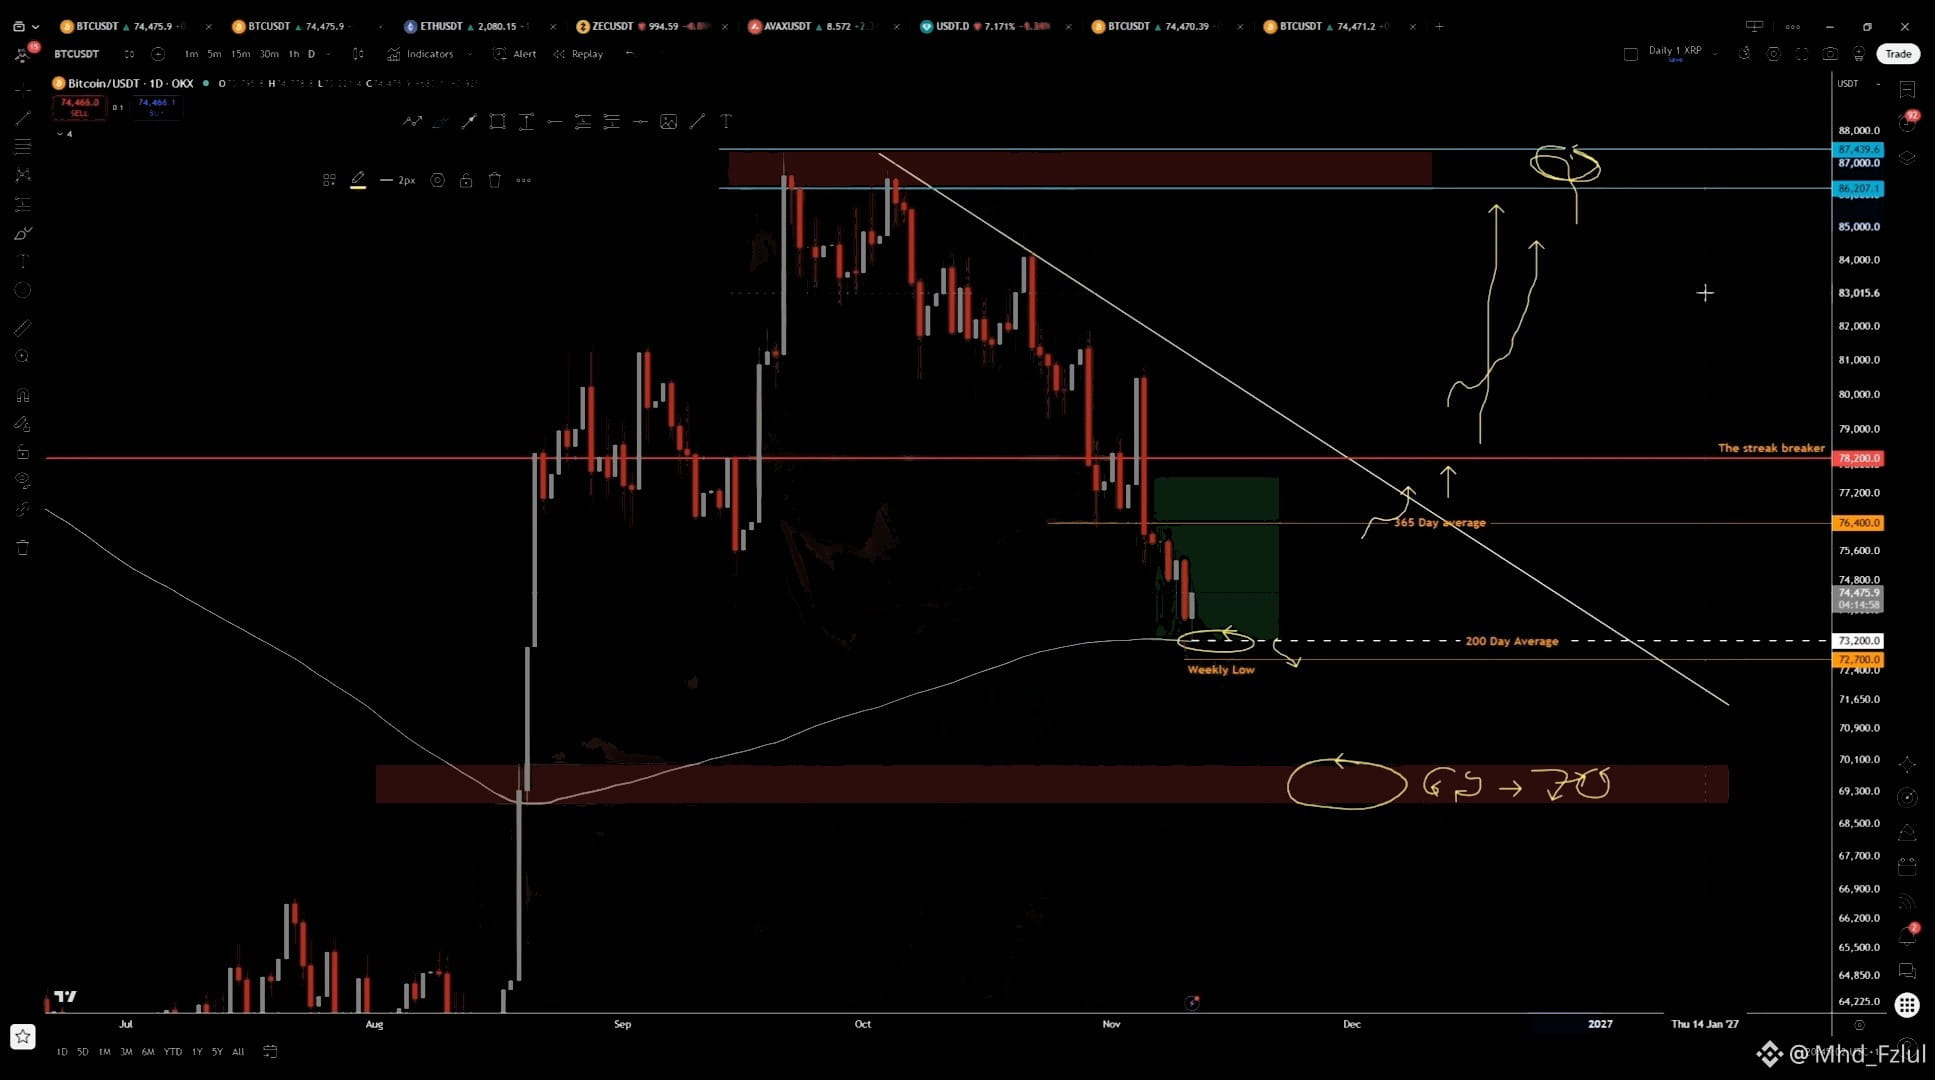
$BTC Market Analysis – 12 November 2026
Overall sentiment: Bearish, but a potential bottom is forming.
1. Technical Analysis (BTCUSDT – 1D)
* Current price: Around $74,475.
* Major support: $72,700 – 200-day moving average.
* Next support: $69,000–$70,000 demand zone.
* Resistance 1: $76,400.
* Resistance 2: $78,200.
* Major resistance: $86,200–$87,400.
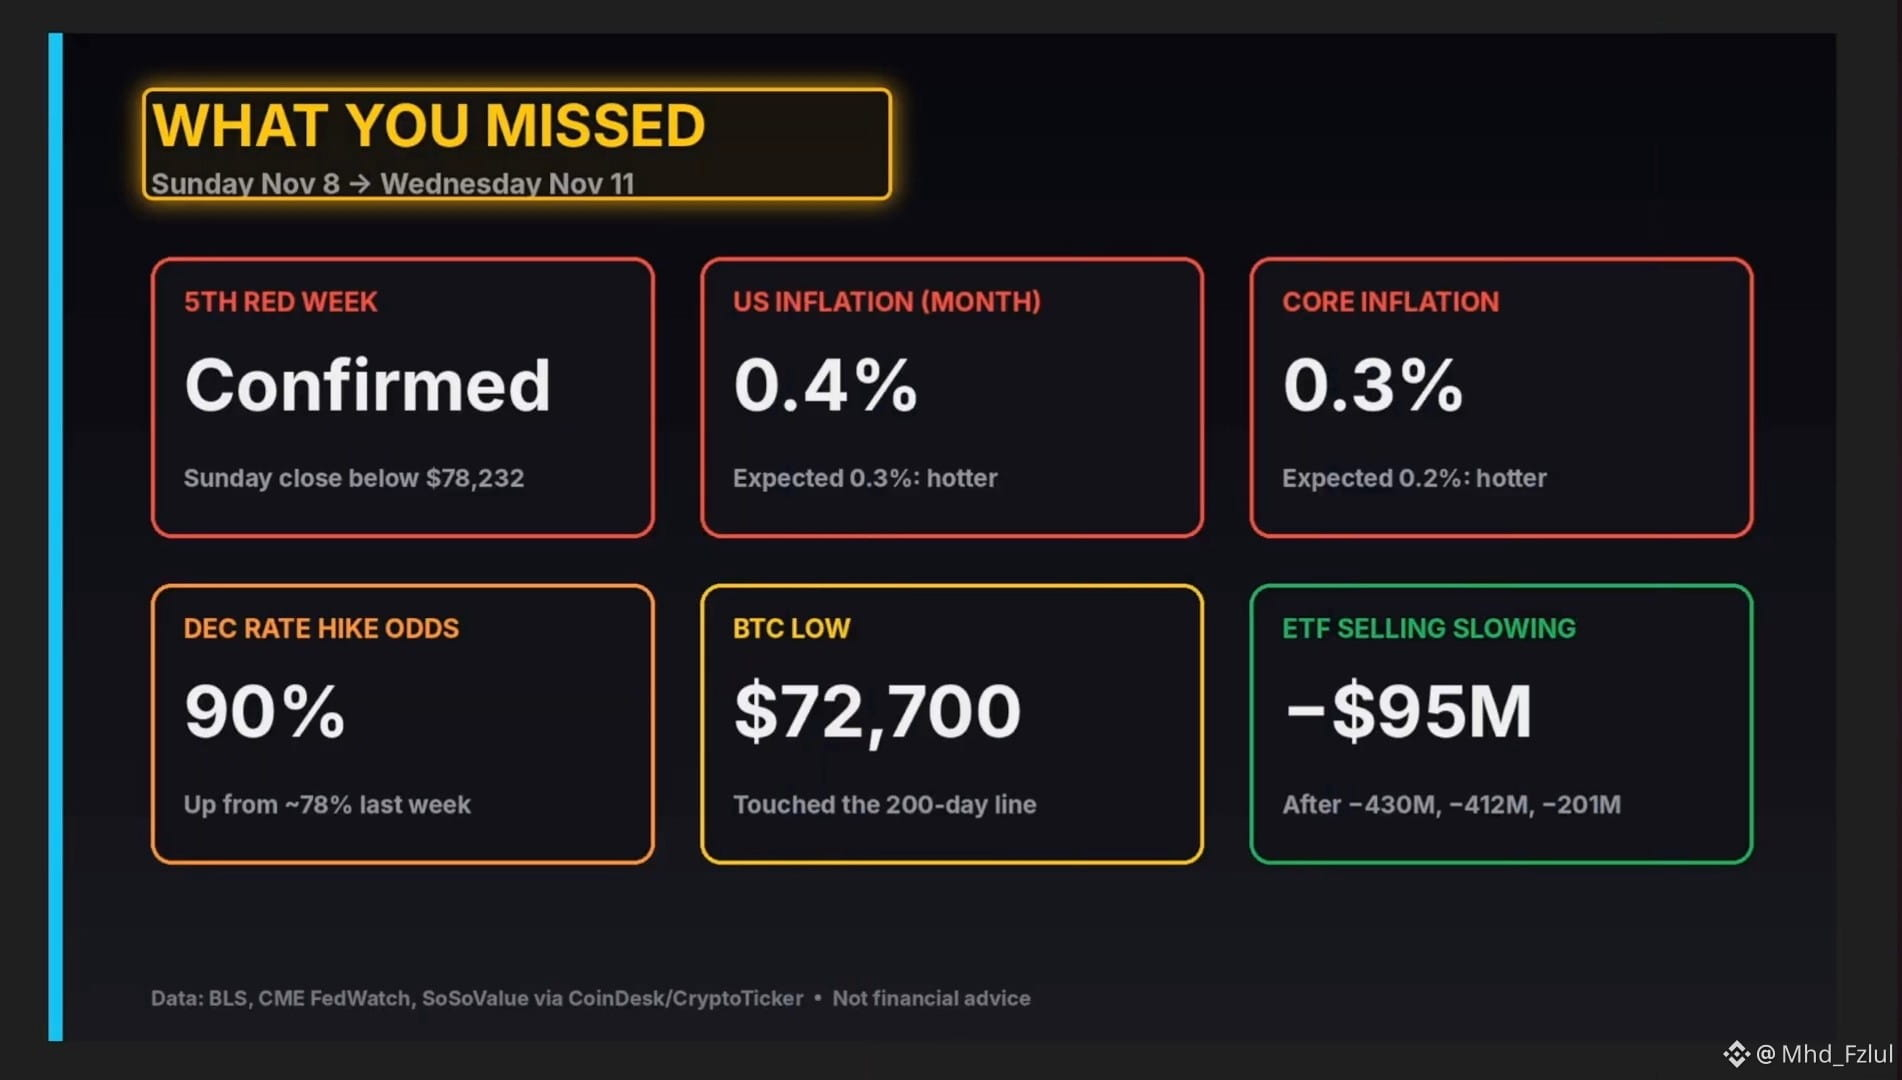
BTC is trading below a descending trendline, showing continued selling pressure. The $72,700 level is important because it aligns with the 200-day moving average.
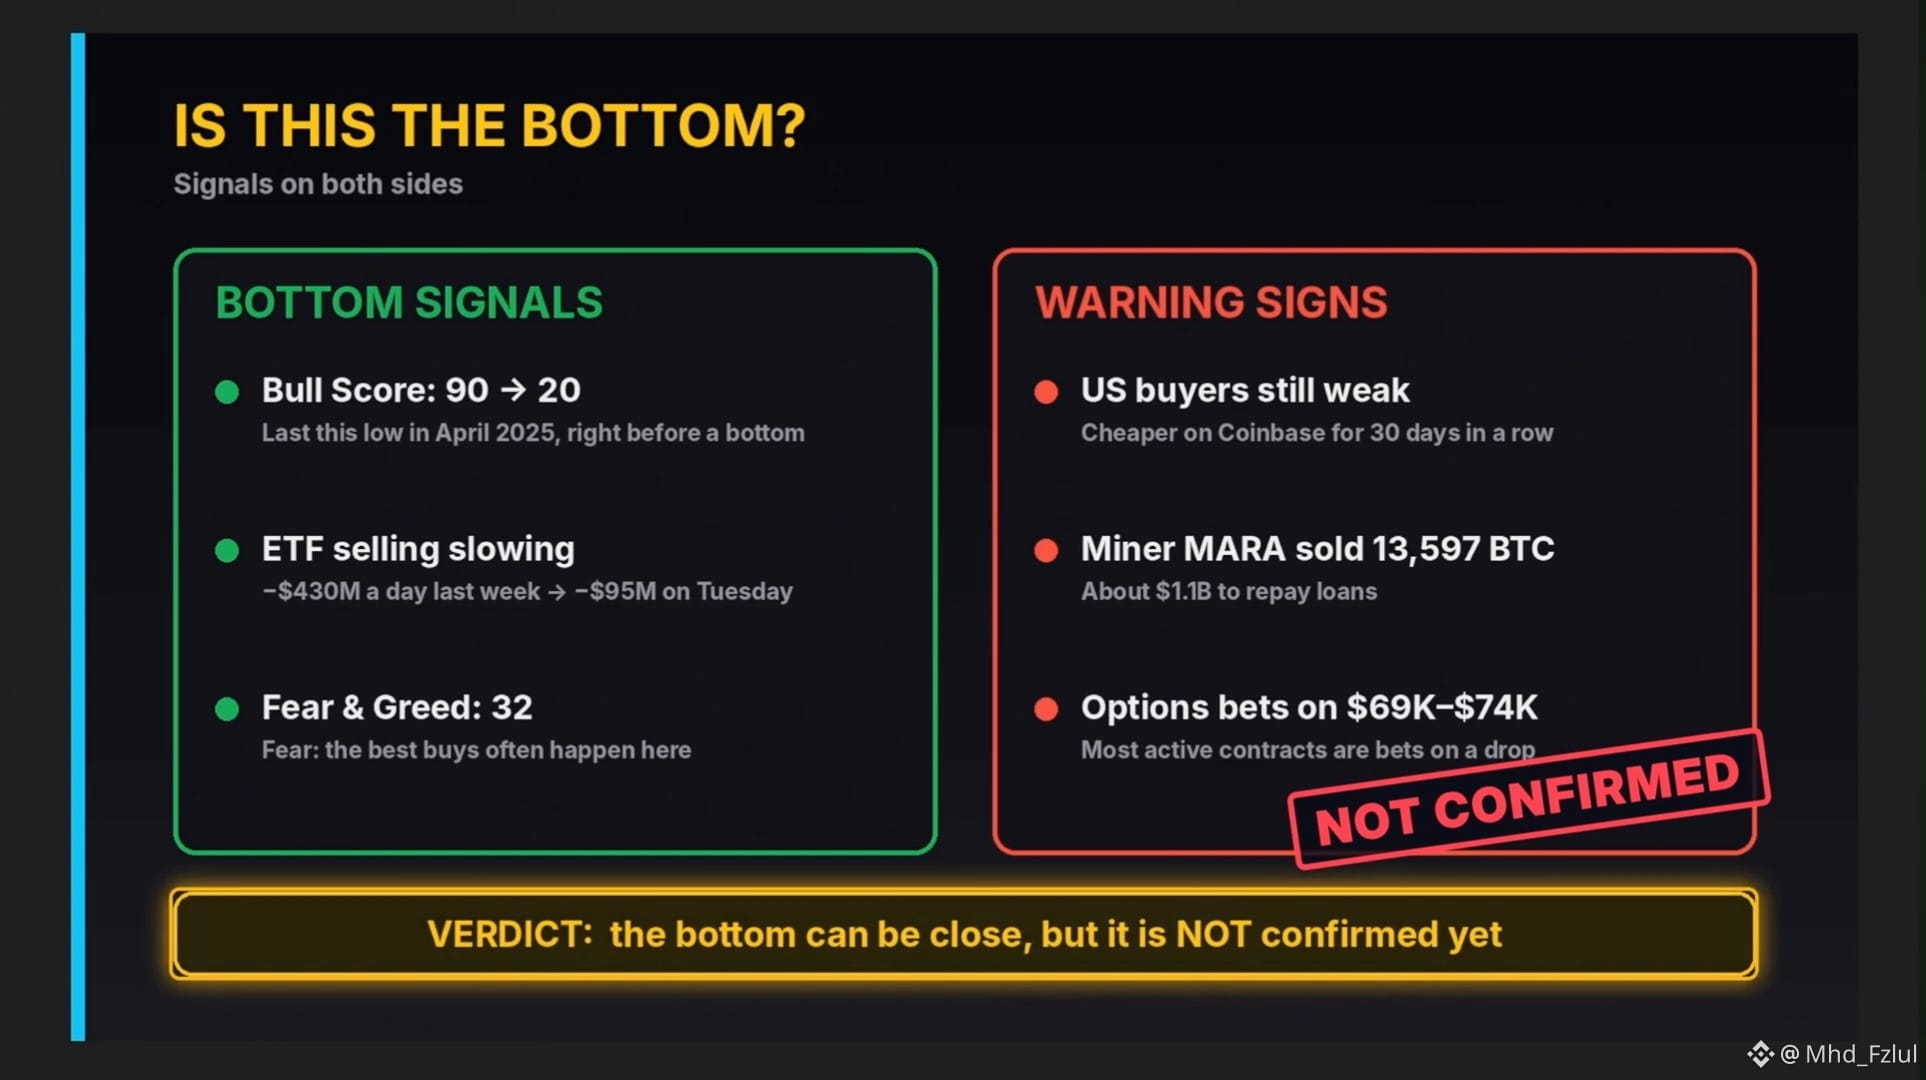
2. #BullishSignal 🟢
* Bull Score dropped from 90 to 20, indicating deeply weak market sentiment.
* ETF selling has slowed from $430M to $95M.
* Fear & Greed Index is at 32 (Fear).
* BTC has tested the 200-day moving average.
These signals suggest selling pressure may be weakening.
3. #bearishsignal 🔴
* US buyers remain weak.
* MARA reportedly sold 13,597 BTC.
* Options market shows bearish positioning around $69K–$74K.
* US inflation came in hotter than expected.
* December rate-hike expectations increased to 90%.
These factors could create further downside pressure.
4. Possible Market Scenarios
Bullish scenario
Recovery
If BTC holds $72,700 and reclaims $76,400 and $78,200, a recovery towards higher resistance levels becomes possible.
Bearish scenario
Further downside
If BTC loses $72,700, the $69K–$70K demand zone could become the next area to watch.
● Final Verdict
BTC is showing early potential bottom signals, but the overall trend remains bearish. The $72,700 support is a key level to monitor.
A market bottom is not confirmed yet. We need stronger buying pressure, a trendline breakout, and a daily close above $78,200 to improve the bullish outlook.
Note: This analysis is based on the charts and figures provided. The reported economic and market figures have not been independently verified. Not financial advice.
{future}(BTCUSDT)
@Mhd_Fzlul #Mhd_Fzlul
#BTC
#AnthropicRejectsIPODelayValuationinQuestion
$BTC Market Analysis – 12 November 2026
Overall sentiment: Bearish, but a potential bottom is forming.
1. Technical Analysis (BTCUSDT – 1D)
* Current price: Around $74,475.
* Major support: $72,700 – 200-day moving average.
* Next support: $69,000–$70,000 demand zone.
* Resistance 1: $76,400.
* Resistance 2: $78,200.
* Major resistance: $86,200–$87,400.
BTC is trading below a descending trendline, showing continued selling pressure. The $72,700 level is important because it aligns with the 200-day moving average.
2. #BullishSignal 🟢
* Bull Score dropped from 90 to 20, indicating deeply weak market sentiment.
* ETF selling has slowed from $430M to $95M.
* Fear & Greed Index is at 32 (Fear).
* BTC has tested the 200-day moving average.
These signals suggest selling pressure may be weakening.
3. #bearishsignal 🔴
* US buyers remain weak.
* MARA reportedly sold 13,597 BTC.
* Options market shows bearish positioning around $69K–$74K.
* US inflation came in hotter than expected.
* December rate-hike expectations increased to 90%.
These factors could create further downside pressure.
4. Possible Market Scenarios
Bullish scenario
Recovery
If BTC holds $72,700 and reclaims $76,400 and $78,200, a recovery towards higher resistance levels becomes possible.
Bearish scenario
Further downside
If BTC loses $72,700, the $69K–$70K demand zone could become the next area to watch.
● Final Verdict
BTC is showing early potential bottom signals, but the overall trend remains bearish. The $72,700 support is a key level to monitor.
A market bottom is not confirmed yet. We need stronger buying pressure, a trendline breakout, and a daily close above $78,200 to improve the bullish outlook.
Note: This analysis is based on the charts and figures provided. The reported economic and market figures have not been independently verified. Not financial advice.
@Mhd_Fzlul #Mhd_Fzlul
#BTC
#AnthropicRejectsIPODelayValuationinQuestion
Overall sentiment: Bearish, but a potential bottom is forming.
1. Technical Analysis (BTCUSDT – 1D)
* Current price: Around $74,475.
* Major support: $72,700 – 200-day moving average.
* Next support: $69,000–$70,000 demand zone.
* Resistance 1: $76,400.
* Resistance 2: $78,200.
* Major resistance: $86,200–$87,400.
BTC is trading below a descending trendline, showing continued selling pressure. The $72,700 level is important because it aligns with the 200-day moving average.
2. #BullishSignal 🟢
* Bull Score dropped from 90 to 20, indicating deeply weak market sentiment.
* ETF selling has slowed from $430M to $95M.
* Fear & Greed Index is at 32 (Fear).
* BTC has tested the 200-day moving average.
These signals suggest selling pressure may be weakening.
3. #bearishsignal 🔴
* US buyers remain weak.
* MARA reportedly sold 13,597 BTC.
* Options market shows bearish positioning around $69K–$74K.
* US inflation came in hotter than expected.
* December rate-hike expectations increased to 90%.
These factors could create further downside pressure.
4. Possible Market Scenarios
Bullish scenario
Recovery
If BTC holds $72,700 and reclaims $76,400 and $78,200, a recovery towards higher resistance levels becomes possible.
Bearish scenario
Further downside
If BTC loses $72,700, the $69K–$70K demand zone could become the next area to watch.
● Final Verdict
BTC is showing early potential bottom signals, but the overall trend remains bearish. The $72,700 support is a key level to monitor.
A market bottom is not confirmed yet. We need stronger buying pressure, a trendline breakout, and a daily close above $78,200 to improve the bullish outlook.
Note: This analysis is based on the charts and figures provided. The reported economic and market figures have not been independently verified. Not financial advice.
@Mhd_Fzlul #Mhd_Fzlul
#BTC
#AnthropicRejectsIPODelayValuationinQuestion
1
198
Log in to explore more content
Join global crypto users on Binance Square
⚡️ Get latest and useful information about crypto.
💬 Trusted by the world’s largest crypto exchange.
👍 Discover real insights from verified creators.
Email / Phone number
Trending Topics
IsAnthropic’s$1.5TMarketCapJustified?
7,224 views
64 Discussing
Anthropic Set to Open at $105 in Record Nasdaq Debut
Binance News
·10 Likes
·9k views
BTCRemainsUnderPressureAfterHawkishFOMCMinutes
205,547 views
1,972 Discussing
NvidiaBoardReportedlySplitOverHuang’sReturn
100,001 views
1,058 Discussing