
$BTC Market Analysis – 12 November 2026
Overall sentiment: Bearish, but a potential bottom is forming.
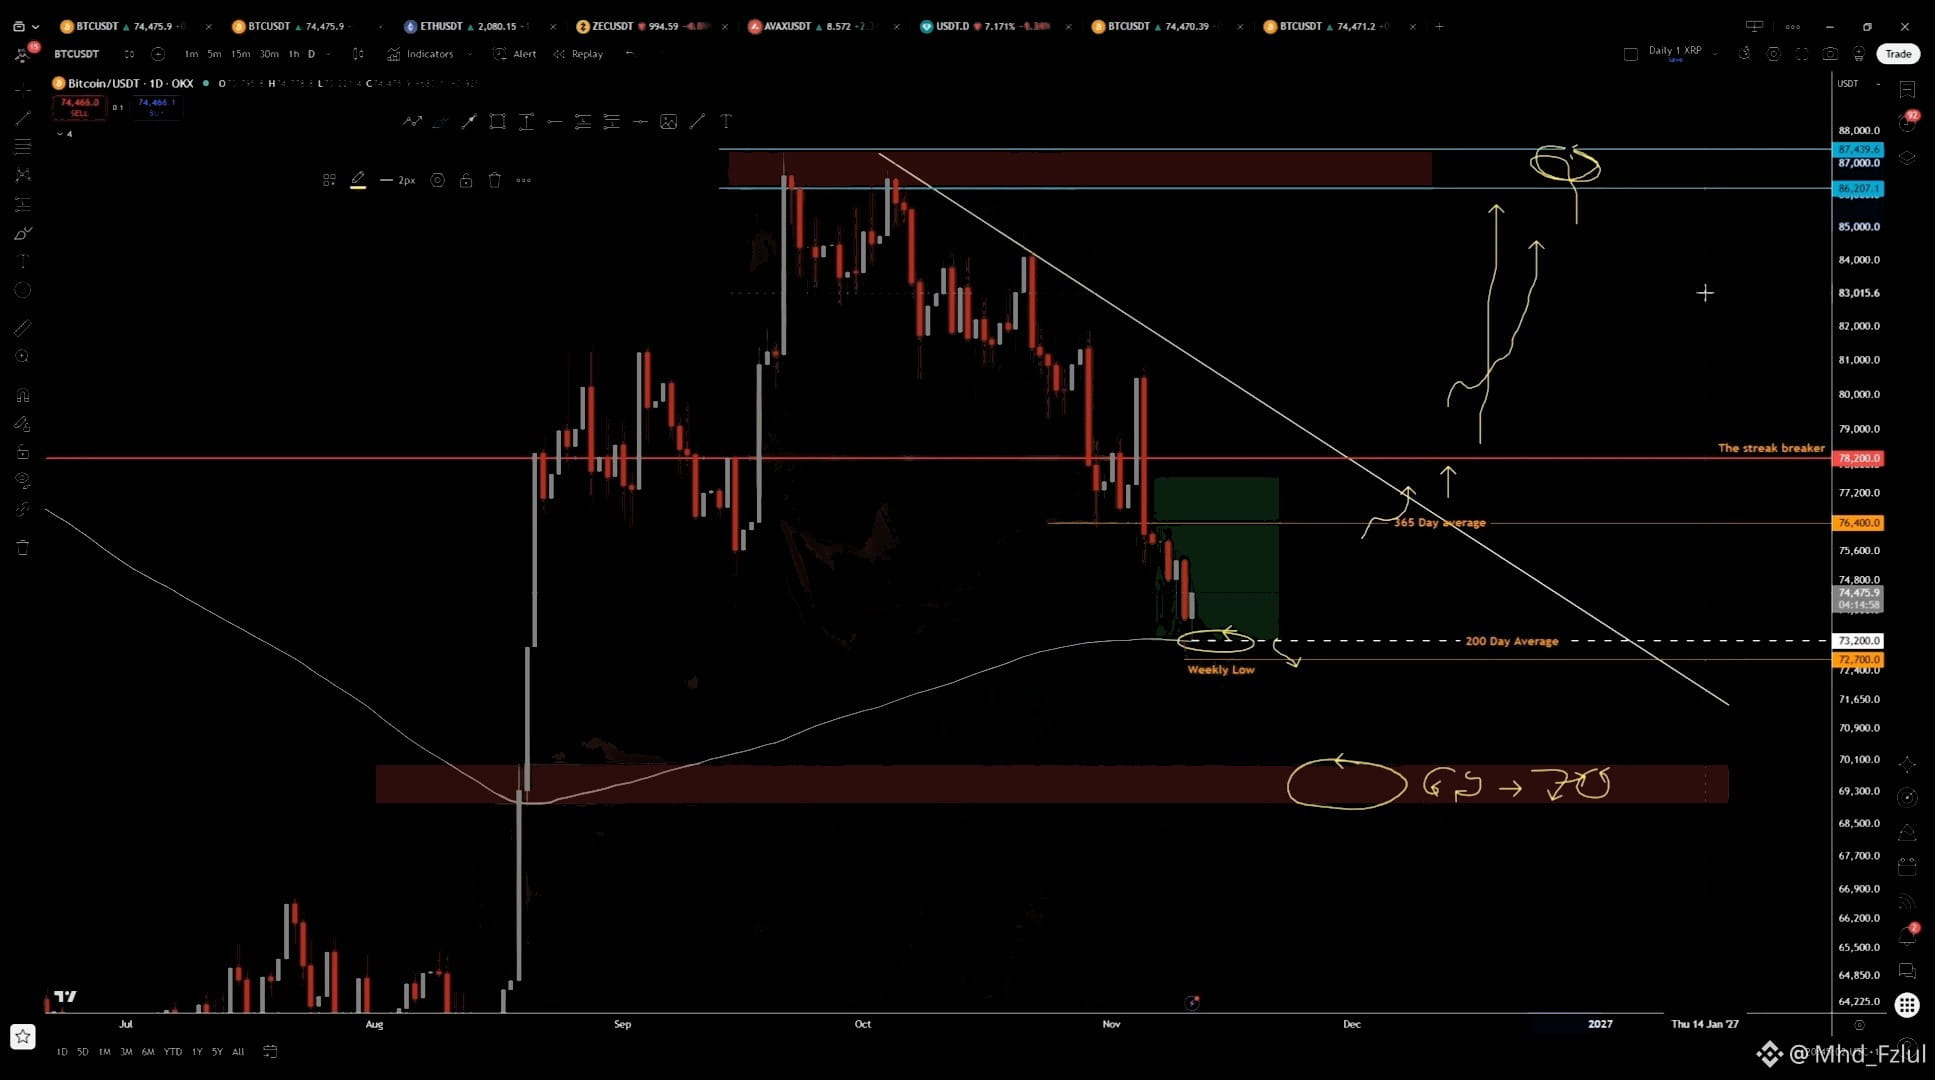
1. Technical Analysis (BTCUSDT – 1D)
* Current price: Around $74,475.
* Major support: $72,700 – 200-day moving average.
* Next support: $69,000–$70,000 demand zone.
* Resistance 1: $76,400.
* Resistance 2: $78,200.
* Major resistance: $86,200–$87,400.
BTC is trading below a descending trendline, showing continued selling pressure. The $72,700 level is important because it aligns with the 200-day moving average.
2. #BullishSignal 🟢
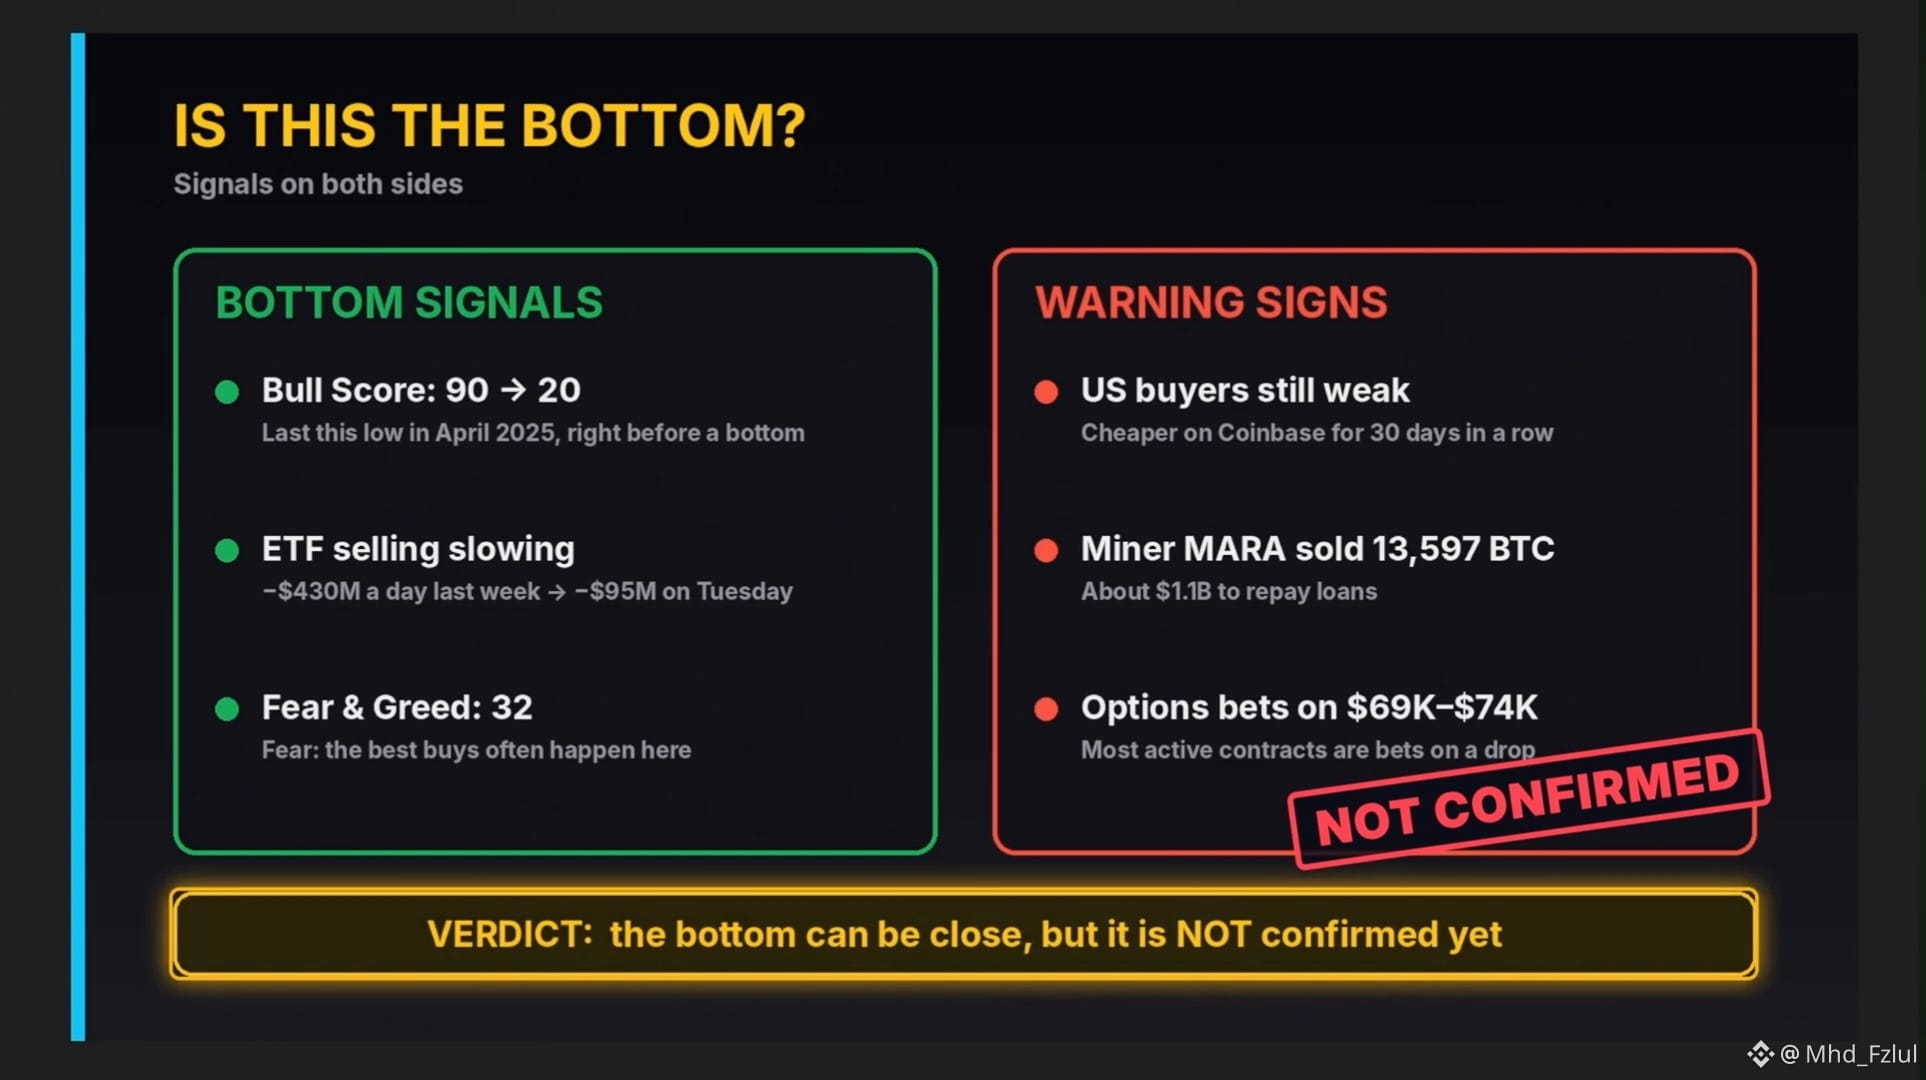
* Bull Score dropped from 90 to 20, indicating deeply weak market sentiment.
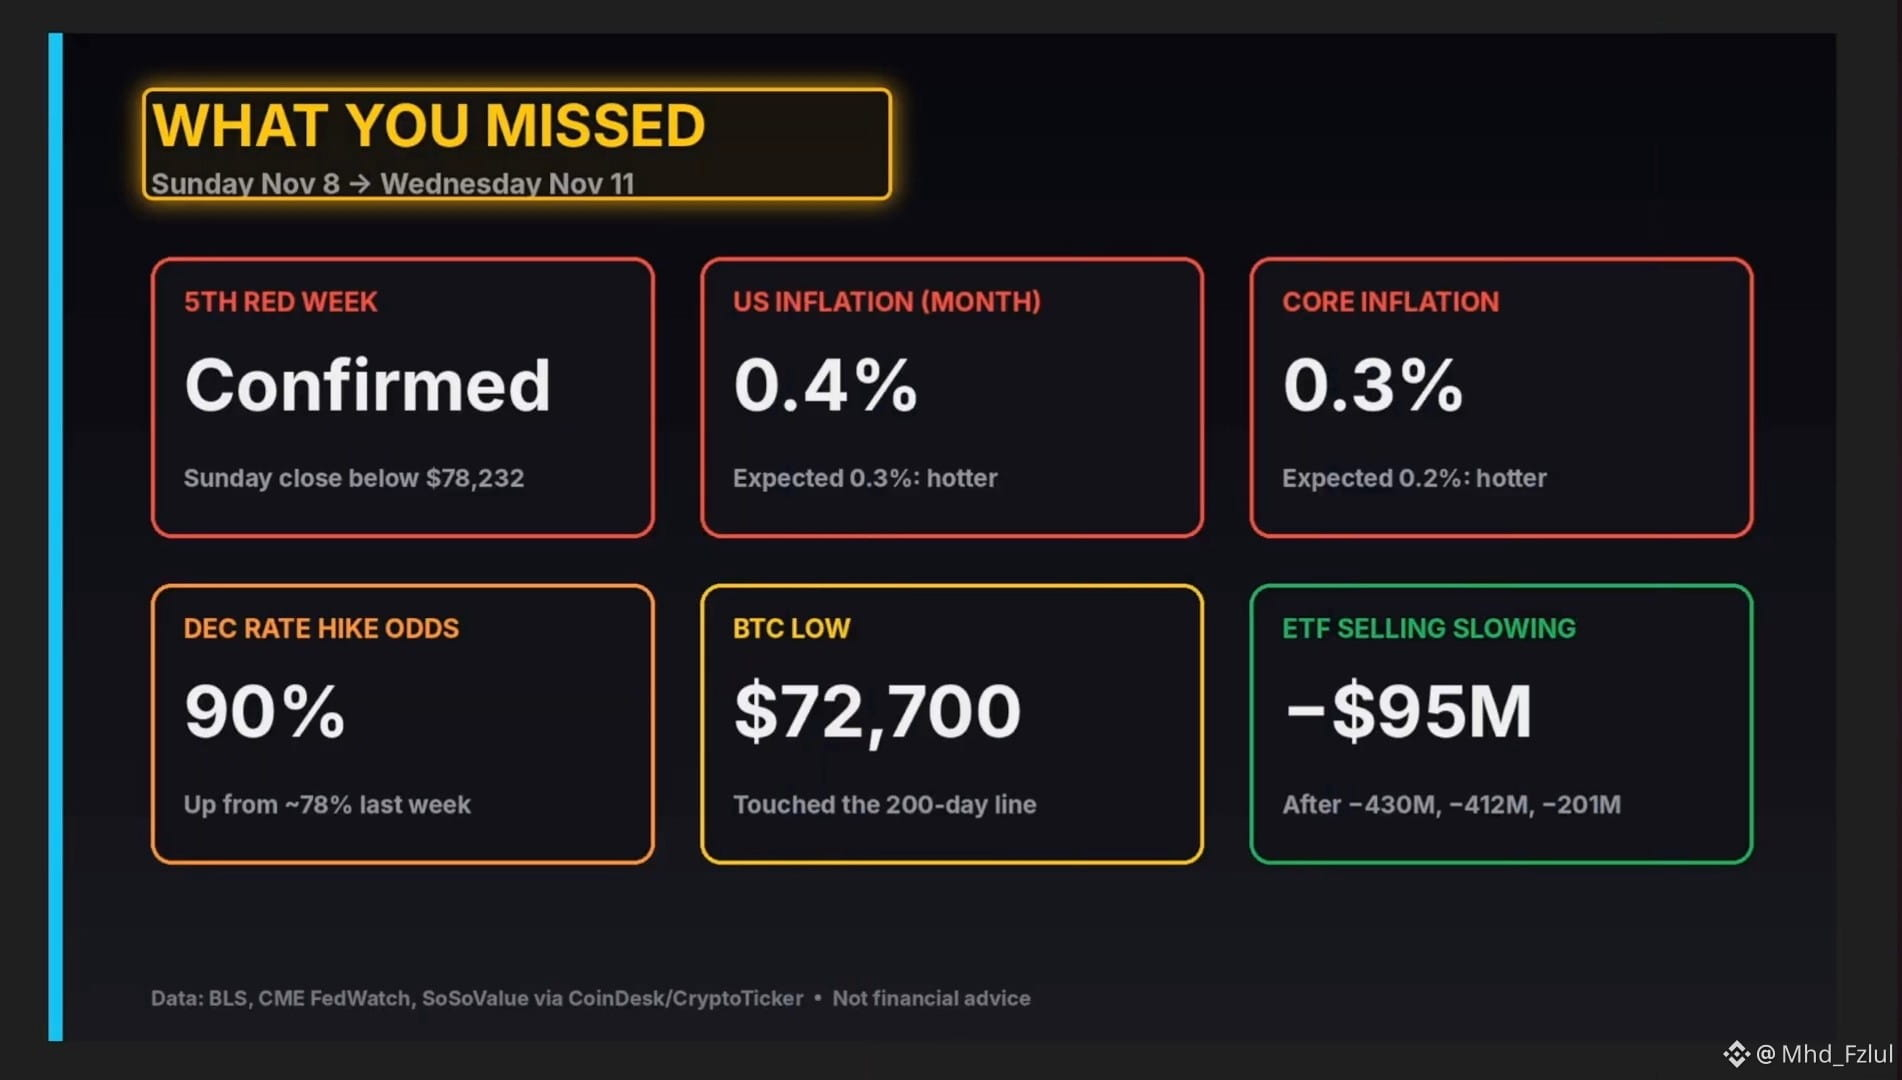
* ETF selling has slowed from $430M to $95M.
* Fear & Greed Index is at 32 (Fear).
* BTC has tested the 200-day moving average.
These signals suggest selling pressure may be weakening.
3. #bearishsignal 🔴
* US buyers remain weak.
* MARA reportedly sold 13,597 BTC.
* Options market shows bearish positioning around $69K–$74K.
* US inflation came in hotter than expected.
* December rate-hike expectations increased to 90%.
These factors could create further downside pressure.
4. Possible Market Scenarios
Bullish scenario
Recovery
If BTC holds $72,700 and reclaims $76,400 and $78,200, a recovery towards higher resistance levels becomes possible.
Bearish scenario
Further downside
If BTC loses $72,700, the $69K–$70K demand zone could become the next area to watch.
● Final Verdict
BTC is showing early potential bottom signals, but the overall trend remains bearish. The $72,700 support is a key level to monitor.
A market bottom is not confirmed yet. We need stronger buying pressure, a trendline breakout, and a daily close above $78,200 to improve the bullish outlook.
Note: This analysis is based on the charts and figures provided. The reported economic and market figures have not been independently verified. Not financial advice.
@Mhd_Fzlul #Mhd_Fzlul
#BTC
#AnthropicRejectsIPODelayValuationinQuestion
Overall sentiment: Bearish, but a potential bottom is forming.
1. Technical Analysis (BTCUSDT – 1D)
* Current price: Around $74,475.
* Major support: $72,700 – 200-day moving average.
* Next support: $69,000–$70,000 demand zone.
* Resistance 1: $76,400.
* Resistance 2: $78,200.
* Major resistance: $86,200–$87,400.
BTC is trading below a descending trendline, showing continued selling pressure. The $72,700 level is important because it aligns with the 200-day moving average.
2. #BullishSignal 🟢
* Bull Score dropped from 90 to 20, indicating deeply weak market sentiment.
* ETF selling has slowed from $430M to $95M.
* Fear & Greed Index is at 32 (Fear).
* BTC has tested the 200-day moving average.
These signals suggest selling pressure may be weakening.
3. #bearishsignal 🔴
* US buyers remain weak.
* MARA reportedly sold 13,597 BTC.
* Options market shows bearish positioning around $69K–$74K.
* US inflation came in hotter than expected.
* December rate-hike expectations increased to 90%.
These factors could create further downside pressure.
4. Possible Market Scenarios
Bullish scenario
Recovery
If BTC holds $72,700 and reclaims $76,400 and $78,200, a recovery towards higher resistance levels becomes possible.
Bearish scenario
Further downside
If BTC loses $72,700, the $69K–$70K demand zone could become the next area to watch.
● Final Verdict
BTC is showing early potential bottom signals, but the overall trend remains bearish. The $72,700 support is a key level to monitor.
A market bottom is not confirmed yet. We need stronger buying pressure, a trendline breakout, and a daily close above $78,200 to improve the bullish outlook.
Note: This analysis is based on the charts and figures provided. The reported economic and market figures have not been independently verified. Not financial advice.
@Mhd_Fzlul #Mhd_Fzlul
#BTC
#AnthropicRejectsIPODelayValuationinQuestion